Introduction
The etiopathogenesis of type 1 diabetes mellitus (T1DM) is not yet fully understood. The literature indicates the involvement of elements from the central nervous system (CNS) as well as adipose and bone tissues in addition to autoimmune mechanisms [1, 2]. Of the CNS, neuropeptide B (NPB) and neuropeptide W (NPW) are suspected to play a role in etiopathogenesis and/or outcome of T1DM [3, 4]. Both neuropeptides demonstrate expression in pancreatic β cells [4]. Furthermore, published results from in vivo studies suggest that NPW exerts a potent suppressive effect on blood leptin concentrations, showing its direct involvement in regulation of energy homeostasis [3, 4]. Of adipose tissue, certain adipokines, such as leptin and adiponectin, have been shown to play a role in the regulation of carbohydrate metabolism and via those mechanisms potentially contribute to the outcomes of T1DM [5, 6]. Leptin has been shown to affect insulin secretion via ATP-sensitive potassium channels in pancreatic β cells through AMP-activated protein kinase (AMPL) and cAMP-dependent protein kinase (PK), as well as depolarization of F-actin [7]. It has also been demonstrated in an in vivo model of leptin receptor knockout mice that the glucose-dependent insulin secretion is partially normalized, though only in young female animals [8]. Furthermore, it has been previously shown that leptin has a significant effect on the stimulation of proinflammatory cytokines production in T1DM [9]. Adiponectin, on the other hand, is a protein that affects the central control of appetite, the regulation of the body’s energy, and glucose and lipid metabolism. This peptide has been previously shown to increase the activity of AMP-activated kinase (AMPK) through two independent pathways involving liver kinase B1 (LKB1) and Ca2+/calmodulin-dependent protein kinase (CaMKK), which via AMPK suppression of acetyl CoA carboxylase (ACC) have a lowering effect on malonyl-CoA production, thereby increasing the oxidation of long chain fatty acids and circumventing insulin-mediated lipid synthesis [10]. Increased adiponectin levels have been reported in weight-loss-related diseases [11]. Moreover, published results indicate that adiponectin influences insulin sensitivity in T1DM [12]. Therefore it could be hypothesized that deregulation of the circulatory level of both leptin and adiponectin could cause insulin resistance in patients with T1DM [8, 12]. Another mechanism that may be associated with etiopathogenesis (and/or outcomes) of T1DM concerns interactions between osteo-metabolites and insulin. It is acknowledged that insulin promotes osteocalcin activation in the feedback loop, which in turn drives the synthesis and secretion of insulin [13], while the remodeling of the skeleton closely depends on insulin, amongst other endocrine factors, including those secreted by adipocytes discussed above. To elaborate, it has been shown that osteocalcin stimulates insulin release and proliferation of pancreatic β cells in laboratory animals, with a concomitant increase of peripheral blood glucose uptake, as well as an increase of the breakdown of adipose tissue [14]. On the other hand, it has been observed that the level of osteocalcin in the blood is decreased in starvation [15], while intraperitoneal administration of osteocalcin in vivo increases energy expenditure, improves glucose tolerance, and regulates insulin sensitivity without affecting the activity of the animals [16]. Moreover, rodents with a deactivated gene for osteocalcin are characterized by a carbohydrate metabolism disorder, while similar health problems have been reported in men who carry heterozygous mutations in the transmembrane domain of the osteocalcin receptor (GPRC6A) [17]. Furthermore, soluble receptor activator for nuclear factor-κB ligand (sRANKL), which has mainly been studied in relation to bone metabolism balance [18] has been recently indicated in pathogenesis of T1DM [19, 20]. Additionally, it has been shown in in vivo models that turning off the gene encoding RANKL impairs T lymphocyte differentiation, which could potentially be related to pathogenesis of T1DM. Recent blood concentration studies of the total soluble RANKL pool have shown that it is a predictor of ossification disorders in T1DM pediatric and adult patients [21]. To our knowledge, however, there are no published data on the association between the free form of sRANKL with carbohydrate balance in patients with this disease.
Another mechanism that has been implicated in pathogenesis of T1DM relates to previously reported disorders of oxidative-reduction balance [22]. It has been shown in vitro that oxidative stress leads to a change in activity of the adenosine-5’-triphosphate channel, and thus of the function of pancreatic β cells [23]. However, the oxidative-reduction balance has not been fully explored yet in T1DM pediatric patients, although total antioxidant status (TAS) has been previously proposed as a prognostic tool in patients with T1DM [22, 23].
Collectively, the literature indicates that the CNS, as well as adipose and bone tissue may play a role in the etiopathogenesis and/or outcomes of T1DM. Moreover, the above-presented results from in vitro studies and in vivo models indicate the specific peptides/proteins, i.e. NPB, NPW, leptin, adiponectin, osteocalcin, free sRANKL, and TAS, that collectively could serve as biomarkers of T1DM progression. However, to the best of our knowledge, there are no clinical results available on the above-listed peptides/proteins and other factors in pediatric patients presenting T1DM. Therefore the aim of this study was to assess the levels NPB, NPW, leptin, adiponectin, osteocalcin, free sRANKL, and TAS in pediatric patients presenting T1DM and to evaluate the relationship between assessed levels of NPB, NPW in serum, nutritional and antioxidant status indices, and other listed factors from adipose and/or bone tissue in pediatric patients with T1DM. Additionally, we investigated the effects of two different types of insulin administration, i.e. either via insulin pens, or continuous subcutaneous insulin infusion devices, to assess whether pulsatile or continuous insulin supply reflects any changes to investigated regulatory pathways from the CNS, adipose tissue and bone. We hypothesize that pediatric T1DM patients will show altered serum levels of NPB and NPW, leptin, adiponectin, osteocalcin, free sRANKL, and TAS and that those parameters will exhibit associations indicative of the interplay between the CNS, adipose and bone-derived mechanisms in T1DM. Furthermore, we hypothesize that the potential relationships between the levels of these parameters might be affected by the degree of glycemic control (inter alia connected with the method of insulin administration, i.e. pulsatile or continuous), and thus indicative of the effects of insulin delivery on the investigated crosstalk between neuropeptides, bone-derived molecules and adipokines.
Material and methods
This study was approved by the Local Bioethics Committee (KBET/128/B/2010, 1072.6120.25.2018) and was conducted in accordance with the WMA Declaration of Helsinki [24]. Written informed consent regarding participation/the right to withdraw from participation in the study was obtained from all study participants and/or their legal representatives prior to the study commencement.
Subjects
A group of 58 Caucasian subjects (age range 4–17 years), previously diagnosed (3.4 ±2.6 years) with T1DM, were included in the diabetic patient group (T1DM group). Additionally, 25 age-, gender- and puberty-matched healthy subjects were recruited as healthy controls (CONTR group). There were no differences regarding pubertal status (according to the Tanner scale) between T1DM and CONTR groups [25]. A total of 47 females and 36 males were examined. The diabetic patients (T1DM group) were treated with functional insulin therapy, either with human insulin (n = 16) or insulin analogs (n = 42), while the medications were administered via either insulin pens (n = 31) or continuous subcutaneous insulin infusion devices (insulin pumps; n = 27). None of the healthy subjects studied had any history of clinical or laboratory (e.g., fasting blood glucose, urea, and electrolytes, liver, and thyroid function tests) signs of diseases associated with dysfunction of the endocrine pancreas and were taking no prescribed medication.
Anthropometric measures and blood sampling
Anthropometric evaluation of each subject was carried between 7:30 and 8:30 and after an overnight rest and fasting (for a minimum of 12 h) and included: weight (kg; in light underwear and unshod, using a certified scale of 0.1 kg accuracy) and height (cm; using a stadiometer of 0.1 cm accuracy). Obtained data were further used to calculate a standard deviation score (SDS) for height, body mass index (BMI), BMI z-score, Cole index, and BMI-for-age percentile, with reference to the Polish charts for height, body weight, and BMI [26]. The anthropometric data are presented in Table I. Following the anthropometric evaluation, 5 ml of venous blood was collected from the elbow vein from each individual. One milliliter of fresh blood collected from the diabetic patients (T1DM group) was immediately analyzed for glycated hemoglobin (HbA1c). The remaining blood from the T1DM group, as well as the blood samples from the healthy subjects, were allowed to clot (at room temperature, 30 min) prior to centrifugation at 350 × g, and the obtained serum samples were stored at –80°C for further biochemical analyses.
Table I
Anthropometric and biochemical characteristics of individuals with type 1 diabetes mellitus (T1DM) and matched, control healthy subjects (CONTR)
[i] Parameters are shown as means ± standard deviations and medians (25% and 75% quartiles); T1DM – type 1 diabetes mellitus, CONTR – control group, n – number of individuals studied, p – level of statistical significance in Mann-Whitney test for nonparametric data or t-test for parametric data (possibly Welch’s ANOVA test for variance or χ2 test for qualitative data), SDS of height – standard deviation score of height, BMI – body mass index, BMI z-score – body mass index z-score, free sRANKL – free soluble receptor activator of nuclear factor-κB ligand, HbA1c [%] – % of glycated hemoglobin A1c, NS – difference not statistically significant.
Serum concentrations of the biomarkers listed below were determined using validated enzyme-linked immunosorbent assays, according to the manufacturers’ guidelines: Leptin, DiaSource ImmunoAssays (Louvain-la-Neuve, Belgium), intra- and interassay coefficients of variation (CVs) 4.1%, and 5.0%, respectively; adiponectin, DiaSource ImmunoAssays (Louvain-la-Neuve, Belgium), intra- and interassay CVs 2.9% and 3.8%, respectively; osteocalcin, DiaSource ImmunoAssays (Louvain-la-Neuve, Belgium), intra- and interassay CVs 4.2% and 5.7%, respectively; free sRANKL, Biomedica Medizinprodukte (Vienna, Austria), intra- and interassay CVs 3.1% and 3.8%, respectively; NPB, Shanghai Sunredbio (SRB) Technology Co., Ltd. (Shanghai, China), intra- and interassay CVs 4.9% and 5.5%, respectively; NPW (Shanghai Sunredbio (SRB) Technology Co., Ltd, Shanghai, China), intra- and interassay CVs 4.2% and 6.0%, respectively. Threshold values for leptin, adiponectin, osteocalcin, free sRANKL, NPW and NPB analyses were lower than or equal to 0.1 ng/ml, 0.09 ng/ml, 0.08 ng/ml, 0.16 pg/ml, 2.5 pg/ml and 5.0 pg/ml, respectively, in undiluted samples.
HbA1c level was determined by high-performance liquid chromatography (HPLC) using a Bio-Rad unit equipped with BioMatrix Clinical Data Management for data archiving. This assay allowed for the analysis of the stable HbA1c form without interference with hemoglobin F, carbonylated hemoglobin, or labile HbA1c [27]; the reference range for HbA1c was 4.6–6.3%.
The serum TAS, as a parameter of extracellular protection against pro-oxidant activity, was determined by Randox Total Antioxidant Status kits (Crumlin, UK). TAS analysis was based on the incubation of a patented molecule, 2,2-azino-di-(3-ethylbenzthiazoline sulfonate) (ABTS), with peroxidase (metmyoglobin) and hydrogen peroxide, which produced a radical cation ABTS+ with characteristic color (wavelength detection at 600 nm). Thresholds for TAS analyses in undiluted samples were set between 0.21 and 2.94 mmol/l [28].
Statistical analysis
The results were analyzed statistically, using elements of descriptive statistics and statistical procedures of correlation analysis of the variables (with the Spearman and Pearson tests), analysis for comparing medians for unrelated data (Mann-Whitney U test, Student’s t-test or Welch’s ANOVA test, post-hoc test – Dunn test for nonparametric data) and receiver operating characteristic (ROC) comparison of the areas under curves. Statistical analysis of the results was conducted using Statistica 12.5 (StatSoft, USA). The results are presented as mean ± standard deviations and medians (with upper and lower quartiles). The normality of the data distribution of small groups (less than 50 people) was assessed using the Shapiro-Wilk test, and for large groups using the Kolmogorov-Smirnov test. Analysis of the homogeneity of variance was carried out using the Levene test. The level of statistical significance was taken as p < 0.05. In the multiple testing, Bonferroni correction was used.
Results
Anthropometric and biochemical characteristics of individuals with T1DM and the control subjects (CONTR) are shown in Table I. The T1DM patients had lower body mass (25% lower; p < 0.05), BMI (25% lower; p < 0.004) and TAS (21% lower; p < 0.004) as compared with the CONTR group (Table I). In addition, the patients had higher levels of adiponectin (51% higher; p < 0.006). However, no differences (p > 0.05) were noted in serum osteocalcin and free sRANKL between T1DM patients and control subjects. The concentrations of NPB and NPW in the T1DM group were lower (33%, p < 0.013 and 34%, p < 0.008, respectively), than in the CONTR group (Table I).
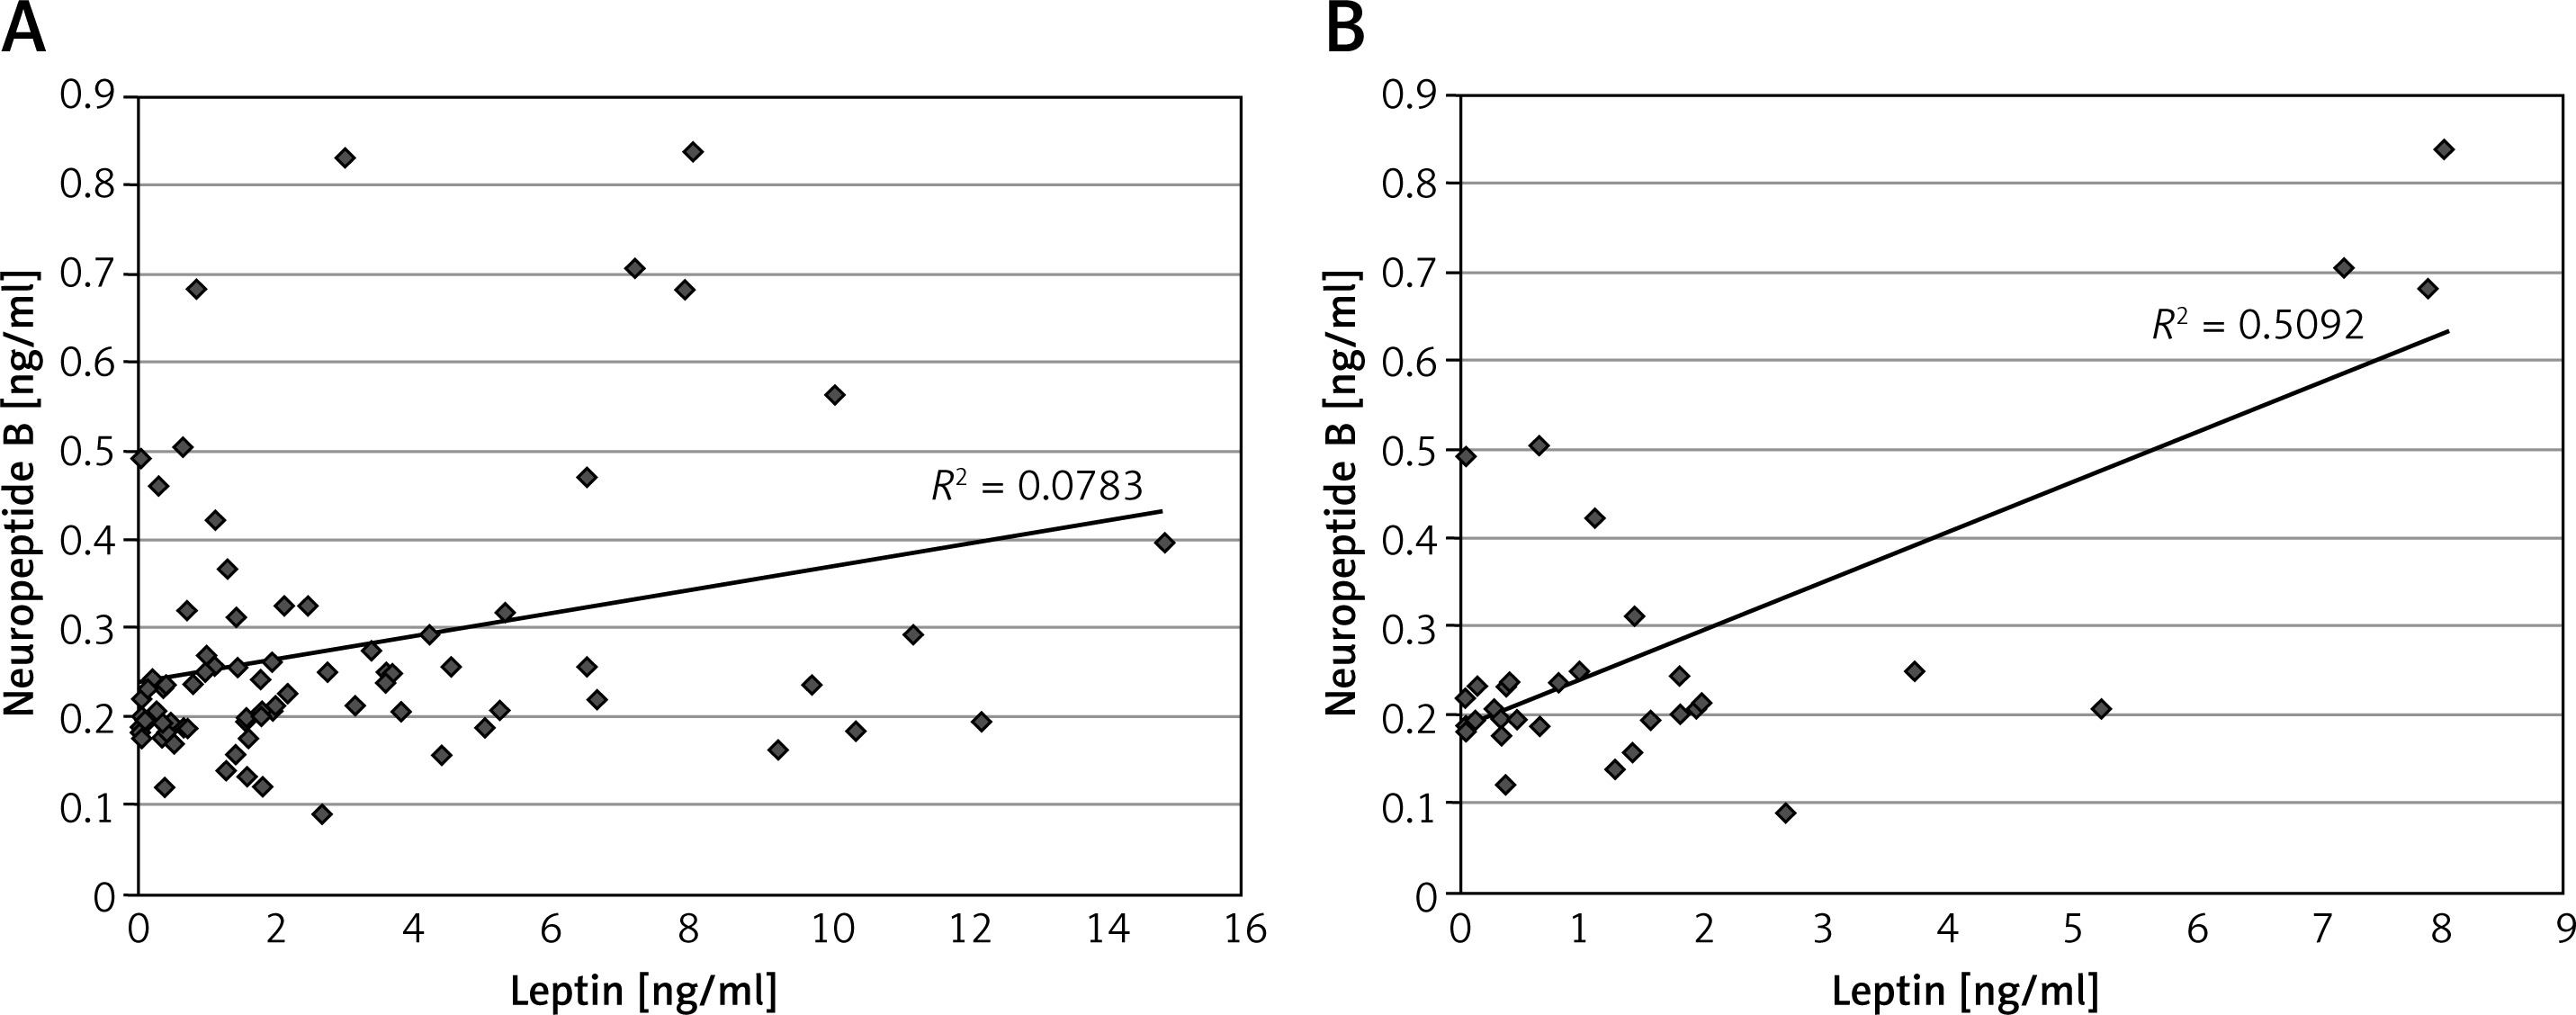
A positive correlation was found between NPB and leptin concentrations in the whole population (R = 0.27, n = 83, p < 0.016, Figure 1 A). Similarly, positive correlations were found between NPB and NPW levels in this group (R = 0.69, n = 83, p < 0.000001) and in the T1DM patients (R = 0.64, n = 58, p < 0.000001). Furthermore, a significant positive correlation was found between levels of NPB and NPW in both sub-groups of T1DM patients treated using insulin pens (R = 0.45; p < 0.02), and the insulin pumps (R = 0.79; p < 0.000001). A positive correlation was found between NPB and NPW in both gender groups, i.e. in the total female population (R = 0.71; p < 0.000001) and the total male population (R = 0.62; p < 0.000001). Furthermore, the male group showed a positive correlation between NPB and leptin (R = 0.33; p < 0.05, Figure 1 B).
Figure 1
Correlations between serum levels of neuropeptide B and leptin in the whole population (A) and in the male population (B)
In males with T1DM assessed levels of leptin and the BMI z-score were lower (p < 0.0008 and p < 0.018, respectively) and osteocalcin concentrations were higher (p < 0.018) than among the females with T1DM. The median (25%; 75% quartiles) HbA1c was 7.65% (6.90; 8.80%) in the T1DM group and level of this parameter (and also BMI z-score and leptin) showed 21% lower values in males with T1DM than in females with T1DM (Table II).
Table II
Anthropometric and biochemical characteristics of patients with type 1 diabetes mellitus (T1DM) by sex
[i] Parameters are shown as means ± standard deviations and medians (25% and 75% quartiles); T1DM – type 1 diabetes mellitus, n – number of individuals studied, p – level of statistical significance in Mann-Whitney test for nonparametric distributions or t-test for parametric data (possibly Welch’s ANOVA test for variance), SDS of height – standard deviation score of height, BMI – body mass index, BMI z-score – body mass index z-score, free sRANKL – free soluble receptor activator of nuclear factor-κB ligand, HbA1c [%] – % of glycated hemoglobin A1c [%], NS – difference not statistically significant.
In the T1DM group there was a positive correlation between osteocalcin and height (R = 0.37; p < 0.005), osteocalcin and body mass (R = 0.29; p < 0.03), osteocalcin and the Cole index (R = 0.27; p < 0.001), osteocalcin and BMI (R = 0.39; p < 0.002), osteocalcin and BMI z-score (R = 0.27; p < 0.05), osteocalcin and BMI-for-age percentile (R = 0.27; p < 0.04) and finally, a negative correlation between osteocalcin and leptin levels (R = –0.50; p < 0.0008, Table III).
Table III
Indices of correlation and levels of statistical significance between leptin and anthropometric, biochemical and antioxidant parameters in the type 1 diabetes mellitus (T1DM) group (n = 58), T1DM group treated using insulin pens (T1DM pen group, n = 31) and T1DM group treated using insulin pumps (T1DM pump group, n = 27)
[i] R – coefficient of Pearson or Spearman (for respectively parametric or non-parametric date distributions), p – level of statistical significance, free sRANKL – free soluble activator of nuclear factor-κB ligand, HbA1c [%] – % of glycated hemoglobin A1c, NS – difference not statistically significant.
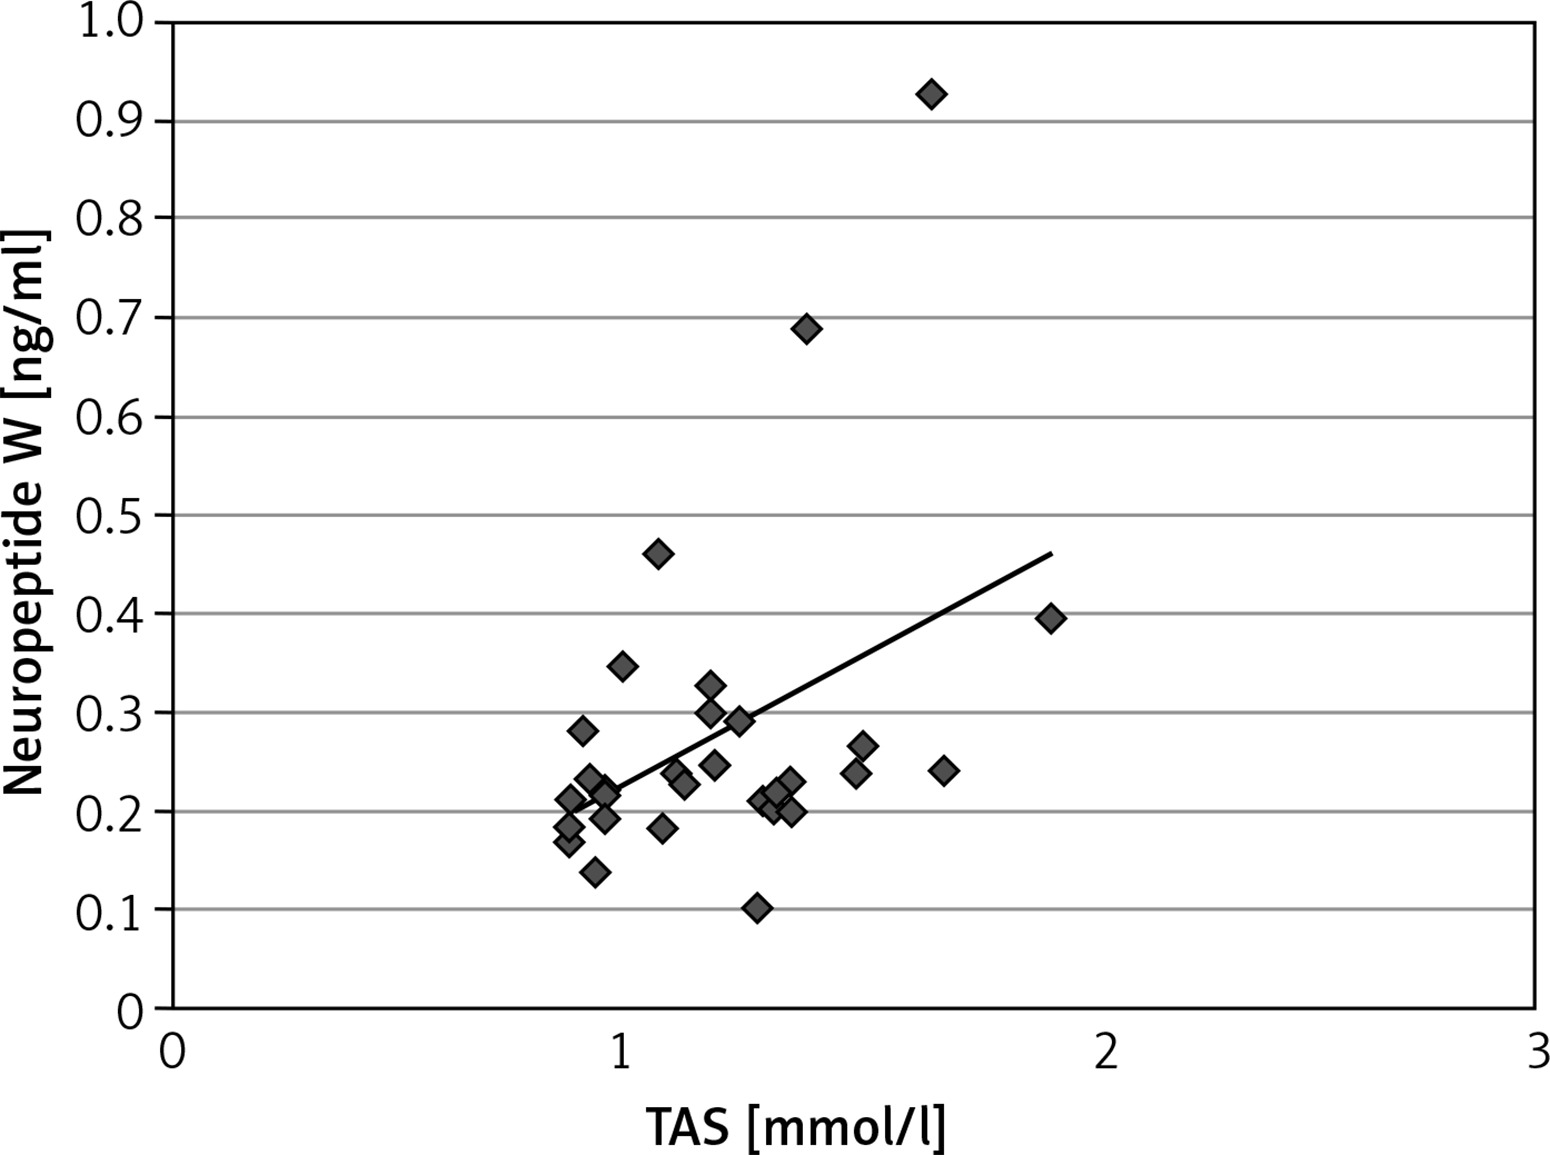
The T1DM pen group had 36% lower concentration of NPW (p < 0.0009) than the T1DM pump group and the T1DM pen group had 6% higher level HbA1c (p < 0.006) than the T1DM pump. Compared with the CONTR group, the T1DM pen group had a 35% lower level of NPW (p < 0.002) and 29% lower level of NPB (p < 0.024). Anthropometric parameters were found to be affected by the mode of insulin delivery, i.e. the patients treated with the insulin pens had 41% lower BMI-for-age percentile (p < 0.012), 25% lower Cole index (p < 0.025) as well as a decreased leptin concentration (by 81%; p < 0.00009) but a 91% higher level of serum adiponectin (p < 0.03). The T1DM pump group had 45% lower body mass index-for-age percentile (p < 0.006), 58% lower leptin concentration (p < 0.006) but a 110% higher level of adiponectin (p < 0.012) in comparison with the CONTR group (Table IV). A positive correlation was found in the T1DM pen group (n = 31) between NPW and TAS (R = 0.33; p < 0.033, Figure 2).
Table IV
Anthropometric and biochemical characteristics of individuals with type 1 diabetes mellitus (T1DM) treated using insulin pens (T1DM pen group, n = 31) or insulin pumps (T1DM pump group, n = 27) and control groups (CONTR, n = 25)
| Parameter [unit] | T1DM pen group (n = 31) | T1DM pump group (n = 27) | CONTR (n = 25) | P-value |
|---|---|---|---|---|
| Sex | 16 females/15 males | 12 females/15 males | 14 females/11 males | NS*; NS** NS*** |
| Age [years] | 12.0 ±4.1 13.0 (10.3; 16.2) | 11.0 ±4.8 12.0 (8.3; 15.7) | 11.0 ±4.1 12.0 (8.0; 15.0) | NS*; NS** NS*** |
| Height [m] | 1.49 ±0.22 1.56 (1.40; 1.64) | 1.40 ±0.24 1.49 (1.19; 1.62) | 1.48 ±0.20 1.49 (1.36; 1.65) | NS*; NS** NS*** |
| SDS of height | –0.22 ±1.20 –0.18 (–0.77; 0.44) | –0.38 ±0.98 –0.33 (–1.04; 0.14) | 0.91 ±2.83 0.30 (–0.18; 1.33) | NS*; NS** NS*** |
| Body mass [kg] | 45.4 ±19.5 43.5 (28.5; 61.3) | 39.5 ±18.9 40.5 (19.5; 54.0) | 54.8 ±26.9 53.0 (41.0; 57.1) | NS*; NS** NS*** |
| Cole index | 102.23 ±18.54 100.64 (91.41; 112.74) | 103.87 ±14.53 101.71 (98.68; 110.06) | 132.47 ±38.25 126.56 (99.18; 169.20) | NS* < 0.024** NS *** |
| BMI [kg/m2] | 19.24 ±4.45 17.87 (15.82; 23.04) | 18.64 ±3.97 18.03 (15.41; 20.58) | 23.73 ±7.68 21.62 (18.65; 27.78) | NS*; NS** NS*** |
| BMI z-score | –0.23 ±1.39 –0.22 (–0.78; 0.82) | 0.02 ±0.93 0.05 (–0.48; 0.64) | 1.05 ±1.64 1.61 (–0.22; 2.31) | NS* < 0.015** NS*** |
| Body mass index -for-age percentile | 47.55 ±31.52 41.00 (22.00; 79.00) | 51.48 ±27.57 52.00 (32.00; 74.00) | 72.28 ±33.80 95.00 (41.00; 99.00) | NS* < 0.012** < 0.006*** |
| TAS [mmol/l] | 1.20 ±0.27 1.18 (0.95; 1.35) | 1.25 ±0.24 1.29 (1.09; 1.44) | 1.45 ±0.23 1.51 (1.15; 1.62) | NS*; NS** NS*** |
| Leptin [ng/ml] | 1.81 ±2.50 0.69 (0.28; 2.15) | 2.44 ±3.47 1.54 (0.37; 2.98) | 6.09 ±5.53 3.68 (2.07; 8.03) | NS* < 0.00009** < 0.006*** |
| Adiponectin [μg/ml] | 10.57 ±5.45 9.54 (6.73; 12.60) | 11.22 ±5.61 10.48 (7.50; 14.07) | 7.18 ±5.26 5.00 (4.10; 10.20) | NS* < 0.03** < 0.012*** |
| Osteocalcin [ng/ml] | 30.92 ±19.80 26.30 (16.51; 41.50) | 28.58 ±16.31 31.80 (11.35; 38.54) | 27.42 ±16.63 24.32 (13.15; 37.70) | NS* NS** NS*** |
| Free sRANKL [pg/ml] | 3.12 ±5.64 1.00 (0.20; 3.80) | 2.92 ±2.76 2.40 (0.40; 4.00) | 3.26 ±3.50 2.60 (0.20; 4.00) | NS*; NS** NS*** |
| HbA1c [%] | 8.40 ±2.06 7.75 (6.95; 9.80) | 7.52 ±1.04 7.30 (6.30; 7.30) | – | < 0.006* |
| Neuropeptide B [ng/ml] | 0.24 ±0.13 0.20 (0.18; 0.25) | 0.34 ±0.24 0.22 (0.20; 0.40) | 0.34 ±0.18 0.28 (0.24; 0.41) | NS* < 0.024** NS*** |
| Neuropeptide W [ng/ml] | 0.28 ±0.16 0.23 (0.20; 0.29) | 0.44 ±0.29 0.32 (0.25; 0.48) | 0.44 ±0.23 0.36 (0.27; 0.50) | < 0.009* < 0.002** NS*** |
Parameters are shown as means ± standard deviations and medians (25% and 75% quartiles); T1DM – type 1 diabetes mellitus, CONTR – control group; n – number of individuals studied, p – level of statistical significance in post-hoc test (Dunn test for nonparametric data) after Bonferroni correction, SDS of height – standard deviation score of height, BMI – body mass index, BMI z-score – body mass index z-score, TAS – total antioxidant status, free sRANKL – free soluble receptor activator of nuclear factor-κB ligand, HbA1c [%] – % of glycated hemoglobin A1c,
Figure 2
Correlation between serum levels of neuropeptide W and total antioxidant status (TAS) in the type 1 diabetes mellitus treated using of insulin pens (n = 31)
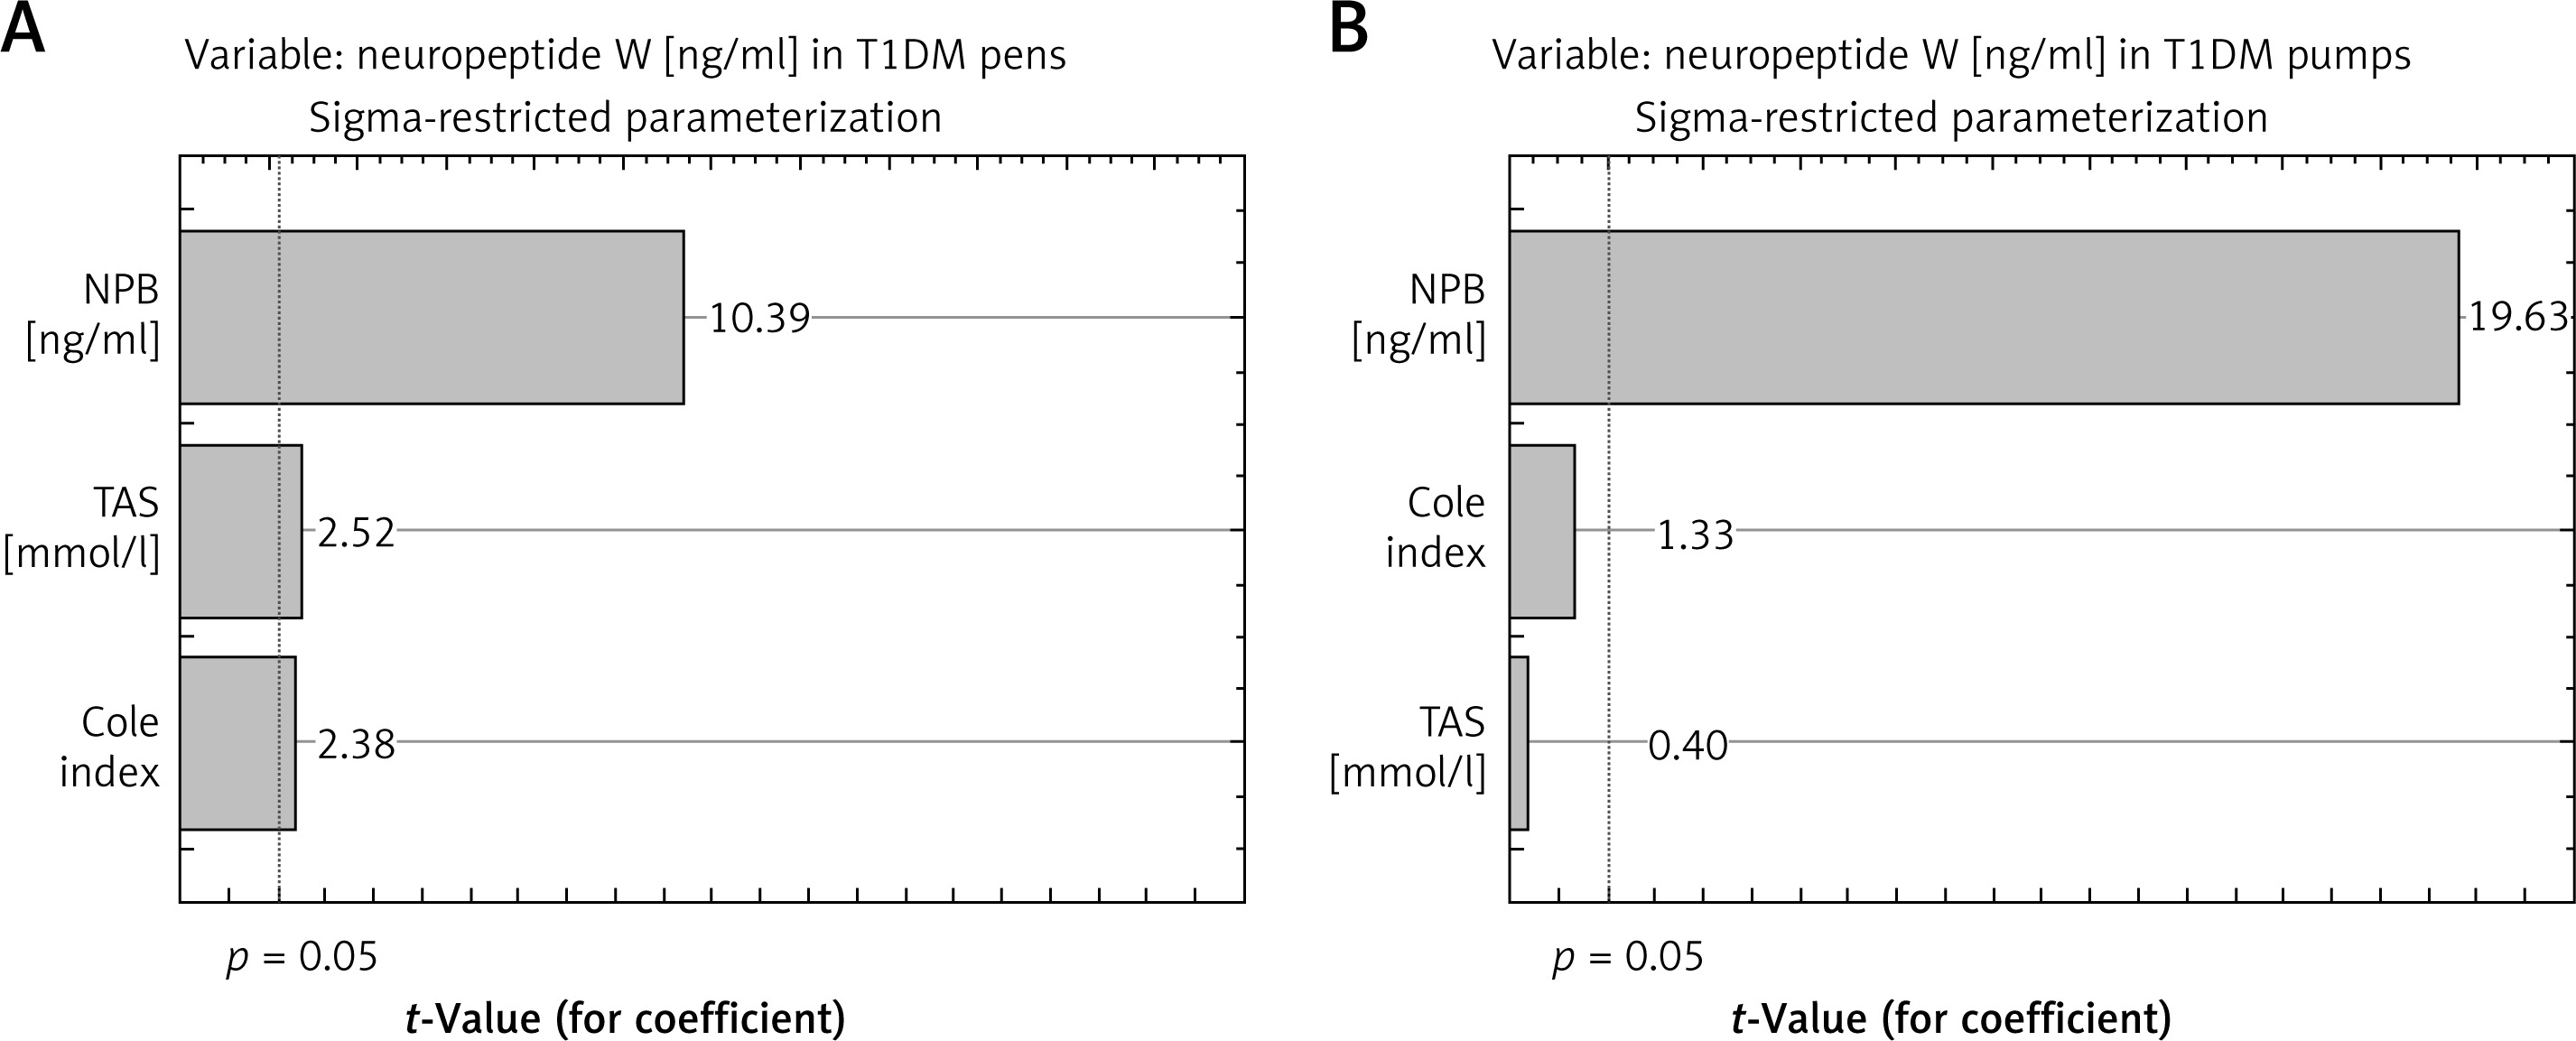
The multivariable model showed a significant effect of Cole index and TAS on the variability of serum values of NPW in the T1DM pen group (p < 0.003, R2adj (adjusted R2) = 32%) (Table V). To describe this phenomenon more precisely, an additional variable was included in the model, namely, values of serum concentration of NPB. Adding NPB value to the multivariable model allowed a better explanation of the variation in NPW: up to 86% (p < 0.0000001). In the case of the second group (T1DM pen users) the multivariable model showed a lack effect of Cole index and TAS on the variability of NPW (Table V). In the last group, only levels of NPB (from investigated parameters) explain the variation in serum values of NPW, similar as in the case of the CONTR group. A positive correlation was found between TAS and leptin levels (R = 0.41; p < 0.039) in the CONTR group, but there was no significant relationship in the T1DM group.
Table V
Comparison of the two models explaining variations of neuropeptide W in group of type 1 diabetes mellitus treated using insulin pens (T1DM pen group), group of type 1 diabetes mellitus treated using insulin pumps (T1DM pump group) and control group (CONTR) before and after adding the third variable (serum level of neuropeptide B) in the basic model, which includes Cole index and TAS
Comparative analysis of ROC curves (graphical characteristics) showed that area under the curve (AUC) levels of NPB, NPW and adiponectin were comparable (the differences were not statistically significant) for AUC level in the case of leptin for pairs of studied groups (T1DM vs. CONTR) (for details, see Table VI, Figures 3, 4). The highest AUC values of ROC were found in the case of adiponectin, and values were slightly lower in the cases of both NPW and NPB. Low sensitivity and specificity characterized osteocalcin and free sRANKL. Moreover, higher AUC level in the case of leptin in comparison for this parameter in the case of osteocalcin (p < 0.0003) and higher AUC level in the case of leptin in comparison to AUC level in the case of free sRANKL (p < 0.003, Figure 3) were demonstrated.
Table VI
Characteristics of ROC curves for serum concentrations of leptin, adiponectin, osteocalcin, free sRANKL, neuropeptide B, neuropeptide W for pairs of studied groups (T1DM vs. CONTR)
Figure 3
Receiver Operating Characteristic curves for serum levels of leptin, adiponectin, osteocalcin, free soluble receptor activator of nuclear factor-κB ligand (free sRANKL), neuropeptide B and neuropeptide W for the differentiation between patients with type 1 diabetes mellitus (T1DM) and control group (CONTR)
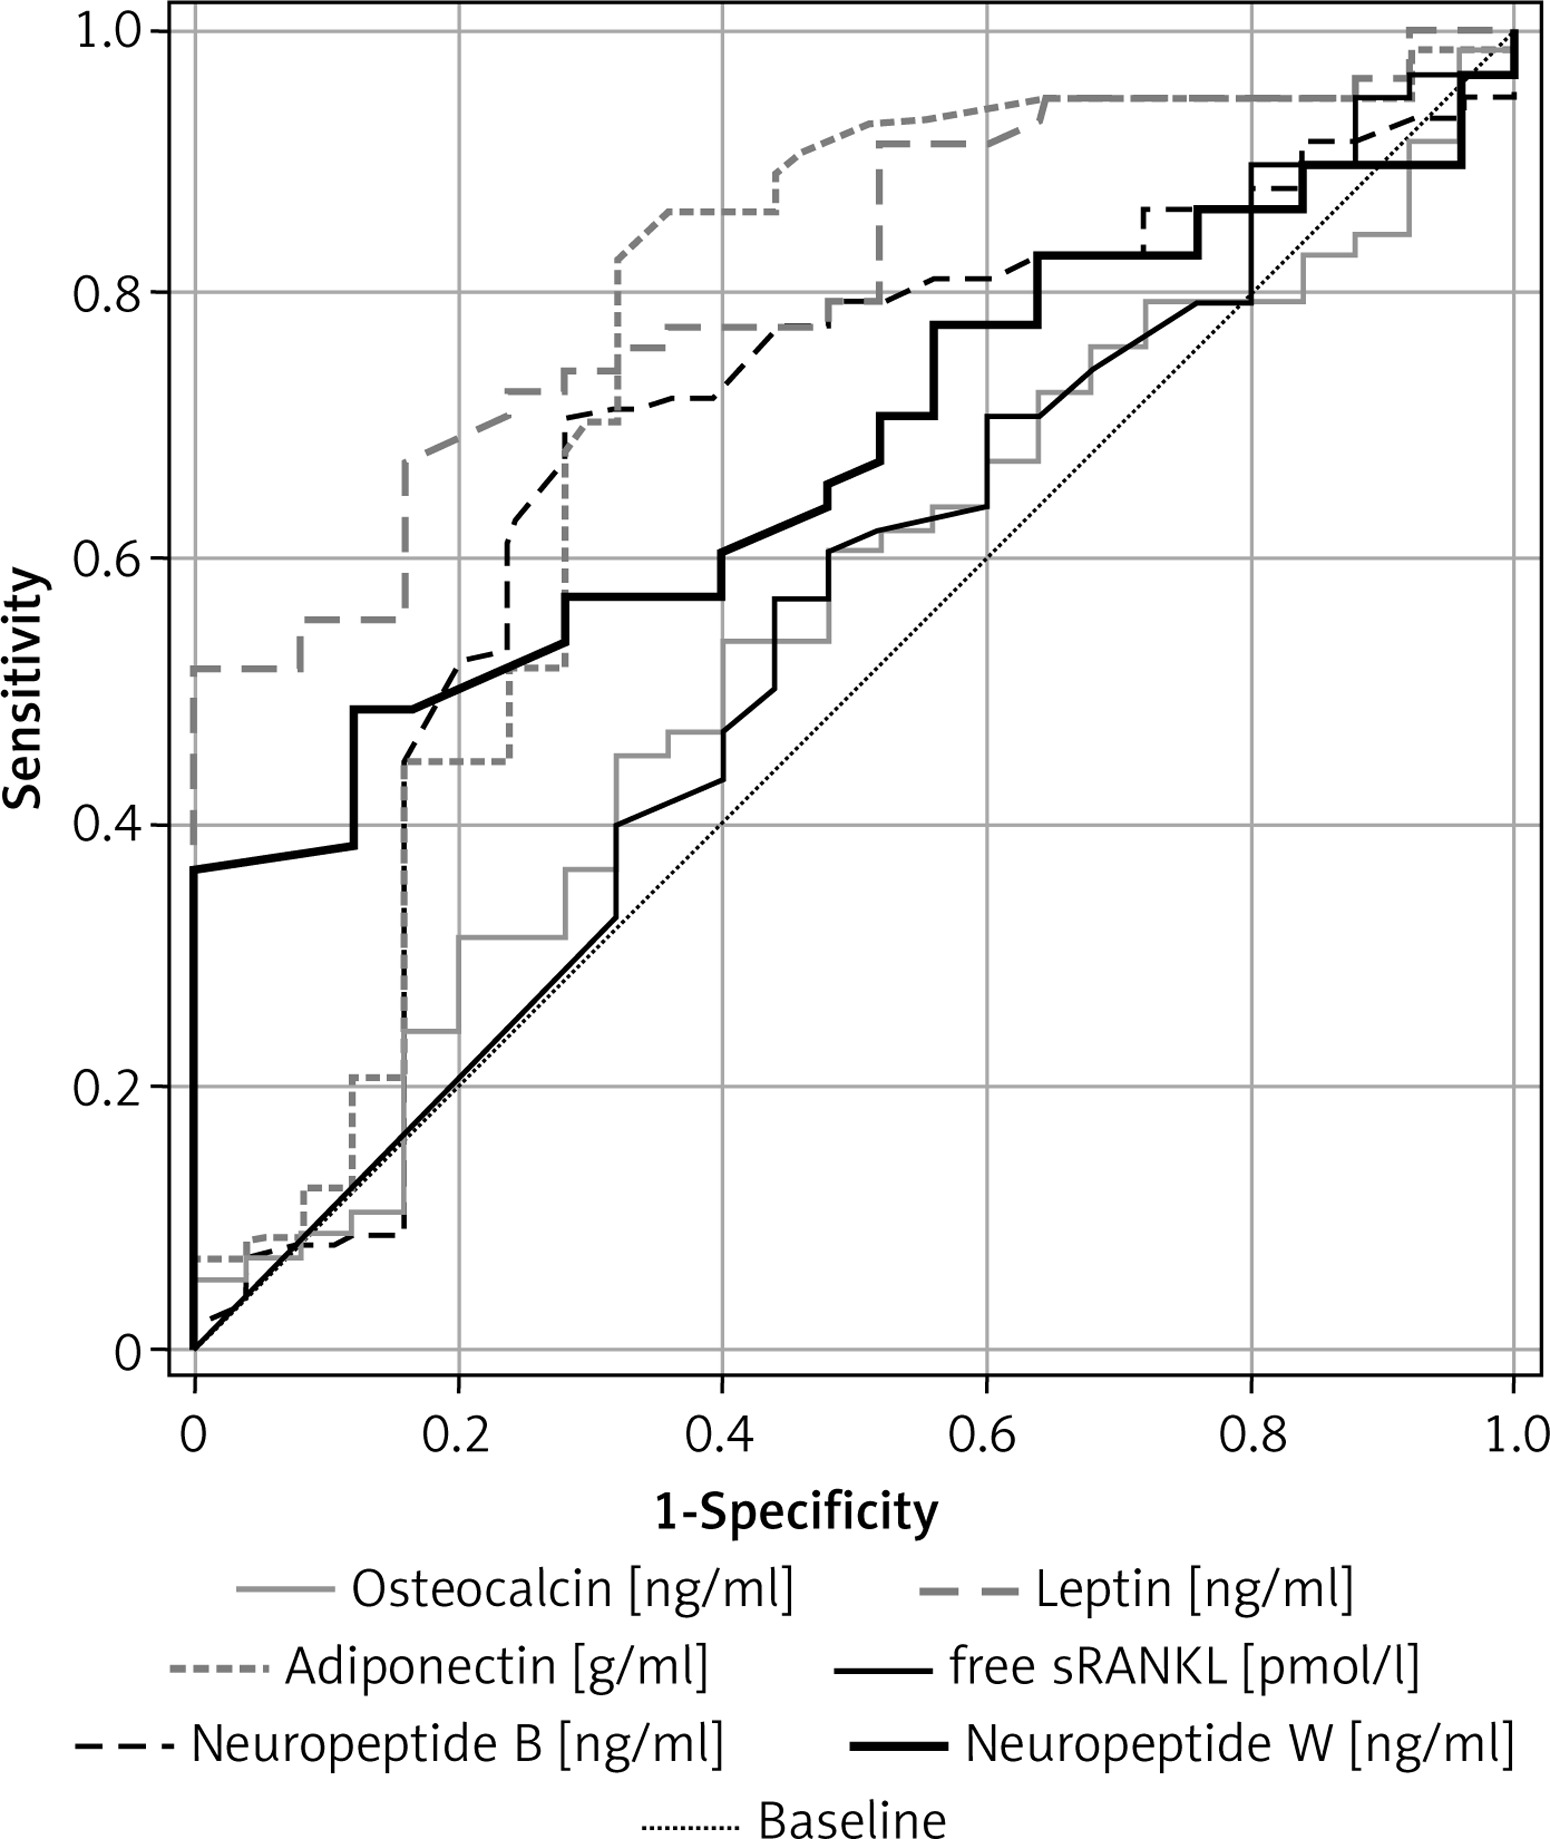
Figure 4
Pareto chart of t-value coefficient for neuropeptide W (model including 3 variables: neuropeptide B, Cole index and TAS – Total Antioxidant Status) in group of type 1 diabetes mellitus treated using pens (T1DM pen group, A) and group of type 1 diabetes mellitus treated using insulin pumps (T1DM pump group, B)
Discussion
Our results confirm the hypothesis that T1DM pediatric patients show altered serum levels of NPB and NPW, leptin, adiponectin, and TAS (but not in the case of osteocalcin and free sRANKL). Furthermore, we rejected the hypothesis stating that the relationships between the levels of studied parameters (except NPW) might be associated with the degree of glycemic control (and indirectly, with the method of insulin administration). This study was the first to show the levels of circulating NPB and NPW in pediatric patients suffering from T1DM. Our results showed significantly lower levels of both NPB and NPW in the diabetic patients as compared to non-diabetic healthy subjects. To the best of our knowledge, there are no published results on the level of NPB and/or NPW in T1DM. However, previously published results from in vivo studies indicate a clear association between those peptides and glucose metabolism. Namely, Rucinski et al. in a rat model showed that subcutaneous injections of NPB can affect both glucose (increase) and insulin levels (decrease) [4]. Furthermore, the possible mechanism of such regulation has been previously reported, as it has been shown that NPW causes a local increase in insulin secretion via increased Ca2+ ion in the cytosol of pancreatic β cells [29]. Therefore, it could be suggested that our clinical results are in agreement with the results from in vitro and in vivo models and thus indicate that both neuropeptides play a role in carbohydrate metabolism, including changes observed in T1DM.
In this study, patients presenting T1DM showed reduced serum NPB and NPW levels concomitantly to lower body mass, lower values of Cole index, BMI, BMI z-score, and BMI-for-age percentile, and lower SDS of height compared to healthy peers. To the best of our knowledge, there are no published results on the associations between NPB/NPW and anthropometric parameters in T1DM patients, and the only results available on appetite/food intake and nutritional parameters are reported from in vivo experiments [30–33]. Experimental studies in rodents have shown that intragastric administration of protein stimulated an increase in NPW mRNA expression in the gastric muscles of female mice [34]. Moreover, it has been shown that long-term feeding with a high-fat diet did not alter the level of NPW expression, but short-term starvation did significantly decrease NPW expression in female mice, suggesting modifications dependent on stimulation of the center of hunger and satiety [35]. In a light of the findings from in vivo experiments it could be thus suggested that our findings on concomitant changes to NPB and NPW and anthropometric parameters in T1DM patients, albeit not direct, indicate the involvement of both peptides in carbohydrate metabolism in diabetic patients.
The results of our study showed a positive relationship between serum concentrations of NPB and leptin, although only in the male subjects. The lack of such a relationship in the females could possibly indicate a role of endocrine regulatory mechanisms. It has been reported that NPW-knockout female and male rodents show normal food intake [36], but only male NPB-knockout rodents develop adult obesity [37]. Hence the positive correlation between leptin and NPB in the males but not in females in this study could indicate that NPB has a greater involvement than NPW in regulating nutritional status in males, connecting with leptin-mediated pathways.
The present study demonstrated no correlation between concentrations of free sRANKL and anthropometric and biochemical parameters in all analyzed groups. According to the “free hormones” hypothesis, only molecules not bound to plasma protein are free to migrate through cell membranes and to have metabolic effects, so the concentrations of free sRANKL that are unbound with osteoprotegerin seem to be independent of the level of plasma transport proteins. Loureiro et al. reported blood levels of total sRANKL fraction (total free and osteoprotegerin bound-soluble pool) in patients with T1DM comparable to those observed in healthy controls, but the s-osteoprotegerin (soluble form of its antagonist) was decreased in T1DM, stimulating increased bone resorption. Moreover, it has been reported that RANKL gene expression in peripheral blood leukocytes was comparable in children and adolescents with well-controlled and poorly controlled T1DM (according to HbA1c) and the control group [38]. On the other hand, the systematic review by Starup-Linde showed the correlation of the total soluble pool of RANKL in the blood with carbohydrate disorders (suppression of secretion in hyperglycemia and a correlation between the concentrations of RANKL and leptin, adiponectin, antioxidant status and concentration of insulin-like growth factor 1 in patients with T1DM) [20]. However, results on the relations between serum concentrations of free sRANKL and the endocrine activity of adipose tissue or nutritional status in patients with this disease are not available.
This study demonstrated a larger total adiponectin pool in patients with T1DM, as compared with healthy peers. This finding is in agreement with previously published results (Galler et al. [39], Al Saeed et al. [40], and Frystyk et al. [41]). Moreover, the concentrations of the adipokine observed in this study were negatively correlated with the level of osteocalcin. Kanazawa et al. have previously reported negative correlations of osteocalcin concentration in the blood of men with type 2 diabetes with both visceral fat and subcutaneous fat as well as with fasting glucose levels [42]. Loureiro et al. found only negative correlations between serum osteocalcin and glucose as well as serum osteocalcin and % glycated hemoglobin A1c in patients with abnormal glycemic control [38]. In this study (with the median of HbA1c: 7.65%), the differences between groups in serum osteocalcin concentrations were negligible, which could indicate that this phenomenon is predominantly associated with metabolically decompensated diabetes. It is worth noting that a negative correlation between the concentration of this molecule and leptin was observed in this study. Published results on such relationships are currently not available in patients with T1DM, but Kanazawa et al. observed a significant correlation between serum osteocalcin and index of visceral adiposity content in male patients with type 2 diabetes [42]. This would therefore suggest that both bone- and fat-derived molecules play important roles in anthropometric status in patients with T1DM.
The reduction in the antioxidant status observed in the patients with T1DM in this study indicates a predominance of pro-oxidant processes over antioxidant processes. Similar results were observed in studies conducted in 2014 in patients with T1DM (with 31% lower values of TAS) and their siblings (26% lower values of TAS), compared to healthy peers without a history of this disease in the family [43]. Published results and the findings of this study indicate the importance of genetic pathomechanisms of lower antioxidant levels in individuals predisposed to T1DM and thus may suggest that oxidative stress contributes to disease etiopathogenesis and its outcomes. Notably, no correlation between TAS level and duration of the disease and HbA1c [%] were demonstrated in this study and the previous results of Salmonowicz et al. [43]. The positive relationship between TAS and NPW in the T1DM pen group suggests an influence of this neuropeptide on the antioxidant system and/or vice versa.
This study showed a significant correlation between antioxidant status and leptin but only in control healthy subjects. This result suggests a modification in the level of the index representing the ratio of pro-oxidant levels to antioxidants, with carbohydrate balance disorders being accompanied by leptin deficiency. Sainz et al. demonstrated in ob/ob mice that thiobarbituric acid reactive substances (and therefore lipid peroxidation status) and the normalization of glycemia and insulinemia followed leptin administration [44]. Moreover, Sainz et al. also reported that leptin administration altered the expression of 1276 genes, including 86 involved in oxidative stress, immunological, and inflammatory processes [44]. This would therefore suggest that leptin plays multiple roles in glycemic homeostasis.
Recently, the problem of abnormal weight has been highlighted in patients with T1DM, i.e. the results of anthropometric studies of ~33,000 pediatric patients with T1DM from western Europe and the USA showed that ~ 40% of the population studied presented abnormalities in the body composition, and a significant, positive correlation between BMI z-score and HbA1c [%] was found in the 6–17 age group [45]. The co-occurrence of type 1 and type 2 diabetes (with insulin resistance) and MODY (maturity onset diabetes of the young) type diabetes mellitus in a pediatric patient [46] and in particular, the co-occurrence of MODY-type diabetes specific biomarkers and T1DM-specific antigens were also previously observed [47, 48]. Such cases represent significant diagnostic and therapeutic challenges, and therefore, in the treatment of quantitative and qualitative malnutrition, attention should be paid to not increase the mass of adipose tissue excessively in patients with T1DM, due to the risk of developing insulin resistance.
In this study HbA1c was significantly lower in the population treated with an insulin pump than in the patients treated with insulin pens. Similar results have been reported previously in a study by Olsen et al. [49]. Based on the recent definitions of metabolic control in T1DM introduced by the International Society for Pediatric and Adolescents Diabetes (ISPAD) [50] and the American Diabetes Association (ADA), a correct level of HbA1c (so less than or equal to 7.5%; 58 mmol/mol) [51] was observed in most of our patients treated with an insulin pump, but less than 50% of patients treated with insulin pens. The T1DM pump group, but not the T1DM pen group, exhibited comparable levels of NPW as the control group. It could be speculated that the levels of insulin and glucose, in a similar fashion to NPW level, are more normalized in the T1DM pump group as compared to the T1DM pen group. The indirect proof is related to the association between lower HbA1c in the T1DM pump group than T1DM pen group and the positive correlation between NPW and TAS in the T1DM pen group. The administration of an insulin analogue in the pump consists of a continuous subcutaneous infusion of the hormone that mimics the constant secretion of insulin in the pancreas. HbA1c is a good parameter evaluating the results of diabetic treatment, but quite “broad”, because it shows only the average glycemia value from the last 3 months and does not reflect glycemic fluctuation. This means that there can be the same HbA1c value in a patient who has large blood glucose fluctuations at this time and in a patient with small fluctuations, as long as the mean glycemia is the same. T1DM patients using insulin pens have larger glycemic fluctuations because of the hypoinsulinemia period than in the T1DM pump population. In the latter case, if insulin pumps are properly used, the blood glucose fluctuations are leveled out, and therefore low HbA1c values can be achieved, close to the reference values, without exposing the patient to severe hypoglycemia [50]. The above difference can be significant in the aspect of the impact of various tissues on glycemic metabolism.
Our study has some limitations. The analysis used body mass and height measurements to determine the anthropometric indices (BMI z-score, Cole index, and BMI-for-age percentile) recommended for the assessment of nutritional status in children and adolescents. More advanced anthropometric analyses, such as electric bioimpedance, would allow for the accurate evaluation of lean tissue but are not available for children [52]. It is worth considering expanding biochemical analyses to larger research groups, which in the case of pediatric patients is not easy to arrange. The next limitation is that in the T1DM pen group we included patients who used human insulin and/or analog insulin. The patients with pumps used only rapid analog insulin, and thus it is worth performing a separate study with patients treated with pens using only analog insulin. Therefore, future investigation is required.
In conclusion, nutritional indicators (the profile of leptin and anthropometric parameters) and antioxidant status may play an essential role in shaping NPB and NPW in people with T1DM. Serum levels of NPW and NPB, adiponectin and especially of leptin could be considered in detailed diagnostics of pediatric and adolescent patients with T1DM, primarily in populations with abnormal anthropometric indices, antioxidant status and those treated using insulin pens. The lack of correlation with HbA1c raises the suspicion of a lack of a significant impact of the results of treatment (which is substitution, i.e. it is symptomatic) on energy and nutritional processes, which more clearly depend on other factors: CNS function, endocrine homeostasis, and genes (gender). The effects of gender and the form of insulin treatment on the relationship between NPB and leptin and antioxidant status in T1DM require however further investigation.