Introduction
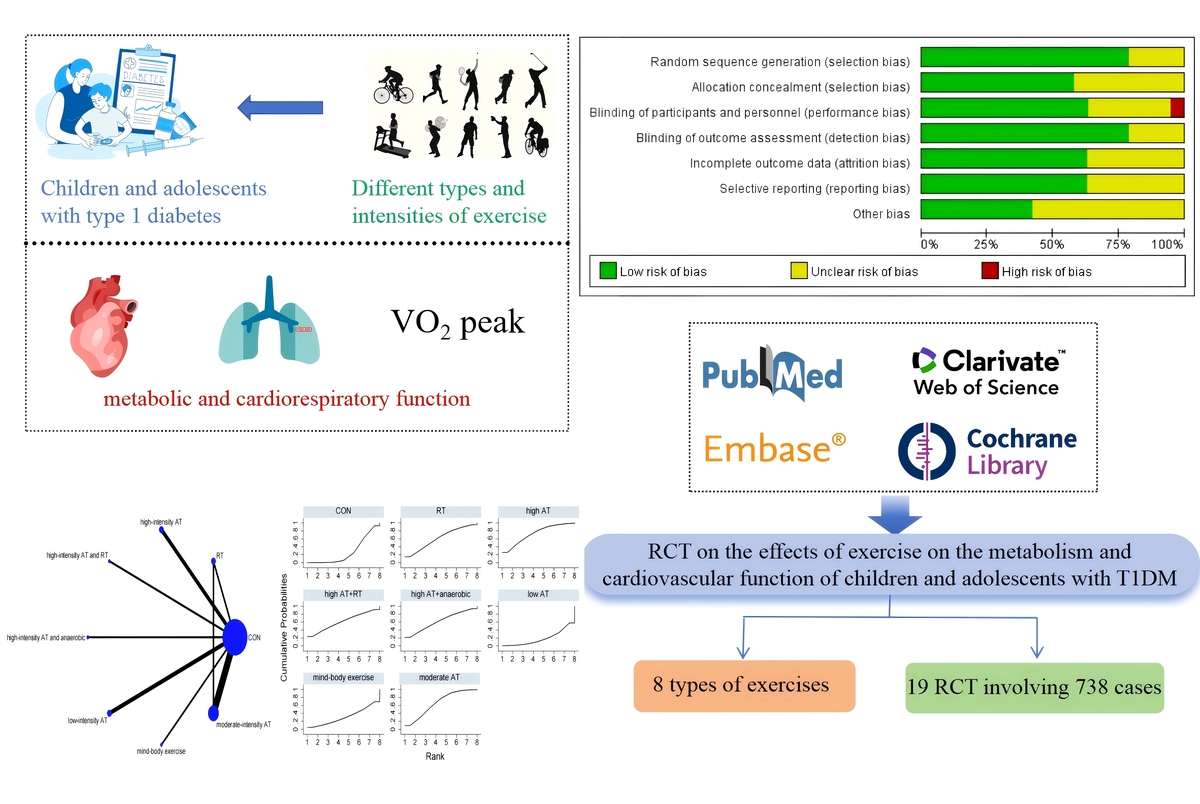
Type 1 diabetes mellitus (T1DM), as the most prevalent chronic endocrine disorder among children and adolescents, demonstrates an escalating incidence rate annually. Its pathogenesis is characterized by T lymphocyte-mediated destruction of pancreatic β cells, resulting in absolute loss of islet function [1], which presents significant challenges for radical cure. Affected individuals require lifelong dependence on exogenous insulin therapy. Although insulin replacement therapy can improve patient survival rates, long-term complications still occur and severely impact quality of life. Consequently, many patients adopt non-pharmacological interventions including physical exercise, dietary control, and appropriate self-management to complement their treatment.
Exercise, as a non-pharmacological intervention, plays a significant role in improving metabolic and cardiopulmonary function in T1DM patients. Physical activity not only enhances skeletal muscle glucose uptake but also modulates insulin sensitivity and promotes glycogen synthesis, thereby improving metabolic control. Additionally, it benefits cardiopulmonary function by reducing hypertension and dyslipidemia. However, children and adolescents with T1DM still face challenges during exercise, primarily due to an increased risk of exercise-induced hypoglycemia, which may be attributed to abnormal hormonal responses or impaired glucose counterregulatory mechanisms. This contributes to exercise-related fear in some pediatric T1DM patients. Furthermore, given the unique physiological characteristics of children and adolescents, their metabolic and cardiopulmonary responses differ from those of adults, necessitating targeted research in this population.
Previous meta-analyses have only compared the effects of specific types of physical activity on hemoglobin A1c (HbA1c) in children and adolescents with T1DM [2–4]. On one hand, these studies lacked analyses of lipid profiles and cardiorespiratory function; on the other hand, they did not thoroughly investigate the differences among various exercise intensity combinations. This study fills this gap by systematically comparing the effects of different types and intensities of exercise on children and adolescents with T1DM. Not only does it focus on HbA1c control, but it also includes lipid profiles and cardiorespiratory function, providing a more comprehensive metabolic evaluation. Additionally, this study offers meaningful insights for clinicians to consider which types of physical activity may effectively reduce blood glucose (BG) and lipid profiles in T1DM patients. Network meta-analysis (NMA), also known as mixed treatment comparison or multiple treatment comparison meta-analysis, differs from traditional meta-analysis, which compares only two interventions. NMA constructs an evidence network to allow for both direct and indirect comparisons of multiple interventions, ranks the interventions to increase statistical power, and explores sources of heterogeneity [5]. Therefore, in this study, we employed NMA to compare different types and intensities of exercise interventions, aiming to assess their therapeutic effects on T1DM patients and provide a better understanding for patients and clinicians.
Material and methods
This study strictly follows the PRISMA-NMA guidelines for reporting network meta-analysis and has been registered in PROSPERO (Registration No.: CRD42025646664).
Search strategy
The researchers conducted a comprehensive literature search from the inception of the study up to December 2024 across four electronic databases: PubMed, Embase, Cochrane, and Web of Science. Additionally, 2 articles were identified through manual search. The search strategy was structured around the PICOS framework: (P) Population: children and adolescents with T1DM; (I) Intervention: physical activity; (C) Comparison: control group engaging in routine daily activities; (O) Outcomes: HbA1c, BG, total cholesterol (TC), triglycerides (TG), peak oxygen consumption (VO2 peak), high-density lipoprotein cholesterol (HDL-C), low-density lipoprotein cholesterol (LDL-C); (S) Study design: randomized controlled trials (RCTs). A detailed search strategy, using PubMed as an example, is provided in Supplementary Table SI.
Inclusion criteria
Diagnostic criteria: The diagnostic standards for T1DM are based on the 2018 position statement by the American Diabetes Association [6].
Age range: Children and adolescents aged 5–19 years diagnosed with T1DM were included.
Inclusion criteria: Only RCTs that have been publicly published were included.
Exercise intervention: Studies should provide detailed descriptions of the type, duration, and frequency of exercise.
Outcome measures: At least one of the following should be included: HbA1c, BG, TC, TG, VO2 peak, HDL-C, LDL-C.
Exclusion criteria
Participants with other severe chronic diseases were excluded.
Studies involving the use of novel antidiabetic drugs or other interventions that may affect outcome measures during exercise were excluded.
Studies that included adults were excluded.
Non-randomized controlled trials (non-RCTs) were excluded.
Studies with duplicate data or those that did not undergo ethical review were excluded.
Studies with incomplete data (e.g., lacking means, standard deviations, or sample sizes for outcome measures) were excluded.
Study selection
The Endnote reference management software was used to screen and exclude studies. Two researchers initially screened the titles of the studies, excluding duplicates, non-RCTs, review articles, conference papers, protocols, and communications. Subsequently, the researchers read the abstracts to determine the eligibility of the studies for inclusion and excluded those that did not meet the criteria. Finally, the researchers read the full texts of the remaining studies and further determined which studies should be included. Throughout this process, the researchers independently screened the studies and compared the remaining ones. Studies were included if there was agreement, and discrepancies were resolved through discussion with a third researcher.
Data extraction
A seven-item standard and a pre-selected data extraction table were used to record the data included in the studies, categorized under the following headings: (1) Authors, (2) Publication year, (3) Country, (4) Study duration, (5) Sample size, (6) Mean age, and (7) Details of the exercise intervention.
Risk of bias of individual studies
Two researchers used the Cochrane tool (Review Manager 5.4) to assess the risk of bias, with any disputed issues being discussed and resolved with a third researcher. The risk of bias assessment included seven components: random sequence generation, allocation concealment, blinding of participants and trial personnel, blinding of outcome assessors, incomplete outcome data, selective reporting, and other biases. The assessment was based on the number of components that potentially indicated high risk. Each component was assessed using the following categories: high risk (≥ 5), unclear (3–4), and low risk (≤ 2) [7]. For detailed information, refer to Supplementary Figures S1 and S2.
Data analysis
The network evidence plot demonstrates that various interventions can be compared both directly and indirectly. The size of the nodes indicates the number of trials included for each intervention, and the thickness of the connecting lines is proportional to the number of trials [8]. Exercise interventions are continuous variables; therefore, the standardized mean difference (SMD) is used to evaluate the effect of the interventions [9]. The SUCRA method allows for the ranking of the interventions, thereby identifying the most effective intervention [10]. Additionally, a funnel plot was used to detect any significant publication bias. All analyses were conducted using Stata 15.1.
Results
Research and selection of literature
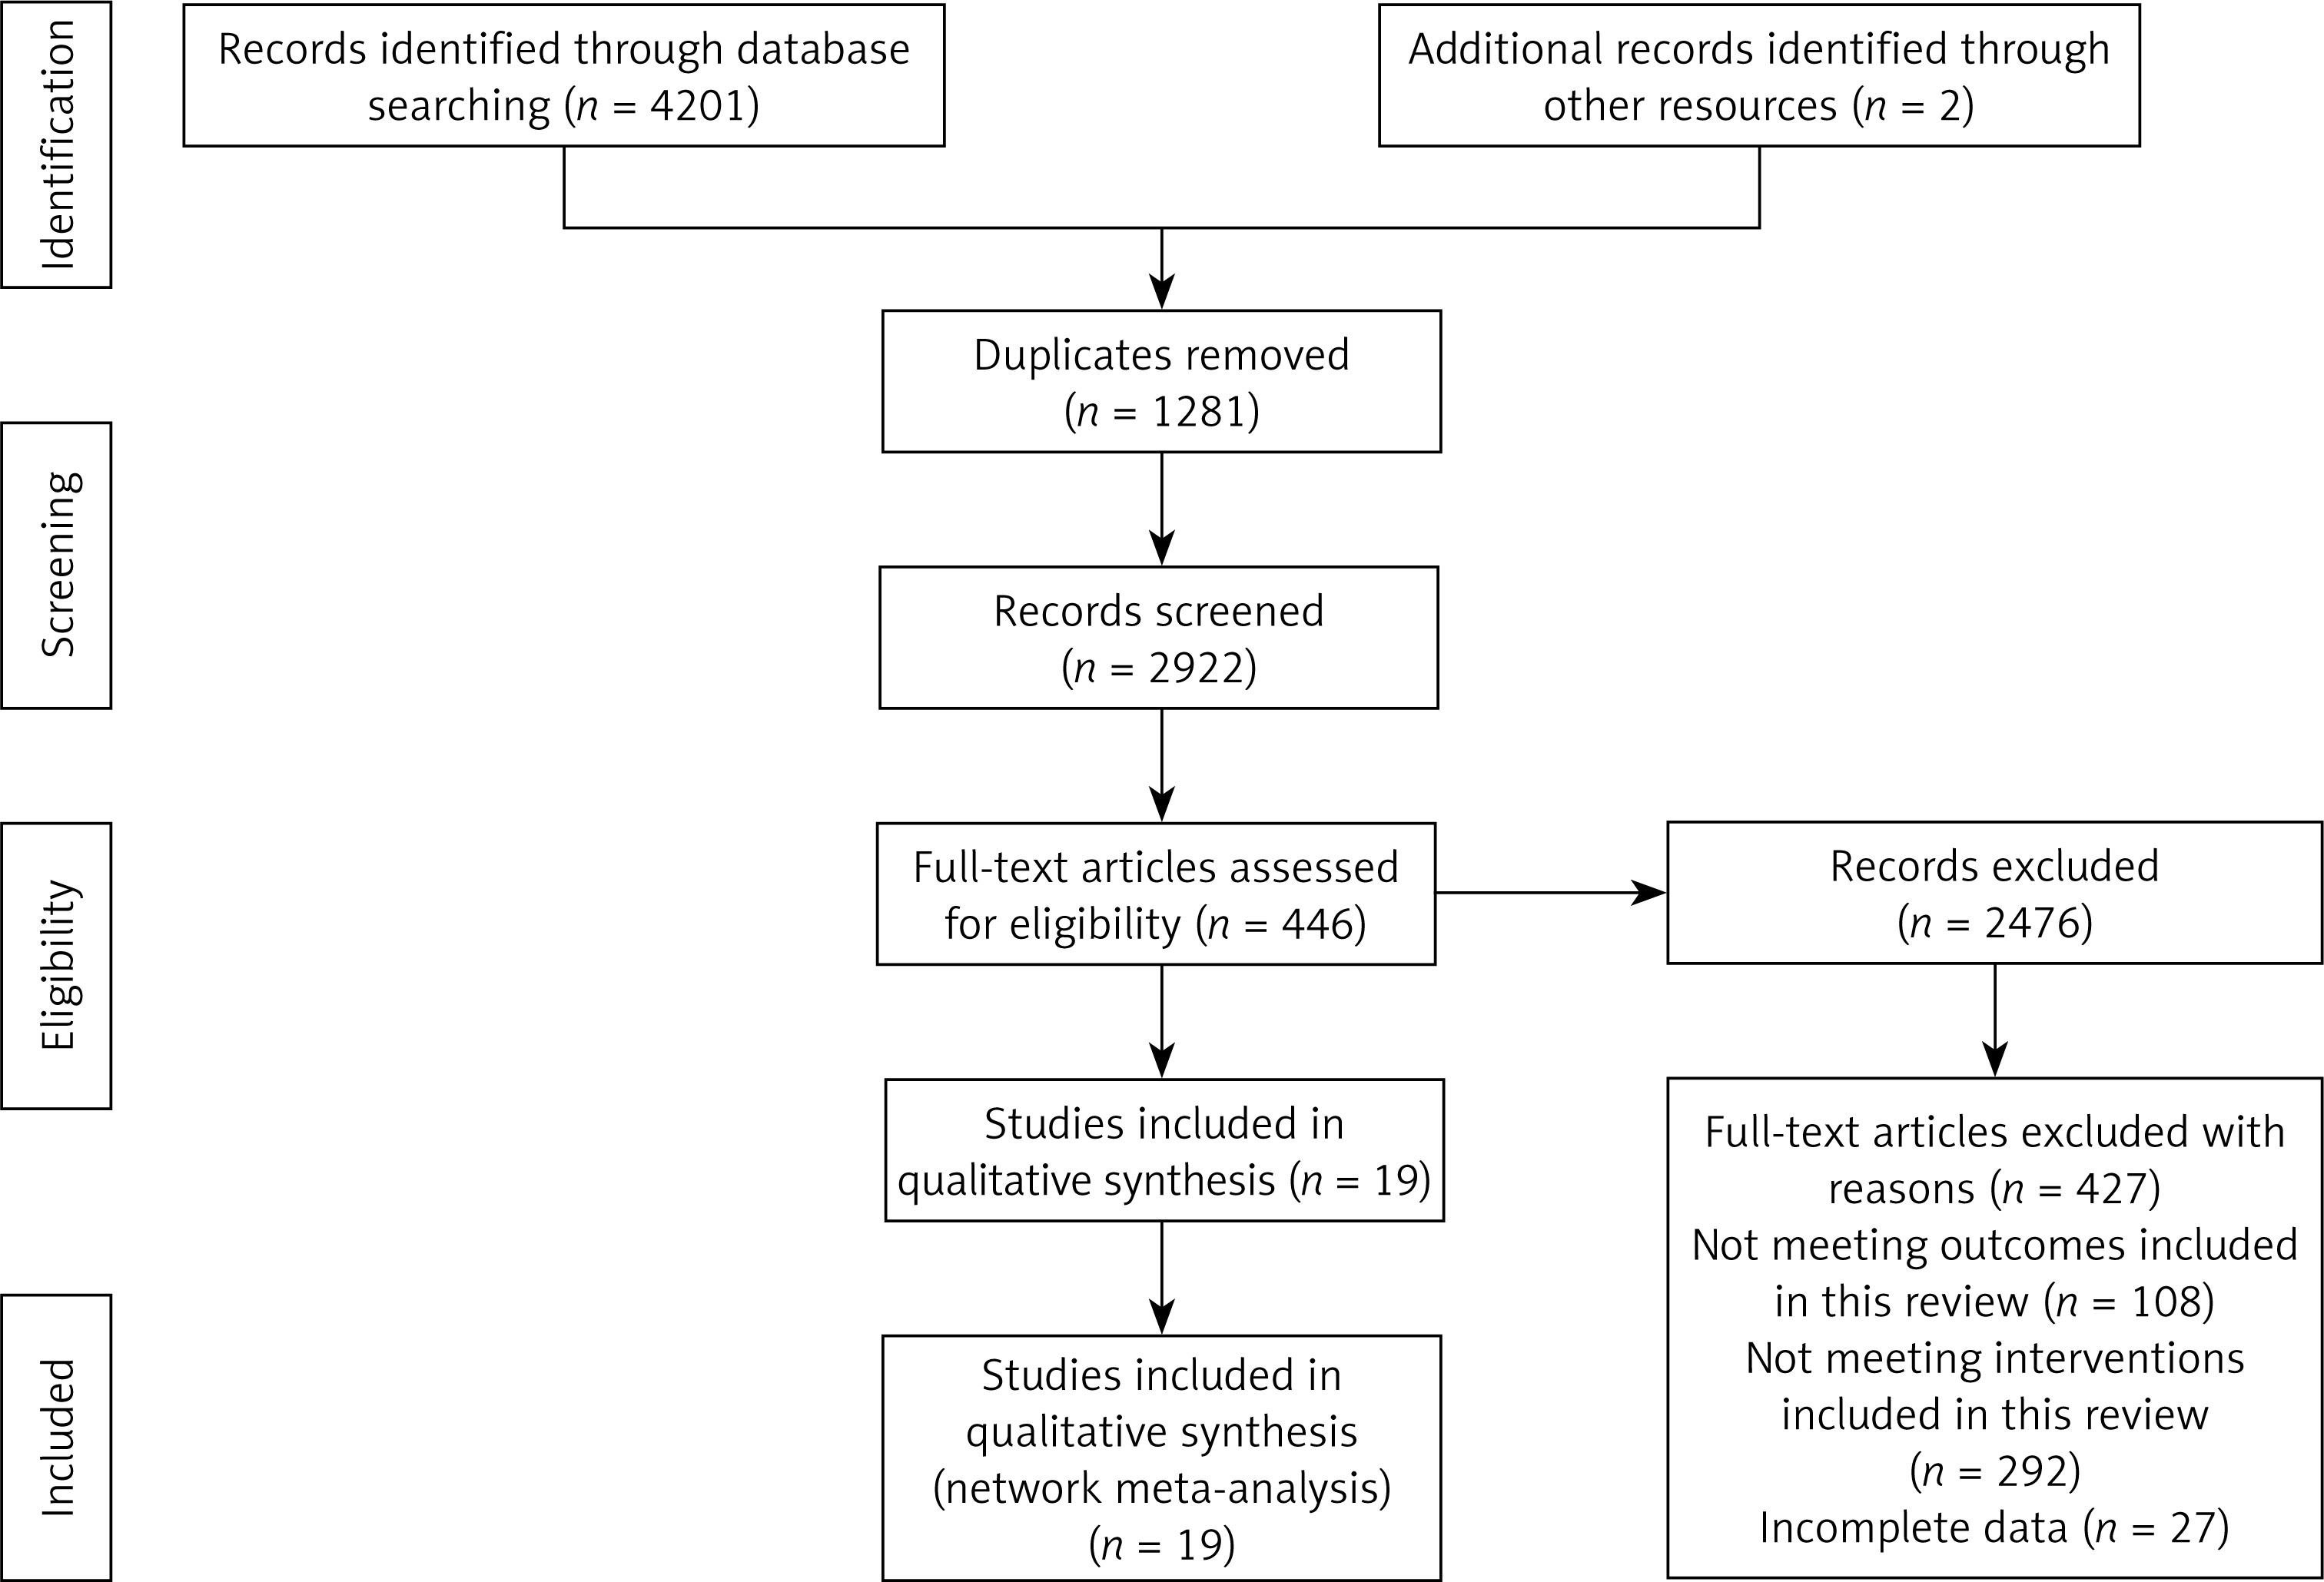
A total of 4,201 articles were searched from four electronic databases. After removing duplicates, 2,922 articles remained. A total of 2,476 articles were excluded in the next round of screening. Of the excluded articles, 427 were excluded due to full-text issues: 108 for not including the outcome measures of this review, 292 for not meeting the intervention criteria, and 27 for incomplete data. Ultimately, 19 articles were included in the final analysis (Figure 1).
Quality assessment of the included literature
The quality assessment of the included studies revealed that 11 were classified as low risk, 7 as moderate risk, and 1 as high risk. For detailed information, refer to Supplementary Figures S1 and S2.
Characteristics of the included studies
A total of 19 studies were included, comprising 738 children and adolescents diagnosed with T1DM. The interventions in the experimental group included high-intensity aerobic training, moderate-intensity aerobic training, low-intensity aerobic training, high-intensity aerobic training combined with resistance training, moderate-intensity aerobic training combined with resistance training, resistance training, high-intensity aerobic training combined with anaerobic training, and mind-body exercise. Of the studies, 12 used HbA1c as an outcome measure, 8 used BG, 8 used TC, 8 used TG, 8 used HDL-C, 7 used LDL-C, and 5 used VO2 peak. Seven studies were from Europe, six from the Americas, four from Asia, one from Africa, and one from Oceania. For detailed information, refer to Table I [11–29].
Table I
Specific content of the included studies
| Author | Country | Year | Population | Age (mean ± SD) | Total | Intervention | Control | Outcome |
|---|---|---|---|---|---|---|---|---|
| Pemberton [11] | Britain | 2023 | T1DM | 12.3 (±3.7) | 125 | High-intensity aerobic training Length of intervention: 12 weeks Freq: - Duration: 5–40 min | CON | HbA1c |
| Mohammed [12] | Saudi Arabia | 2019 | T1DM | 12–17 | 20 | High-intensity aerobic training Length of intervention: 12 weeks Freq: 3 times a week Duration: 50 min | CON | HbA1c BG TC TG LDL-C HDL-C |
| Wong [13] | Taiwan | 2010 | T1DM | 12.34 (±2.07) | 28 | Moderate-intensity aerobic training Length of intervention: 12 weeks Freq: 3 times a week Duration: 30 min | CON | HbA1c |
| D’hooge [14] | Belgium | 2010 | T1DM | 10–18 | 16 | High-intensity aerobic training combined with resistance training Length of intervention: 20 weeks Freq: twice a week Duration: 70 min | CON | HbA1c BG VO2 peak |
| Ramalho [15] | Brazil | 2005 | T1DM | 19.8 (±5.1) | 13 | Moderate-intensity aerobic training Length of intervention: 12 weeks Freq: 3 times a week Duration: 40 min | Resistance training | HbA1c BG TC TG LDL-C HDL-C |
| Huttunen [16] | Finland | 1989 | T1DM | 8.2–16.9 | 32 | Low-intensity aerobic training Length of intervention: 13 weeks Freq: once a week Duration: 60 min | CON | HbA1c BG VO2 peak |
| Stratton [17] | USA | 1988 | T1DM | 15.1 (±1.2) | 130 | High-intensity aerobic training Length of intervention: 8 weeks Freq: twice a week Duration: 30 min | CON | BG |
| Stratton [18] | USA | 1987 | T1DM | T: 15.1 (±1.2) C: 15.5 (±0.9) | 16 | Moderate-intensity aerobic training Length of intervention: 8 weeks Freq: 3 times a week Duration: 30–45 min | CON | BG TC TG HDL-C |
| Landt [19] | USA | 1985 | T1DM | T: 16.1 (±0.8) C: 15.9 (±0.3) | 15 | High-intensity aerobic training Length of intervention: 12 weeks Freq: 3 times a week Duration: 45 min | CON | VO2 peak |
| Campaigne [20] | USA | 1985 | T1DM | T: 16 (±3) C: 15 (±0.9) | 14 | High-intensity aerobic training Length of intervention: 12 weeks Freq: 3 times a week Duration: 45 min | CON | VO2 peak TC TG LDL-C HDL-C |
| Adolfsson [21] | Sweden | 2011 | T1DM | 14–19 | 59 | Moderate-intensity aerobic training Low-intensity aerobic training Length of intervention: 3 d Freq: twice a day Duration: 3 h, 2.8 h | CON | BG |
| Campaigne [22] | USA | 1984 | T1DM | T: 9 (±0.47) C: 8.5 (±0.57) | 19 | Moderate-intensity aerobic training Length of intervention: 12 weeks Freq: 3 times a week Duration: 30 min | CON | HbA1c BG VO2 peak |
| Dahl-Jorgensen [23] | Norway | 1980 | T1DM | T: 9–15 C: 9–13 | 22 | Low-intensity aerobic training Length of intervention: 20 weeks Freq: twice a week Duration: 60 min | CON | HbA1c |
| Heyman [24] | France | 2007 | T1DM | T: 15.9 (±1.5) C: 16.3 (±1.2) | 16 | Moderate-intensity aerobic + resistance training Length of intervention: 24 weeks Freq: once a week Duration: 2 h | CON | TC TG LDL-C HDL-C |
| Salem [25] | Egypt | 2010 | T1DM | T: 14.5 (±2.4) C: 15 (±2.35) | 121 | High-intensity aerobic training combined with anaerobic training Length of intervention: 24 weeks Freq: 3 times a week Duration: 30 min | CON | TC TG LDL-C HDL-C |
| Tunar [26] | Turkey | 2012 | T1DM | 12–17 | 31 | Mind-body exercise Length of intervention: 12 weeks Freq: 3 times a week Duration: 45 min | CON | HbA1c TC TG LDL-C HDL-C |
| Aouadi [27] | UK | 2011 | T1DM | 12.4 (±1.5) | 22 | Moderate-intensity aerobic training Length of intervention: 24 weeks Freq: 4 times a week Duration: 60 min | CON | HbA1c TC TG LDL-C HDL-C |
| Marrero [28] | India | 1988 | T1DM | 12–14 | 18 | Moderate-intensity aerobic training Length of intervention: 12 weeks Freq: 3 times a week Duration: 45 min | CON | HbA1c |
| Petschnig [29] | Austria | 2020 | T1DM | T: 11 (±0.8) C: 11.3 (±0.7) | 21 | Resistance training Length of intervention: 32 weeks Freq: twice a week Duration: 50 min | CON | HbA1c |
NMA
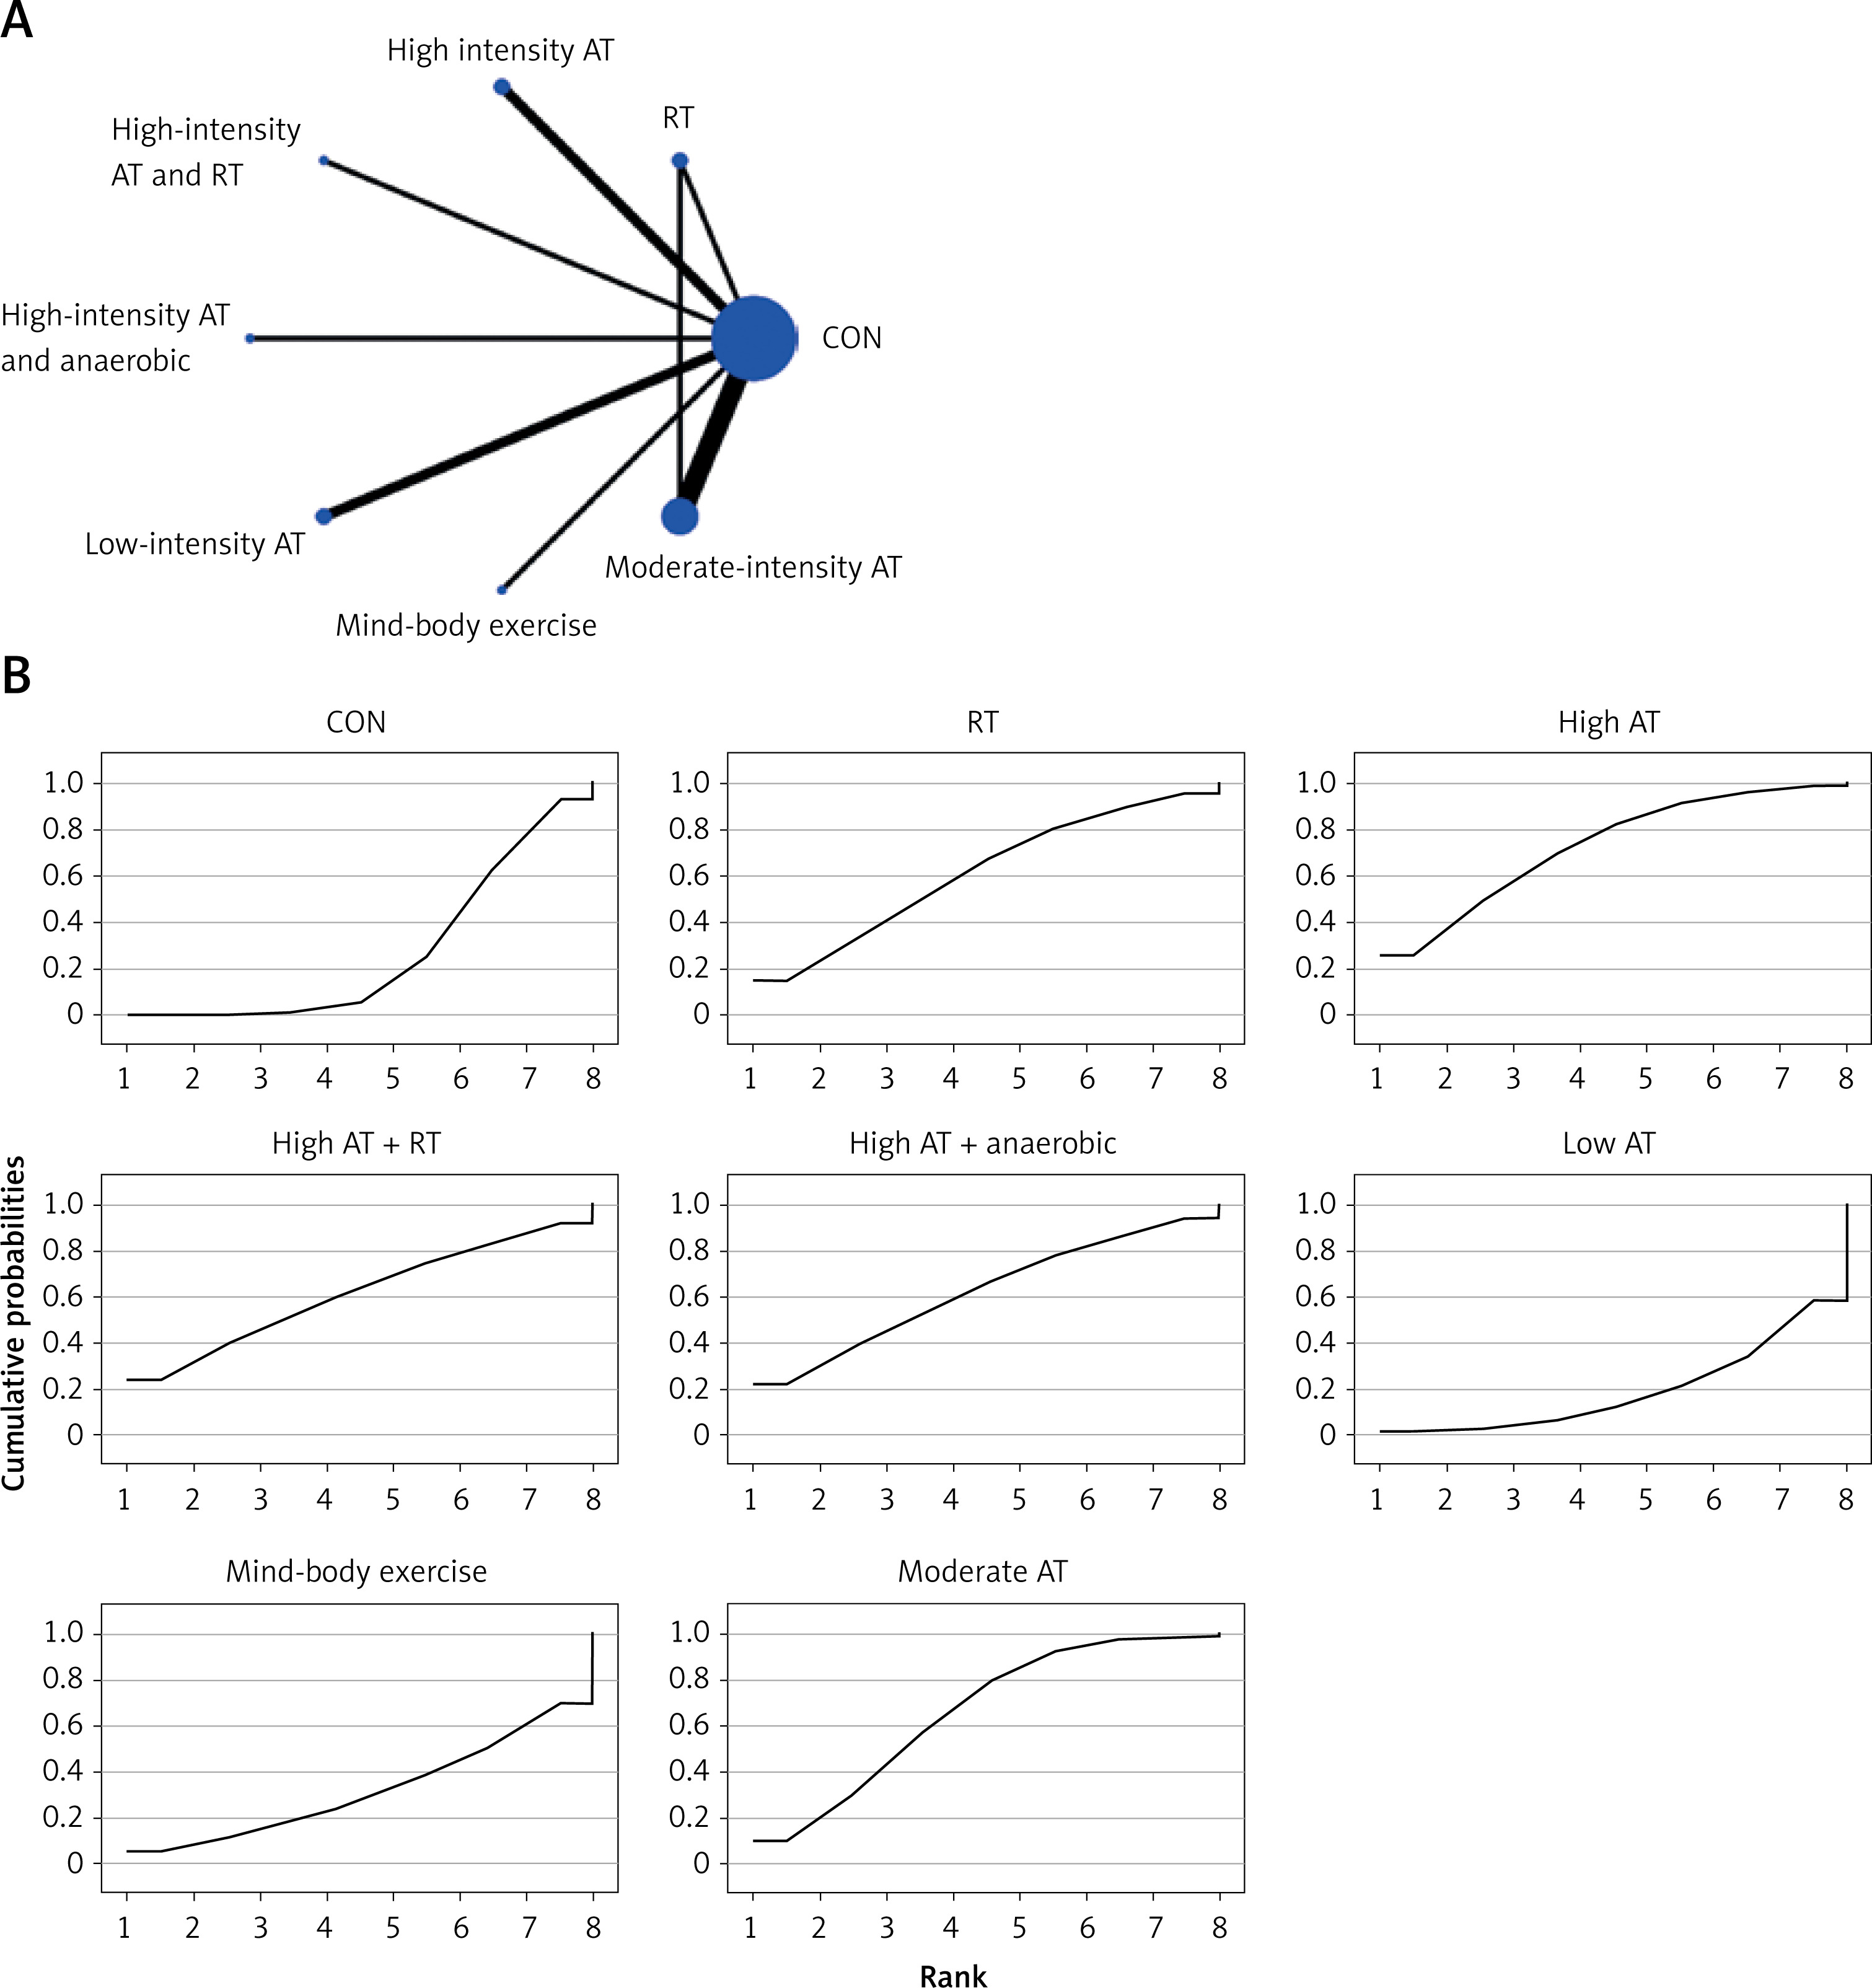
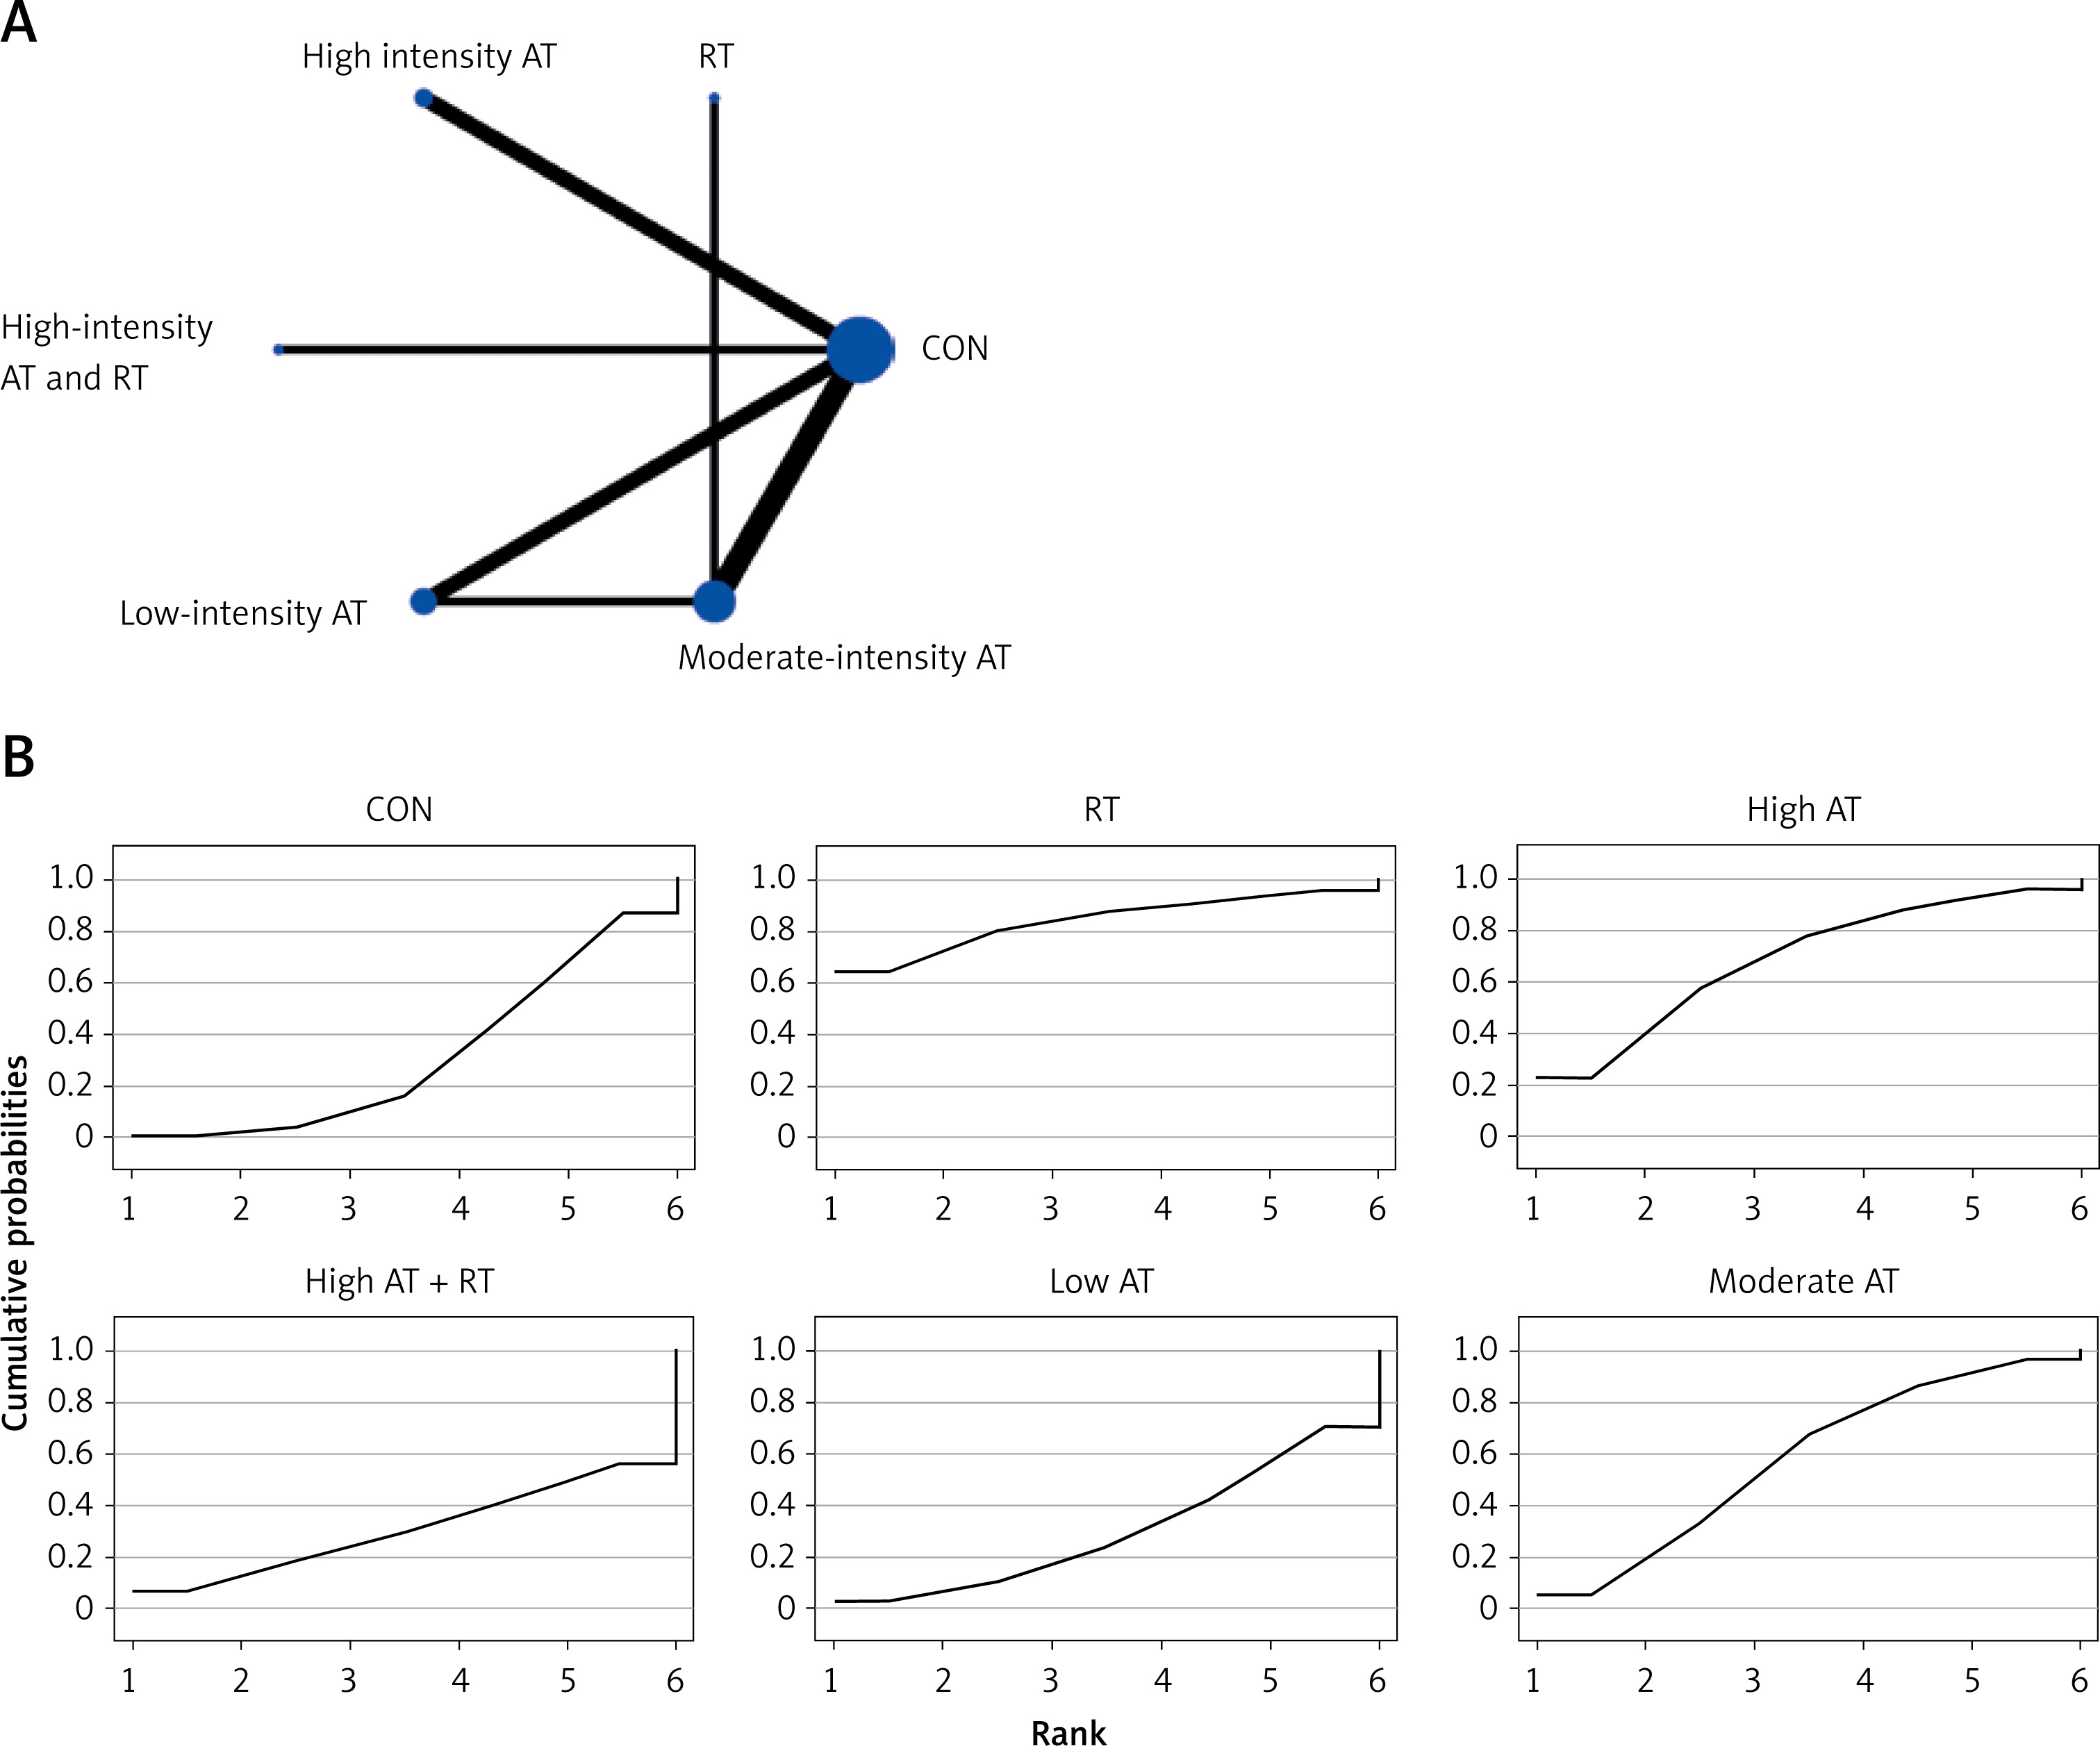
The network evidence plots for each outcome measure are shown in Figures 2 A, 3 A, 4 A, 5 A, 6 A, 7 A, and 8 A.

HbA1c
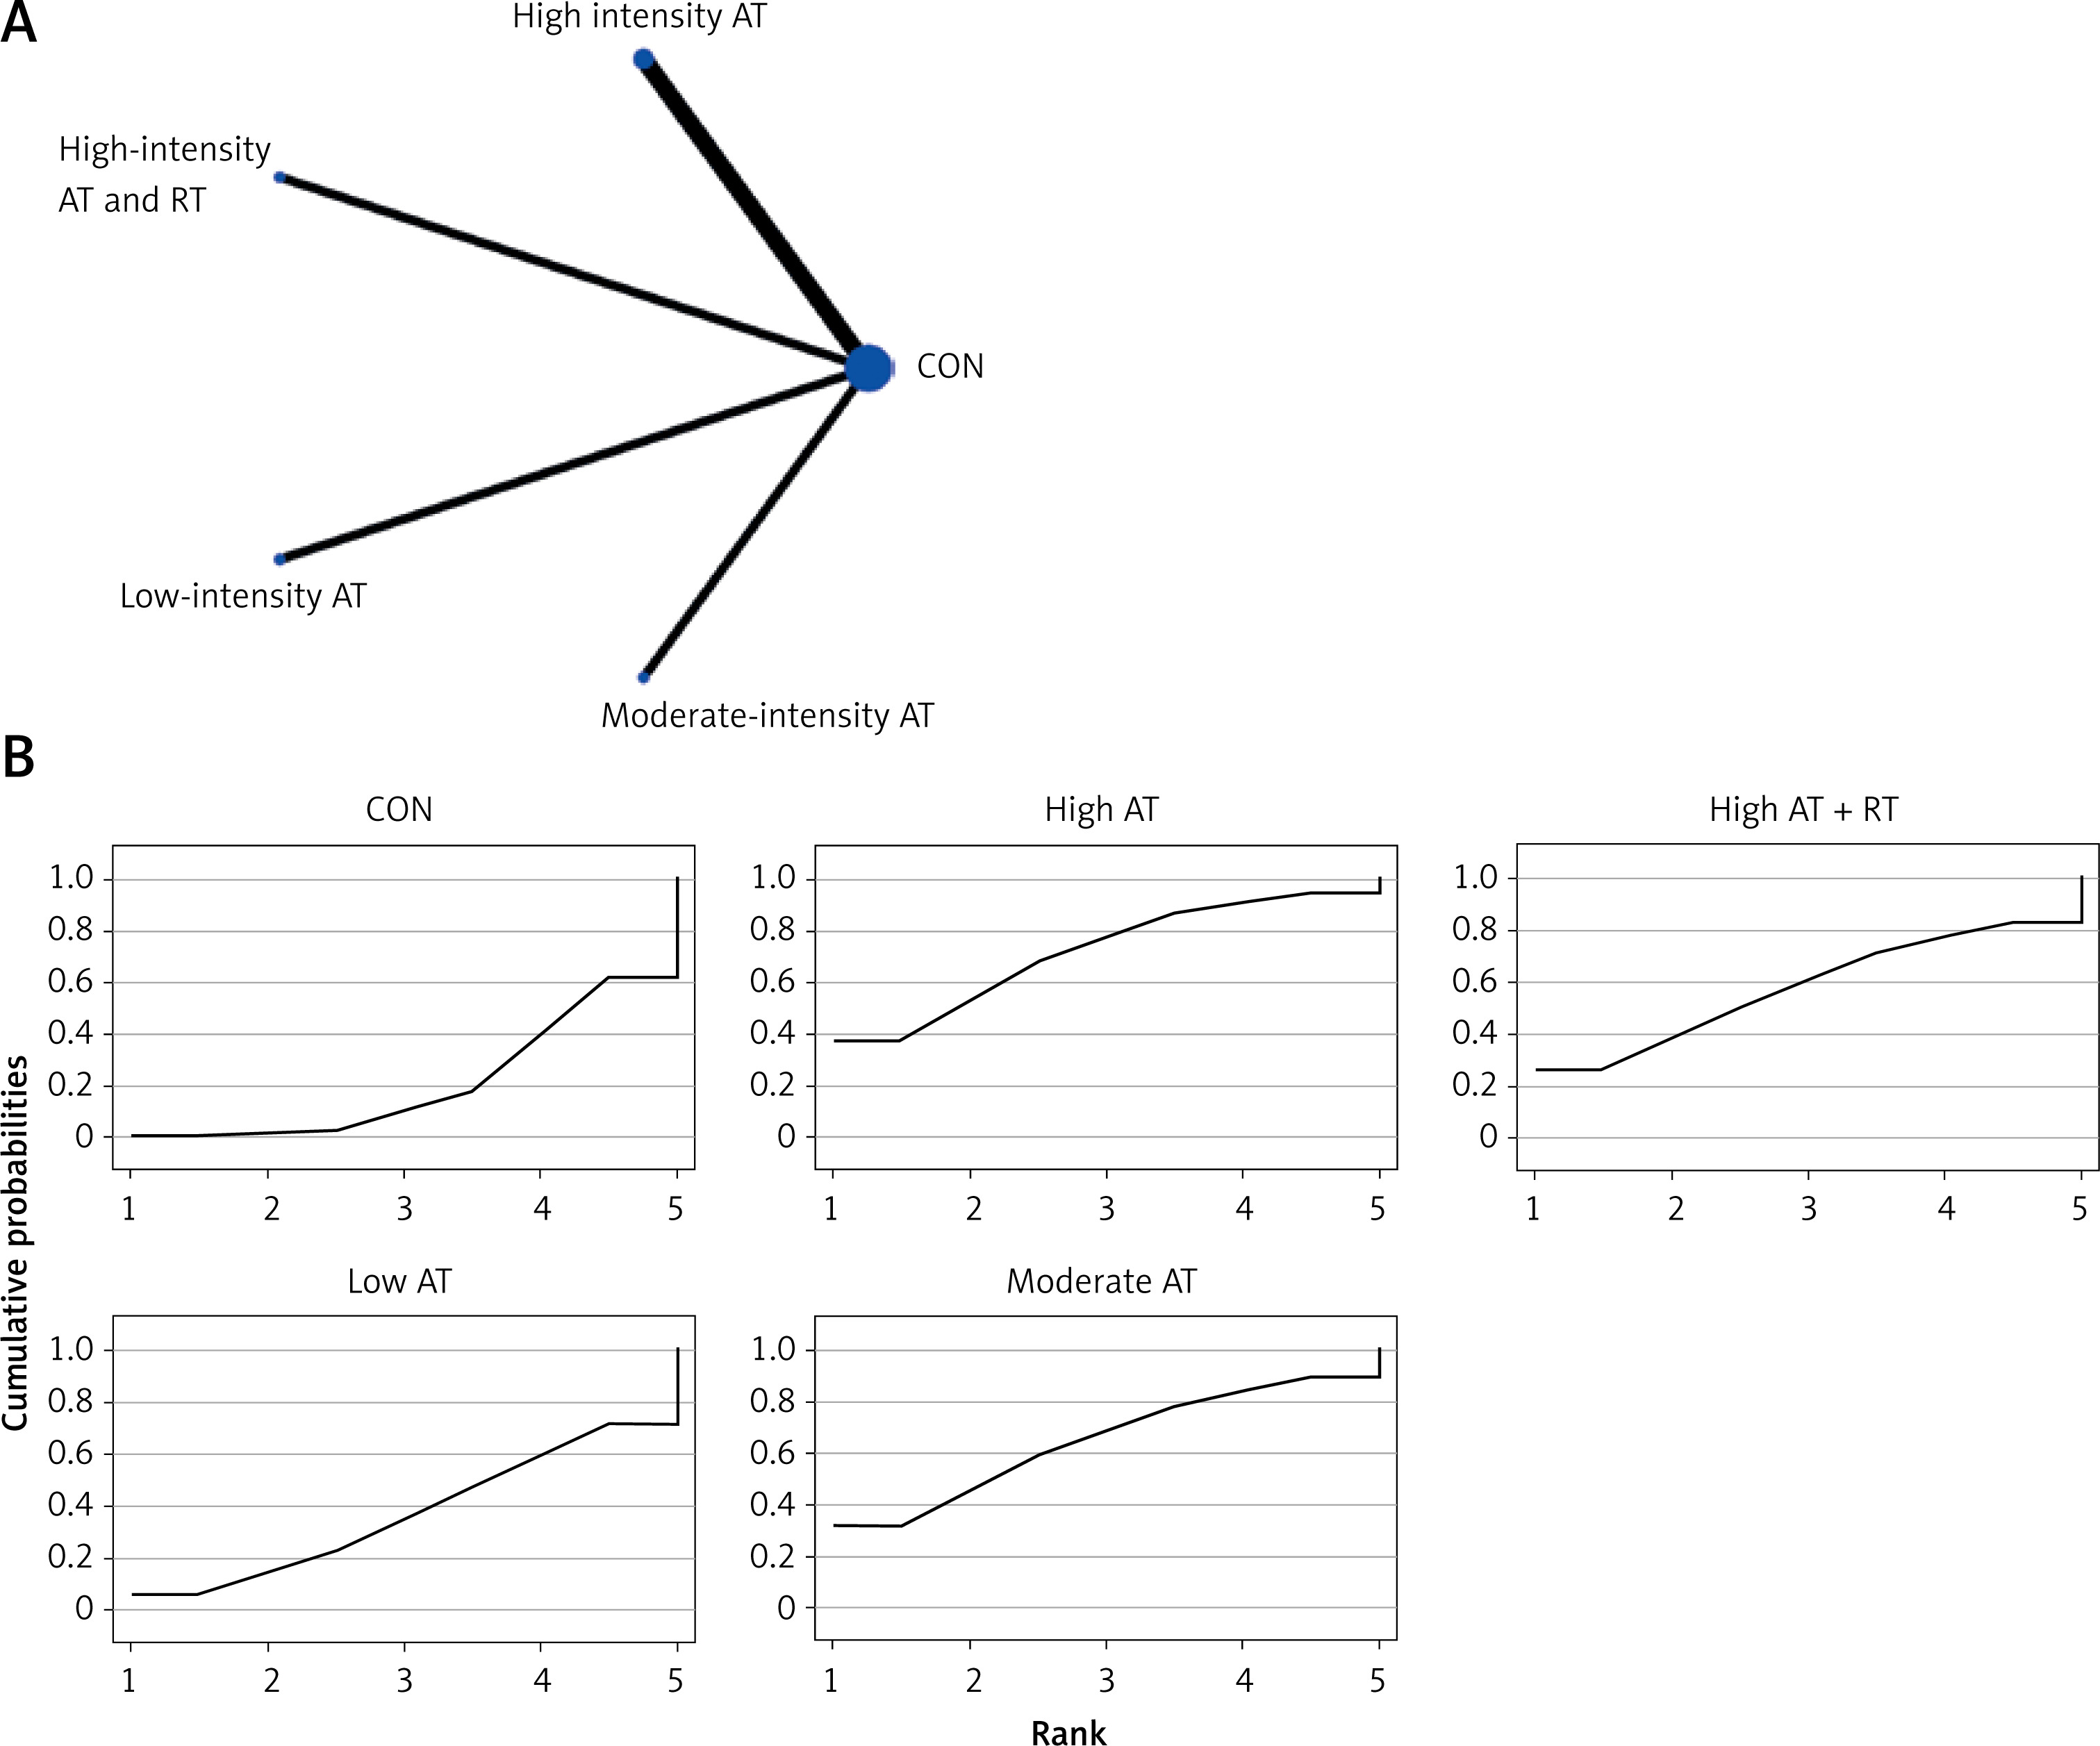
All indirect and direct comparisons between studies were tested for consistency and inconsistency, with p-values greater than 0.05 indicating that the consistency effect across studies is acceptable. Detailed information is provided in Supplementary Table SII. The NMA results revealed that, compared to the control group’s daily activity, high-intensity aerobic training (MD = –1.22, 95% CI = (–2.74, 0.31)), moderate-intensity aerobic training (MD = –0.95, 95% CI = (–2.03, 0.14)), high-intensity aerobic training combined with anaerobic training (MD = –0.93, 95% CI = (–2.99, 1.12)), high-intensity aerobic training combined with resistance training (MD = –0.94, 95% CI = (–3.22, 1.33)), resistance training (MD = –0.87, 95% CI = (–2.57, 0.82)), mind-body exercise (MD = 0.06, 95% CI = (–2.08, 2.20)), and low-intensity aerobic training (MD = 0.40, 95% CI = (–1.13, 1.94)) showed no significant differences in reducing HbA1c (details are presented in Table II A). SUCRA probability rankings for different intensities of exercise interventions showed that high-intensity aerobic training (SUCRA: 72.8%, as shown in Figure 2 B) ranked first in reducing HbA1c.
Table II
A – League table for: A – HbA1c, B – BG, C – VO2 Peak, D – TC, E – TG, F – LDL-C, G – HDL-C
BG
All indirect and direct comparisons between studies were tested for consistency and inconsistency, with p-values greater than 0.05 indicating that the consistency effect across studies is acceptable. Detailed information is provided in Supplementary Table SIII. The NMA results revealed that, compared to the control group’s daily activity, resistance training (MD = –1.19, 95% CI = (–3.06, 0.67)), high-intensity aerobic training (MD = –0.60, 95% CI = (–1.63, 0.42)), moderate-intensity aerobic training (MD = –0.37, 95% CI = (–1.20, 0.46)), moderate-intensity aerobic training combined with resistance training (MD = 0.16, 95% CI = (–1.39, 1.71)), and low-intensity aerobic training (MD = 0.07, 95% CI = (–0.86, 0.99)) showed no significant differences in reducing BG (details are presented in Table II B). SUCRA probability rankings for different intensities of exercise interventions showed that resistance training (SUCRA: 83.7%, as shown in Figure 3 B) ranked first in reducing BG.
VO2 peak
All indirect and direct comparisons between studies were tested for consistency and inconsistency, with p-values greater than 0.05 indicating that the consistency effect across studies is acceptable. Detailed information is provided in Supplementary Table SIV. The NMA results revealed that, compared to the control group’s daily activity, high-intensity aerobic training (MD = 0.55, 95% CI = (–0.21, 1.32)), moderate-intensity aerobic training (MD = 0.48, 95% CI = (–0.44, 1.40)), high-intensity aerobic training combined with resistance training (MD = 0.39, 95% CI = (–0.60, 1.38)), and low-intensity aerobic training (MD = 0.13, 95% CI = (–0.56, 0.82)) showed no significant differences in increasing VO2 Peak (details are presented in Table II C). SUCRA probability rankings for different intensities of exercise interventions showed that high-intensity aerobic training (SUCRA: 71.6%, as shown in Figure 4 B) ranked first in increasing VO2 peak.
TC
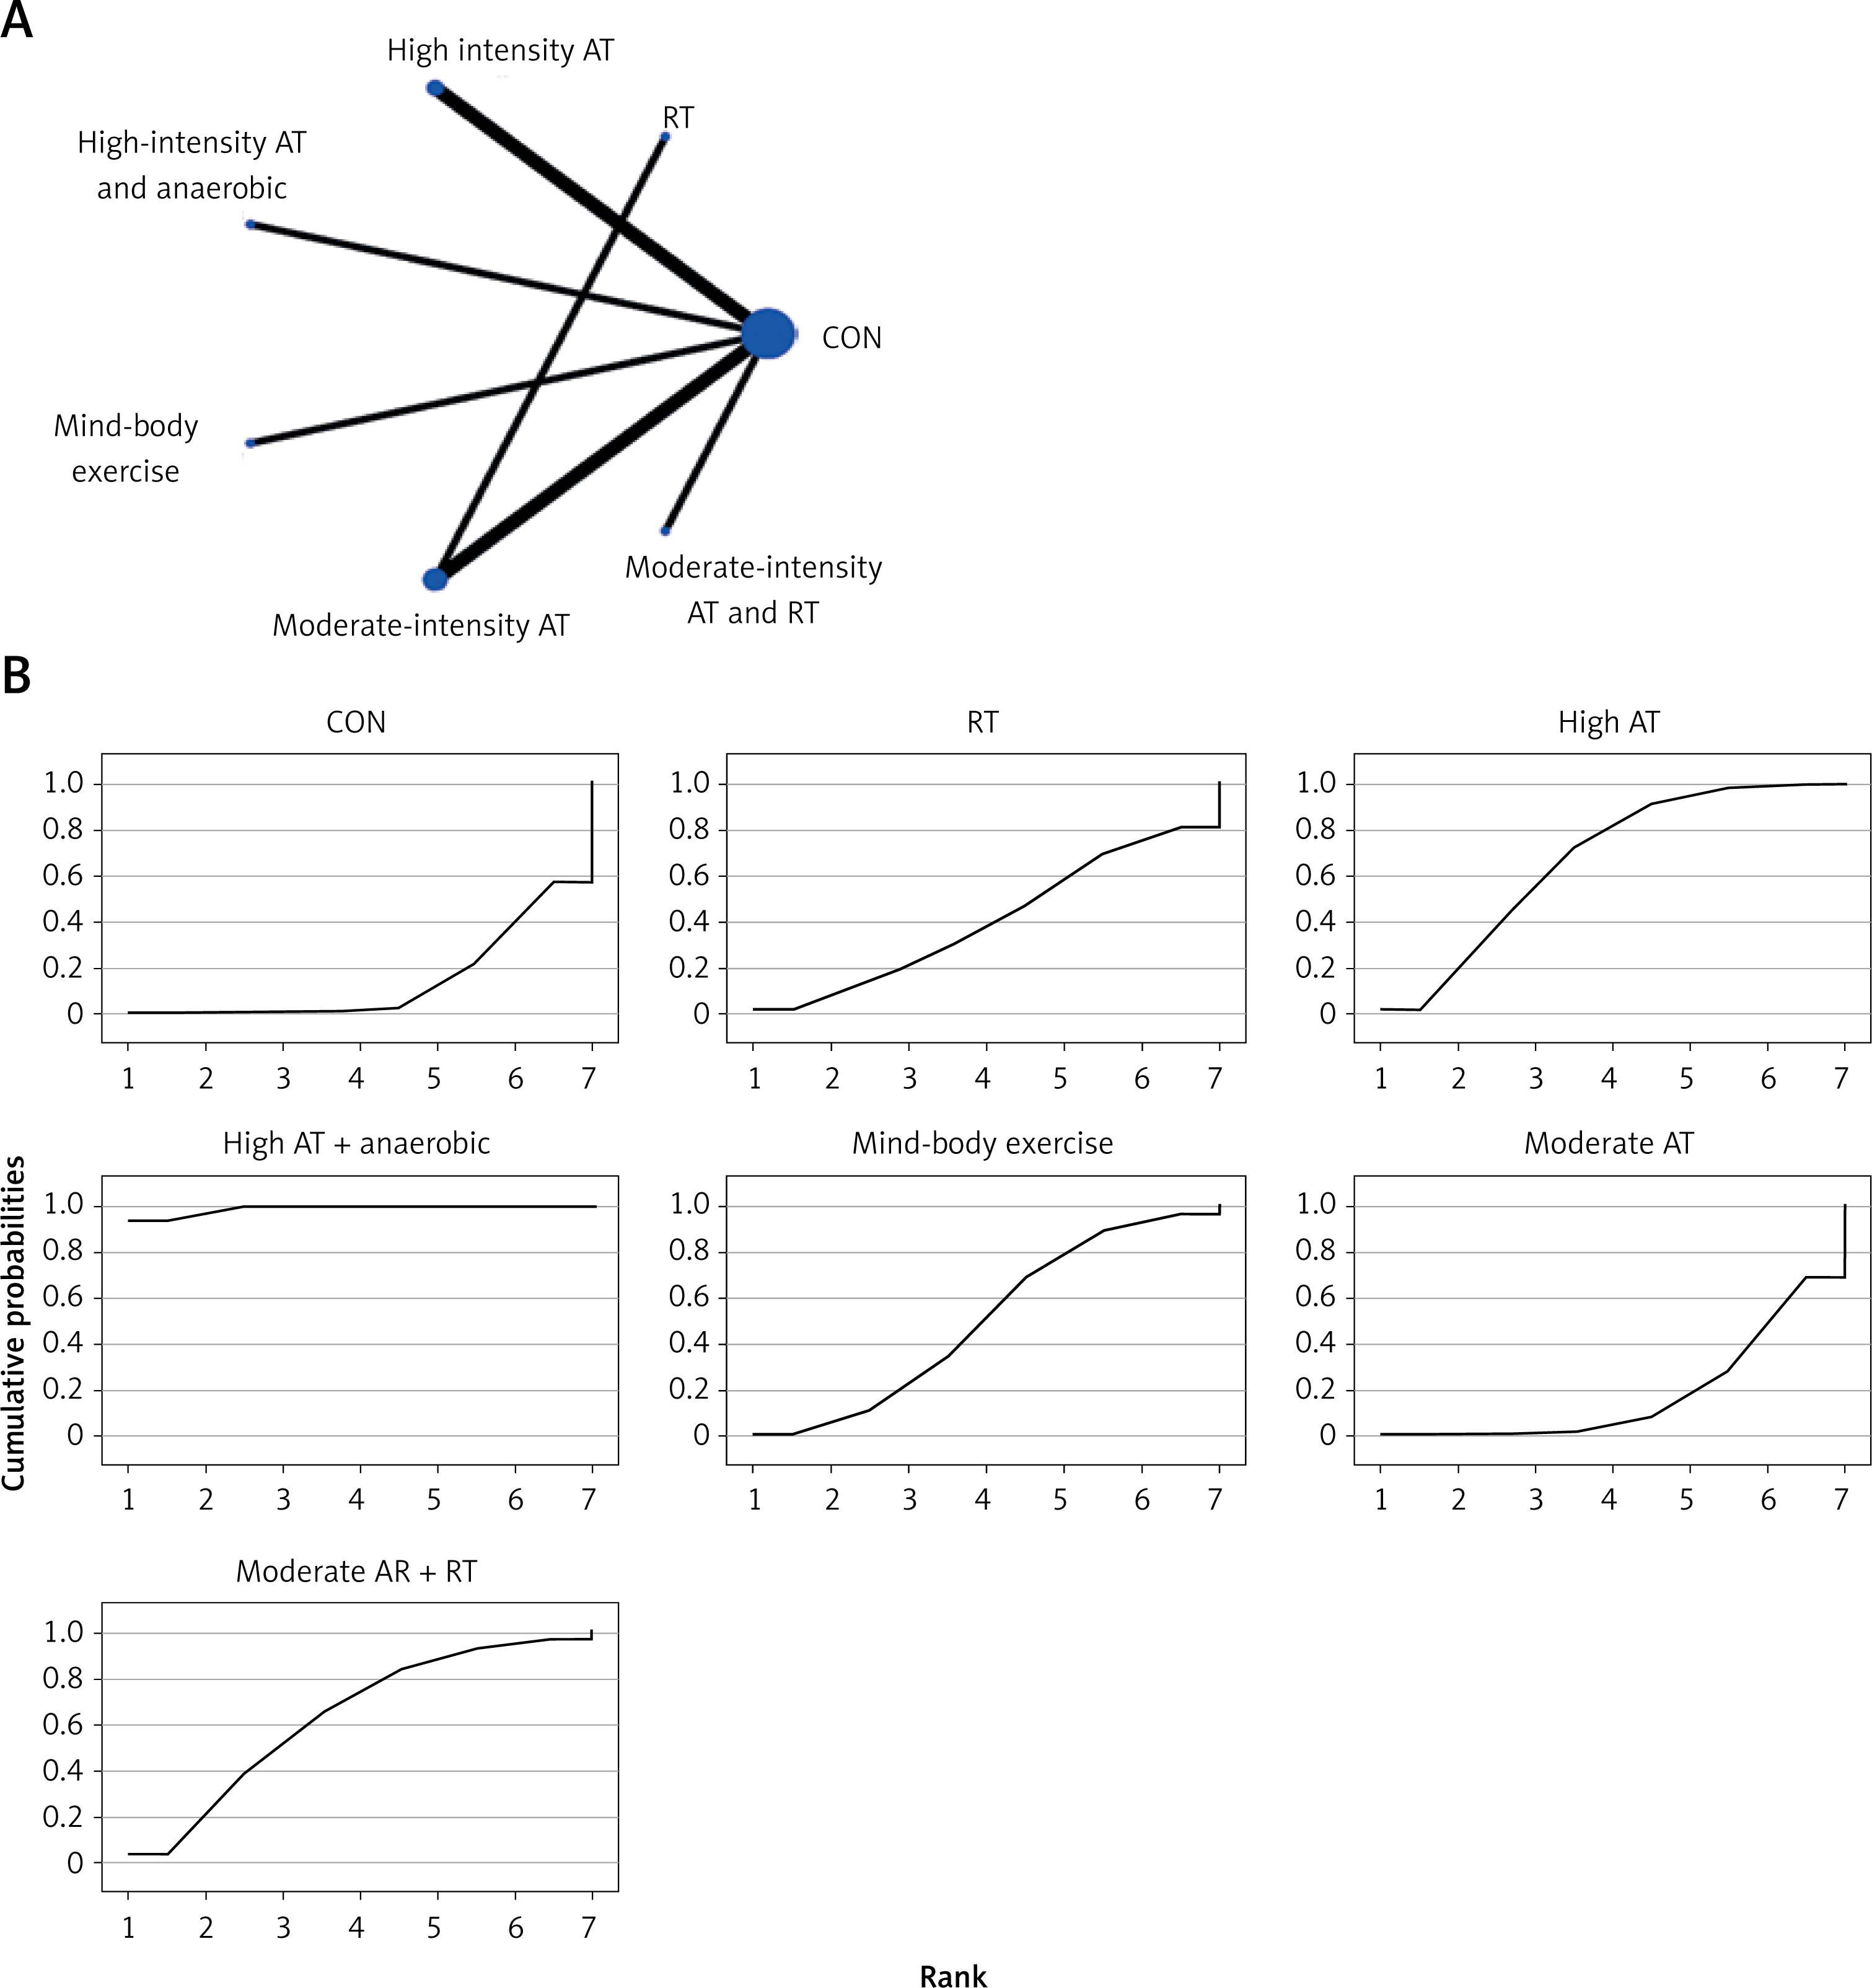
All indirect and direct comparisons between studies were tested for consistency and inconsistency, with p-values greater than 0.05 indicating that the consistency effect across studies is acceptable. Detailed information is provided in Supplementary Table SV. The NMA results revealed that, compared to the control group’s daily activity, high-intensity aerobic training combined with anaerobic training (MD = –1.92, 95% CI = (–2.36, –1.48)) and high-intensity aerobic training (MD = –0.94, 95% CI = (–1.67, –0.21)) were superior in reducing TC (details are shown in Table II D). SUCRA probability rankings for different intensities of exercise interventions showed that high-intensity aerobic training combined with anaerobic training (SUCRA: 98.9%, as shown in Figure 5 B) ranked first in reducing TC.
TG
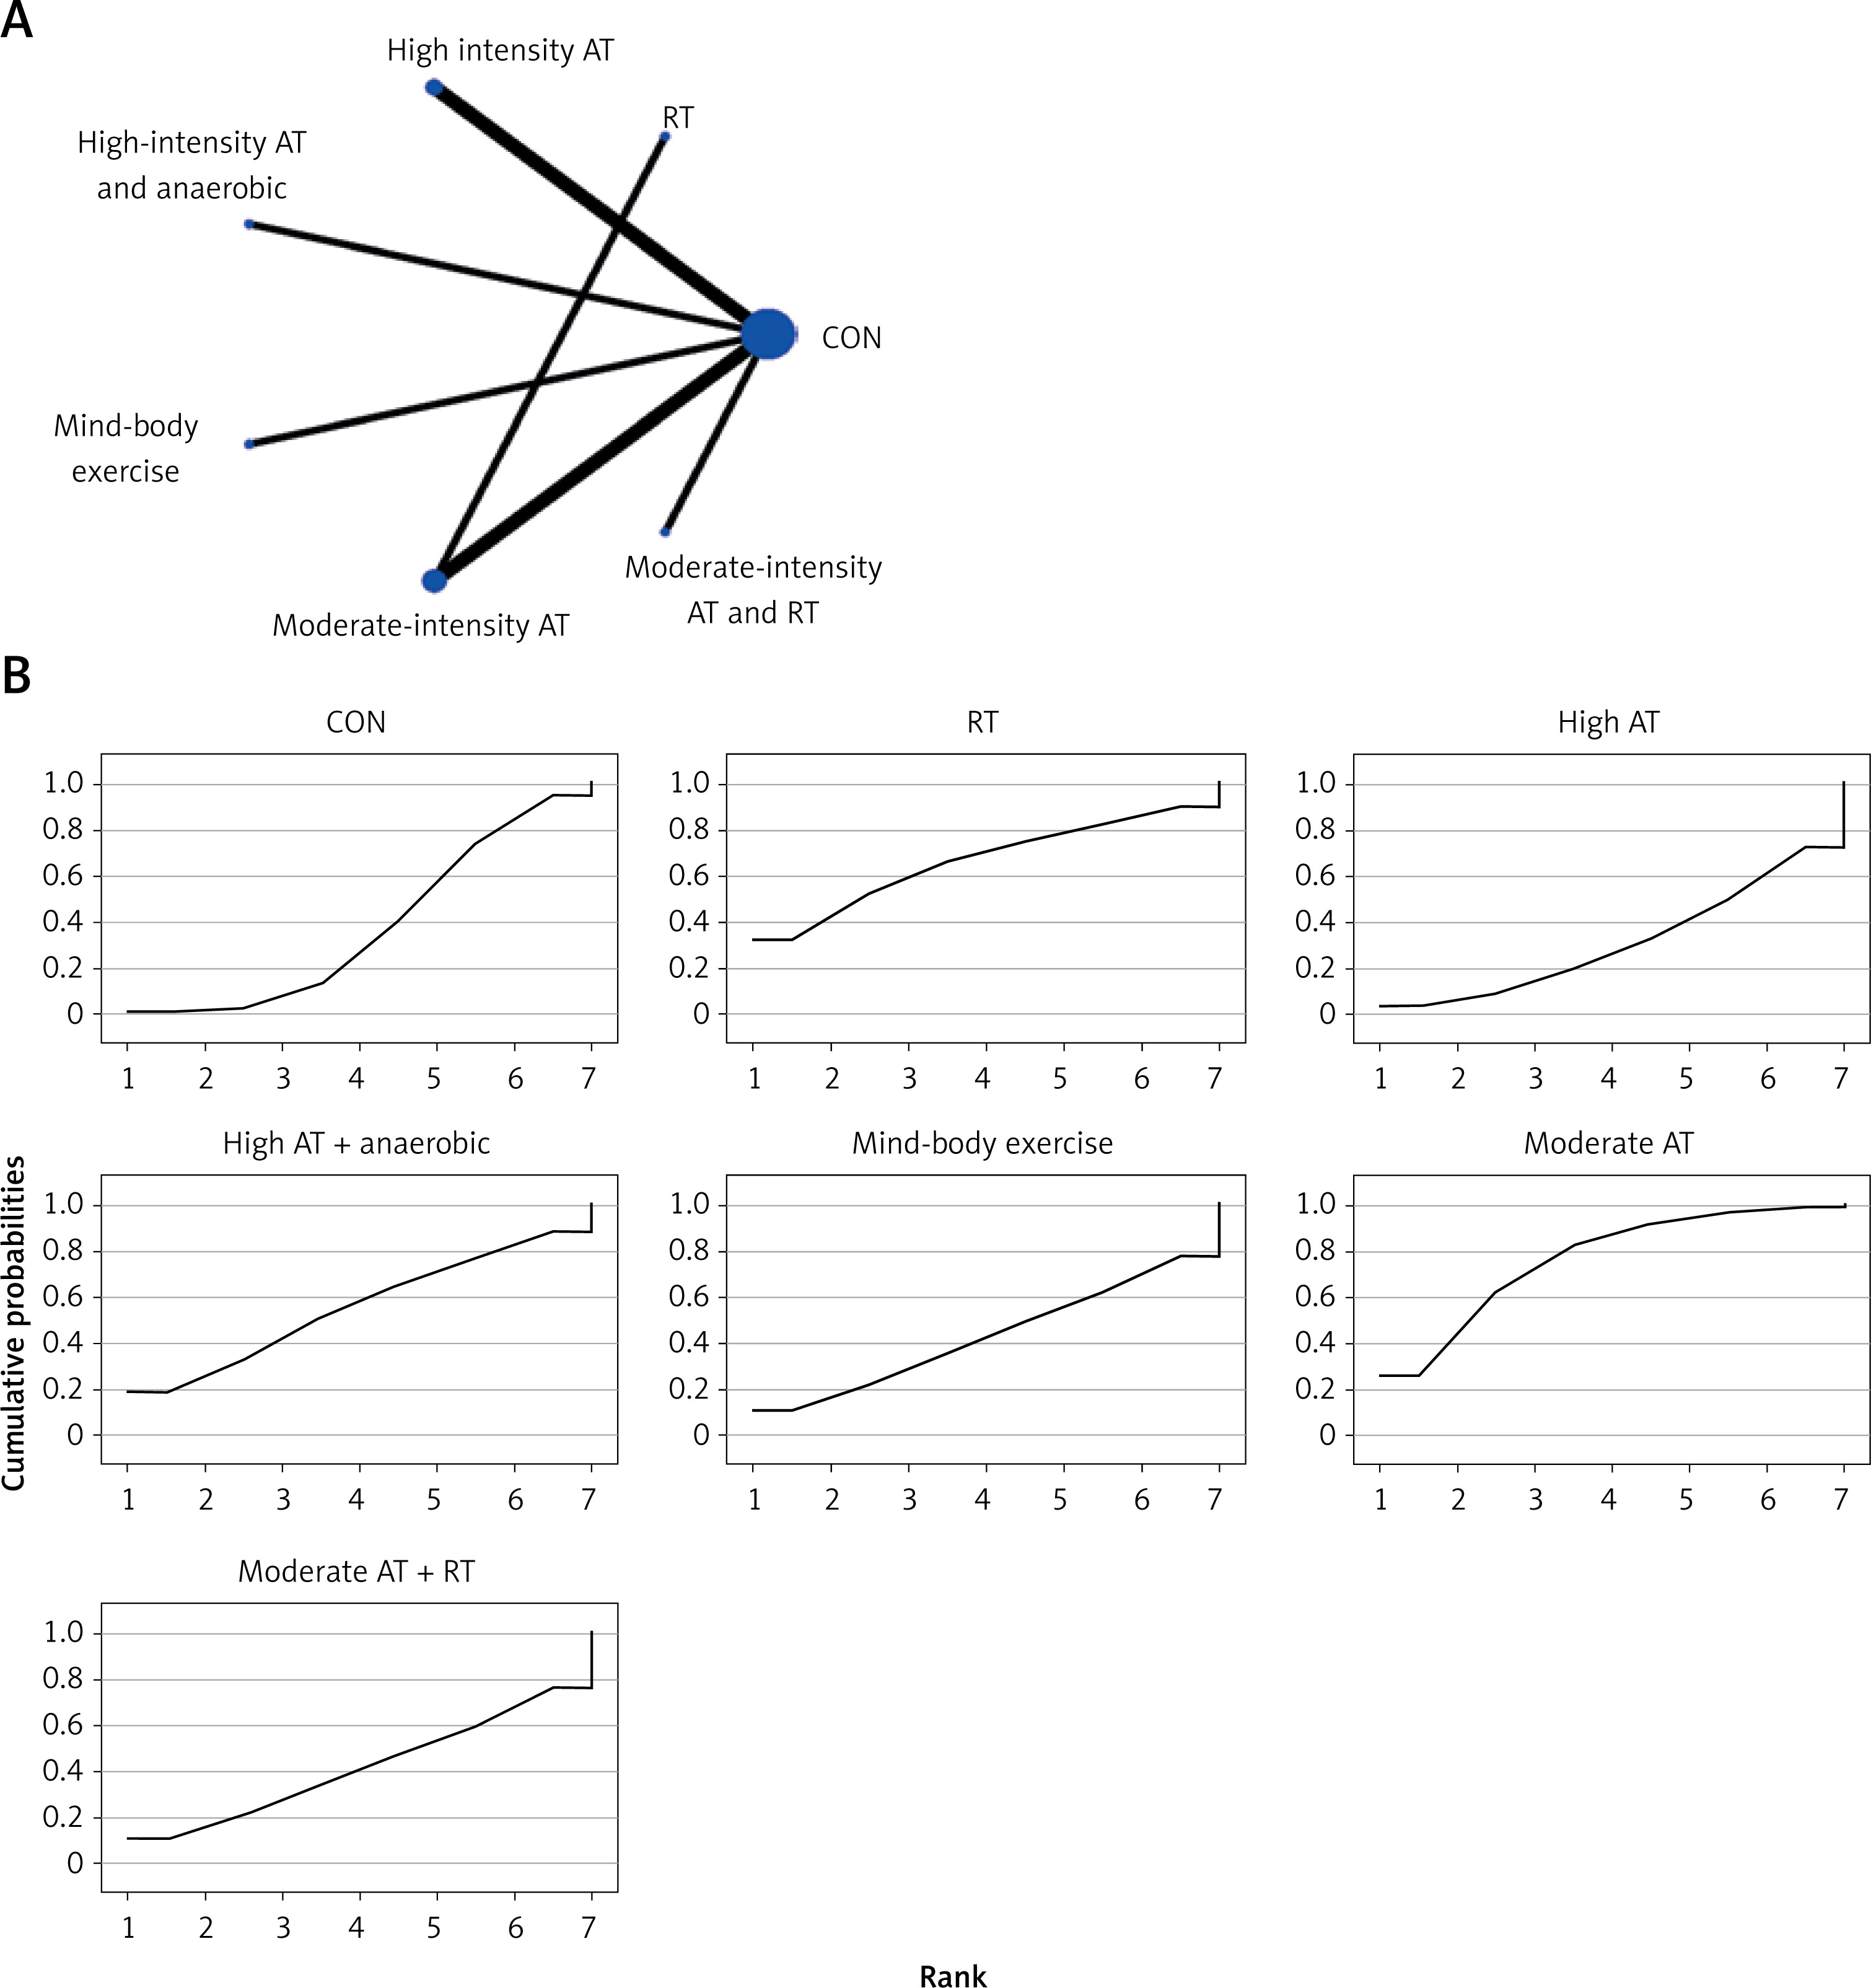
All indirect and direct comparisons between studies underwent consistency and inconsistency tests, with p-values greater than 0.05 indicating that the consistency effect across studies is acceptable. Detailed information is provided in Supplementary Table SVI. The NMA results revealed that, compared to the control group’s daily activity, moderate-intensity aerobic training (MD = –1.32, 95% CI = (–3.23, 0.59)), resistance training (MD = –1.18, 95% CI = (–4.51, 2.16)), high-intensity aerobic training combined with anaerobic training (MD = –0.55, 95% CI = (–3.08, 1.98)), mind-body exercise (MD = –0.10, 95% CI = (–2.70, 2.50)), moderate-intensity aerobic training combined with resistance training (MD = –0.01, 95% CI = (–2.70, 2.68)), and high-intensity aerobic training (MD = 0.29, 95% CI = (–1.64, 2.23)) showed no significant differences in reducing TG (details are provided in Table II E). SUCRA probability rankings for different intensities of exercise interventions indicated that moderate-intensity aerobic training (SUCRA: 76.3%, as shown in Figure 6 B) ranked first in reducing TG.
LDL-C
All indirect and direct comparisons between studies underwent consistency and inconsistency tests, with p-values greater than 0.05 indicating that the consistency effect across studies is acceptable. Detailed information is provided in Supplementary Table SVII. The NMA results revealed that, compared to the control group’s daily activity, high-intensity aerobic training (MD = –1.18, 95% CI = (–1.94, –0.42)) was superior in reducing LDL-C (details are provided in Table II F). SUCRA probability rankings for different intensities of exercise interventions indicated that high-intensity aerobic training (SUCRA: 94.2%, as shown in Figure 7 B) ranked first in reducing LDL-C.
HDL-C
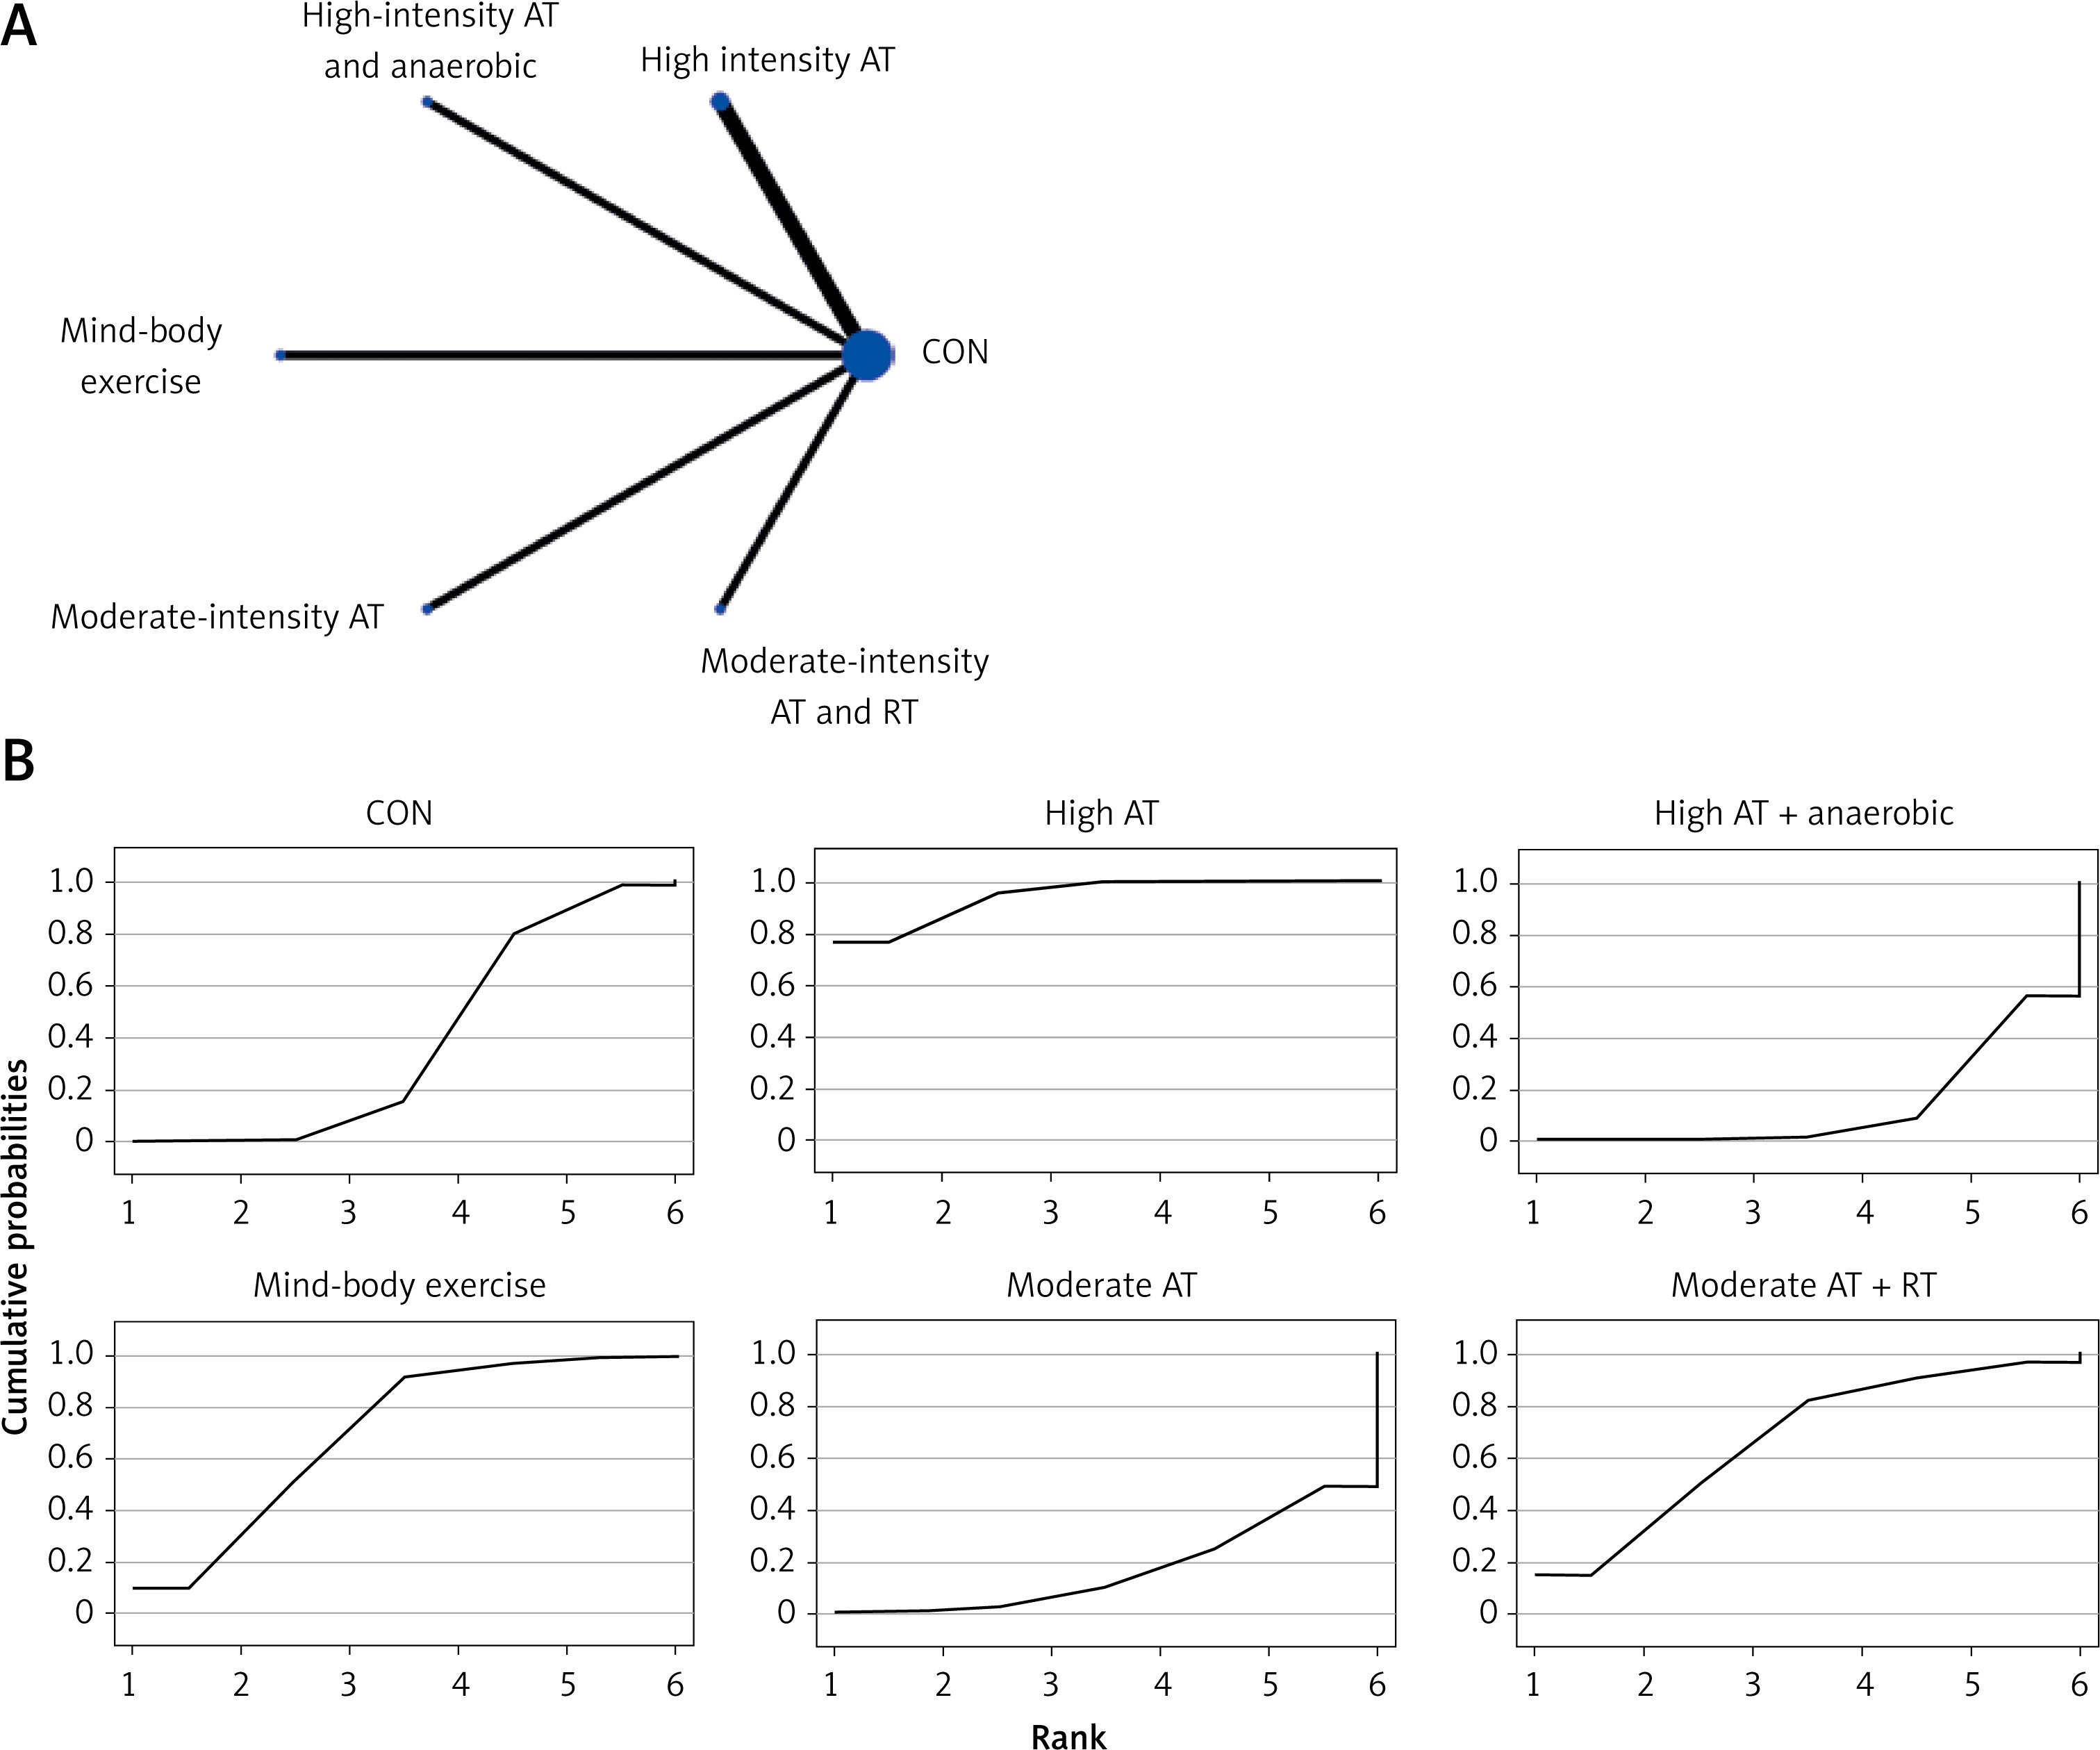
All indirect and direct comparisons between studies were subjected to consistency and inconsistency tests, with p-values greater than 0.05 indicating that the consistency effect across studies is acceptable. Detailed information is presented in Supplementary Table SVIII. The NMA results demonstrated that, compared to the control group’s daily activity, high-intensity aerobic training combined with anaerobic training (MD = 1.63, 95% CI = (1.21, 2.05)) was more effective in increasing HDL-C (further details are presented in Table II G). SUCRA probability rankings for various exercise intensities indicated that high-intensity aerobic training combined with anaerobic training (SUCRA: 100%, as shown in Figure 8 B) was the most effective intervention for increasing HDL-C.
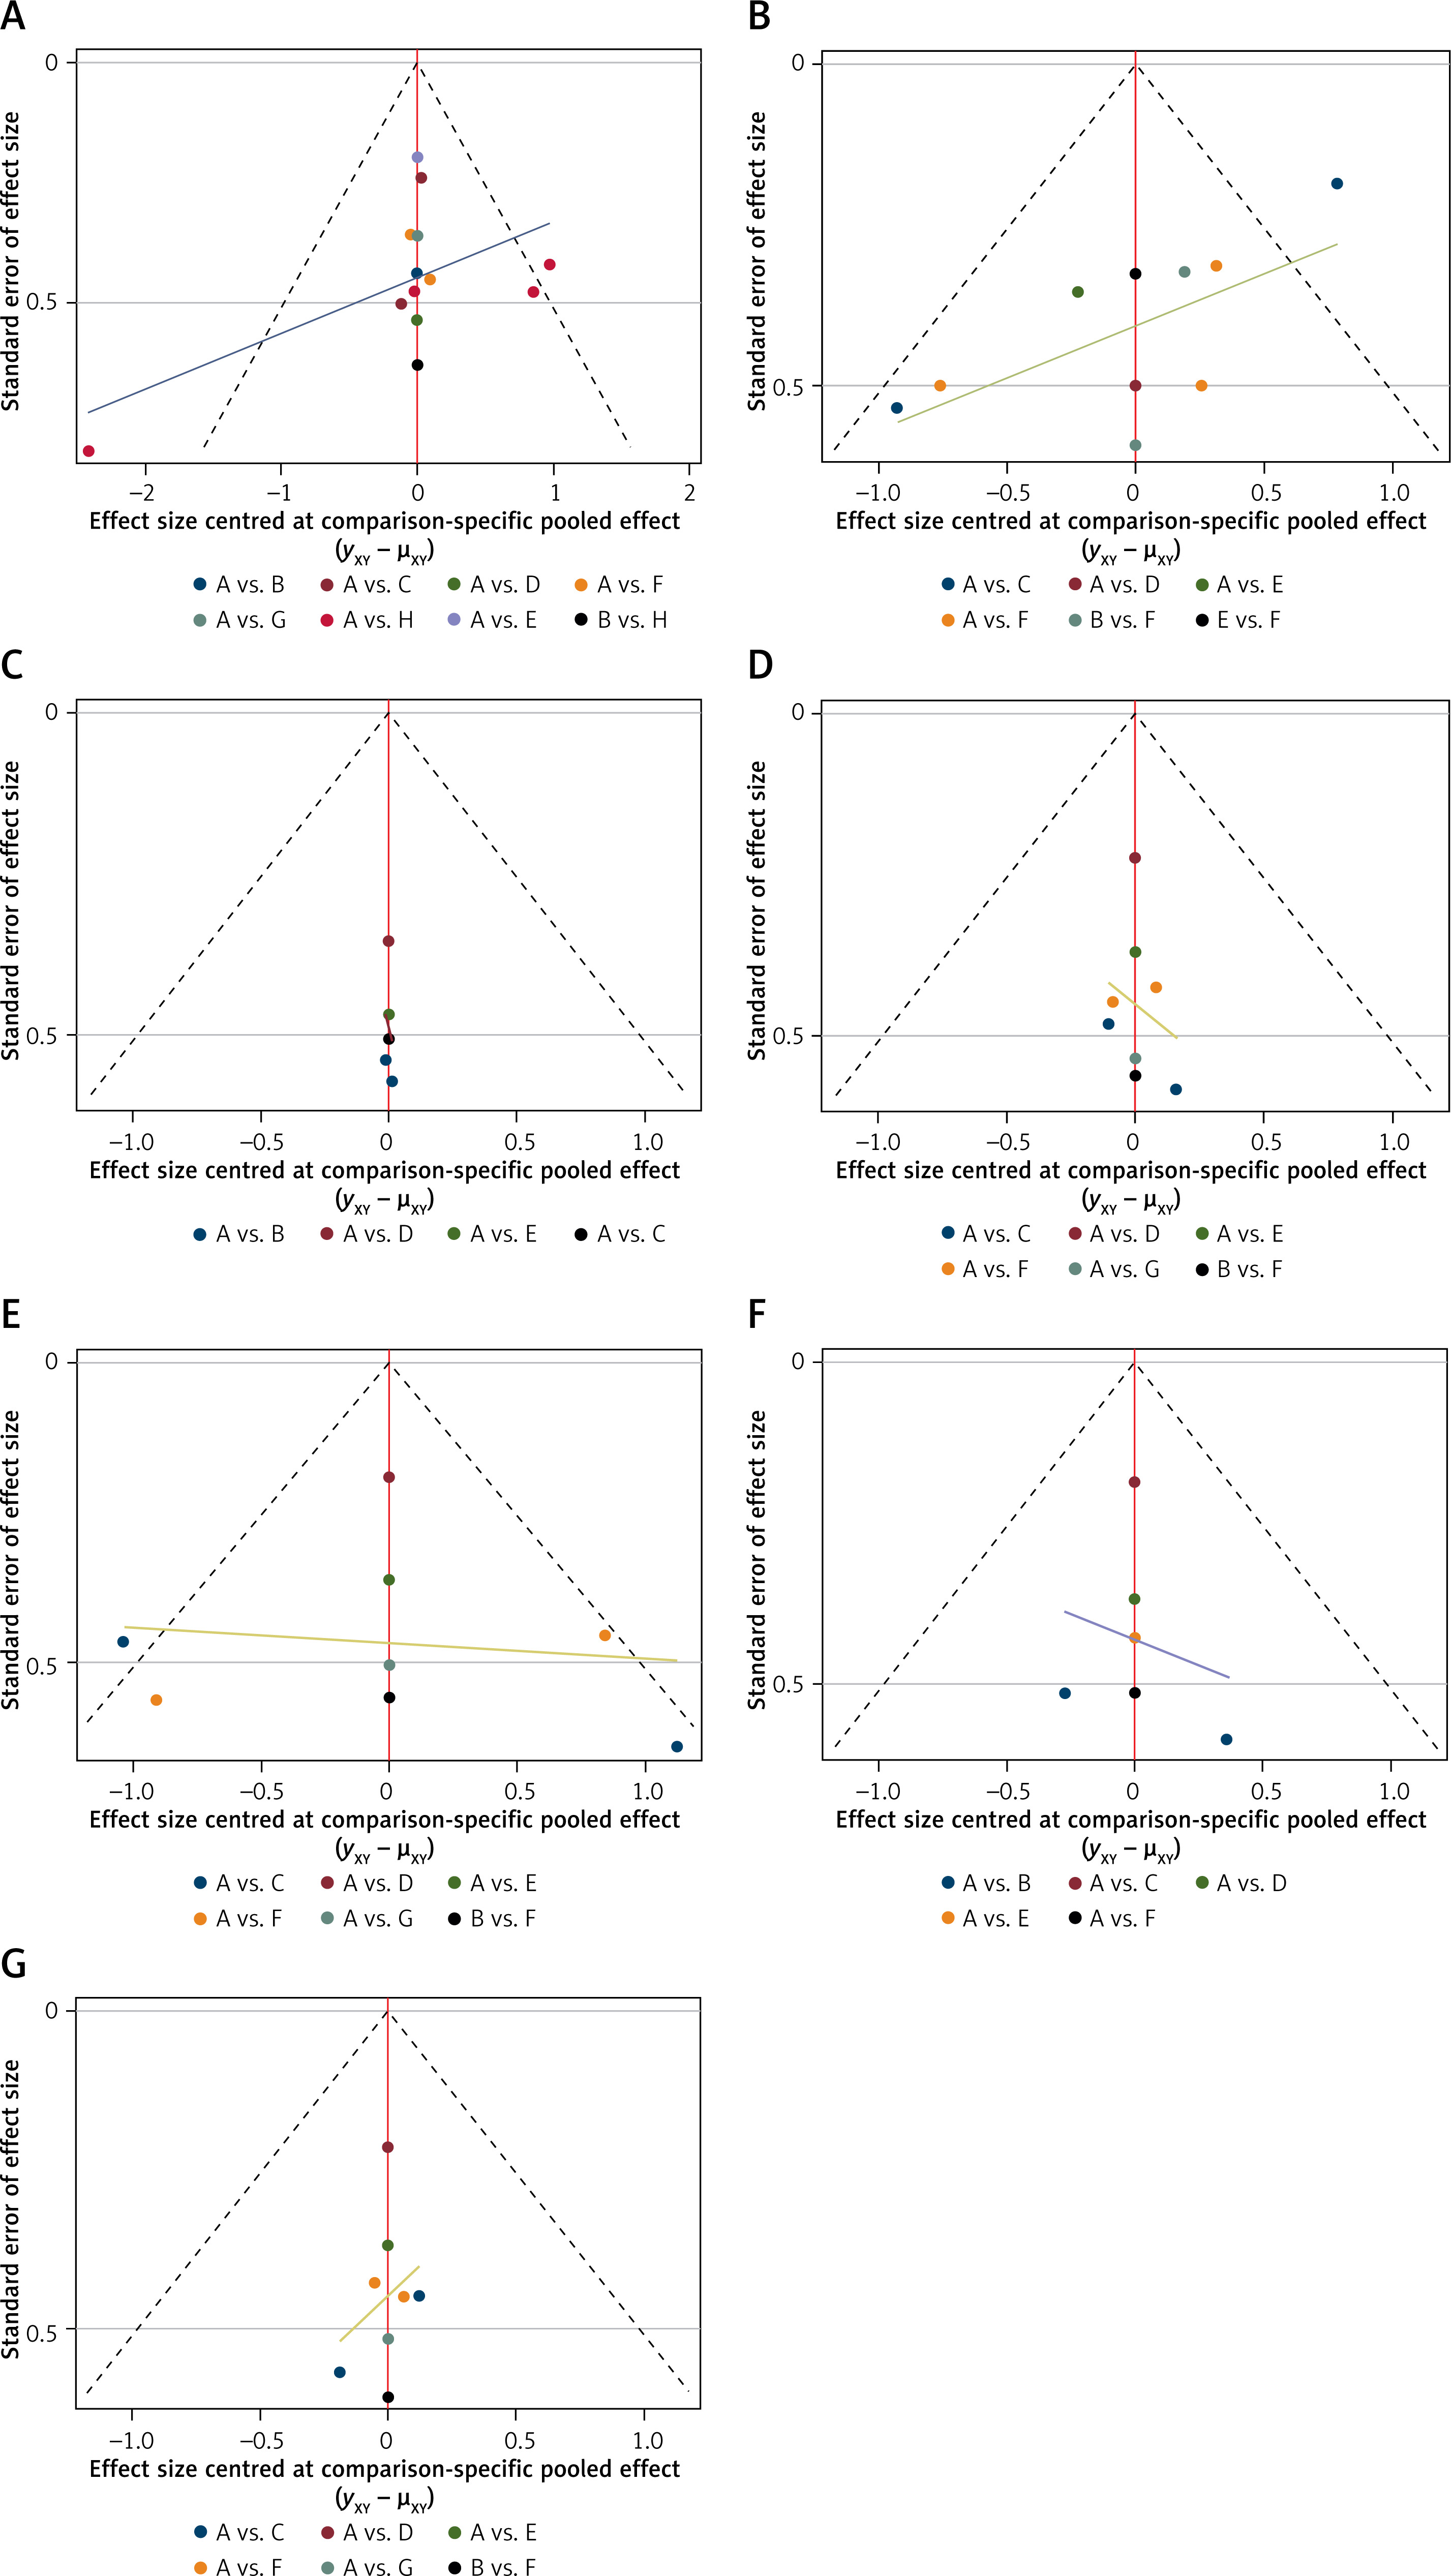
Publication bias test
To evaluate the potential for publication bias, funnel plots were generated for each outcome indicator. The plots did not demonstrate any significant publication bias (further details are provided in Figures 9 A–G).
Discussion
In this study, we compared the effectiveness of various types and intensities of exercise interventions on the improvement of metabolic and cardiopulmonary functions in children and adolescents diagnosed with T1DM. We conducted both direct and indirect comparisons of 19 studies, involving 738 children and adolescents diagnosed with T1DM, with 8 distinct types of exercise interventions. Our findings indicate that exercise did not have a significant effect on BG levels and HbA1c control. However, significant improvements were observed in TC, LDL-C, and HDL-C. Specifically, we found that high-intensity aerobic training combined with anaerobic training and high-intensity aerobic training were effective in lowering TC, with high-intensity aerobic training combined with anaerobic training proving to be the most effective intervention for reducing TC. High-intensity aerobic training was identified as the most effective intervention for lowering LDL-C. Additionally, high-intensity aerobic training combined with anaerobic training emerged as the most effective intervention for improving HDL-C. Overall, we conclude that high-intensity aerobic training combined with anaerobic training and high-intensity aerobic training are the most effective interventions for improving the metabolic function of children with T1DM.
In this study, among the eight exercise interventions, the high-intensity aerobic training group showed reduced HbA1c, although it was not statistically significant. However, a systematic review published in 2024 indicated that multi-component exercise could significantly reduce HbA1c [2]. A 2023 systematic review found that high-intensity concurrent training had the most significant effect in reducing HbA1c [3]. An RCT published in 2006 [15] divided T1DM adolescents into two groups: one group performed aerobic training, and the other performed resistance training. After 12 weeks, neither group showed significant improvements in HbA1c. Additionally, Kennedy et al. [4] reported that both aerobic training and aerobic training combined with resistance training did not significantly impact the control of HbA1c or BG. The results of various studies exhibit certain degrees of variability. Several factors may contribute to the observed heterogeneity: First, differences in the inclusion and exclusion criteria among the studies could lead to inconsistent outcomes. Second, variations in the type, intensity, and duration of exercise across studies may also contribute to the heterogeneity. Finally, HbA1c has lower sensitivity than BG and reflects BG control over the past 2–3 months, which may not accurately represent the current metabolic status of the body [4]. Furthermore, increases in caloric intake and reductions in insulin dosage prior to exercise could also lead to variations in results. This study suggests that high-intensity aerobic training may reduce HbA1c due to the excessive expression of GLUT4 in skeletal muscle during exercise. As a key glucose transporter protein, GLUT4 is typically associated with enhanced glucose processing and insulin action. Some researchers have observed increased GLUT4 expression in skeletal muscle during high-intensity aerobic training, which may improve insulin sensitivity, glucose processing, and glycogen storage [30]. Additionally, high-intensity aerobic training can activate AMP-activated protein kinase, which reduces hepatic gluconeogenesis and improves HbA1c [31]. However, in children and adolescents with T1DM, some researchers have observed that the secretion of glucagon and epinephrine during exercise is significantly lower than that in healthy children and adult patients, which leads to insufficient hepatic glycogen output [32]; in addition, compared with adults, children and adolescents had low expression of GLUT4 transporter and insufficient glycogen synthase activity [33]. Therefore, the lack of statistical significance may be related to variations in exercise interventions, follow-up duration, insufficient secretion of counter-regulatory hormones, low efficiency of muscle glycogen metabolism, and baseline metabolic status. This study suggests that resistance training may potentially reduce BG in children and adolescents with T1DM, although the effect was not statistically significant. In other studies [34], resistance training is typically combined with other forms of exercise interventions, making it unclear whether isolated resistance training has the potential to reduce BG; furthermore, researchers often focus on HbA1c as the primary outcome measure, without investigating BG [35]. A previously published RCTs [29] found that isolated resistance training can significantly reduce BG both before and after exercise, which is consistent with the findings of this study. This study examined the effects of different exercise types on BG levels and found, according to SUCRA rankings, that resistance training had the most significant effect, followed by high-intensity aerobic training. This is because resistance training can increase muscle mass and improve glucose tolerance, as muscle tissue is the optimal area for utilizing residual energy substrates and insulin [35]. While BG may not decrease significantly during exercise, it remains lower for an extended period afterward [36]. In contrast, although aerobic training can significantly reduce immediate BG levels, the reduction is less noticeable unless performed consistently over the long term.
This study suggests that high-intensity aerobic training is the most effective exercise modality for increasing VO2 peak, which is consistent with previous research findings [19, 20]. Additionally, some scholars argue that high-intensity interval training (HIIT) is more effective than moderate-intensity continuous training (MICT) in improving VO2 peak [37]. This is because high-intensity aerobic training can increase left ventricular volume and myocardial contractility, thereby enhancing stroke volume [38]. It also promotes coronary angiogenesis, improving myocardial metabolism and oxygen supply. Furthermore, high-intensity aerobic training stimulates erythropoietin secretion, increasing red blood cell count and enhancing oxygen transport capacity. It also facilitates a decrease in blood pH, causing a rightward shift in the oxygen dissociation curve, which releases more oxygen [39]. Moreover, studies have shown that 6 weeks of high-intensity aerobic training can induce mitochondrial proliferation in skeletal muscles, significantly improving VO2 peak [38].
This study suggests that high-intensity aerobic training combined with anaerobic training is the most effective exercise intervention for lowering TC and increasing HDL-C, while high-intensity aerobic training is the best intervention for reducing LDL-C, and moderate-intensity aerobic training is the most effective for TG. High-intensity aerobic training activates AMP-activated protein kinase in skeletal muscles, enhancing mitochondrial fatty acid oxidation, accelerating the clearance of free fatty acids, inhibiting very-low-density lipoprotein (VLDL-C) synthesis, and ultimately lowering TC. Additionally, high-intensity aerobic training can downregulate the activity of HMG-CoA reductase, reducing endogenous cholesterol synthesis [30, 40, 41]. Anaerobic training increases muscle mass, which influences lipoprotein metabolism and regulates lipid receptor pathways to reduce blood lipids [42]. Furthermore, HDL-C is responsible for reverse cholesterol transport [43]; the enhanced reverse cholesterol transport can upregulate HDL-C synthesis [37, 40]. These findings confirm the synergistic effect of high-intensity aerobic training combined with anaerobic training in improving TC and HDL-C. Studies published in 2008 and 2012 suggested that moderate-intensity aerobic training is more effective than high-intensity aerobic training in lowering TG [44, 45]. These findings align with the results of this study. Possible reasons are as follows: high-intensity aerobic training provides energy through glycogen breakdown, which leads to lactate accumulation and temporary insulin resistance, potentially reducing the mobilization of TG [46]. On the other hand, moderate-intensity aerobic training can provide energy through fat oxidation, with adipose tissue releasing free fatty acids into the bloodstream. Skeletal muscles then take up these free fatty acids, enhancing lipoprotein lipase activity to hydrolyze TG, which results in a decrease in TG levels [47]. Additionally, moderate-intensity aerobic training can activate AMP-activated protein kinase, promote mitochondrial biogenesis, improve insulin sensitivity, and reduce TG synthesis [46]. High-intensity aerobic training lowers VLDL, promotes the transfer of TC to HDL-C, and increases LDL-C receptor activity, thereby indirectly lowering LDL-C levels [31]. This study suggests that high-intensity aerobic training is the best intervention for improving LDL-C levels. In comparison, high-intensity aerobic training combined with anaerobic training yields slightly less favorable results, which may be due to the combination of different exercise forms and increased metabolic stress, possibly suppressing LDL-C receptor expression or increasing VLDL secretion, ultimately leading to variations in energy expenditure or metabolic adaptation [48]. Some researchers believe that both intense and moderate-intensity exercise can reduce TC, TG, and LDL-C [41, 49]. A systematic review published in 2025 [50] suggested that combined exercise is more effective than aerobic training alone in significantly lowering TC. Both combined exercise and aerobic training can reduce TG and LDL-C. The differences in study outcomes may be attributed to confounding factors such as sample size, intervention duration, whether participants strictly controlled their diet, and personal lifestyle factors.
Beyond the aforementioned exercise regimens, the total daily physical activity volume (e.g., daily step count) and its quality (e.g., movement rhythm/step frequency) may also exert significant influences on metabolic and cardiopulmonary outcomes in children and adolescents with T1DM. Recent research indicates that in adults, a significant nonlinear inverse association exists between daily step count and all-cause and cardiovascular disease mortality, where accumulating as few as 4,000 steps per day significantly reduces all-cause mortality, with progressively greater mortality reduction observed at higher step volumes [51]. Although direct data for children and adolescents remain limited, extrapolating these findings to the youth population suggests that setting step-based activity goals (especially for sedentary individuals) could serve as a beneficial adjunct to structured exercise interventions. Furthermore, movement rhythm or step frequency (cadence, steps/minute) can function as a practical indicator for assessing exercise intensity. Higher cadence (e.g., during brisk walking or running) is strongly associated with improved cardiopulmonary fitness and metabolic health [52]. This perspective aligns well with a key finding of the present study: that high-intensity aerobic training demonstrated optimal efficacy for improving the lipid profile (e.g., reducing LDL-C), and high-intensity training is typically accompanied by a higher movement cadence. This underscores that in T1DM management, attention should extend beyond the form and intensity of exercise (as evaluated by the various regimens in this study) to also encompass the total volume (steps) and quality (cadence/intensity) of daily activities [51, 52]. The SMILE guidelines from the International Lipid Expert Panel (ILEP) also emphasize the importance of combining structured exercise with increased daily activity volume (e.g., walking), improving sleep and stress management and focusing on exercise intensity for comprehensively improving cardiovascular health [53]. Future research should explore the feasibility and efficacy of incorporating daily step count monitoring and cadence targets into exercise prescriptions for children and adolescents with T1DM, aiming to provide more comprehensive and individualized activity recommendations.
This study is the first to quantitatively compare the benefits of eight exercise regimens on metabolic and cardiopulmonary outcomes in children and adolescents with T1DM using NMA, providing an evidence-based basis for clinical decision-making. This study identified high-intensity aerobic training combined with anaerobic training as the optimal regimen for improving lipid profile, and high-intensity aerobic training as the optimal regimen for improving cardiopulmonary fitness. However, exercise did not demonstrate statistically significant improvements in BG and HbA1c, revealing the presence of distinct exercise-induced physiological responses in children and adolescents with T1DM. This finding cautions clinicians against mechanically applying treatment experiences from adults or other types of diabetes when managing children and adolescents with T1DM, emphasizing the necessity of individualized therapy. These discoveries promote a shift in clinical practice from a “glucose-centric approach” towards a “comprehensive metabolic assessment”. We recommend incorporating VO2 peak and lipid profile alongside BG and HbA1c as core indicators for routine monitoring. Furthermore, clinicians should integrate insulin dosing, carbohydrate intake, and physical activity for the holistic management of T1DM.
First, this study focused on the effects of exercise on T1DM-related indicators in children and adolescents, as their metabolic management differs from that of adults, and research on this population is limited. Second, the study provides a detailed classification of exercise into eight types and intensity combinations, offering more intuitive recommendations for clinicians and patients. Lastly, we expanded the outcome indicators to include lipid profiles and VO2 peak, enabling a comprehensive assessment of metabolism and cardiopulmonary function. Additionally, we applied the latest statistical method, NMA, to address the complexities of multiple intervention comparisons, enhance statistical power, and prioritize and rank interventions. However, heterogeneity is unavoidable due to publication bias in some studies, where negative results were not published. Exercise intervention parameters were not standardized, and significant differences existed across studies. Moreover, heterogeneity existed across outcome measures. For instance, while this systematic review included 19 studies, only 12 used HbA1c as an endpoint measurement. This further reduced the analyzable pediatric and adolescent sample size. Consequently, the present study ultimately incorporated a limited sample cohort. Similarly, the current findings are constrained by the aforementioned limitations. This underscores the necessity for future large-scale, multicenter clinical trials employing standardized interventions. Future prospective studies will involve larger populations to further explore the impact of exercise on metabolism and cardiopulmonary function in children and adolescents with T1DM.
In conclusion, high-intensity aerobic training combined with anaerobic training and high-intensity aerobic training can improve metabolism and cardiopulmonary function in children and adolescents with T1DM. However, the significance of improvements in BG, HbA1c, TG, and VO2 peak was insufficient, possibly due to baseline metabolic conditions, exercise duration, and follow-up time. Although the current study found no significant improvements in BG or HbA1c following exercise interventions, these results reveal unique exercise-physiological responses in children and adolescents with T1DM. This evidence suggests clinicians should develop exercise prescriptions integrating insulin dose adjustment, nutritional interventions, and continuous BG monitoring, rather than relying on standardized exercise regimens alone.