Introduction
Esophageal varices (EV) are dilated submucosal veins in the distal part of the esophagus that connect the portal vein to the systemic circulation [1]. Based on the presence or absence of varicose veins on endoscopy and the Paris classification, EV can be classified into three grades: grade I: varicose veins disappear after inflation; grade II: varicose veins do not disappear after inflation but are not confluent; and grade III: varicose veins do not disappear after inflation but are confluent [2]. EV are a common complication of portal hypertension (PHT), occurring in 30% to 60% of patients with cirrhosis [3, 4]. The severity of cirrhosis is an important prognostic factor for failure to control bleeding (FTB) and 42-day mortality [5]. Depending on the size of the varices, the 2-year risk of variceal bleeding ranges from 12% to 30%, and the 6-week mortality rate ranges from 6.4% to 16% [6–8]. Identifying the factors associated with early mortality may help selecting patients needing more than conventional therapy. Currently, the prevalence of EV in diabetes is unknown. Nevertheless, it has been demonstrated that over a third of patients with type 2 diabetes mellitus (T2DM) exhibit non-alcoholic steatohepatitis (NASH), while approximately one-sixth of patients with T2DM present with advanced liver fibrosis. Furthermore, the risk of developing liver failure and hepatocellular carcinoma is considerably elevated in patients with T2DM compared to those without T2DM [9, 10]. Another study demonstrated that in patients with compensated advanced non-alcoholic fatty liver disease (NAFLD), diabetes and a ≥ 5% increase in body mass index were associated with the progression of EV [11].
Type 1 diabetes mellitus (T1DM), also known as insulin-dependent diabetes mellitus, is a chronic autoimmune disease, characterized by the T-lymphocyte-mediated autoimmune destruction of pancreatic β-cells, leading to the loss of pancreatic islet function [12, 13]. This results in an absolute lack of insulin secretion and the production of specific insulin autoantibodies [14, 15]. In comparison to type 2 diabetes (T2D), T1D typically develops at a younger age, resulting in a longer duration of diabetes for this group of individuals [16]. Globally, there were approximately 8.4 million people with type 1 diabetes in 2021, and this number is expected to increase to 17.4 million by 2040 [17].
The correlation between hyperglycemia, microangiopathy, and macrovascular lesions was more pronounced in patients with T1DM than in those with T2DM. In patients with T1DM aged 45–64 years, cardiovascular disease mortality increases by around 50% for each 1% increase in glycated hemoglobin (HbA1c) above normal values [18, 19]. However, the relationship between type 1 diabetes and veins has rarely been reported. This paper attempts to reveal the causal relationship between esophageal varices and type 1 diabetes using Mendelian randomization.
Mendelian randomization (MR) methods use single nucleotide polymorphisms (SNPs) as instrumental variables (IVs) to infer causal relationships between exposures and outcomes. Variants are assigned randomly to offspring by their parents at conception. Therefore, the MR method is not affected by confounding factors or reverse causality, making it similar to the random assignment method used in randomized controlled trials [20].
Material and methods
Research design
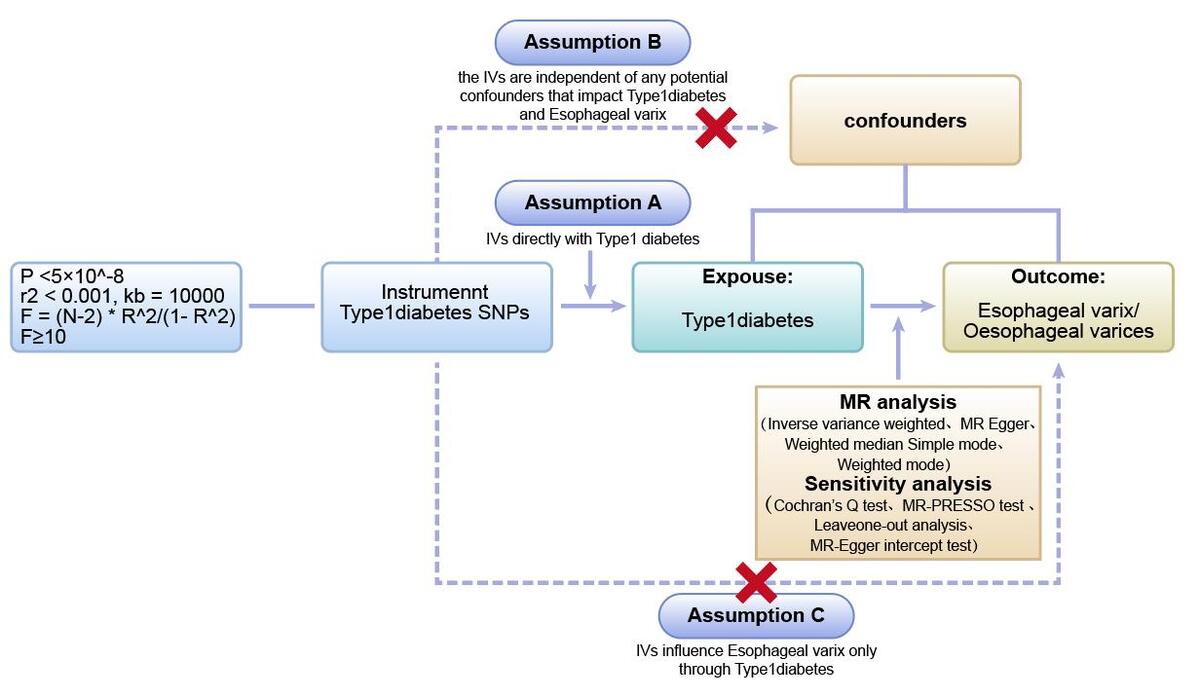
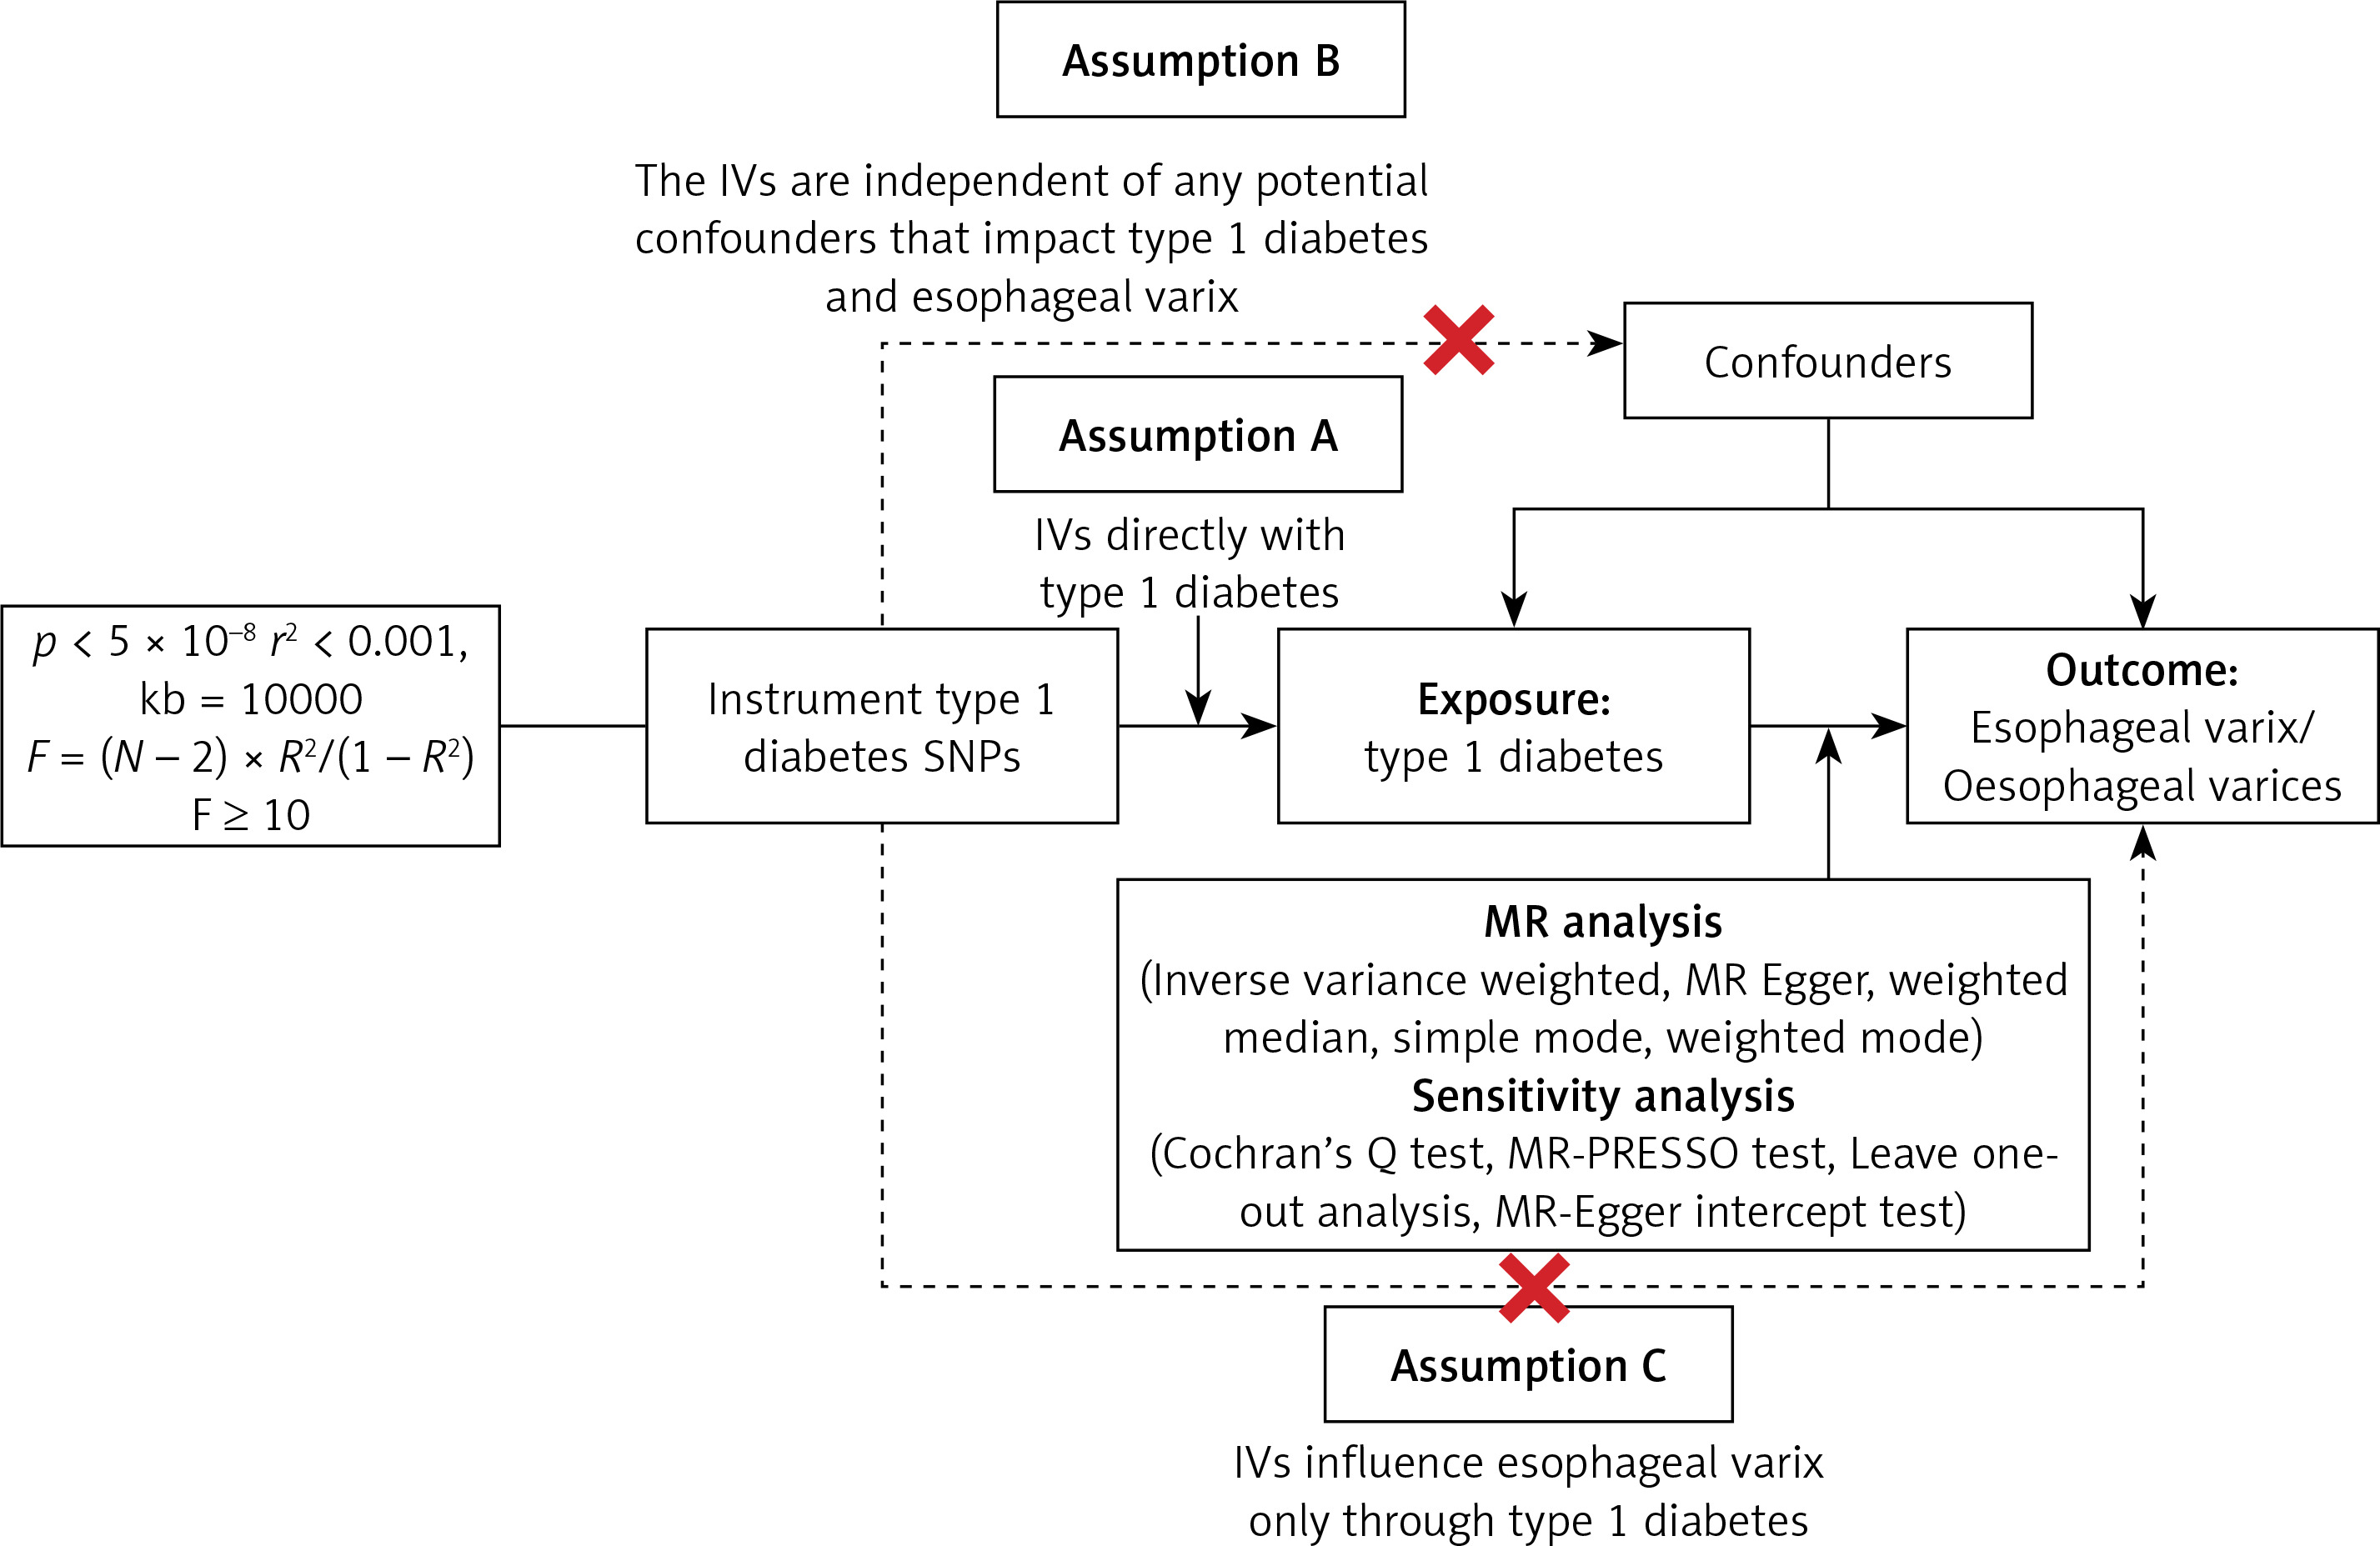
We first performed two-sample Mendelian randomization (two-sample MR) using GWAS data from different databases to investigate and validate the causal relationship between type 1 diabetes and esophageal varices. Next, we used multivariate Mendelian randomization (MVMR) to further validate the effect of type 1 diabetes on esophageal varices after excluding confounding factors such as cirrhosis and immune system diseases associated with type 1 diabetes (Figure 1).
Source of data
Exposure data
To reduce potential confounding bias due to population stratification, we restricted our study population to individuals of European ancestry. Multiple sets of type 1 diabetes-related samples were selected for exposure in the IEU Open GWAS database (https://gwas.mrcieu.ac.uk/) and the FinnGen Biospecimen Bank database (https://www.finngen.fi/en/node/17). The sample size from the FinnGen Biobank database type 1 diabetes, strict (exclude DM2) (id: finn-b-E4_DM1_STRICT) was 186,323 cases, including 2,649 type 1 diabetes cases and 183,674 control samples. Type 1 diabetes, strict definition (id: finn-b-T1D_STRICT) had a sample size of 185,115 cases, including 2,542 cases of type 1 diabetes and 182,573 controls. The sample size from the GWAS database type 1 diabetes (id: ebi-a-GCST90018925) was 457,695 cases, including 6,447 cases of type 1 diabetes and 451,248 controls, while the sample size from the GWAS database type 1 diabetes (id: ebi-a-GCST010681) was 24,840 cases, including 9,266 cases of type 1 diabetes and 15,574 controls.
Similarly, we screened samples from the above databases and the UKB database for diseases associated with cirrhosis, primary biliary sclerosis (PBC), systemic lupus erythematosus, hypothyroidism, rheumatoid arthritis, etc. The GWAS database on cirrhosis (id: ebi-a-GCST90018826) had a sample size of 347,406 cases, consisting of 122 cirrhosis cases and 347,284 controls. Cirrhosis, broad definition used in the article (id: finn-b-CIRRHOSIS BROAD) had a sample size of 218,792 cases, including 1,931 cases of cirrhosis and 216,861 controls. Systemic lupus erythematosus (id: ebi-a-GCST003156) had a sample size of 14,267 cases, including 5,201 cases of erythematosus and 9,066 controls. Systemic lupus erythematosus (id: finn-b-M13_SLE) had a sample size of 213,683 cases, including 538 cases of erythematosus and 213,145 controls. Primary biliary cirrhosis (PBC) (id: ebi-a-GCST005581) had a sample size of 11,375 cases, including 2,861 cases of PBC and 8,514 controls. Hypothyroidism or myxedema (id: ebi-a-GCST90013893) had a sample size of 405,357 cases. Non-cancer illness code, self-reported: hypothyroidism/myxedema (ukb-b-19732) had a sample size of 462,933 cases, including 22,687 cases of hypothyroidism/myxedema and 440,246 controls. Rheumatoid arthritis (id:ebi-a-GCST90018910) had a sample size of 417,256 cases, including 8,255 cases of rheumatoid arthritis and 409,001 controls (Table I).
Table I
Details of GWAS included in the Mendelian randomization exposures
Outcome data
The endpoints were similarly obtained from the IEU Open GWAS database (https://gwas.mrcieu.ac.uk/) and the FinnGen biospecimen repository database (https://www.finngen.fi/en/node/17). The sample size of Esophageal varix (id: ebi-a-GCST90018842) from the IEU Open GWAS database was 436,154 cases, including 2,135 cases of esophageal varices and 434,019 control samples. The other group of Oesophageal varices (id: finn-b-I9_VARICVEOES) is from the FinnGen Biobank database with a sample size of 190,513 cases including 485 esophageal variceal cases and 19,0028 control samples included.
The datasets used in our study are publicly available, and each GWAS study included has obtained ethical approval from their respective institutional review boards. Our study adheres to the Strengthening the Reporting of Observational Studies in Epidemiology (STROBE) guideline [21] (Table II).
SNP selection
We identified SNPs significantly associated with type 1 diabetes using stringent criteria. These SNPs served as instrumental variables (IVs) and met the requirements of robust association with the risk factor, independence from confounders, and association with the outcome through the risk factor [22, 23]. To construct the genetic IVs, we identified single nucleotide polymorphisms (SNPs) that were significantly associated with the exposure based on stringent criteria (p < 5 × 10⁻⁸) and independence (r2 < 0.001, kb = 10000). We chose use the SNP proxy and set the minimum allele frequency (MAF) to 0.001. In addition, we coordinated the effect alleles between the exposure and outcome data sets, excluding all SNPs with palindromes. We used the PhenoScanner database (http://www.phenoscanner.medschl.cam.ac.uk/) [24, 25] to screen and exclude SNPs associated with confounding factors such as smoking, alcohol consumption, hepatitis, cirrhosis, and other factors that can directly damage the esophageal mucosa or cause obstruction of esophageal venous return. To assess the strength of the IVs, we employed the F statistic, calculated as F = (N – 2) * R2/(1 – R2), where R2 represents the variance of exposure explained by the genetic instrument (determined by the effect allele frequency (EAF) and the genetic effect of exposure), and N denotes the sample size [26]. An F value greater than 10 indicated a lower risk of weak IV bias [27].
Statistical analysis
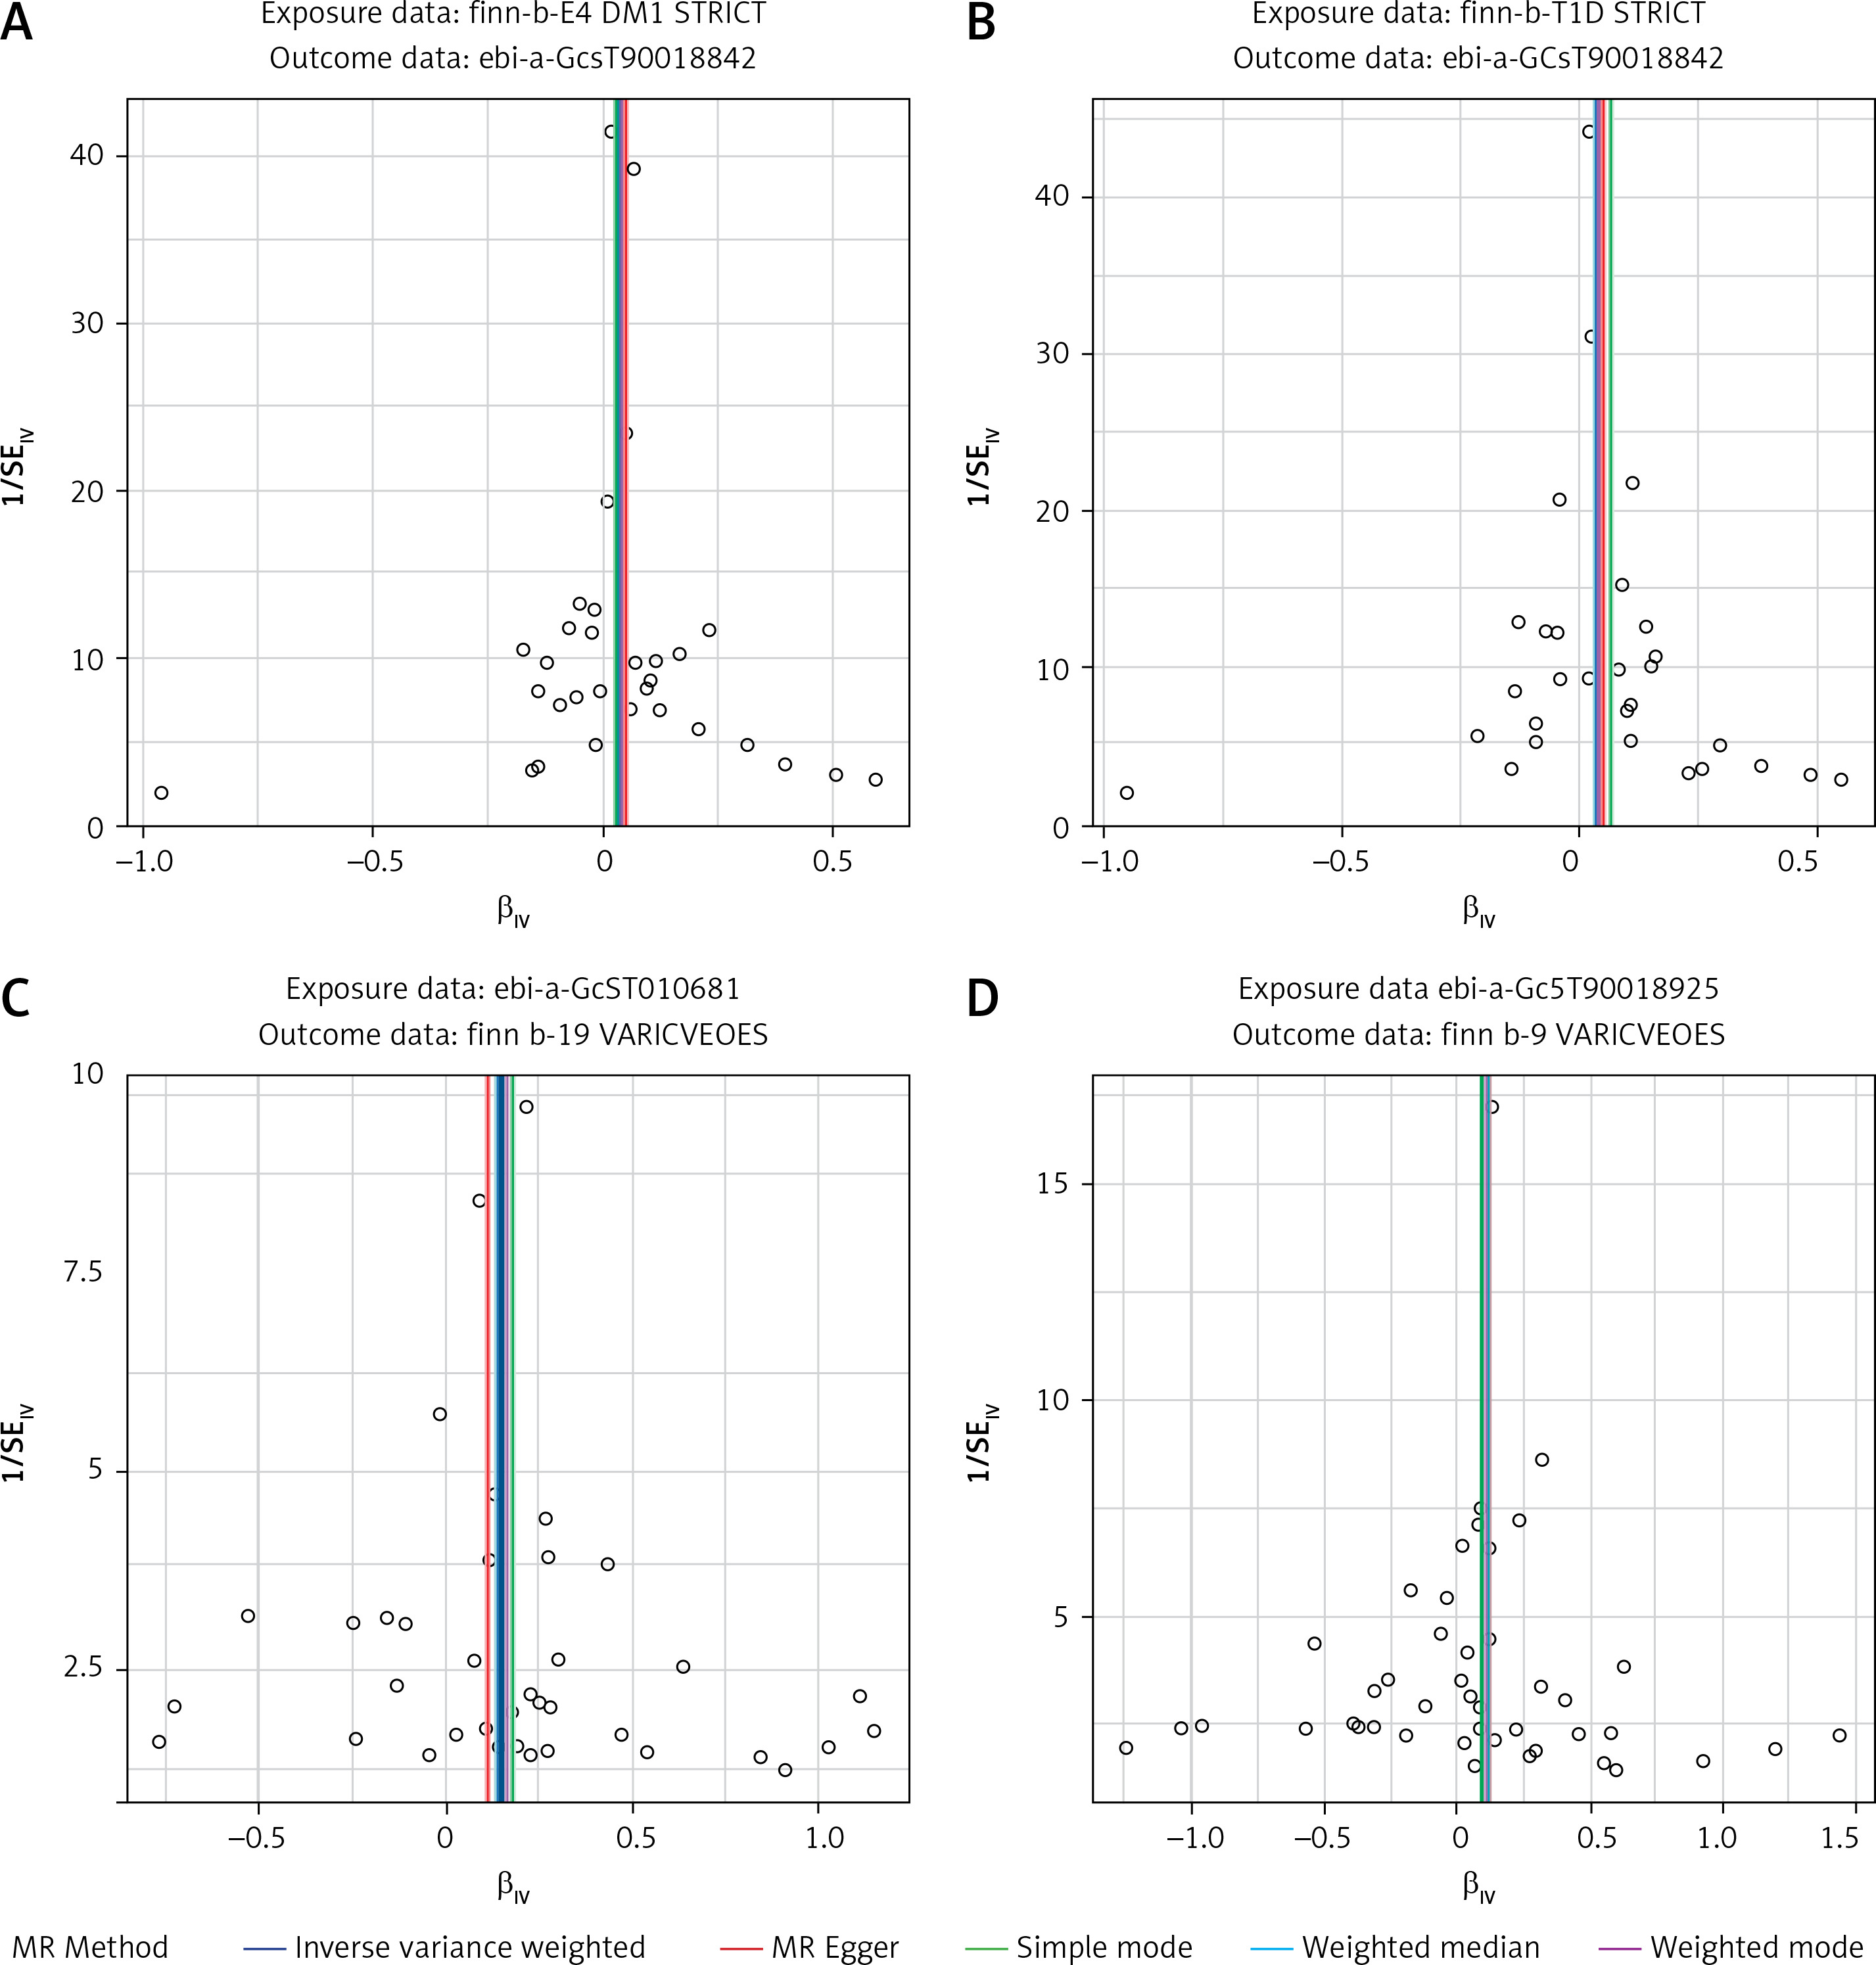
Firstly, we employed five methods – inverse variance weighting (IVW), MR-Egger, weighted median (WM), simple mode, and weighted mode – to estimate causal effects. The ORs and their 95% confidence intervals (95% CI) are used to present the results. IVW was used as the main analysis approach due to its precise estimate [28]. The IVW method uses a meta-analysis approach to combine the Wald ratio estimates of the causal effect obtained from different SNPs, and provides a consistent estimate of the causal effect of the exposures on the outcomes when each genetic variant satisfies the assumptions of an instrumental variable [29]. The MR-Egger method is able to assess whether genetic variants have pleiotropic effects on the outcomes [23]. Weighted median analysis serves as an important method of estimating the causal effect if over 50% of SNPs meet the “no horizontal pleiotropy” assumption [30]. The simple mode is a model-based estimation method that provides the robustness for pleiotropy [31]. The weighted mode is sensitive to the difficult bandwidth selection for mode estimation [32]. Criteria for establishing a causal relationship included significant results in the IVW analysis, and the results of WM and MR-Egger analysis were consistent with those of the IVW analysis [33, 34]. The possibility of false-positive results from multiple hypothesis testing requires adjustment of the p-value for correction. As the Bonferroni method is too conservative, the Benjamini-Hochberg method was used for correction. Associations with FDR < 0.05 were considered significant, while associations with FDR > 0.05 and p-values < 0.05 were considered suggestive. Subsequently, we used multivariate Mendelian randomization (MVMR) to validate the relationship between type 1 diabetes mellitus and esophageal varices after removing cirrhosis and immune system disorders (systemic lupus erythematosus, rheumatoid arthritis, PBC, and hypothyroidism) associated with type 1 diabetes.
Sensitivity analysis
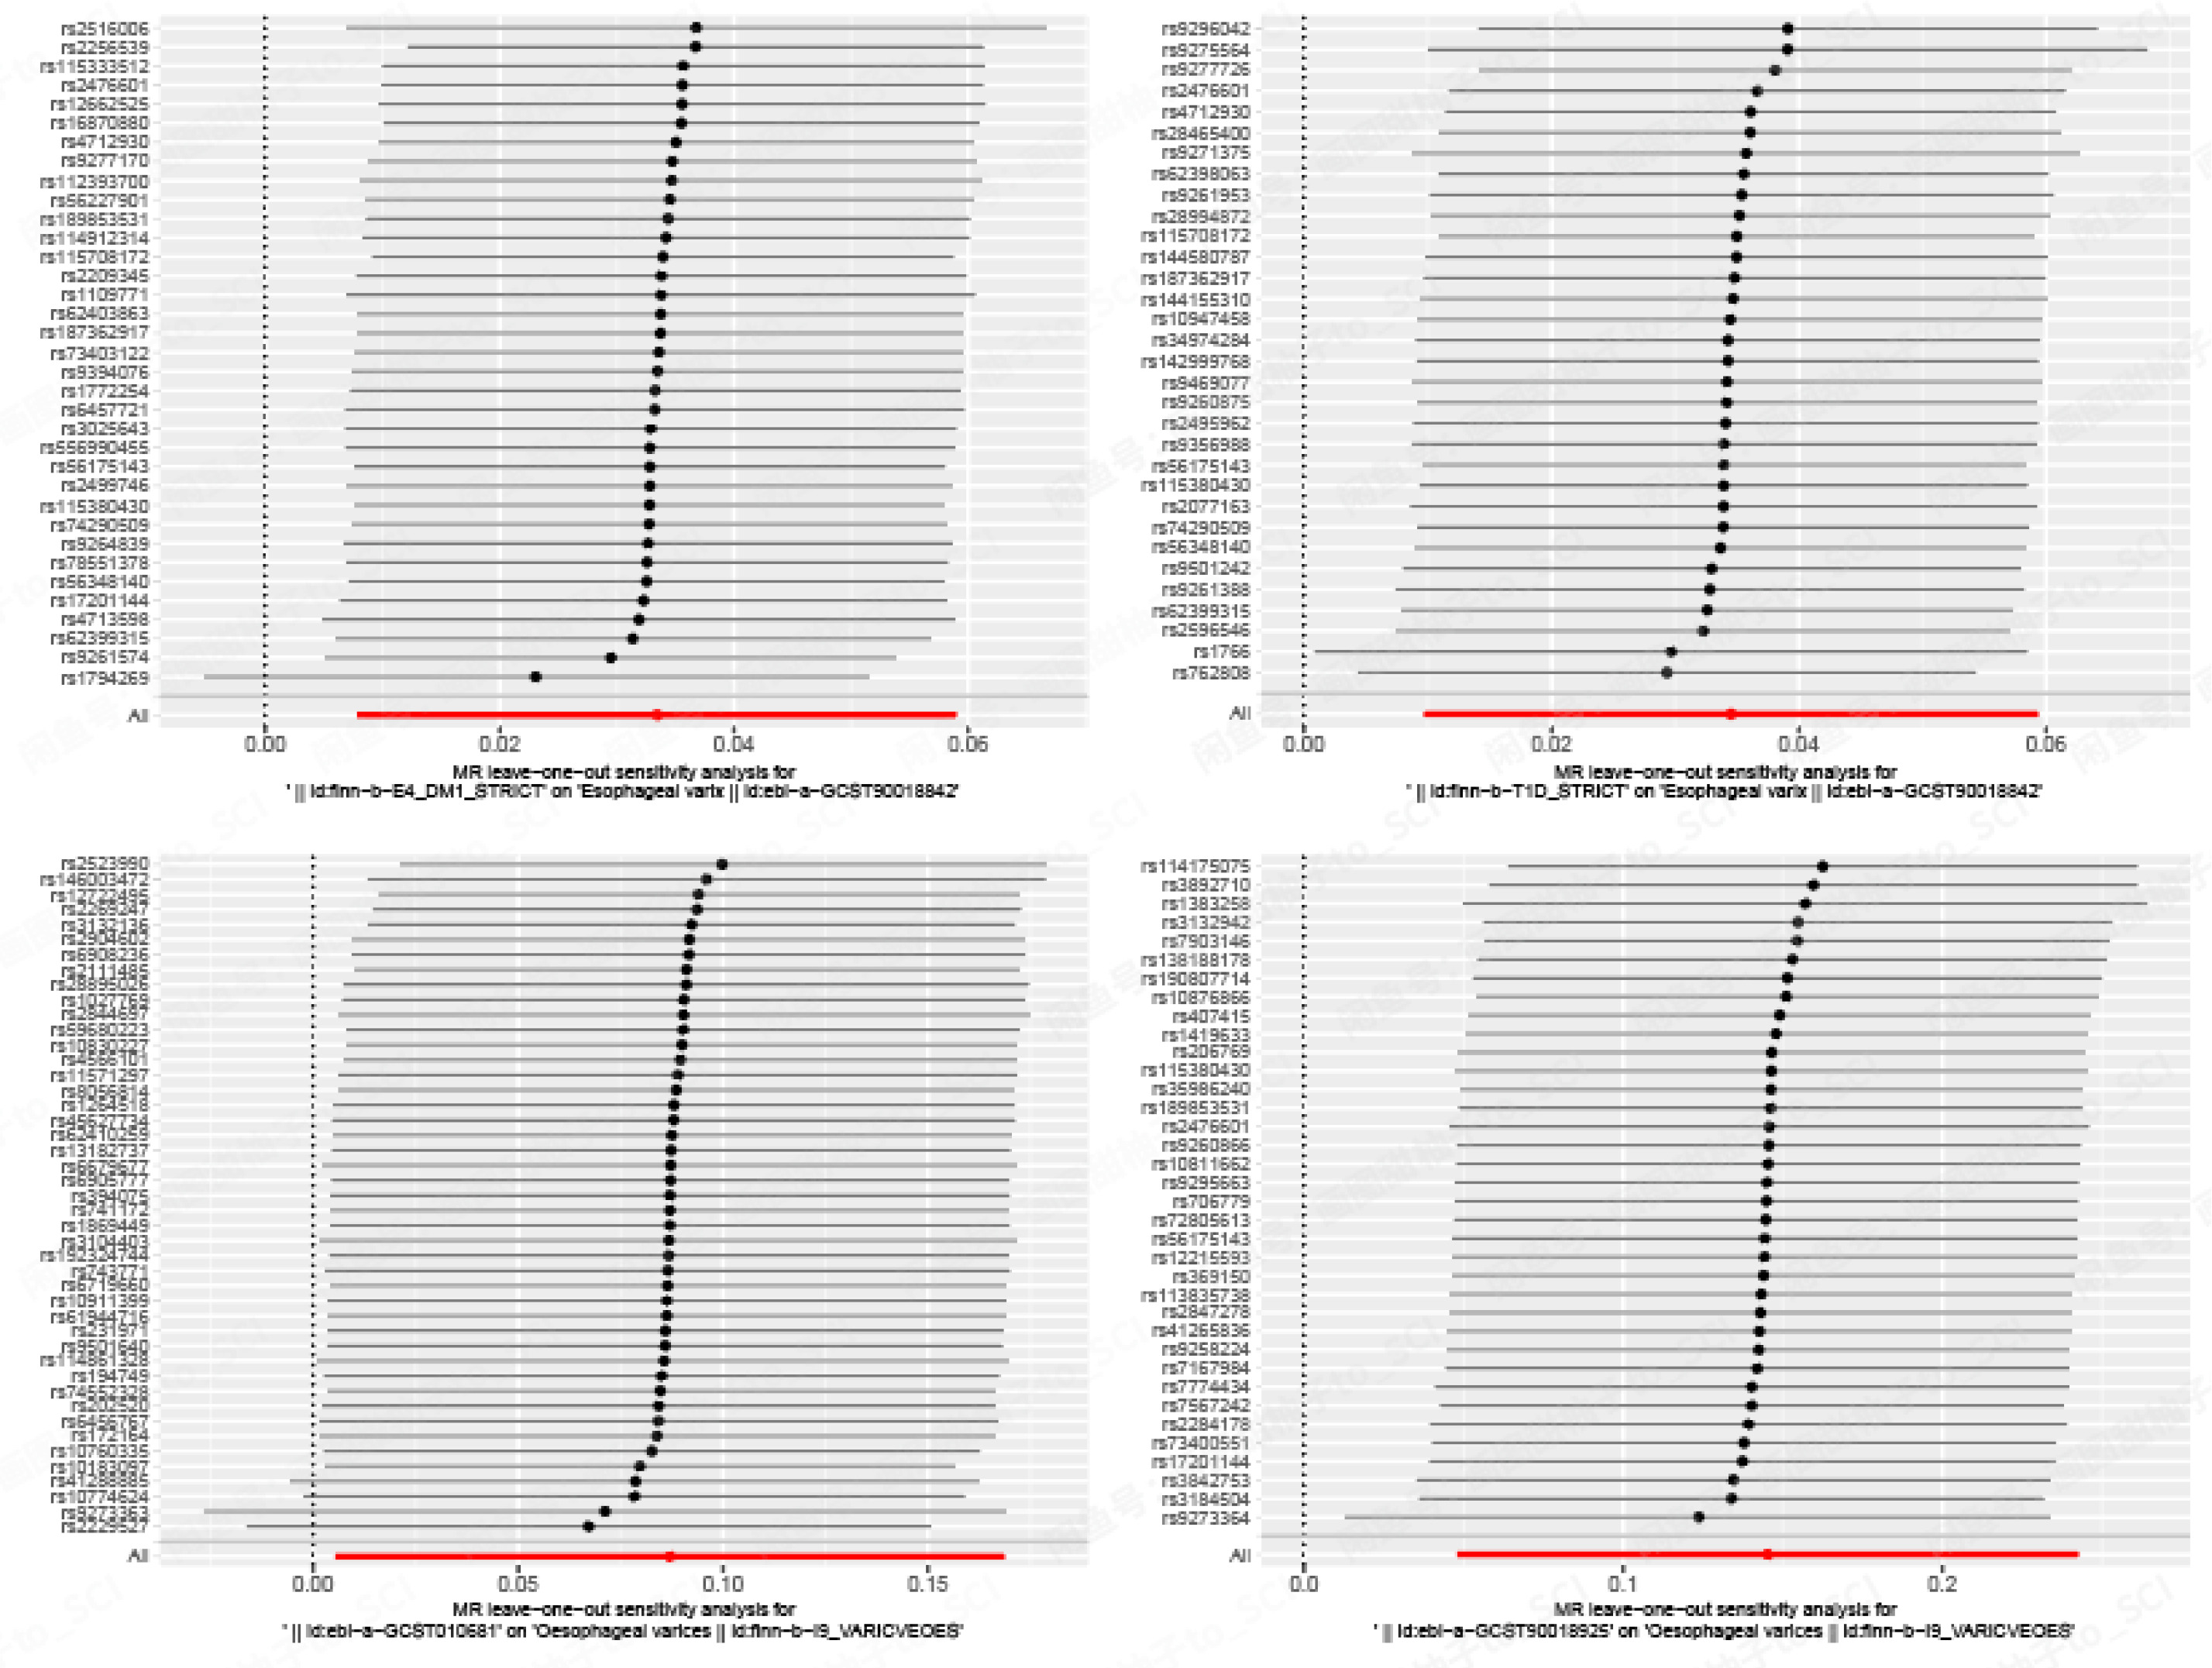
Sensitivity analyses, including tests for heterogeneity and horizontal pleiotropy. To determine the reliability of the results of MR analyses, it is crucial to include tests for heterogeneity and horizontal pleiotropy [35]. Cochran’s Q test was used to assess the heterogeneity of effect sizes of the selected genetic IVs, with a p-value of the Q test < 0.05 indicating the presence of heterogeneity. When heterogeneity was statistically significant, the random effect model was utilized. Otherwise, the fixed effect model was utilized [36]. The MR-PRESSO method was used to identify and remove IVs with heterogeneity from the analysis [37]. The MR-Egger method can identify and correct potential pleiotropy and provide a relatively consistent estimate [23]. We assessed the presence of horizontal pleiotropy using the MR-Egger intercept test, where an intercept value close to 0 and a p-value > 0.05 suggest no horizontal pleiotropy [32, 36]. Funnel plots were used to assess the symmetry of the selected SNPs. Forest plots were used to assess the reliability and heterogeneity of the incidental estimates. Scatter plots were used to visualize the relationship between exposure and outcome.
All of the analyses mentioned above were completed using the packages “Two Sample MR”, “Mendelian Randomization”, “MRPRESSO”, and other necessary packages in R (version 4.3.1) [38].
Results
Results of instrumental variable selection
All the SNPs we extracted from the GWAS were significantly associated with T1DM (p < 5 × 10⁻⁸), with F-statistic > 10, indicating no weak instrumental bias.
Results of two-sample MR analysis
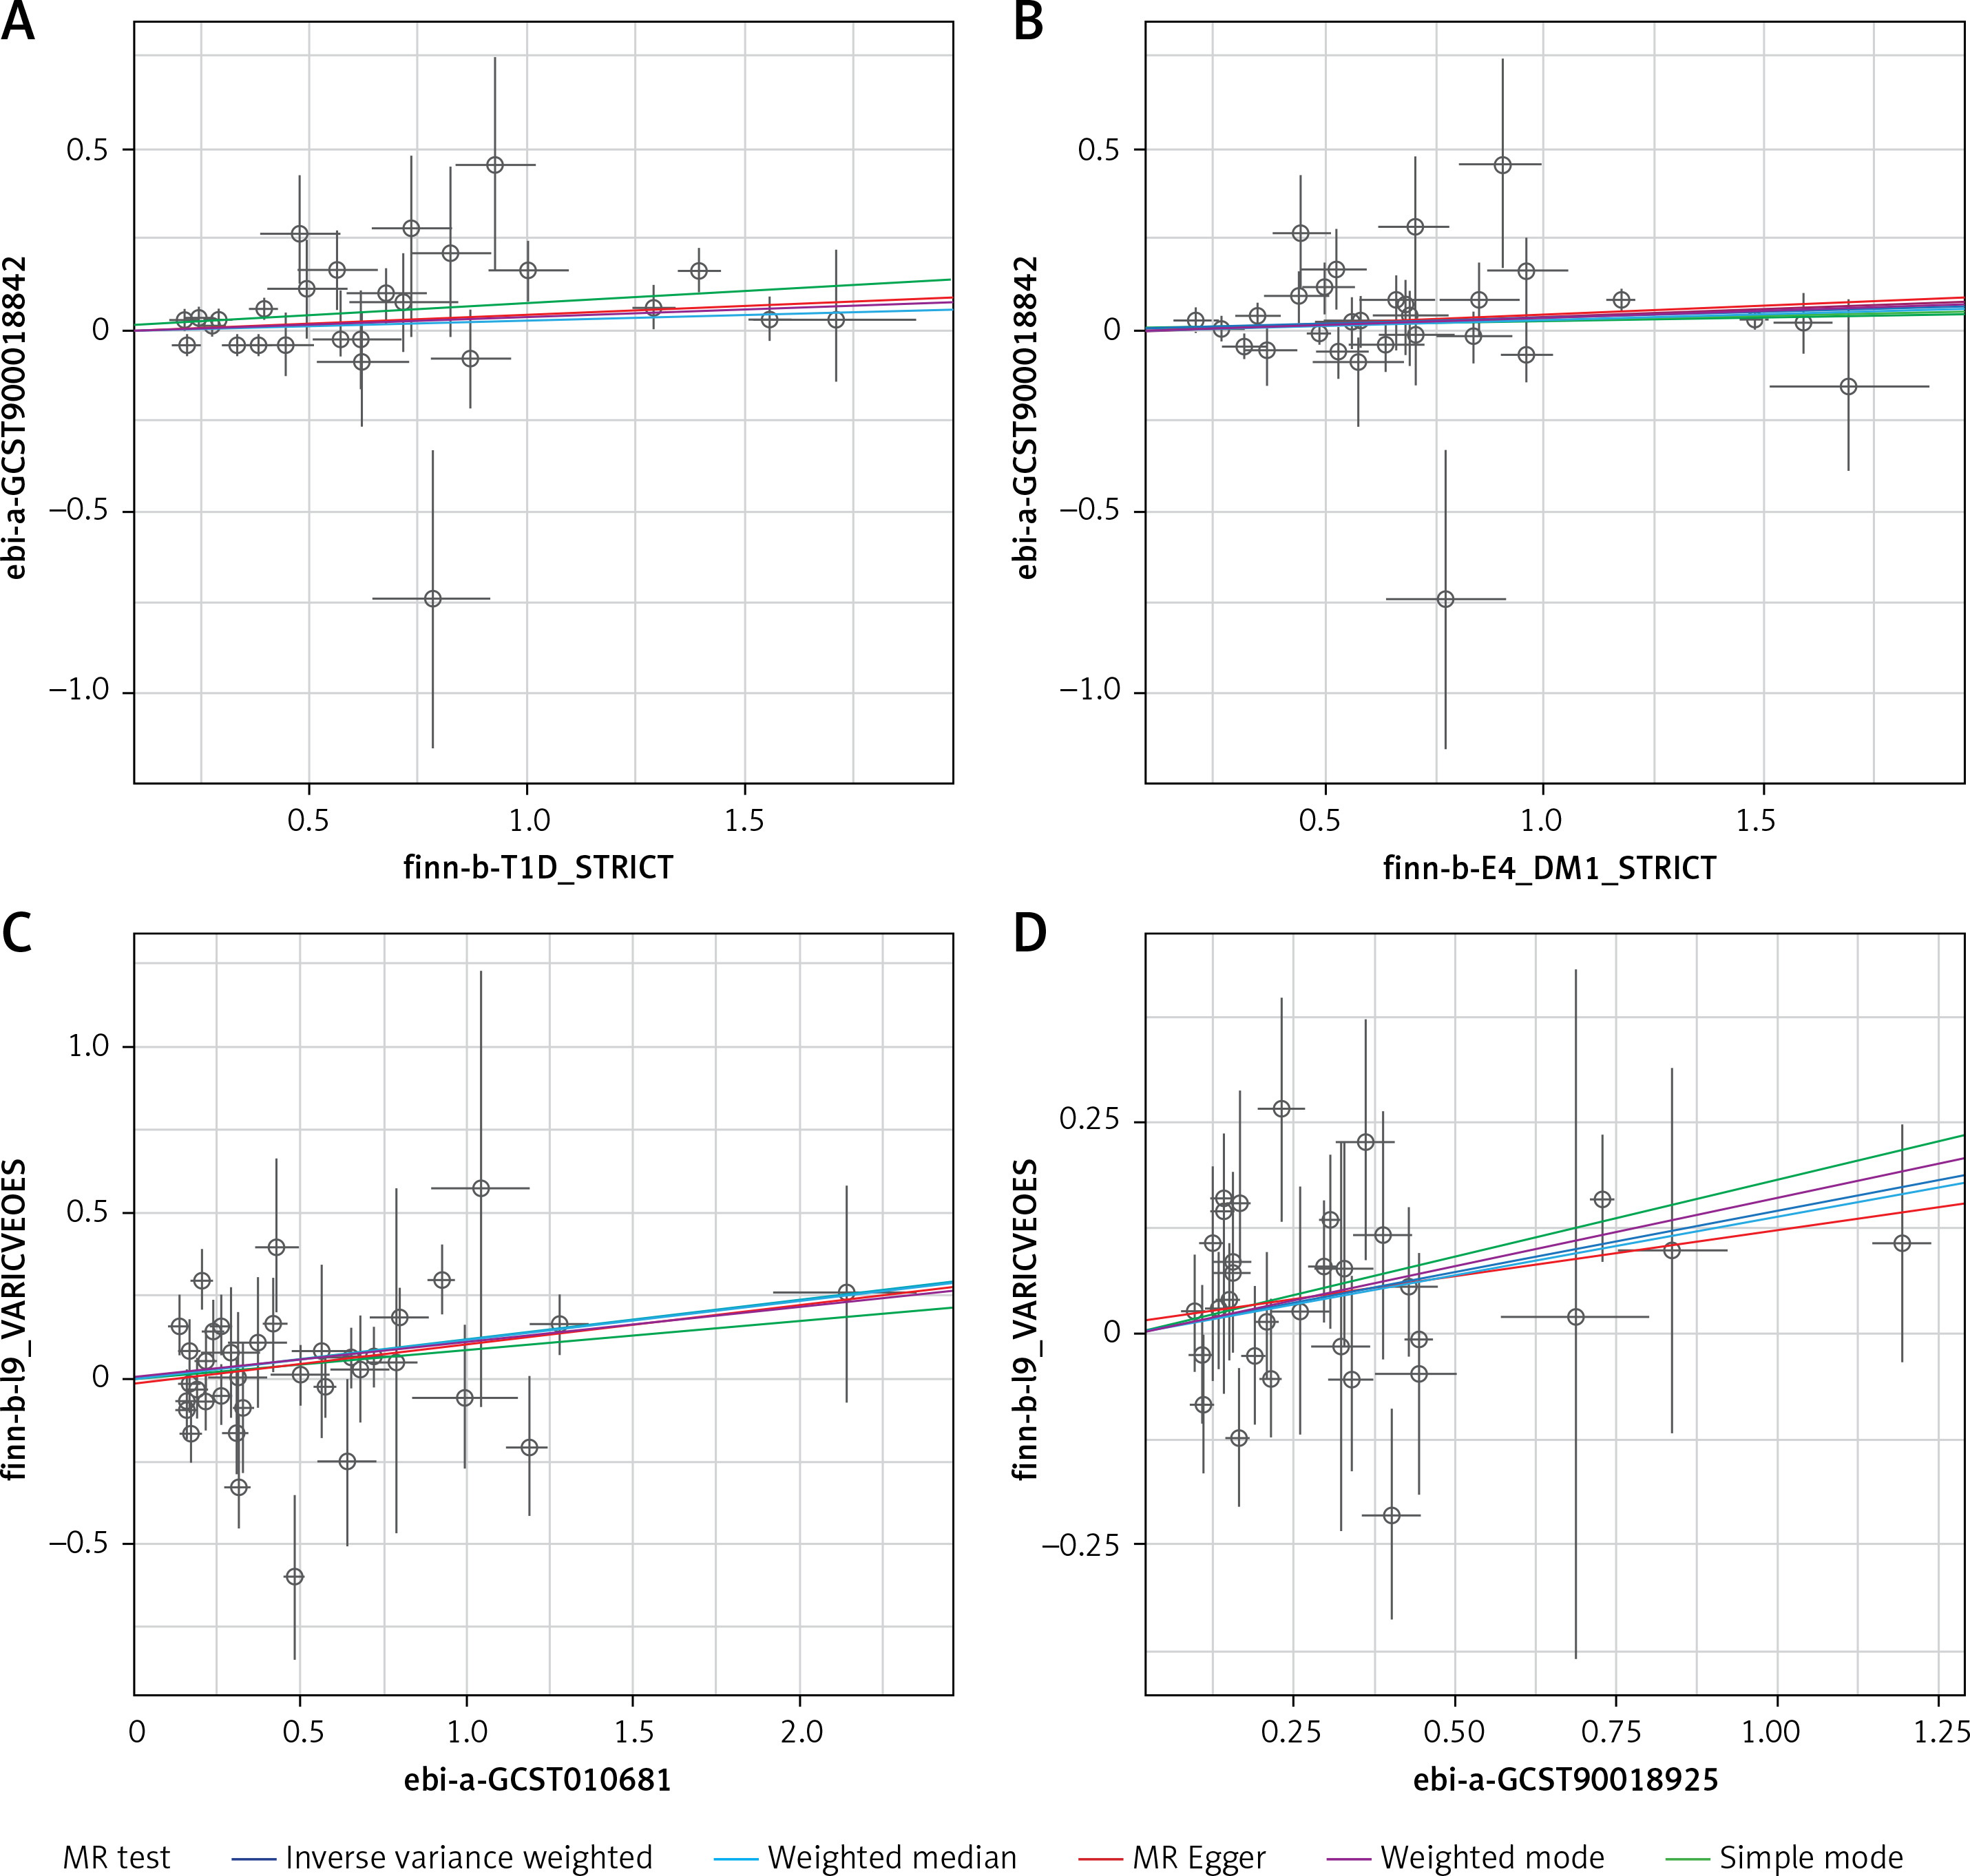
In all two-sample MR analyses, the p-values of the IVW were all < 0.05. Meanwhile, the ORs of both IVW and MR-Egger analyses were > 1, and the directions of the IVW and MR-Egger assays were consistent. Thus, a causal relationship between type 1 diabetes and esophageal varices was demonstrated (Table III, Figures 2–5).
Table III
A causal relationship was observed between T1DM and esophageal varices
Results of MVMR analysis
We conducted MVMR analyses on autoimmune diseases such as systemic lupus erythematosus, rheumatoid arthritis, hypothyroidism, and PBC as confounders in type 1 diabetes mellitus. We also evaluated cirrhosis as a potential confounder. These analyses aimed to assess the strength of the association between type 1 diabetes mellitus and esophageal varices. The results showed that after three sets of MVMR analyses using samples from different databases, the causal relationship between type 1 diabetes and esophageal varices persisted even after adjusting for these confounders (Tables IV–VI).
Table IV
MVMR results analysis for association of T1DM and EV risk
Table V
MVMR results analysis for association of T1DM and EV risk
Table VI
MVMR results analysis for association of T1DM and EV risk
Results of sensitivity analysis
In all two-sample MR analyses, Egger intercepts (p > 0.05) and funnel plots in MR analyses showed no horizontal pleiotropy.
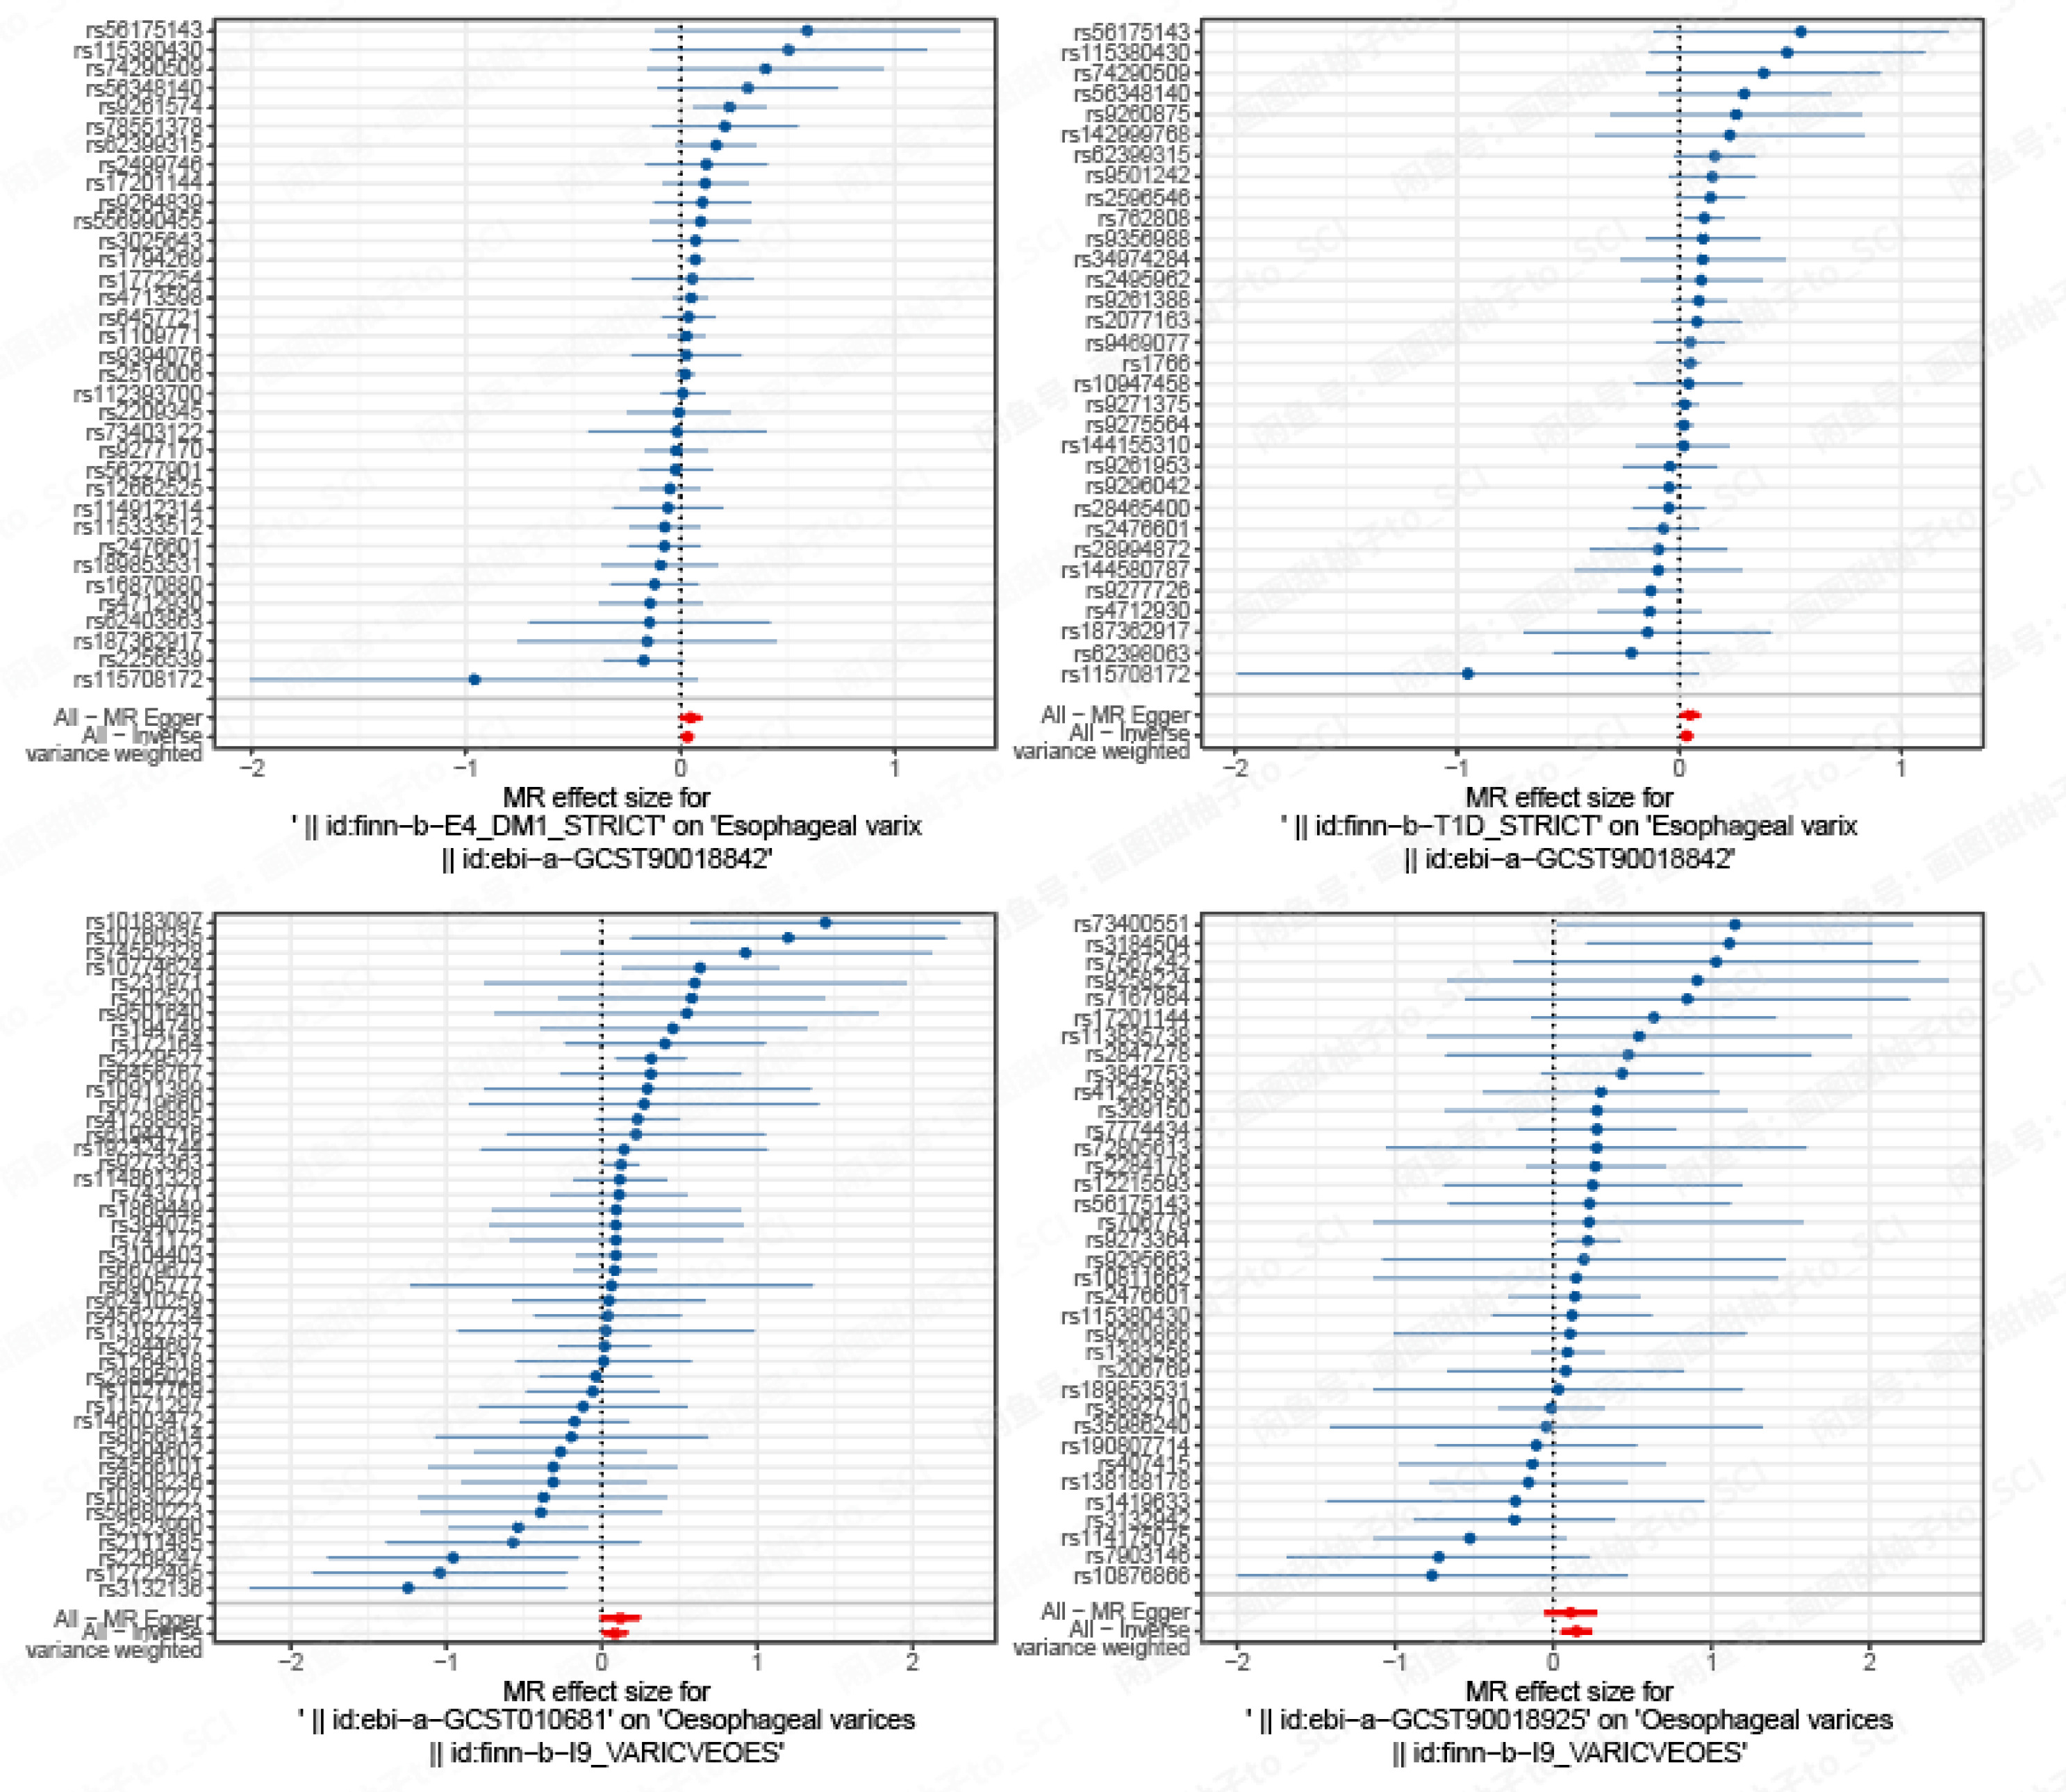
Most of the tests showed no heterogeneity between SNPs, so the IVW fixed effects model was used. Some heterogeneity tests showed heterogeneity between SNPs. A random effects IVW approach could be used to allow for heterogeneity in SNPs. The leave-one-out analysis revealed that the results were stable and not affected by single SNPs (Table VII).
Table VII
Sensitivity analysis for association of T1DM and EV risk
Discussion
MR analyses based on pooled GWAS data examined the genetic association between exposure (type 1 diabetes) and outcome (esophageal varices) using five methods (IVW, weighted median, weighted mode and MR-Egger) and concluded that there was evidence of a causal association between type 1 diabetes and esophageal varices.
Previous research has indicated that esophageal varices (EV) develop as a result of abnormal liver function and portal hypertension. If blood flow through the liver is restricted, back pressure in the portal vein can cause previously latent anastomoses (collateral vessels) between the portal vein and the systemic circulation to open [39]. This results in the veins of the gastro-esophageal junction shunting blood from the left gastrosplenic vein and splenic vein via the esophageal plexus to the superior vena cava [40]. Collateral channels of the portal venous system develop and increase in size over time. These veins are not very elastic and become more fragile as they keep enlarging and their lumens become thinner [41]. The causes of this blood flow restriction are not always clear and can be divided into three categories: prehepatic, intrahepatic, and posthepatic. Further consideration of intrahepatic factors can be divided into three branches. They are pre-sinusoidal, sinusoidal, and posterior sinusoidal. It has been reported that some of these EV patients have co-morbid autoimmune diseases such as rheumatoid arthritis and systemic lupus erythematosus [42, 43]. The primary treatment for EV is ligation and sclerotherapy. Patients with EV secondary to upper gastrointestinal bleeding should undergo emergency gastroenterological examination (esophagogastroduodenoscopy) and be closely monitored for falling hemoglobin levels and hypotension. Further studies are needed to determine whether the progression of esophageal varices in patients with diabetes mellitus can be slowed down and the prognosis improved by physiotherapy methods such as extracorporeal shock wave therapy (Li-ESWT), transcutaneous electrical nerve stimulation (Acu-TENS) and yoga exercises, as in other diabetes mellitus-related conditions [44, 45].
T1DM is often comorbid with multiple autoimmune diseases, with autoimmune thyroid disease being common, while celiac disease, skin disorders, and connective tissue disorders are not uncommon [46]. However, studies examining the relationship between T1DM and esophageal varices are limited. Iwahashi et al. reported a case of autoimmune polyglandular syndrome III in a patient with idiopathic portal hypertension (IPH), which included a description of T1DM and esophageal varices [47]. Although the underlying mechanism of the relationship between T1DM and EV is not fully understood, the authors suggested that T1DM develops gradually after the patient has had IPH. Yumie Takeshita et al. also reported a case of a patient diagnosed with PBC, T1DM and autoimmune thyroid disease (AITD). Abdominal CT revealed hepatomegaly and collateral vascularization, in the paraesophageal region. Gastrointestinal endoscopic examinations showed esophageal varices (linear and white varices without red coloring) [48]. As exacerbations of diabetes mellitus and portal hypertension develop in parallel during the clinical course, it was concluded that the pathology of slowly progressive insulin-dependent diabetes mellitus (SPIDDM) and CREST-PBC overlap syndrome may be relevant to this patient. In addition to the cases mentioned above, cases of EV associated with T1DM have also been reported in the European population. Rahmoune et al. reported a successful caesarean section (CS) in a 34-year-old polygamous woman with Alagille syndrome (AS) who was diagnosed with insulin-dependent diabetes mellitus at the age of 5 years and later developed esophageal varices [49]. In 2004, Carr et al. reported a case of coronary artery bypass grafting in a 56-year-old patient with unstable angina, insulin-dependent diabetes mellitus, cirrhosis, and several esophageal variceal bleeds [50].
Our study found a direct genetic causal relationship between T1DM and EV, and confirmed using multivariate Mendelian randomization (MVMR) analysis that a causal relationship between T1DM and EV still existed after exclusion of autoimmune diseases such as hypothyroidism, rheumatoid arthritis, systemic lupus erythematosus, PBC, and cirrhosis. There are several possible explanations for the increased risk of EV in patients with T1DM. First, T1DM is a complex autoimmune disease in which inflammation is a central part of the disease response, and in patients with T1DM the body’s immune system is dysfunctional, leading to the development of EV. One study found that CRP is elevated within the first year of diagnosis of T1DM [51, 52]. Circulating and tissue pro-inflammatory cytokines such as tumor TNF-α, interferon-γ, interleukin (IL)-6, and IL-12, vascular cell adhesion molecular 1, and monocyte chemoattractant protein-1 can impair insulin metabolic signaling and decrease insulin-mediated NO production, leading to arterial stiffening, hypertension, and other diabetic vasculopathy [12]. Second, thrombosis of the veins plays a vital role in the induction of esophageal varices. A meta-analysis of 63,552 patients with diabetes mellitus demonstrated a 1.4-fold increased risk for venous thromboembolism [53]. Furthermore, it has been reported that the risk of venous thromboembolism in subjects with T1DM was 5.33-fold higher than in the non-T1DM group after adjusting for dyslipidemia, hypertension, and obesity [54]. Thirdly, patients with T1D and the metabolic syndrome face the highest risk of metabolic-associated hepatopathies. Within the disease spectrum of NAFLD, liver steatosis can progress towards NASH, fibrosis, cirrhosis, and hepatocellular carcinoma (HCC), but it also poses an increased risk of cardiorenal morbidity and mortality [55]. One study investigated the natural history of patients with T1D and histologically proven chronic liver disease and found that 7% of patients with NAFLD developed cirrhosis over time. There was an OR 1.875 for cirrhosis incidence in relatively young (< 55 years) T1D patients, compared to the general population [56]. Finally, according to the literature, T1MD, as a form of diabetes mellitus, can cause vascular damage through various mechanisms, including inappropriate RAAS activation, mitochondrial dysfunction, excessive oxidative stress, inflammation, dyslipidemia, thrombosis, EPC dysfunction, dysbiosis of the intestinal flora, and the aberrant release of extracellular vesicles and the miRs they carry [46].
This study has several strengths. First, it presents the first causal relationship between T1DM and EV, providing valuable insights into both diseases. Second, the MR approach eliminated confounding factors, and the large GWAS dataset improved the statistical power to determine causality.
This study has some limitations. Firstly, the majority of the samples used in GWAS were of European origin, with only a small number of Asian samples. The MR analyses were performed on a European population, so the results may not be generalizable to non-European populations. Secondly, we used a relatively small sample size, and the causal relationship between the two samples was weak. Positive results were not significant enough to be supported by a larger sample. Our study focused solely on the effect of T1DM on EV and did not perform a bidirectional MR analysis. Due to the challenges posed by the available GWAS data and the lack of stable instrumental variables, we were unable to provide a plausible explanation for the causal relationship between esophageal varices and T1DM. The variables were binary, so it is difficult to assess possible dose-response relationships [57]. That is, the relationship between blood glucose control in T1DM and the severity of esophageal varices. Furthermore, this study only provided genetic evidence and did not consider environmental factors. Finally, the number of available studies on the topics described was relatively small, and we did not include small studies (which may lead to overestimation of the effects of T1DM; smaller studies may be less methodologically robust and more likely to report larger effect sizes, as well as those with short follow-up) [58].
In conclusion, the findings suggest a causal association between T1DM and esophageal varices, and this is the first MR study to explore the causal relationship between esophageal varices in T1DM and the reduction of bias in observational studies. Although the mechanism of the association requires further study, we believe that prevention of esophageal varices and rupture bleeding is crucial for patients with type 1 diabetes.