Introduction
Liver iron overload is defined as a liver iron concentration (LIC) greater than 36 µmol Fe/g, which can cause liver disease, and the aetiologies include inherited causes of iron overload, secondary iron overload and miscellaneous causes such as alcohol, inflammation, cytolysis and metabolic syndrome. Hereditary haemochromatosis (HH) is a common autosomal recessive disease characterized by mutations in the HFE gene. Approximately 85–90% of patients who have inherited forms of iron overload are homozygous for the C282Y mutation in the HFE gene, with a small minority who are compound heterozygotes [1]. Other mutations in genes regulating iron metabolism (TfR2, HJV, SLC40A1) produce rarer cases of inherited haemochromatosis [2].
Hereditary haemochromatosis is characterized by an increase in gastrointestinal absorption of iron, which can lead to deposits of iron in the liver, pancreas, heart, skin and joints. Phenotypic expression of HH causes progressive iron overload in the liver, the target organ of the disease, with a high risk of liver fibrosis, cirrhosis and hepatocellular carcinoma [1]. When iron overload is due to increased destruction of red blood cells, the disease is called secondary haemochromatosis or haemosiderosis. Some hepatopathies, by an unknown mechanism, can also generate iron overload [2].
Hereditary haemochromatosis is increasingly being recognized by clinicians but is still underdiagnosed because most people have no symptoms in the early stage of the disease [1]. It is therefore important to diagnose the disease before there is any organ involvement due to iron accumulation in various tissues [1].
Clinical penetrance in HH (biochemical penetrance with symptoms and/or organ damage) occurs more frequently in men than in women: 28.4% of men and 2.4% of women with C282Y homozygosity had liver iron overload disease [1].
In HH, treatment with phlebotomy is highly effective [2]. Patients with haemosiderosis often have anaemia and are treated with iron chelators [2]. The first step toward diagnosis is measuring the transferrin saturation index (TSI) and the blood ferritin levels. Both are high in the presence of iron overload [2]. When HH is suspected, a genetic study of C282Y and H63D mutations of the HFE gene is conducted to rule out the most common form of HH [3, 4]. The standard method for direct assessment of total body iron is to measure the LIC [1, 2, 5]. The normal LIC value is < 36 µmol Fe/g. In HH and haemosiderosis it is usually > 80 µmol Fe/g, except in liver iron overload secondary to hepatopathies [2, 4, 6]; therefore measurement of LIC is the gold standard for the diagnosis of haemochromatosis. For years, LIC was estimated by liver biopsy using spectrophotometry. Liver biopsy provides direct assessment of LIC and can also be used for fibrosis staging and ruling out concurrent liver diseases, but there is a slight risk of complications, such as bleeding or sample limitation and variability, leading to misinterpretations.
Ultrasound imaging does not allow detection or quantification of liver iron overload. Computed tomography allows detection of iron overload by demonstrating increased attenuation of the liver parenchyma but is not sensitive or specific enough for grading or quantification of iron overload. However, magnetic resonance imaging (MRI) determination of LIC has demonstrated an excellent correlation with liver biopsies [6, 7].
Nowadays, MRI is the best non-invasive technique to determine LIC [5]. This article reviews the available MRI techniques for determining LIC accurately today and evaluates this non-invasive technique for the diagnosis and quantification of iron overload in different clinical practice scenarios. Haemochromatosis secondary to haematological disorders has not been included.
Evaluation of liver iron concentration by magnetic resonance imaging
The role of MRI in the detection of liver iron overload is based on the paramagnetic effect of iron in the liver, shortening the transversal relaxation rate and thereby reducing the signal intensity of the hepatic parenchyma in MR images.
To obtain an MR image implies a succession of excitations and relaxations of the hydrogen nuclei in the patient’s body. After one excitation, the transversal relaxation rate is defined by the time it takes for the transverse magnetization to reach 37% of its original magnitude. When the curve is evaluated by means of spin echo sequences it is called ‘T2’ but if gradient echo sequences are used it is called ‘T2*’. Both T2 and T2* values are measured in milliseconds.
Iron overload accelerates the transversal relaxation curve, shortening T2 and T2* values in proportion to the quantity of iron and decreasing the signal intensity of the liver in the MR images. Some studies have strongly demonstrated this correlation between the measured liver signal, the T2 or T2* values and LIC [6–13]. The T2 and T2* values are often converted to their reciprocals, R2 (1000/T2) and R2* (1000/T2*), measured in hertz per second.
All the studies that have compared MRI with liver biopsy for LIC determination have found a very high correlation, with 86–94% sensitivity and 81–100% specificity, for the diagnosis of moderate and high overload [6, 7, 11].
There are thus two different methods for quantifying LIC by MRI: relaxometry methods to evaluate T2 or T2*; and SIR methods to evaluate the signal of the liver parenchyma in MRI.
Relaxometry methods
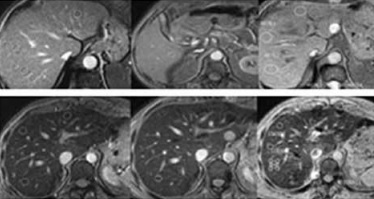
Relaxometry methods calculate T2/T2* transversal relaxation rates. To accurately plot the transversal relaxation curve it is necessary to have the maximum number of points on the curve over the relaxation time. Each measured point corresponds to one echo. Nowadays, multi-echo sequences are performed with a large number of increasing echoes for a few seconds. The first echo time is called TE, ‘echo train’ is the total number of echoes and ‘interval TE’ is the time between two echoes. The first TE must be very short in this method. High iron overload implies very fast changes in the relaxation curve and a very short TE is necessary in order to evaluate these early changes with the acceleration of the curve (Figure 1). The TE values are about 1 ms for the T2* methods and-approximately 4 ms for the T2 methods.
Figure 1
T2* relaxometry. Gradient multi-echo sequence, with 19 echoes (TR 21 ms, flip angle 35º, first echo 0.9 ms, TE interval 1 ms). Magnetic resonance image of the first nine echoes and graph of the T2* curve. A – Patient without iron overload: liver isosignal in all the echoes and T2 = 11.5 ms (normal T2 curve). B – Polytransfused patient with acute myeloblastic leukaemia: high iron overload, T2* = 2.5 ms; reduced liver signal visible from the first echoes; T2* curve different to patient A with a vertical first component of the curve
Recently, several T2/T2* relaxometry methods have been validated to quantify LIC accurately, using quantification of LIC on liver biopsies by spectrophotometry as a gold standard. Moreover, they have calculated mathematical formulas to transform T2/T2* values into LIC units, expressed in µmol Fe/g [8–11, 13].
Relaxometry methods are able to discriminate all the ranges of iron overload; furthermore, T2* methods are able to measure the iron concentration in the myocardium.
The most used T2 relaxometry method is Ferriscan (www.resonancehealth.com), approved by the U.S. Food and Drug Administration (FDA). An advantage of this method is that the correct quality of acquisition technique and post-processing is guaranteed because all calculations are done remotely from where the method was designed, in Australia. It has been the reference method in the majority of international multicentre clinical trials evaluating new iron chelant drugs in patients with haemosiderosis. However, the drawback is that the acquisition sequences are long and cannot be performed in apnoea, increasing the acquisition time and worsening the quality of images due to movements of the liver during breathing; it has an added cost per patient and 2 days are needed to obtain results.
The T2* relaxometry methods are acquired in breath-hold with shorter gradient echo sequences, giving better images without respiration artefacts. R2* values have a linear correlation with LIC [8, 10] and Garbowski (www.CMRtools.com) and Wood’s methods are the most widely used. Hankins and Henninger validated other T2* relaxometry methods [9, 13] with mathematical models to calculate LIC with R2* values.
Relaxometry methods have some differences in the acquisition parameters and in post-processing but all the mathematical formulas for calculating LIC in µmol Fe/g are very similar. All are reproducible in different machines when the acquisition and post-processing parameters of the method are exactly reproduced [11, 14–16]. There is still no agreement on a single universal method. However, a new acquisition sequence and post-processing method that takes into account the most important validated methods (www.MRquantif.org) has been designed recently by the University of Rennes [17, 18] and it is an interesting platform to compare different methods and move towards a universal language of T2* relaxometry techniques.
Iron overload in the liver can be associated with steatosis in very different kinds of diseases: metabolic syndrome and chronic hepatopathy [19], thalassaemia [20] and haemodialysis [21]. The presence of fat can alter the MRI estimation of LIC, especially in T2* relaxometry methods. To minimize this bias, new multi-echo sequences are able to evaluate the fat fraction and give a ‘corrected’ T2* value simultaneously. This type of sequence is known as a proton density fat fraction (PDFF). MRI vendors are optionally proposing their own versions of this technique: General Electric, ‘IDEAL-IQ’; Philips, ‘mDixon-Quant’; Siemens, ‘LiverLab’; Toshiba, ‘MR Body Expert’. These methods are already validated to estimate the fat fraction and some have already been evaluated for determining LIC, with promising results [22]. Although there are some differences between vendors, in the near future when they are widely accessible these sequences will be the solution to the interference between iron and fat.
Several studies that have correlated MRI with liver biopsies have found that the presence of fibrosis in the liver does not have a significant impact on the precision of LIC estimation by MRI [7, 23].
Signal intensity ratio methods
In SIR methods the signal intensities of the liver and paraspinal muscle are measured directly on the MR image. The muscle is taken as a reference tissue because it does not accumulate iron and the ratio of the liver signal intensity to that of the paraspinal muscle is calculated. Gradient echo sequences are used because of their greater sensitivity to the paramagnetic effect of iron. Thus, the difference between the liver and muscle signal intensity values basically depends on the value of iron overload. In order to be able to quantify different levels of iron overload more than one sequence is necessary [6, 7]. A very important technical aspect for all SIR methods is that the acquisition of quantification sequences must be performed with a body coil. A surface coil can be placed on the patient and even connected for other sequences of the study but it should not be activated for the acquisition of quantification sequences [17]. There is a major risk of erroneous calculation of LIC with these SIR methods.
Estimation of LIC by an SIR method is easier to perform than T2 relaxometry methods [6, 7]. The most significant advantage of SIR methods is that they are very accessible, all methods being feasible in every 1.5-tesla machine in the world. Moreover, acquisition technique and post-processing are standardized and the results are reproducible in different machines [24] (Figure 2). The limitations of SIR methods compared to T2 relaxometry methods are that they become saturated at very high iron overload and they cannot evaluate iron overload in the myocardium.
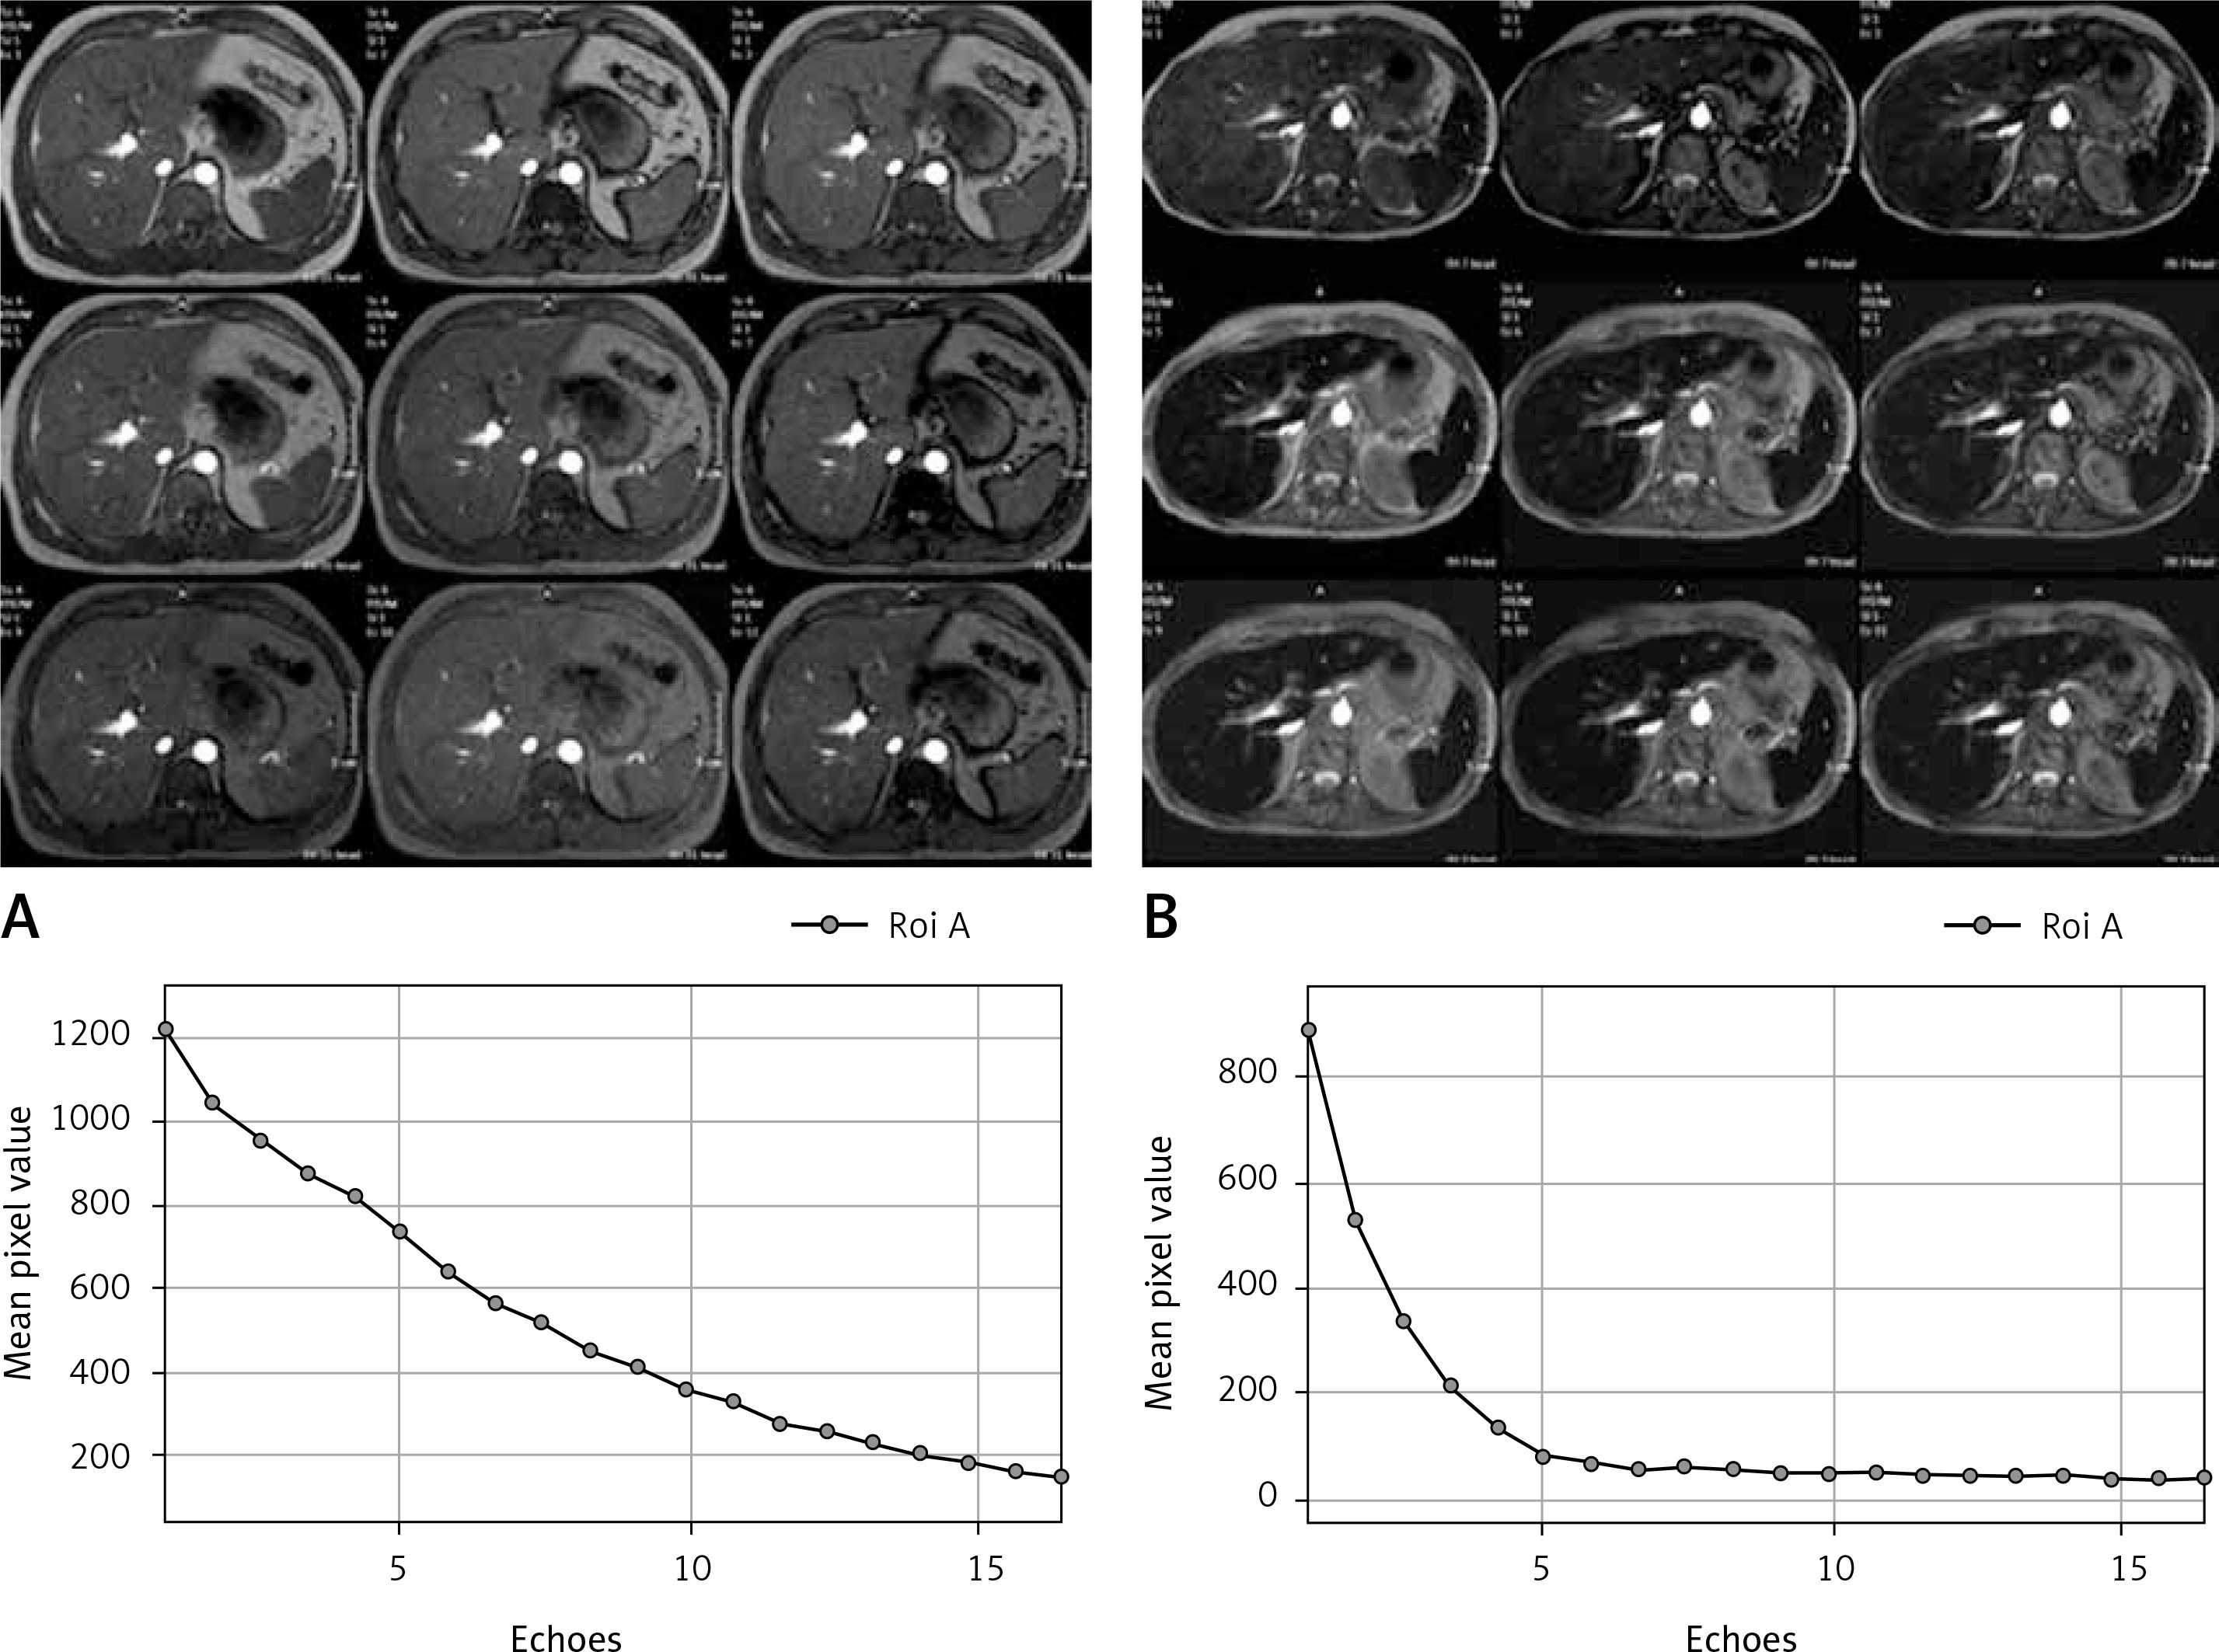
Figure 2
Reproducibility of quantification of liver iron concentration (LIC) by magnetic resonance imaging (MRI) with the signal intensity ratio (SIR) method. Three patients with different levels of LIC, each studied in five different MRI machines of 1.5 Tesla using the same method. Magnetic resonance image: gradient echo proton density sequence, TR 120 ms, TE 4 ms, flip angle 20º. Reference MR centre corresponds to the centre in which the method was validated [6]. Magnetic resonance units 1–4 correspond to four other machines located in the same city. A – Patient without iron overload: normal signal of the liver; LIC measured in each centre was 22, 15, 7, 14 and 10 µmol Fe/g, respectively. B – Patient with moderate overload: slight decrease in liver signal; measured LIC values were 65, 66, 60, 56 and 61 µmol Fe/g. C – Patient with high iron overload: large decrease in liver signal; measured LIC values were 249, 249, 270, 251 and 287 µmol Fe/g
Various SIR methods have been validated by liver biopsies and they have produced a formula to calculate LIC [6, 7, 12]. The method from the University of Rennes (France), published in 2004, has been used worldwide [7]. Several studies have shown that it overestimates patients with moderate overload [25–27] and recently it has been replaced by a new T2* relaxometry method (www.MRQuantif.org) that is also able to perform SIR calculations. Additionally, the Spanish Society of Abdominal Imaging (SEDIA, www.sedia.es) has developed a specific mathematical model to estimate LIC that shows a good correlation with relaxometry techniques [26, 27] (https://imagemed.univ-rennes1.fr/en/mrquantif/quantif.php). Both of these SIR methods [6, 7] saturate with very high iron overload, which means that they correctly recognize patients with high iron overload and that they should be treated but they are not precise in this range.
To overcome this saturation with high iron overload, a third method was developed by the University of Lille, France [12], specifically for patients with very high iron overload (http://oernst.f51vg.free.fr/liver/iron.html).
Evaluation of liver iron concentration using magnetic resonance imaging in clinical practice
Despite the scientific evidence generated during the last three decades showing the accuracy of MRI for evaluating LIC, there is still no agreement about which patients should be scanned by MRI in order to rule out iron overload.
Patients with hyperferritinaemia
The vast majority of patients with hyperferritinaemia do not present iron overload in the liver [28, 29]. However, it is important to recognize which of them have iron overload in order to be treated by phlebotomy [19, 30–33]. This treatment does not offer any benefit to patients without iron overload and, moreover, it can generate some complications [19, 34].
Four causes account for more than 90% of cases of hyperferritinaemia: alcohol, inflammation, cytolysis (hepatitis, neoplasms) and metabolic syndrome [28]. In general the clinical context (such as being overweight or hypertensive), some analytical parameters (hypertransaminasaemia, C-reactive protein, hyperlipidaemia, hyperglycaemia) [28, 29] and the absence of elevation of the TSI are enough for diagnosis and for ruling out iron overload. A TSI of > 45% has a sensitivity of 89% (specificity 61%) for iron overload in these patients [4, 35]. In patients with metabolic syndrome, iron overload is suspected when ferritin is > 450 µg/l [29, 36].
However, in clinical practice diagnosis is often difficult. In 40–50% of cases different pathologies able to generate hyperferritinaemia are simultaneously associated [28, 29]. Dysmetabolic iron overload syndrome is a disorder that can be present in patients with metabolic syndrome characterized by moderate iron overload (< 150 µmol Fe/g), often with a normal TSI [36]. Recently, haemodialysis-associated haemosiderosis has been encountered in nearly 50% of dialysis patients and serum iron markers are inaccurate for guiding iron repletion in chronic kidney disease [37].
Thus, there is no combination of ferritin and TSI values that can confirm or rule out iron overload in patients with hyperferritinaemia. Therefore, in cases where it is difficult to determine the cause, when several possible aetiologies are present simultaneously or when the level of ferritin tends to increase over time, hepatic MRI is indicated to evaluate the presence of iron overload [28, 38].
Iron overload secondary to liver disease
In the case of cutaneous porphyria, the benefit of the depletion of iron overload through phlebotomy is demonstrated [3]. However, with alcoholic liver disease no benefit has been shown [3]. Also, with hepatitis C, if the LIC is < 45 µmol Fe/g [3] then the patient should not be treated with phlebotomy. Several studies have shown that phlebotomy is not indicated in patients with liver disease if they do not have iron overload [19, 33, 34].
In these patients with liver disease, therefore, iron overload should always be confirmed using MRI before initiating a treatment with phlebotomy [34, 38].
Patients with hereditary haemochromatosis
According to some clinical guidelines [2–4] the diagnosis of HH linked to the HFE gene is made when simultaneous elevation of ferritin and TSI and C282Y HFE mutation in homozygosis are observed. However, not all patients with this mutation and simultaneous elevation of ferritin and TSI have a defined disease and they must only be treated if liver iron overload is demonstrated.
The cut-off point to define high iron overload in the range of haemochromatosis is 80 µmol Fe/g or a liver iron index of > 1.9 [2, 4]. The cut-off point for significant iron overload is 60 µmol Fe/g. It has been shown that with this level of LIC there is activation of stellate cells, which causes liver fibrosis [39]. Therefore, in these patients treatment with phlebotomy is required when the LIC is > 60 µmol Fe/g [40].
Most of the guidelines recognize that it is necessary to verify the presence of actual iron overload before starting treatment with phlebotomy and that it is contraindicated in the absence of iron overload [4, 31, 33, 41]. There is also agreement that MRI recognizes iron overload accurately [2, 4, 42] and that liver biopsy is no longer indicated for this purpose. Therefore, we can say that MRI with quantification of LIC is indicated in all patients diagnosed with haemochromatosis linked to the HFE gene before starting treatment. The level of LIC can predict the extent of the phlebotomy [2] and also the risk of liver fibrosis [43]. Magnetic resonance imaging may be used for follow-up after treatment.
In patients with elevated ferritin and TSI along with C282H/H63D or H63D/H63D mutations, it is considered that without other added factors these predisposing mutations do not generate high iron overload [1, 2]. Therefore, MRI will be indicated to decide whether or not the patient should be treated with phlebotomy (Figure 3).
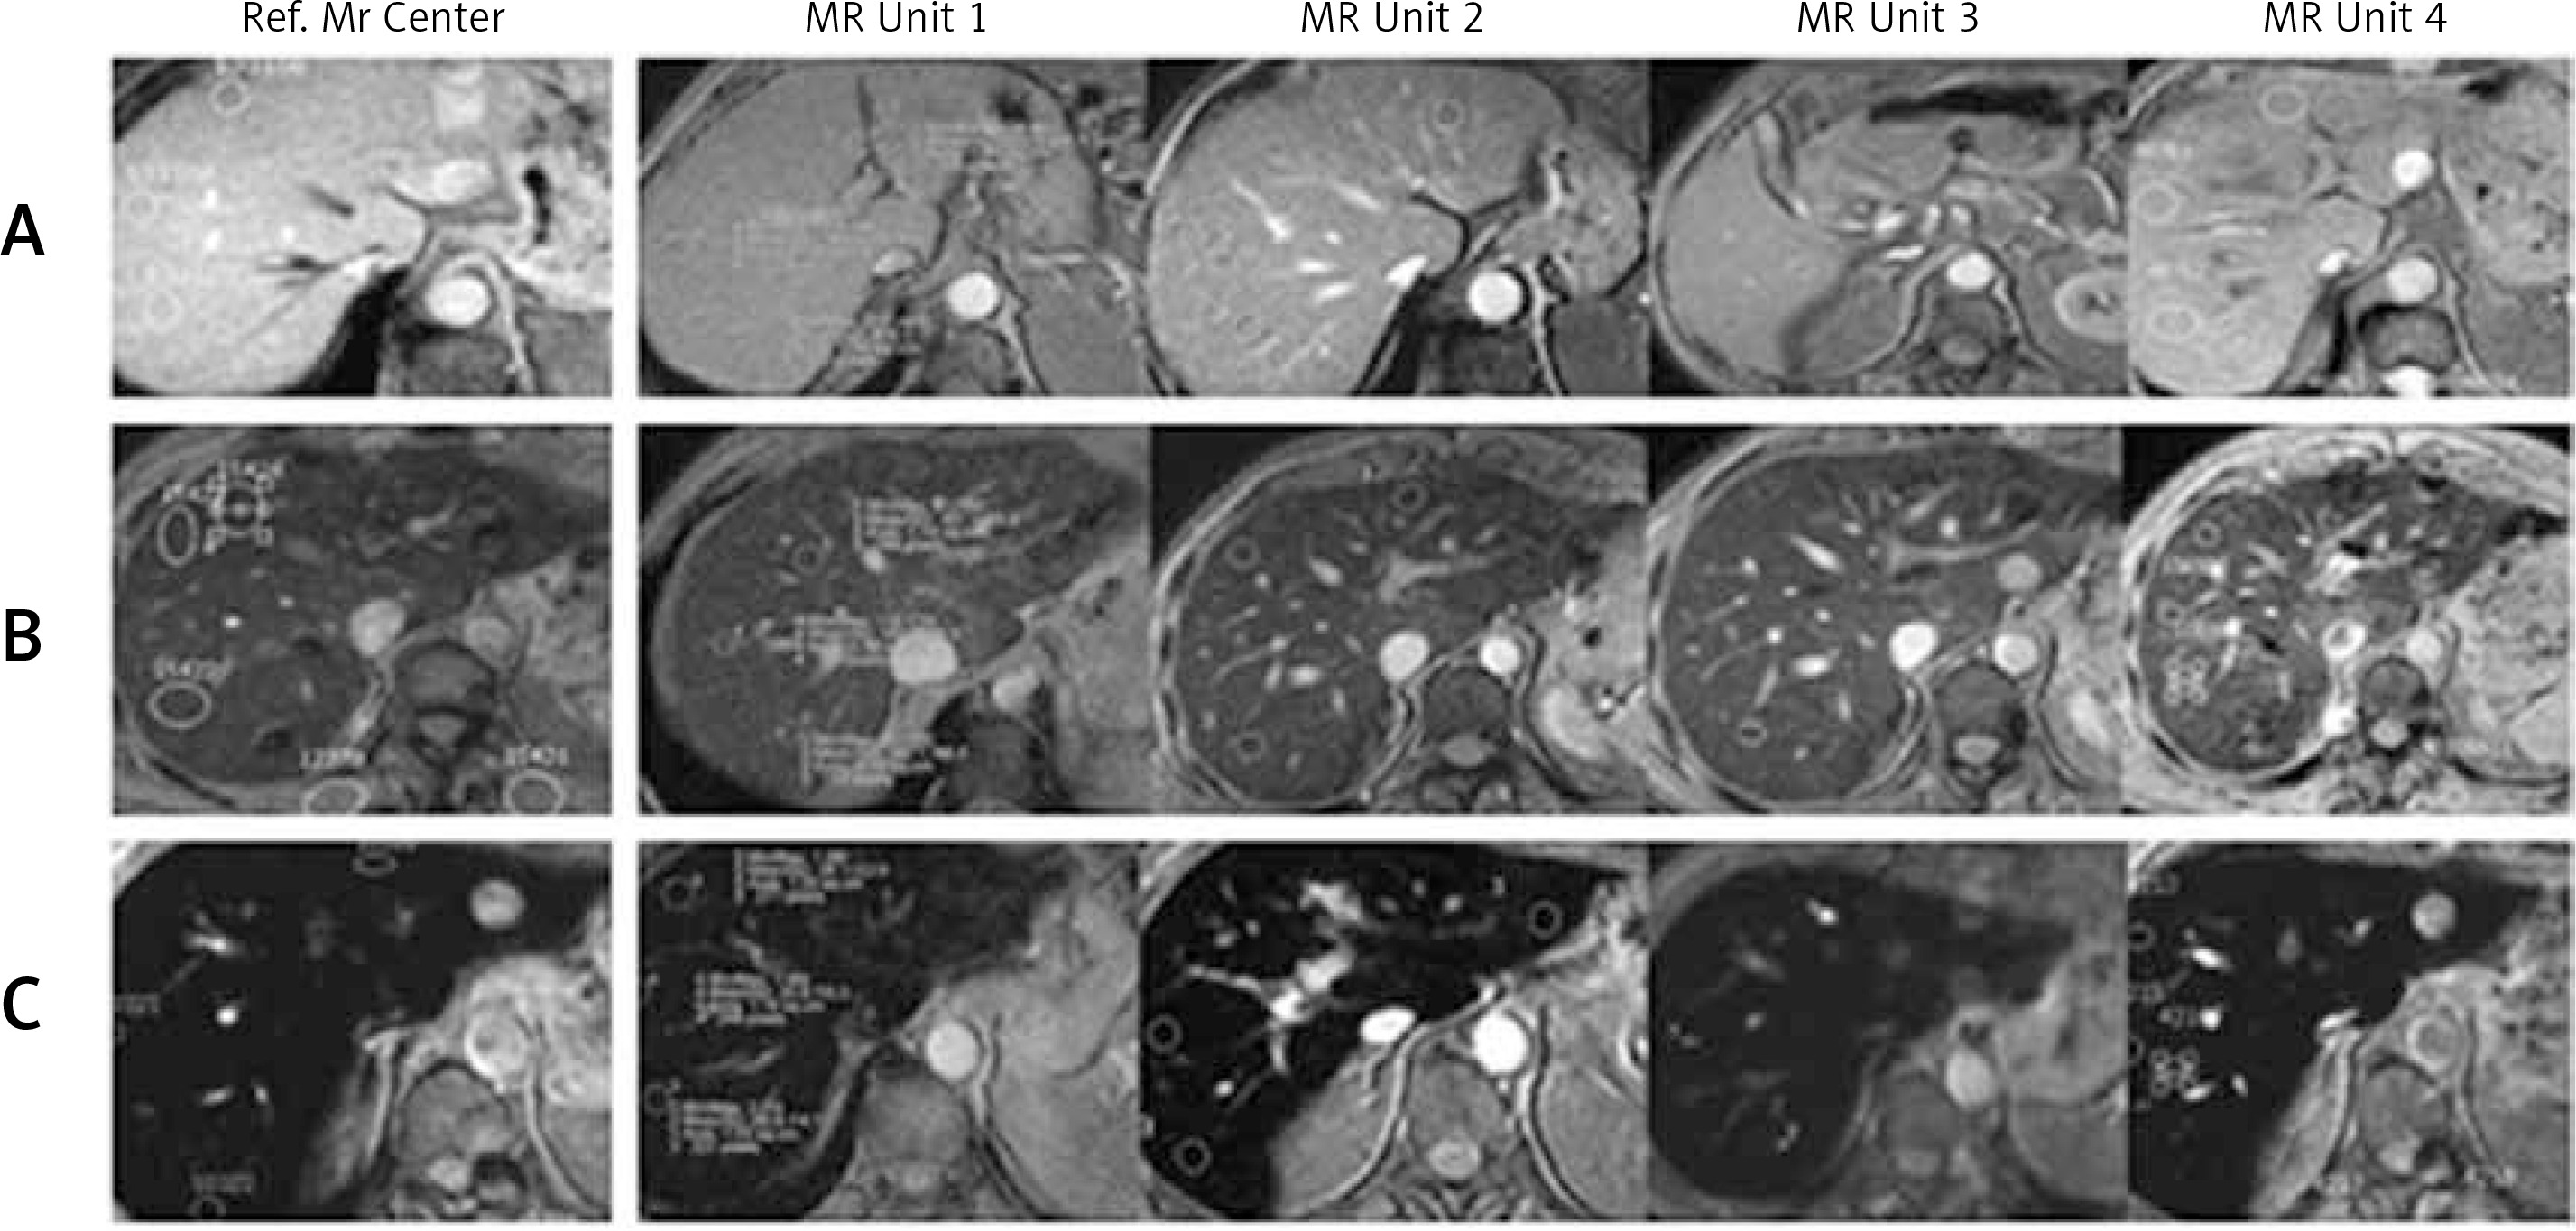
Figure 3
Two patients with C282Y/H63D mutation. A – Male, 52 years old, asymptomatic, ferritin 850 µg/l, transferrin saturation index (TSI) 55%, consumption of alcohol. Abdominal lymphoma discovered when performing hepatic magnetic resonance imaging (MRI) to evaluate liver iron concentration. Magnetic resonance image: gradient echo proton density (TR 120 ms, TE 4 ms, flip angle 20º). Normal signal of the liver, without iron overload. Liver iron concentration measured by MRI using signal intensity ratio (SIR) method: 12 µmol Fe/g. B – Asymptomatic 55-year-old male, ferritin 650 µg/l, TSI 60%, no risk factors for liver disease. Magnetic resonance image: gradient echo proton density (TR 120 ms, TE 4 ms, flip angle 20º). Decreased liver signal in relation to high iron overload. LIC measured by MRI using SIR method: 120 µmol Fe/g. C – Patient B 1 year later, after treatment with phlebotomy and normalization of ferritin and TSI. Magnetic resonance image: gradient echo proton density (TR 120 ms, TE 4 ms, flip angle 20º). Normal signal of the liver, with no iron overload. Liver iron concentration measured by MRI using SIR method: 19 µmol Fe/g
In patients with a negative genetic study, more advanced genetic studies should not be performed without iron overload having been previously demonstrated by MRI [2, 4, 41], and evaluation of LIC in these cases is indicated after eliminating other possible causes of elevated ferritin and TSI, such as liver disease, alcoholism, steatohepatitis or inflammation [1, 2].
Liver iron concentration determination and fibrosis prediction in hereditary haemochromatosis patients
The risk of significant fibrosis or cirrhosis has been associated with the level of LIC [38, 43]. Bassett et al. [44] introduced the concept of a threshold for LIC above which cirrhosis was more likely, and Sallie et al. [45] reported that, in addition to LIC, age over 45 years may be a risk factor for significant fibrosis or cirrhosis. Olynyk et al. [43] demonstrated that the duration of hepatic iron exposure, manifested by time and LIC, may be very relevant to the development of significant liver fibrosis. If the product of age and LIC (the fibrosis index) obtained by liver biopsy or by MRI is higher than 480,000, this results in 100% sensitivity and 86% specificity for the diagnosis of high-degree fibrosis (F3–F4) [43]. This fibrosis index has been validated externally, with good results [46].
Conclusions
The management of patients with suspected liver iron overload remains complicated [38]. Magnetic resonance imaging is an accurate, validated, reproducible and accessible diagnostic tool used to assess the actual presence of iron overload in the liver. The MRI technique should be used specifically in each of the different clinical contexts to reduce uncertainty in the management of these patients and treatment with phlebotomy should be used only for those with actual iron overload.