

Introduction
Hepatocellular carcinoma (HCC) is the most common form of liver cancer, accounting for approximately 90% of these cases [1]. Liver cancer is the sixth most commonly diagnosed cancer and ranks as the third leading cause of cancer-related death worldwide. Furthermore, its incidence rates have been increasing rapidly. Approximately 700,000 patients are diagnosed globally each year [2, 3]. Hepatectomy, the most promising treatment for patients, is accepted as the gold standard therapeutic option for patients with small HCC nodules. However, most patients who are diagnosed at an advanced stage miss the opportunity for surgical resection [4].
Despite high recurrence rates, some studies have reported recurrence rates as high as 60–80% within 5 years of resection; the overall survival rate is approximately 40–60%, and the disease-free survival rate is between 20% and 60% after 5 years [5–8]. Therefore, HCC recurrence can adversely impact long-term survival outcomes as well as patient quality of life [9]. The highest mortality rates and incidences of HCC have been observed in Southeast Asia and Northwest Africa [10].
Several prognostic schemes, such as the American Joint Committee on Cancer (AJCC TNM), Barcelona Clinic Liver Criteria (BCLC), Japan Integrated Staging Score (JIS score), and Cancer of the Liver Italian Program (CLIP), have been developed to identify prognostic factors [11–13].
Recently, studies have attempted to predict outcomes utilizing the primary characteristics of the disease [14, 15]. Many factors associated with HCC recurrence, such as tumor stage, large tumor size, portal vein tumor thrombus, hepatitis B surface antigen (HBsAg), hepatitis B virus-DNA (HBV-DNA) and α-fetoprotein (AFP) levels, have been identified [7, 16, 17]. Additionally, most of those studies have focused on identifying factors associated with an increased risk of tumor recurrence rather than entering the risk factors into multipredictor models that consider their joint effects.
Furthermore, it is important to identify prognostic factors associated with survival prior to treatment. However, only a few studies have integrated these factors into a nomogram to predict patient prognosis [18, 19]. In this study, we aimed to identify prognostic factors to develop a prediction model and identify clinicopathological variables that are associated with long-term survival. Thus, a nomogram model that can estimate individualized long-term overall survival following treatment is needed.
Material and methods
Study population and patients
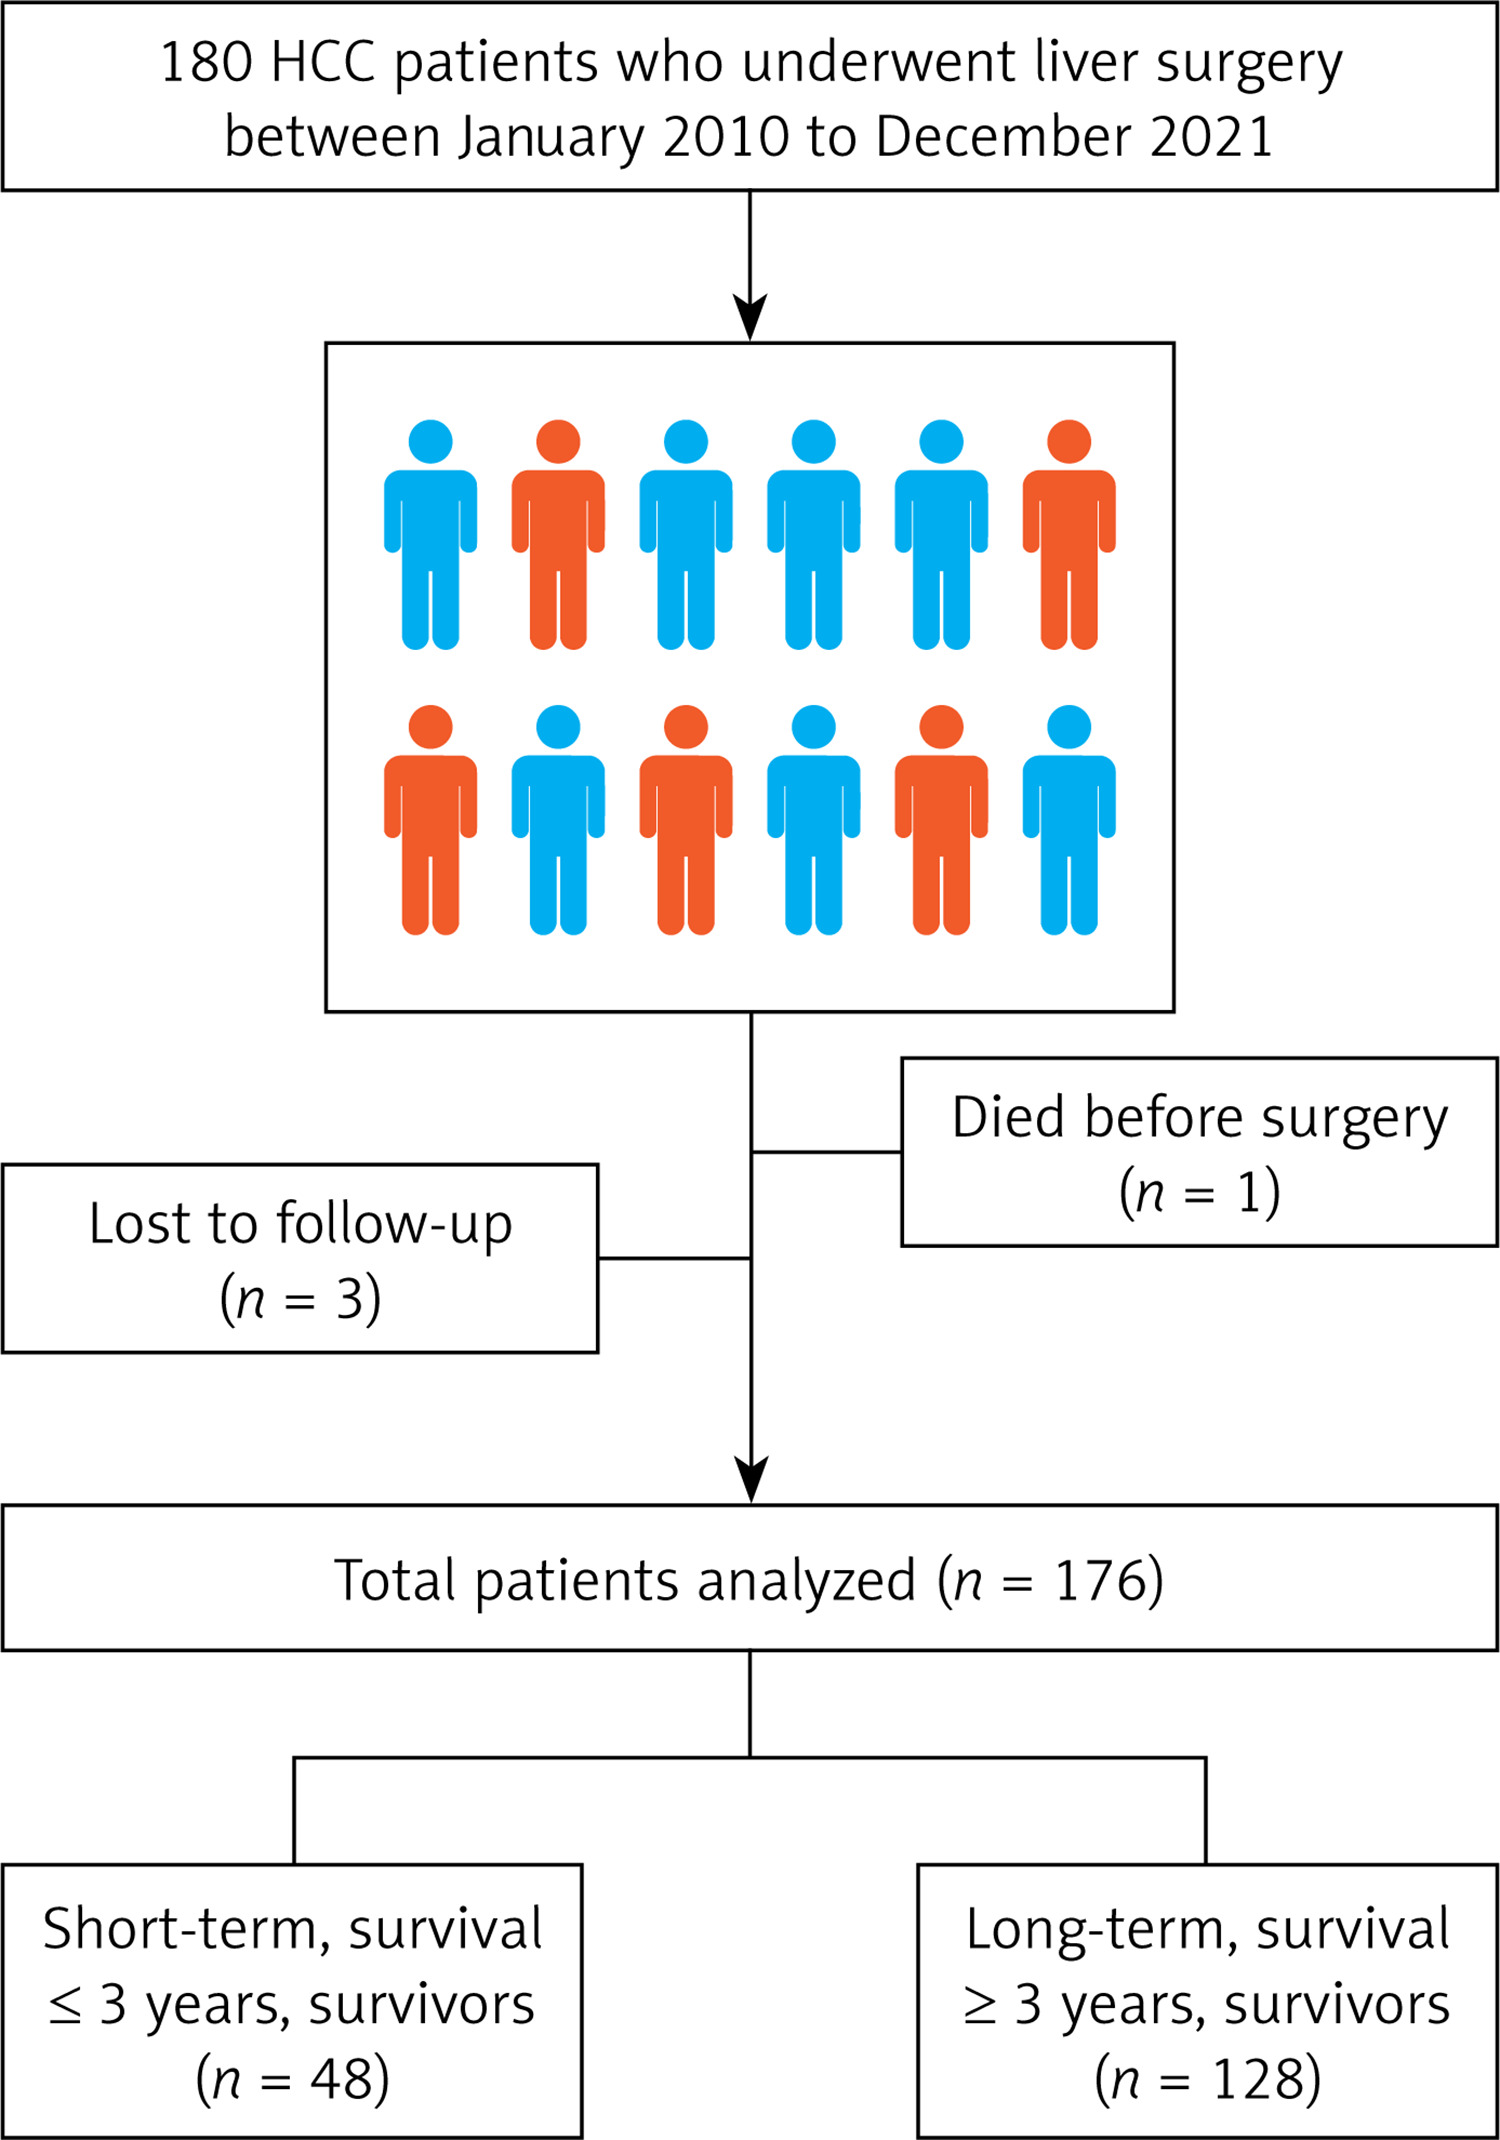
The selection procedure and study design are shown in Figure 1. We retrospectively analyzed 180 consecutive patients who had clinicopathological characteristics consistent with having HCC at our hospital between January 2010 and December 2021. Among the 180 patients, 1 (0.5%) died before surgery, and 3 (1.6%) patients were lost to follow-up. The inclusion criteria were as follows: (1) patients older than 30 confirmed with HCC, (2) no history of other diseases, and (3) no previous treatment for HCC before surgery. These patients were grouped into 2 different cohorts: a short-term survivor group, which included patients who survived for less than 3 years after surgical resection, and a long-term survivor group, which included patients who survived longer than 3 years after resection. The type of operation was determined by a multidisciplinary team (MDT), and all the surgeons had extensive liver surgery experience.
Figure 1
Patient selection flow diagram. Inclusion and exclusion criteria for evaluating prognostic factors after surgery in patients with HCC. We focused on two subsets., i.e., individuals who survived 3 years or less (short-term survivors) and those who survived 3 years or more (long-term survivors). Four patients were excluded. Results: Forty- eight short-term patients and 128 long-term patients were enrolled in this clinical study
Clinicopathologic variables
Baselines for standard demographics, preoperative data, operative and pathological characteristics, and postoperative data were retrospectively reviewed. The demographic data included age, sex (male or female), follow-up, disease recurrence, tumor stage, lymph node metastasis, tumor size, and histopathological grading, and were categorized on the basis of the eighth edition of the American Joint Committee on Cancer (AJCC) TNM guidelines. The tumor (T) stage, lymph node (N) status, TNM status, and overall survival were retrieved from the patients’ hospital records. The following characteristics were included: hepatitis B virus (HBsAb, HBeAg), hepatitis C virus (HCV), AFP, CEA, CA19-9, CA-125, and ferritin on the basis of their previously suggested associations with HCC recurrence. The pathological data included tumor size, tumor number, cirrhosis status, tumor stage (I, II, III and IV), macrovascular invasion (present or absent), and resection margin status (negative or positive). Recurrences were also documented.
Follow-up
We examined the patients every 3 to 6 months for the first 2 years after hospital discharge and every 6 months thereafter. The follow-up evaluation included a physical examination, chest radiography, and blood examination, which included analyses of tumor markers (abdominal ultrasound, multiphasic CT or MRI, liver function tests, AFP measurements, and CA-125 measurements).
Recurrence was diagnosed on the basis of physical examinations, diagnostic imaging results, and tumor markers. The date of recurrence was defined as the time interval between the date of primary liver resection and the date that evidence of recurrence was confirmed by a physician.
Statistical analysis
The primary endpoint was overall survival (OS), which was calculated from the date of resection to the date of death or the last follow-up investigation and analyzed via the Kaplan-Meier method.
Recurrence-free survival (RFS) was calculated from the date of resection to the date of disease progression, last follow-up investigation, or death.
Kaplan-Meier survival curves were used to assess OS and RFS. These data are reported herein as medians with 95% confidence intervals (95% CIs). Differences were considered statistically significant if the p-value was lower than 0.05 according to the log-rank test.
To identify the prognostic factors related to OS and RFS, multivariate analysis was performed via the Cox regression hazard model for statistically significant variables in the univariate analysis and to identify the associations between potentially important clinical factors and long-term survival after HCC resection.
After the importance of all independent variables was evaluated through the univariate Cox regression hazard model, significant variables (p < 0.05) were extracted and included in the multivariate Cox regression hazard models for further analysis. The data are presented with hazard ratios (HRs) and 95% confidence intervals (CIs). Multivariate Cox regression analysis was employed to identify the final risk factors (p < 0.05) for establishing a nomogram to predict the risk of HCC.
Prognostic factors identified in the multivariate Cox regression analysis were used to establish a nomogram to predict OS and RFS between 1 and 5 years after surgery. To evaluate the predictive performance of the nomogram, Cox regression analysis was performed with the R package version 4.3.3 to calculate the C-index and develop calibration curves. Random OS and RFS forest plots were generated to identify the importance of the variables.
All the data were analyzed via SPSS 27.0 and R package version 4.3.3 (R Foundation for Statistical Computing, Vienna, Austria). Two-sided p-values were considered statistically significant if p < 0.05.
Results
Baseline characteristics of the patient cohort
After applying the eligibility criteria, the final study population consisted of 176 patients. Details of the flow diagram are presented in Figure 1. The median overall survival was 43 months (range: 4–82 months), and the median recurrence-free survival was 39 months (range: 2–75 months). The median follow-up was 66 months for patients who survived at the end of the study. Kaplan-Meier analysis revealed that the 1-, 3-, 5-, and 10-year overall survival rates were 98.9%, 77.1%, 55.9%, and 43.1%, respectively (Figure 2). Furthermore, the 1-, 3-, 5-, and 10-year RFS rates were 82.9%, 41.0%, 23.3%, and 18.5%, respectively (Figure 3). After the exclusion of 4 patients who either died before the operation or were lost to follow-up, 176 patients were included in the comparative analyses. Among these 176 patients, 48 (27.3%) patients survived ≤ 3 years and were sorted into the short-term survival group. The remaining 128 (72.7%) patients survived for > 3 years and were designated as the long-term survival group. The baseline patient characteristics are displayed in Table I.
Figure 2
Kaplan-Meier curve showing the overall survival (OS) rate of the entire cohort of patients in the study
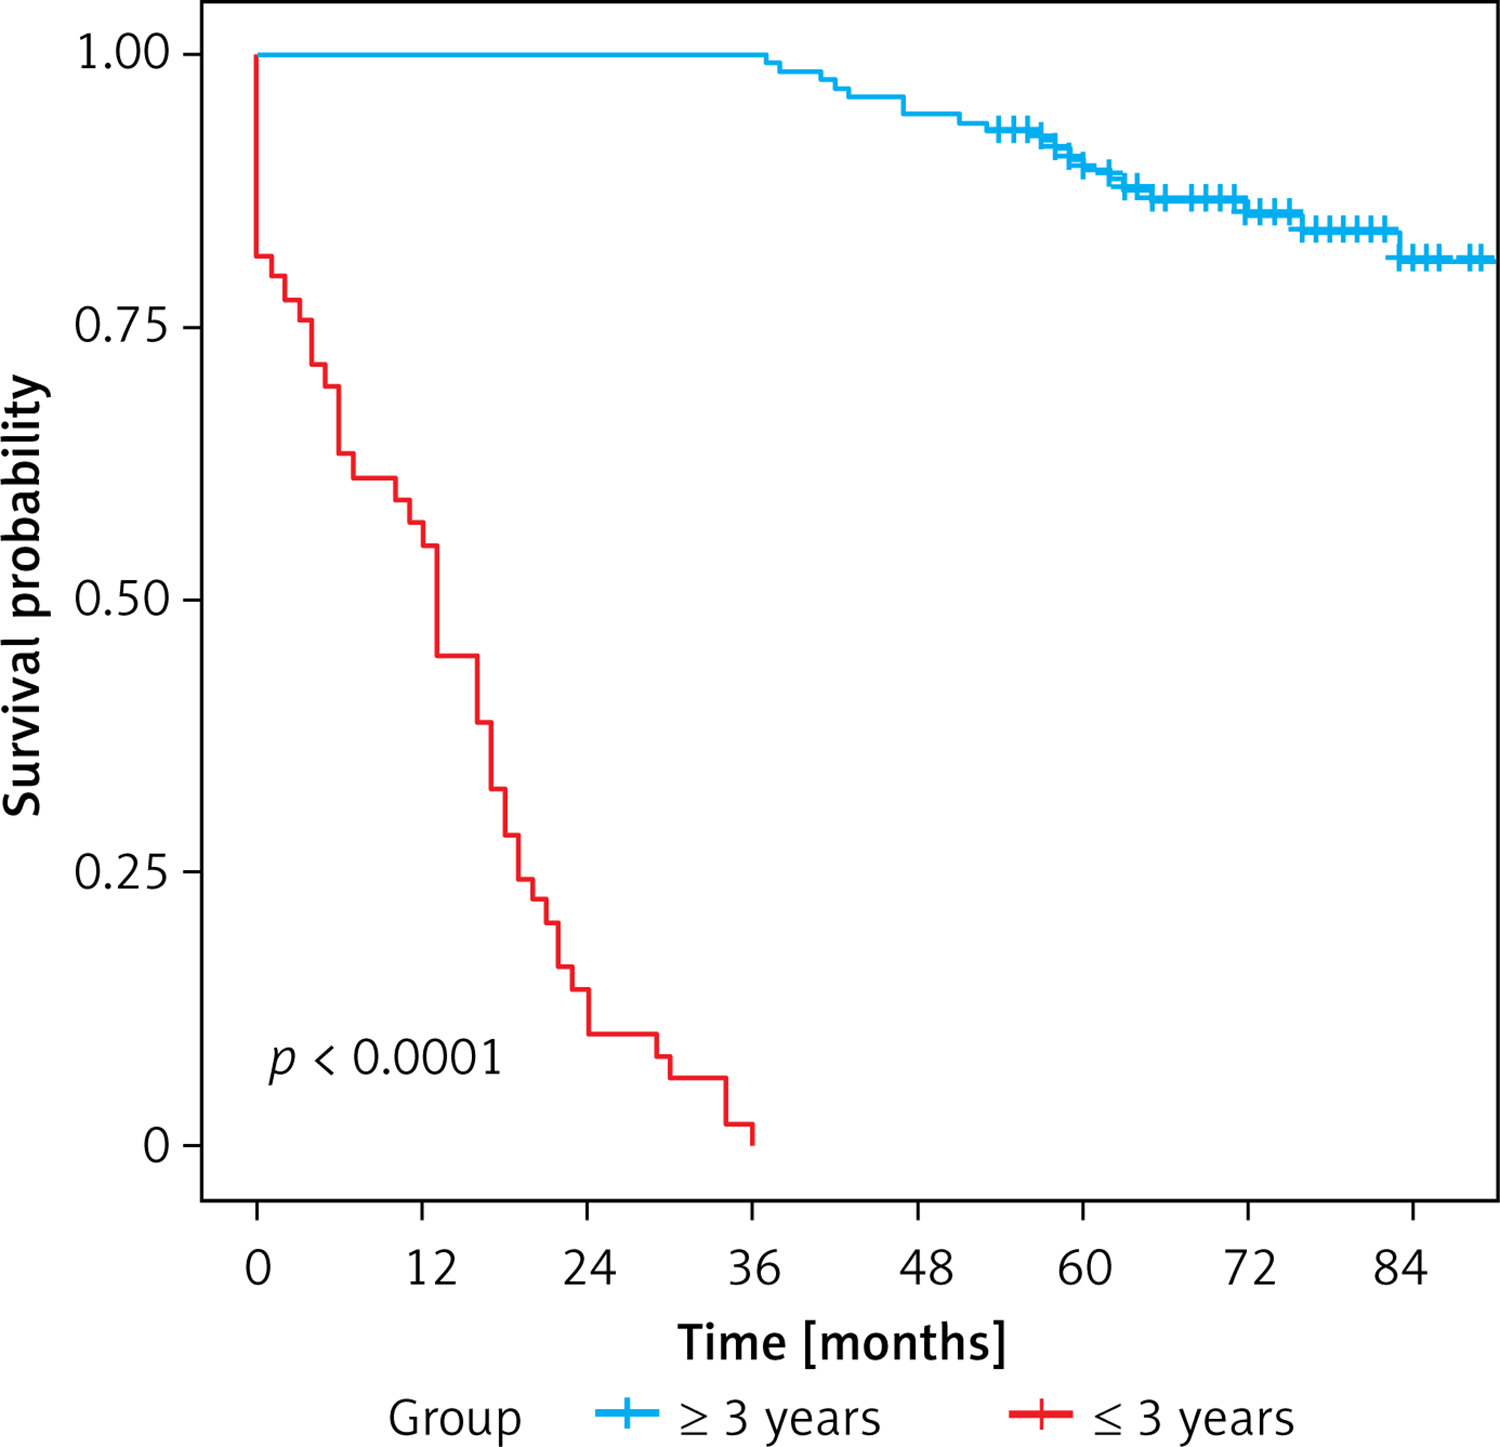
Figure 3
Kaplan-Meier curve showing the recurrence- free survival (RFS) rate of the entire cohort of patients included in the study
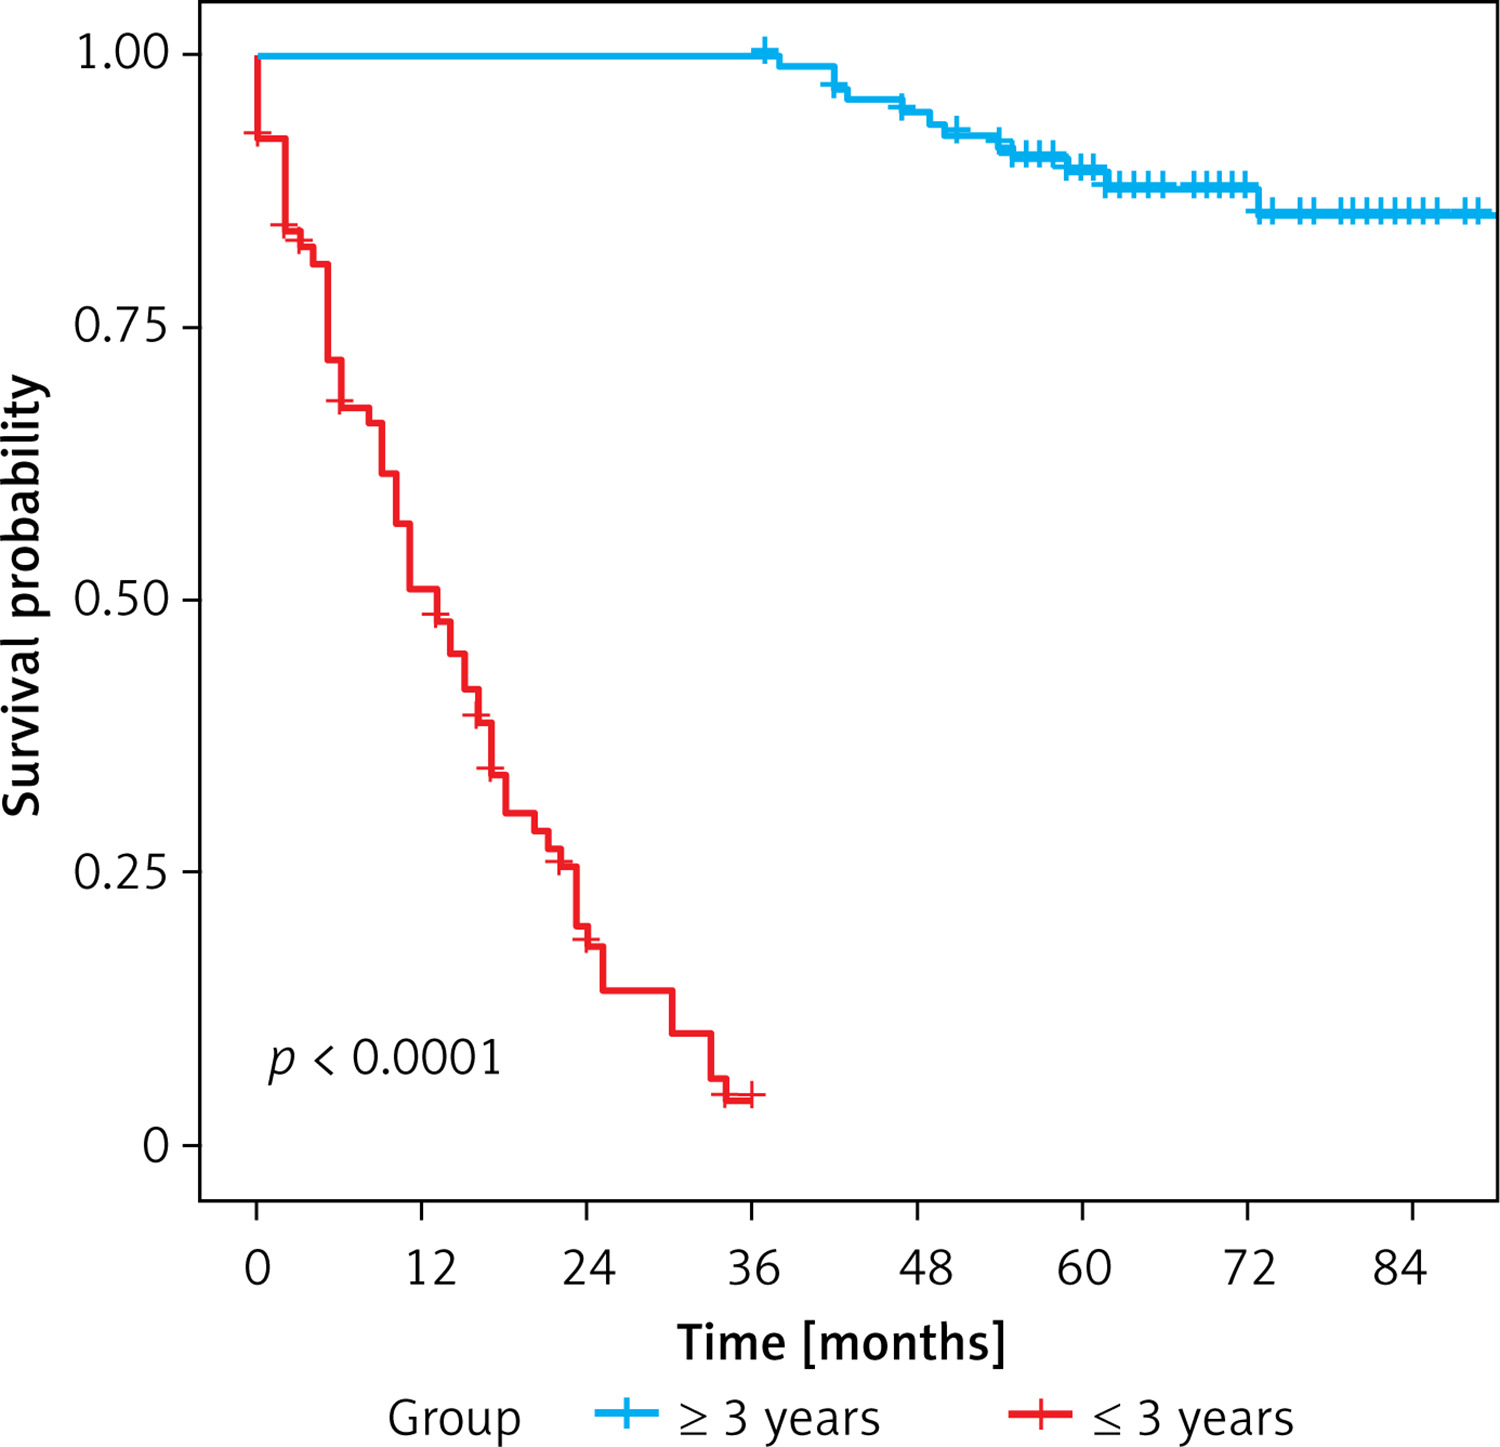
Table I
Baseline patient characteristics and outcomes
Regarding patient characteristics, the majority of variables were not significantly different between the two groups. However, there were significant differences in age (p = 0.002), BMI (p = 0.016), smoking status (p = 0.042), tumor stage (p < 0.001), serum albumin levels (p = 0.001), and CA-125 concentrations (p = 0.026).
Both OS and RFS were significantly different (p < 0.001). The histopathological findings and resection margins were also compared between patients in the two groups (Table II). The short- to long-term survival group had significantly greater values for the following variables: tumor size (p < 0.001), tumor number (p < 0.001), recurrence (p < 0.001), hospital stay (p = 0.005), and presence of portal vein thrombus (p < 0.001).
Table II
Histopathological findings and resection outcomes
Univariate and multivariate analysis of survival outcomes and predictive factors
Since long-term survival is rather poor in patients with HCC, one goal of this investigation was to determine the impact of various variables on long-term OS. A logistic regression analysis with iterative backward and forward testing was employed with the following variables as the input: age at the time of the operation, sex, underlying liver disease risk factors (such as smoking and alcohol use), and preoperative and postoperative outcomes. Several factors were identified as being significantly different between the ≤ 3-year survivors and the > 3-year survivors in the univariate analysis of overall survival via Cox regression model analysis. These factors included: age: HR: 1.059, 95.0% confidence interval CI: 1.037–1.083 (p < 0.001), BMI: HR = 0.917, 95.0% CI: 0.852–0.987 (p = 0.022), HBc-IgM: HR = 0.238, 95.0% CI: 0.112–0.504 (p < 0.001), albumin: HR = 0.931, 95.0% CI: 0.892–0.972 (p = 0.001), AFP: HR = 1.0, 95.0% CI: 1.0–1.0 (p = 0.059), CA19-9: HR = 1.003, 95.0% CI: 1.002–1.005 (p < 0.001), CA-125: HR = 1.005, 95.0% CI: 1.001–1.008 (p = 0.01), tumor size: HR = 1.238, 95.0% CI: 1.172–1.308 (p < 0.001), multiple tumors: HR = 4.294, 95.0% CI: 2.750–6.705 (p < 0.001), tumor stage: HR = 2.76, 95.0% CI: 0.273–2.132 (p < 0.001), recurrence: HR = 0.600, 95.0% CI: 0.472–0.762 (p < 0.001) MVI (M1/M2/M3): HR = 17.107, 95.0% CI: 2.189–133.6 (p = 0.002), and metastasis: HR = 0.510, 95.0% CI: 0.285–0.912 (p = 0.023).
On the other hand, the multivariate OS analysis factors were as follows: age: HR = 1.043, 95.0% CI: 1.018–1.069 (p < 0.001), BMI: HR = 0.884, 95.0% CI: 0.807–0.969 (p = 0.009), HBc-IgM: HR = 0.139, 95.0% CI: 0.054–0.356 (p < 0.001), albumin: HR = 0.946, 95.0% CI: 0.900–0.995 (p = 0.032), tumor size: HR = 1.027, 95.0% CI: 1.106–1.318 (p < 0.001), multiple tumors: HR = 2.027, 95.0% CI: 1.018–4.396 (p = 0.024), tumor stage: HR = 0.562, 95.0% CI: 0.323–0.977 (p = 0.041), MVI (M0): 0.083, 95.0% CI: 0.009–0.797 (p = 0.031), metastasis: HR = 0.398, 95.0% CI: 0.168–0.941 (p = 0.036).
According to the results of this analysis, which are summarized in Table III, these factors can predict survival outcomes after resection.
Table III
Univariate and multivariate Cox regression analyses of predictive factors for overall survival (OS)
Univariate and multivariate analysis of predictors of recurrence-free survival after resection
The univariate Cox regression analysis model for RFS revealed that the following factors were significantly associated with lower RFS: age, sex, tumor number, tumor size, tumor stage, and the presence of portal vein thrombus. Table IV shows the following predictive factors: age: HR = 1.056, 95% confidence interval (CI): 1.035–1.078 (p < 0.001); smoking: HR = 0.780, 95% CI: 0.620–0.982 (p = 0.035); HBc-IgM: HR = 0.310, 95% CI: 0.111–0.866 (p = 0.025); AFP: HR = 1.0, 95% CI: 1.0–1.0 (p = 0.019); CA-125: HR = 1.006, 95% CI: 1.002–1.009 (p = 0.005); tumor size: HR = 1.206, 95% CI: 1.138–1.279 (p < 0.001); tumor number: HR = 5.883, 95% CI: 3.790–9.131 (p < 0.001); and tumor stage: HR = 0.216, 95% CI: 0.143–0.326 (p < 0.001), recurrence: HR = 0.044, 95.0% CI: 0.013–0.149 (p < 0.001). Moreover, the multivariate Cox analysis revealed that only two factors were significant: HBc-IgM (HR = 0.170, 95.0% CI: 0.064–0.450 (p < 0.001)) and recurrence (HR = 0.401, 95.0% CI: 0.282–0.571 (p < 0.001)).
Table IV
Univariable and multivariate Cox regression results Prognostic factors were associated with recurrence-free survival (RFS)
Otherwise, on the basis of this rationale, the variables were chosen for survival analysis. The proportionality assumption for the Cox model was tested via Pearson’s χ2 test, as shown in Table V, and RFS, as shown in Table VI.
Table V
Assessment of the risk proportionality assumption by the Cox model of overall survival
| Variables | Univariate Cox model | Multivariate Cox model | ||
|---|---|---|---|---|
| χ2 | P-value* | χ2 | P-value* | |
| Age | 23.5053 | < 0.001 | 19.91799 | < 0.001 |
| BMI | 0.1769 | 0.67401 | ||
| Albumin | 12.0677 | 0.00051 | 11.3691 | 0.00075 |
| CA125 | 1.3878 | 0.23879 | ||
| Tumor size | 0.6817 | 0.40899 | 0.33671 | 0.56173 |
| Tumor number | 0.1014 | 0.75014 | 0.00139 | 0.97022 |
| Smoking | 0.0598 | 0.80683 | ||
| Tumor stage | 5.1826 | 0.1589 | ||
| Recurrence | 7.3856 | 0.00657 | ||
| Portal vein thrombosis | 1.0079 | 0.60413 | 0.88675 | 0.64187 |
Table VI
Assessment of the risk proportionality assumption by the Cox model of recurrence-free survival
| Variables | Univariate Cox model | Multivariate Cox model | ||
|---|---|---|---|---|
| χ2 | P-value* | χ2 | P-value* | |
| Age | 0.1923 | 0.661 | 4.485 | 0.034 |
| Albumin | 0.6972 | 0.404 | ||
| Tumor size | 2.4729 | 0.116 | 1.038 | 0.308 |
| Tumor number | 0.5198 | 0.471 | 0.323 | 0.570 |
| Smoking | 2.1657 | 0.141 | ||
| HBV-PreS2Ag | 5.5375 | 0.019 | ||
| Portal vein thrombosis | 2.7783 | 0.249 | 2.733 | 0.255 |
| Tumor stage | 0.0817 | 0.775 | 1.924 | 0.165 |
| Recurrence | 0.0131 | 0.909 | ||
Survival after tumor recurrence
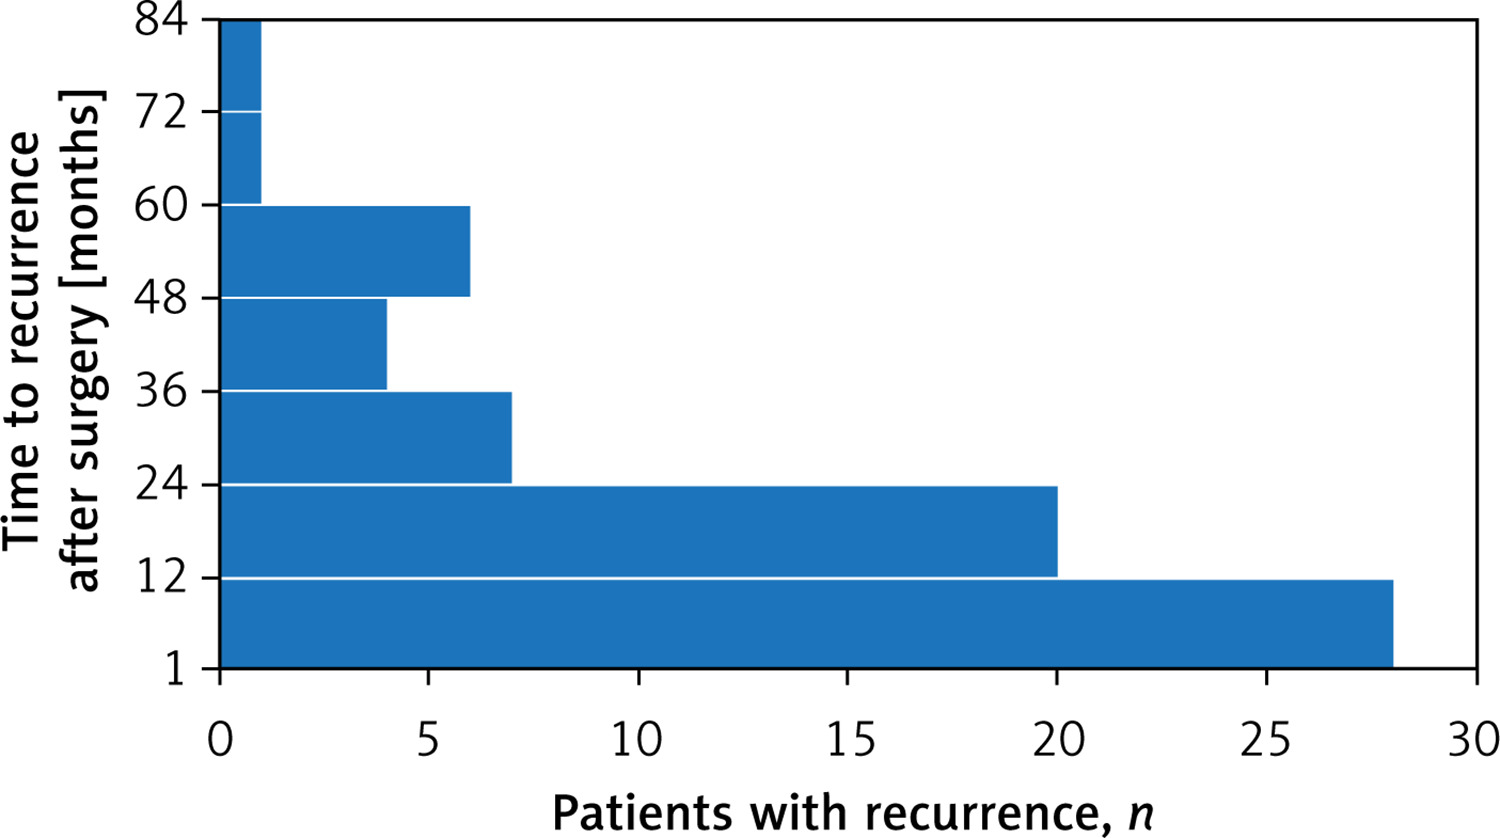
The timing of recurrence is shown in Figure 4. The time interval between HCC resection and recurrence ranged from 2 to 84 months (median = 39 months). In 73 of 176 patients (41%) (p < 0.001), recurrence developed within 84 months after resection. Figure 4 summarizes these results in a bar graph that shows a small peak.
Nomogram predictive model
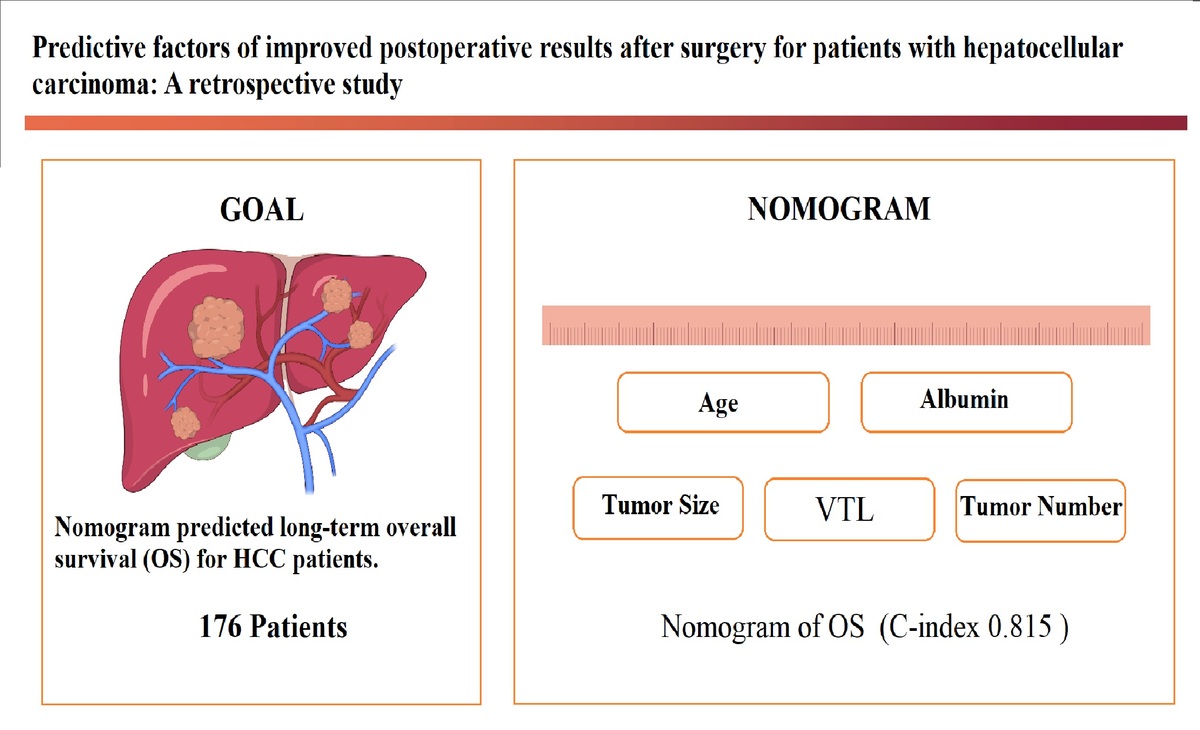
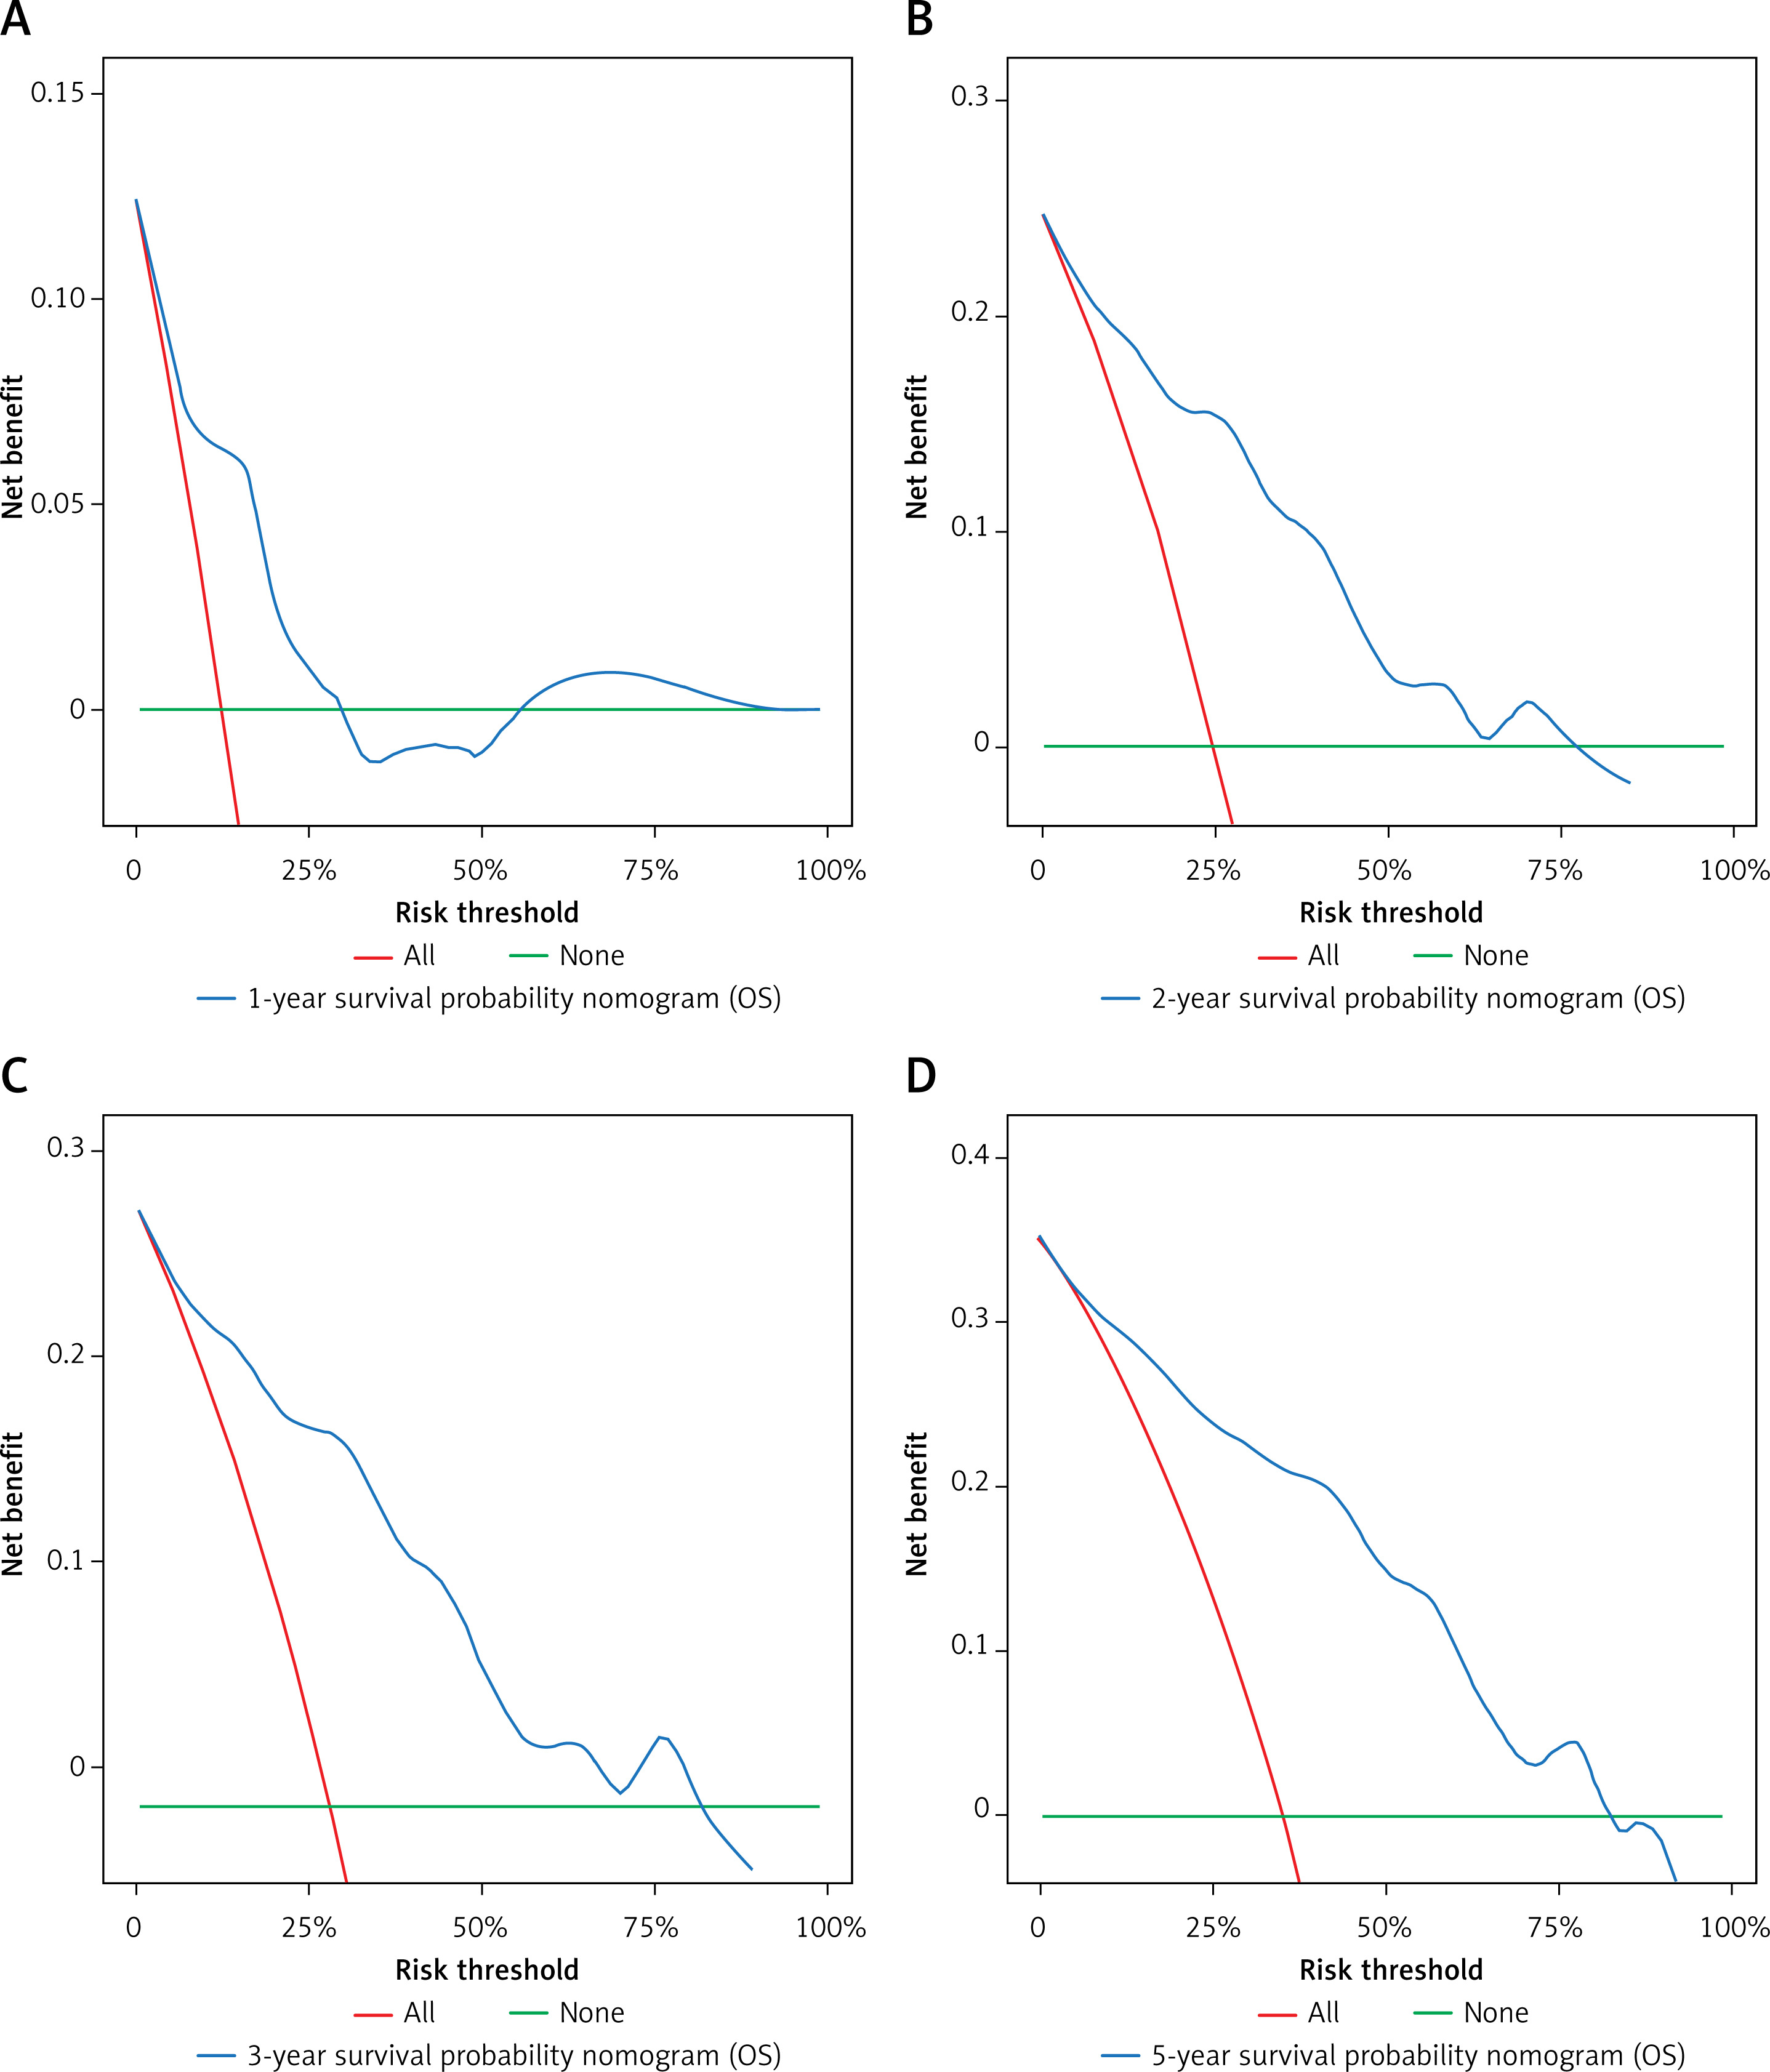
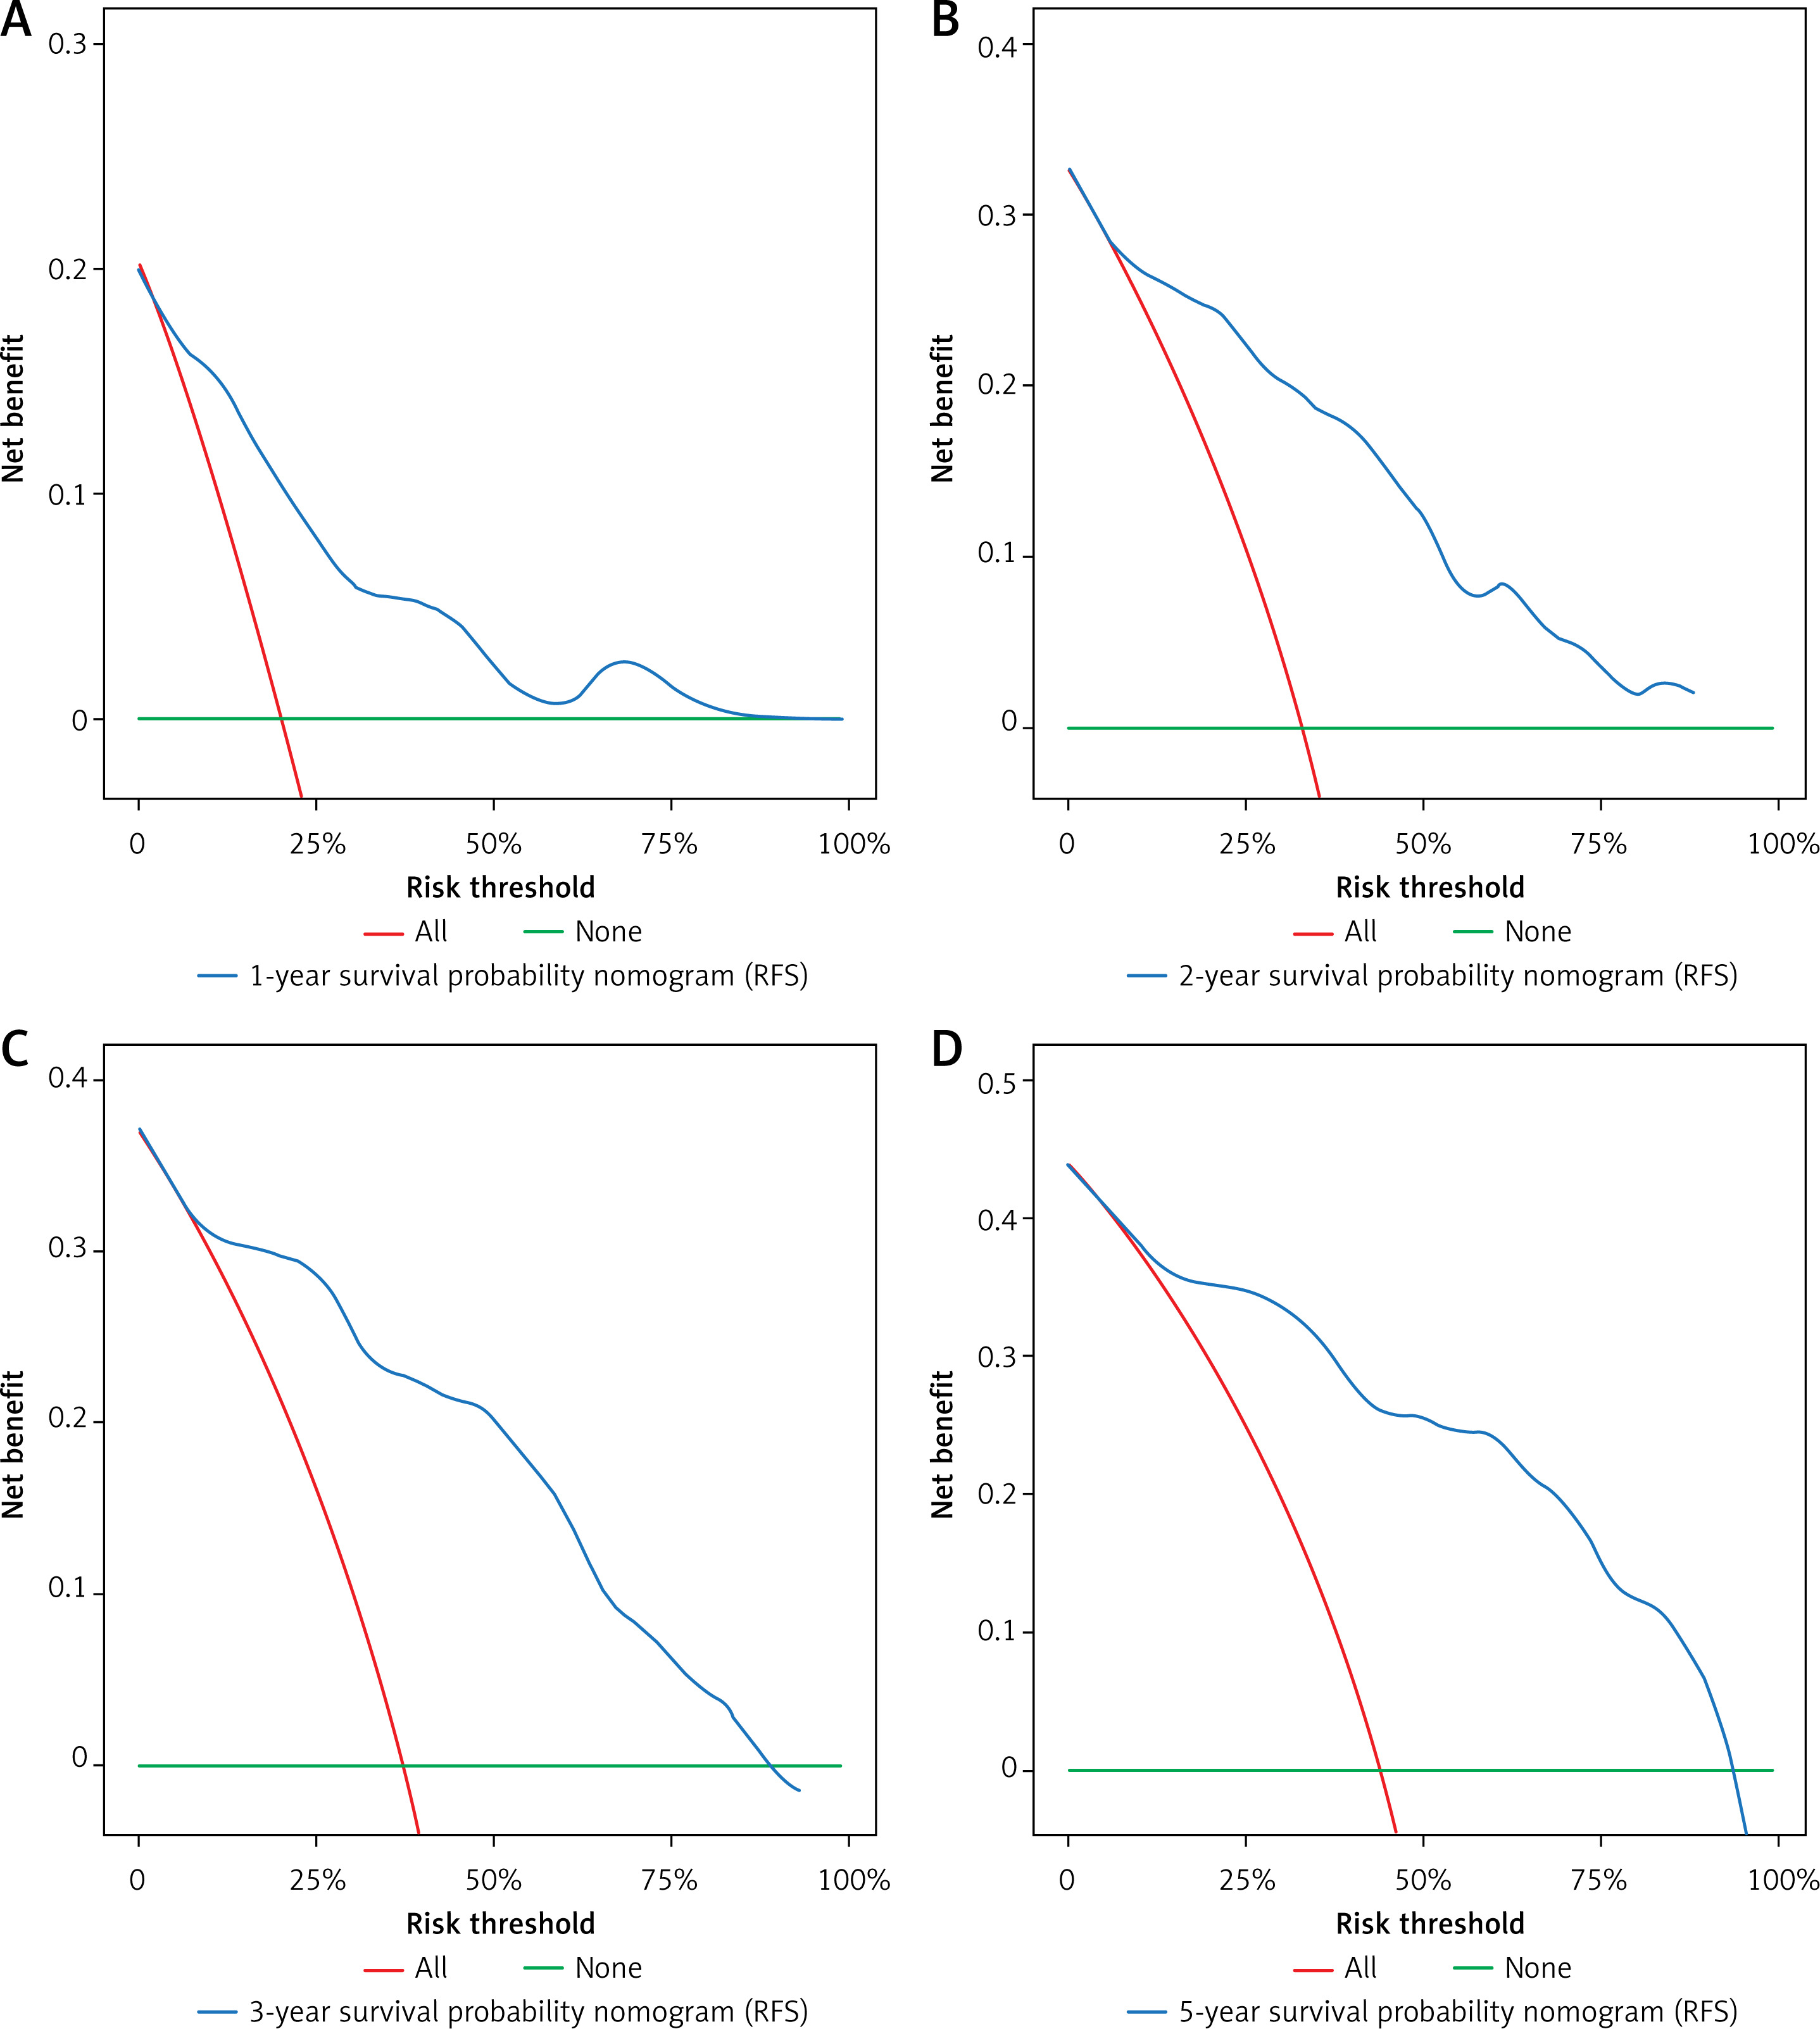
By using the five predictive variables mentioned above, a nomogram for predicting 1-, 2-, 3-, and 5-year overall survival outcomes was developed (Figure 5). In the random forest analysis, initial resection treatment was the most important prognostic factor, followed by age, albumin level, tumor size, tumor number, and vascular tumors of the liver (VTL; portal vein thrombosis and other cancer embolisms). The C-index of the nomogram for overall survival was 0.815 (95% CI: 0.769–0862 (p < 0.001)) (Table VII). The internal calibration curves for predicting the 1-, 2-, 3-, and 5-year overall survival probabilities showed favorable calibration for predicting survival rates and correlated well with the actual survival rates at 1, 2, 3, and 5 years (Figure 6). Each variable was scored between 0 and 100 points. The time-dependent ROC curve nomograms that were used to predict 1-, 2-, 3-, and 5-year OS indicated that operation-related prognostic factors had major impacts on patient prognosis. The 1-, 2-, 3-, and 5-year AUCs for OS were 0.786, 0.858, 0.872, and 0.868, respectively (Figure 7). Additionally, the decision curve analysis (DCA) curves revealed that the nomogram had high prediction efficiency for OS in patients with HCC (Figures 8 A–D).
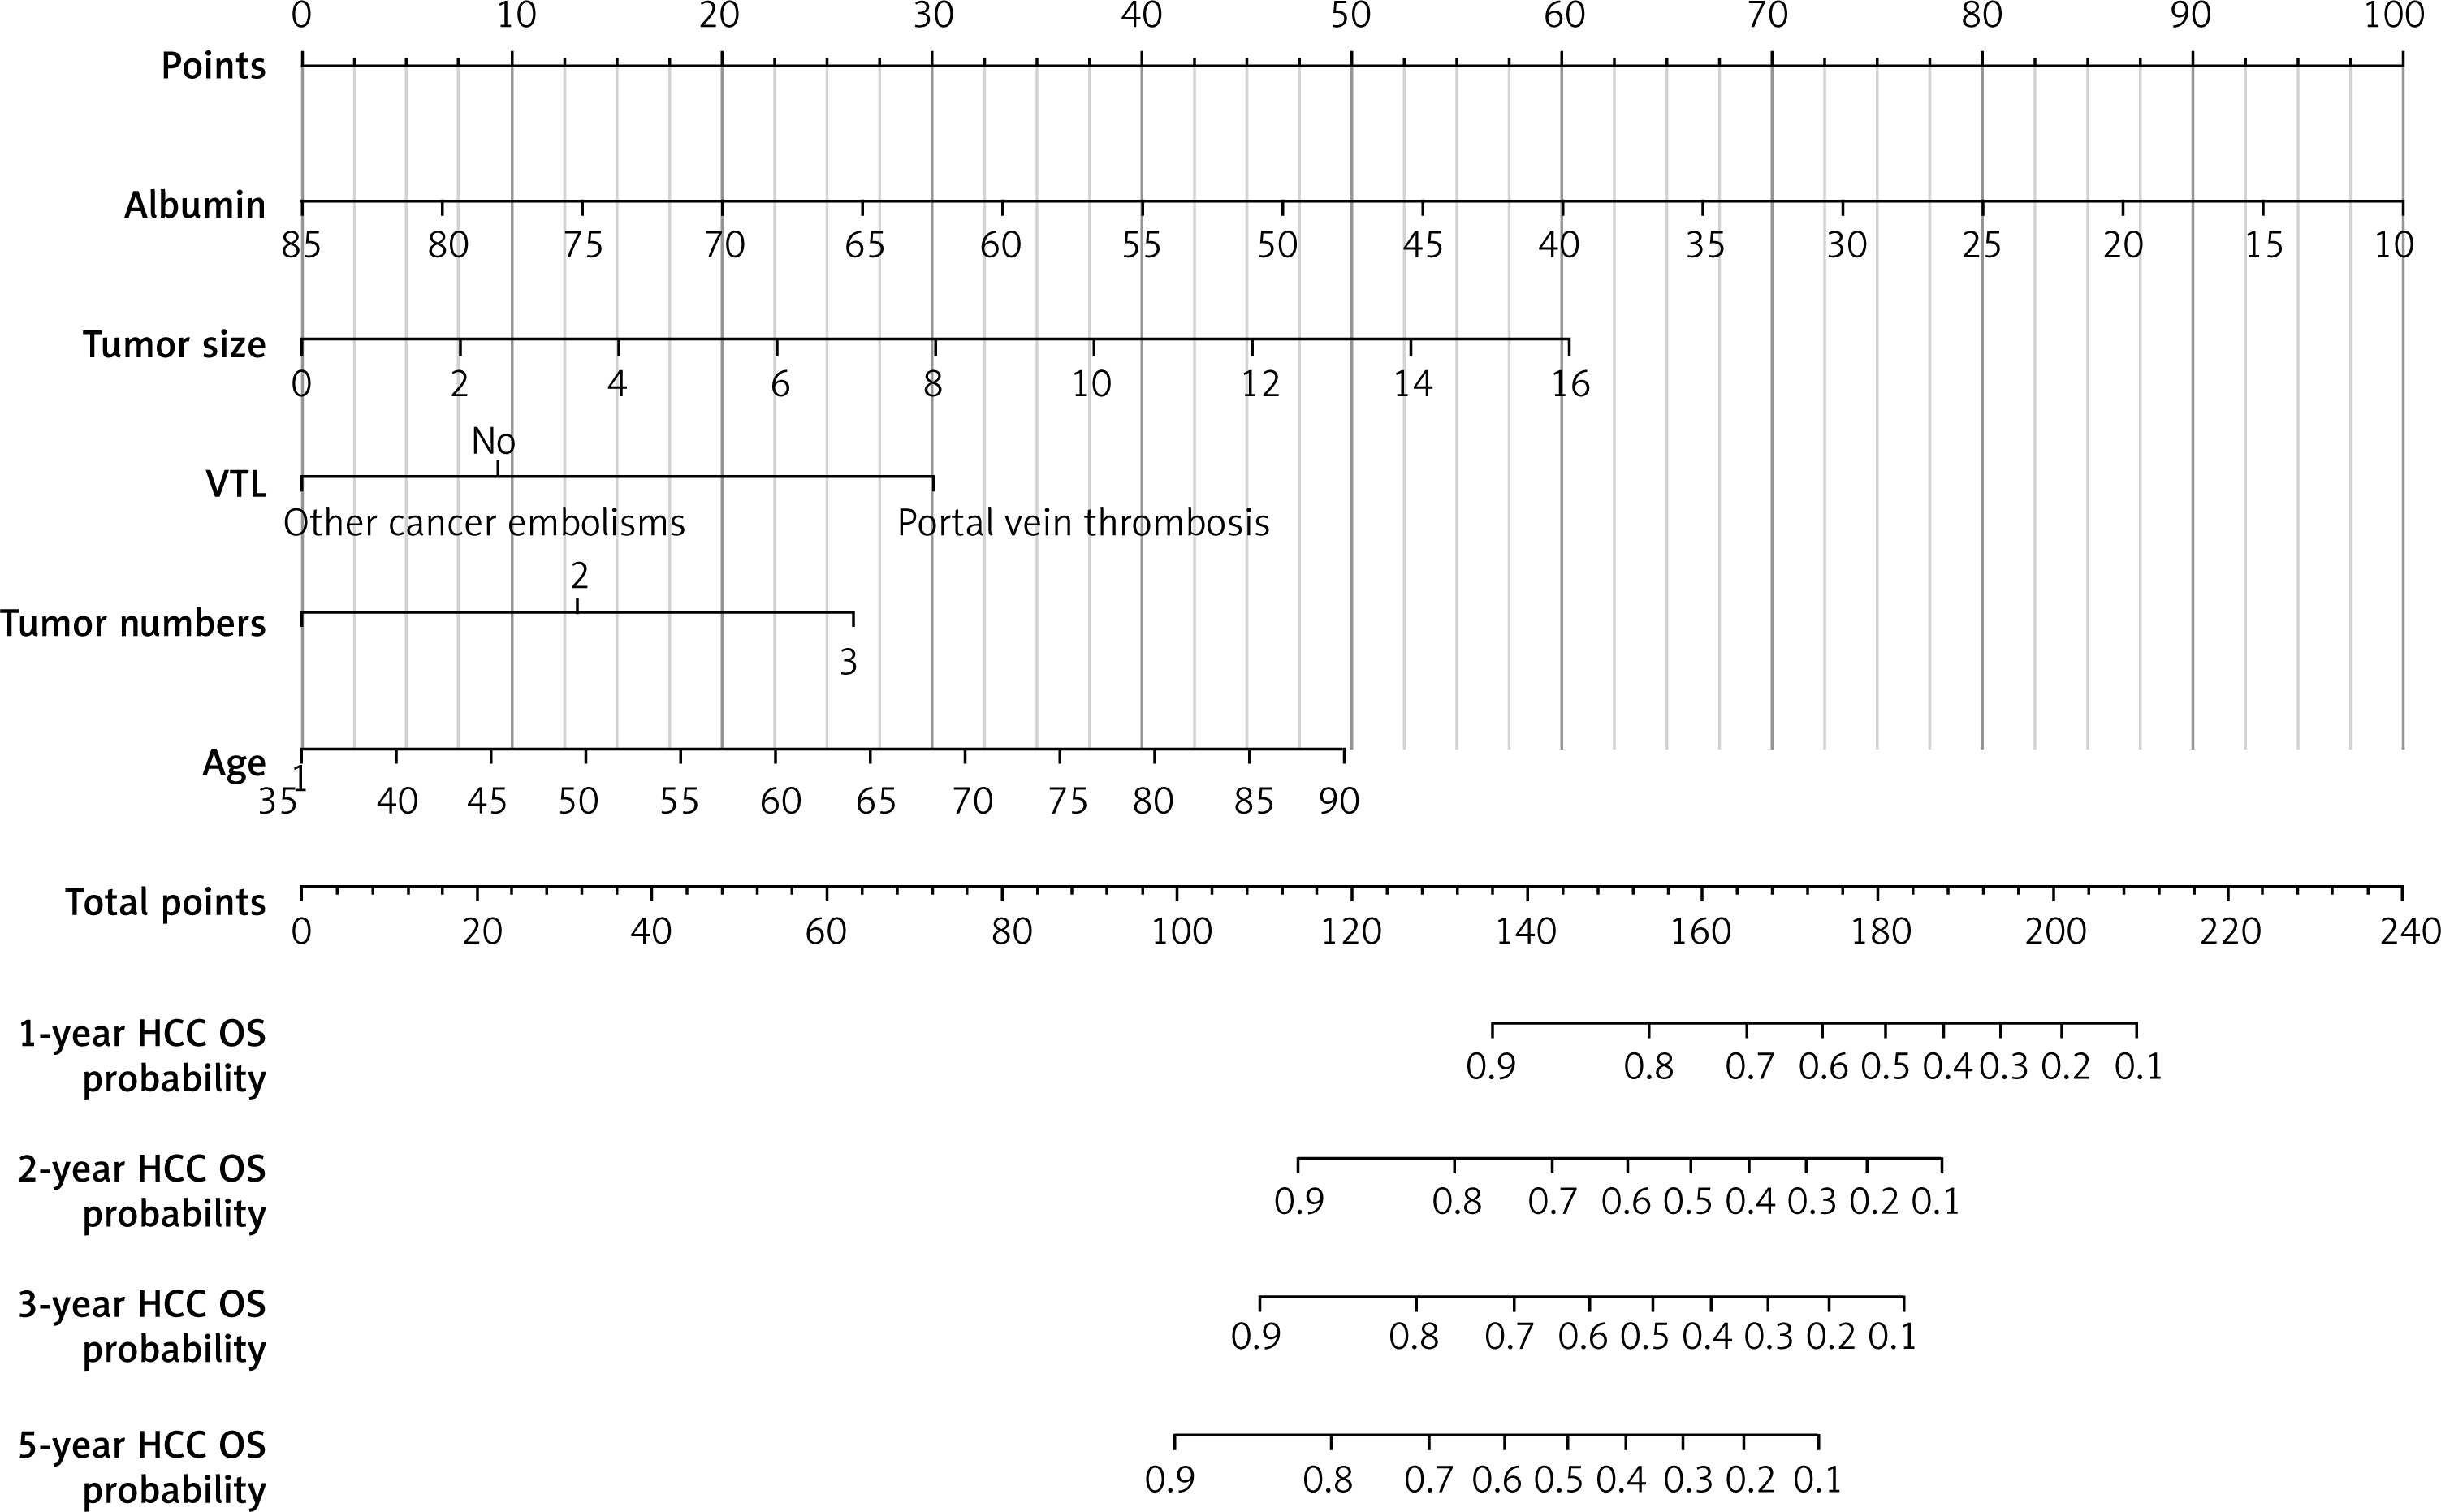
Table VII
Performance of the C-index nomogram model for OS and RFS
| Variable | C-index | 95% CI | P-value |
|---|---|---|---|
| Nomogram of OS | 0.815 | 0.769–0.862 | < 0.001 |
| Nomogram of RFS | 0.80 | 0.748–0.851 | < 0.001 |
Figure 6
The overall survival calibration curve for predicting patient survival at 1 year (A), 2 years (B), 3 years (C), and 5 years (D)
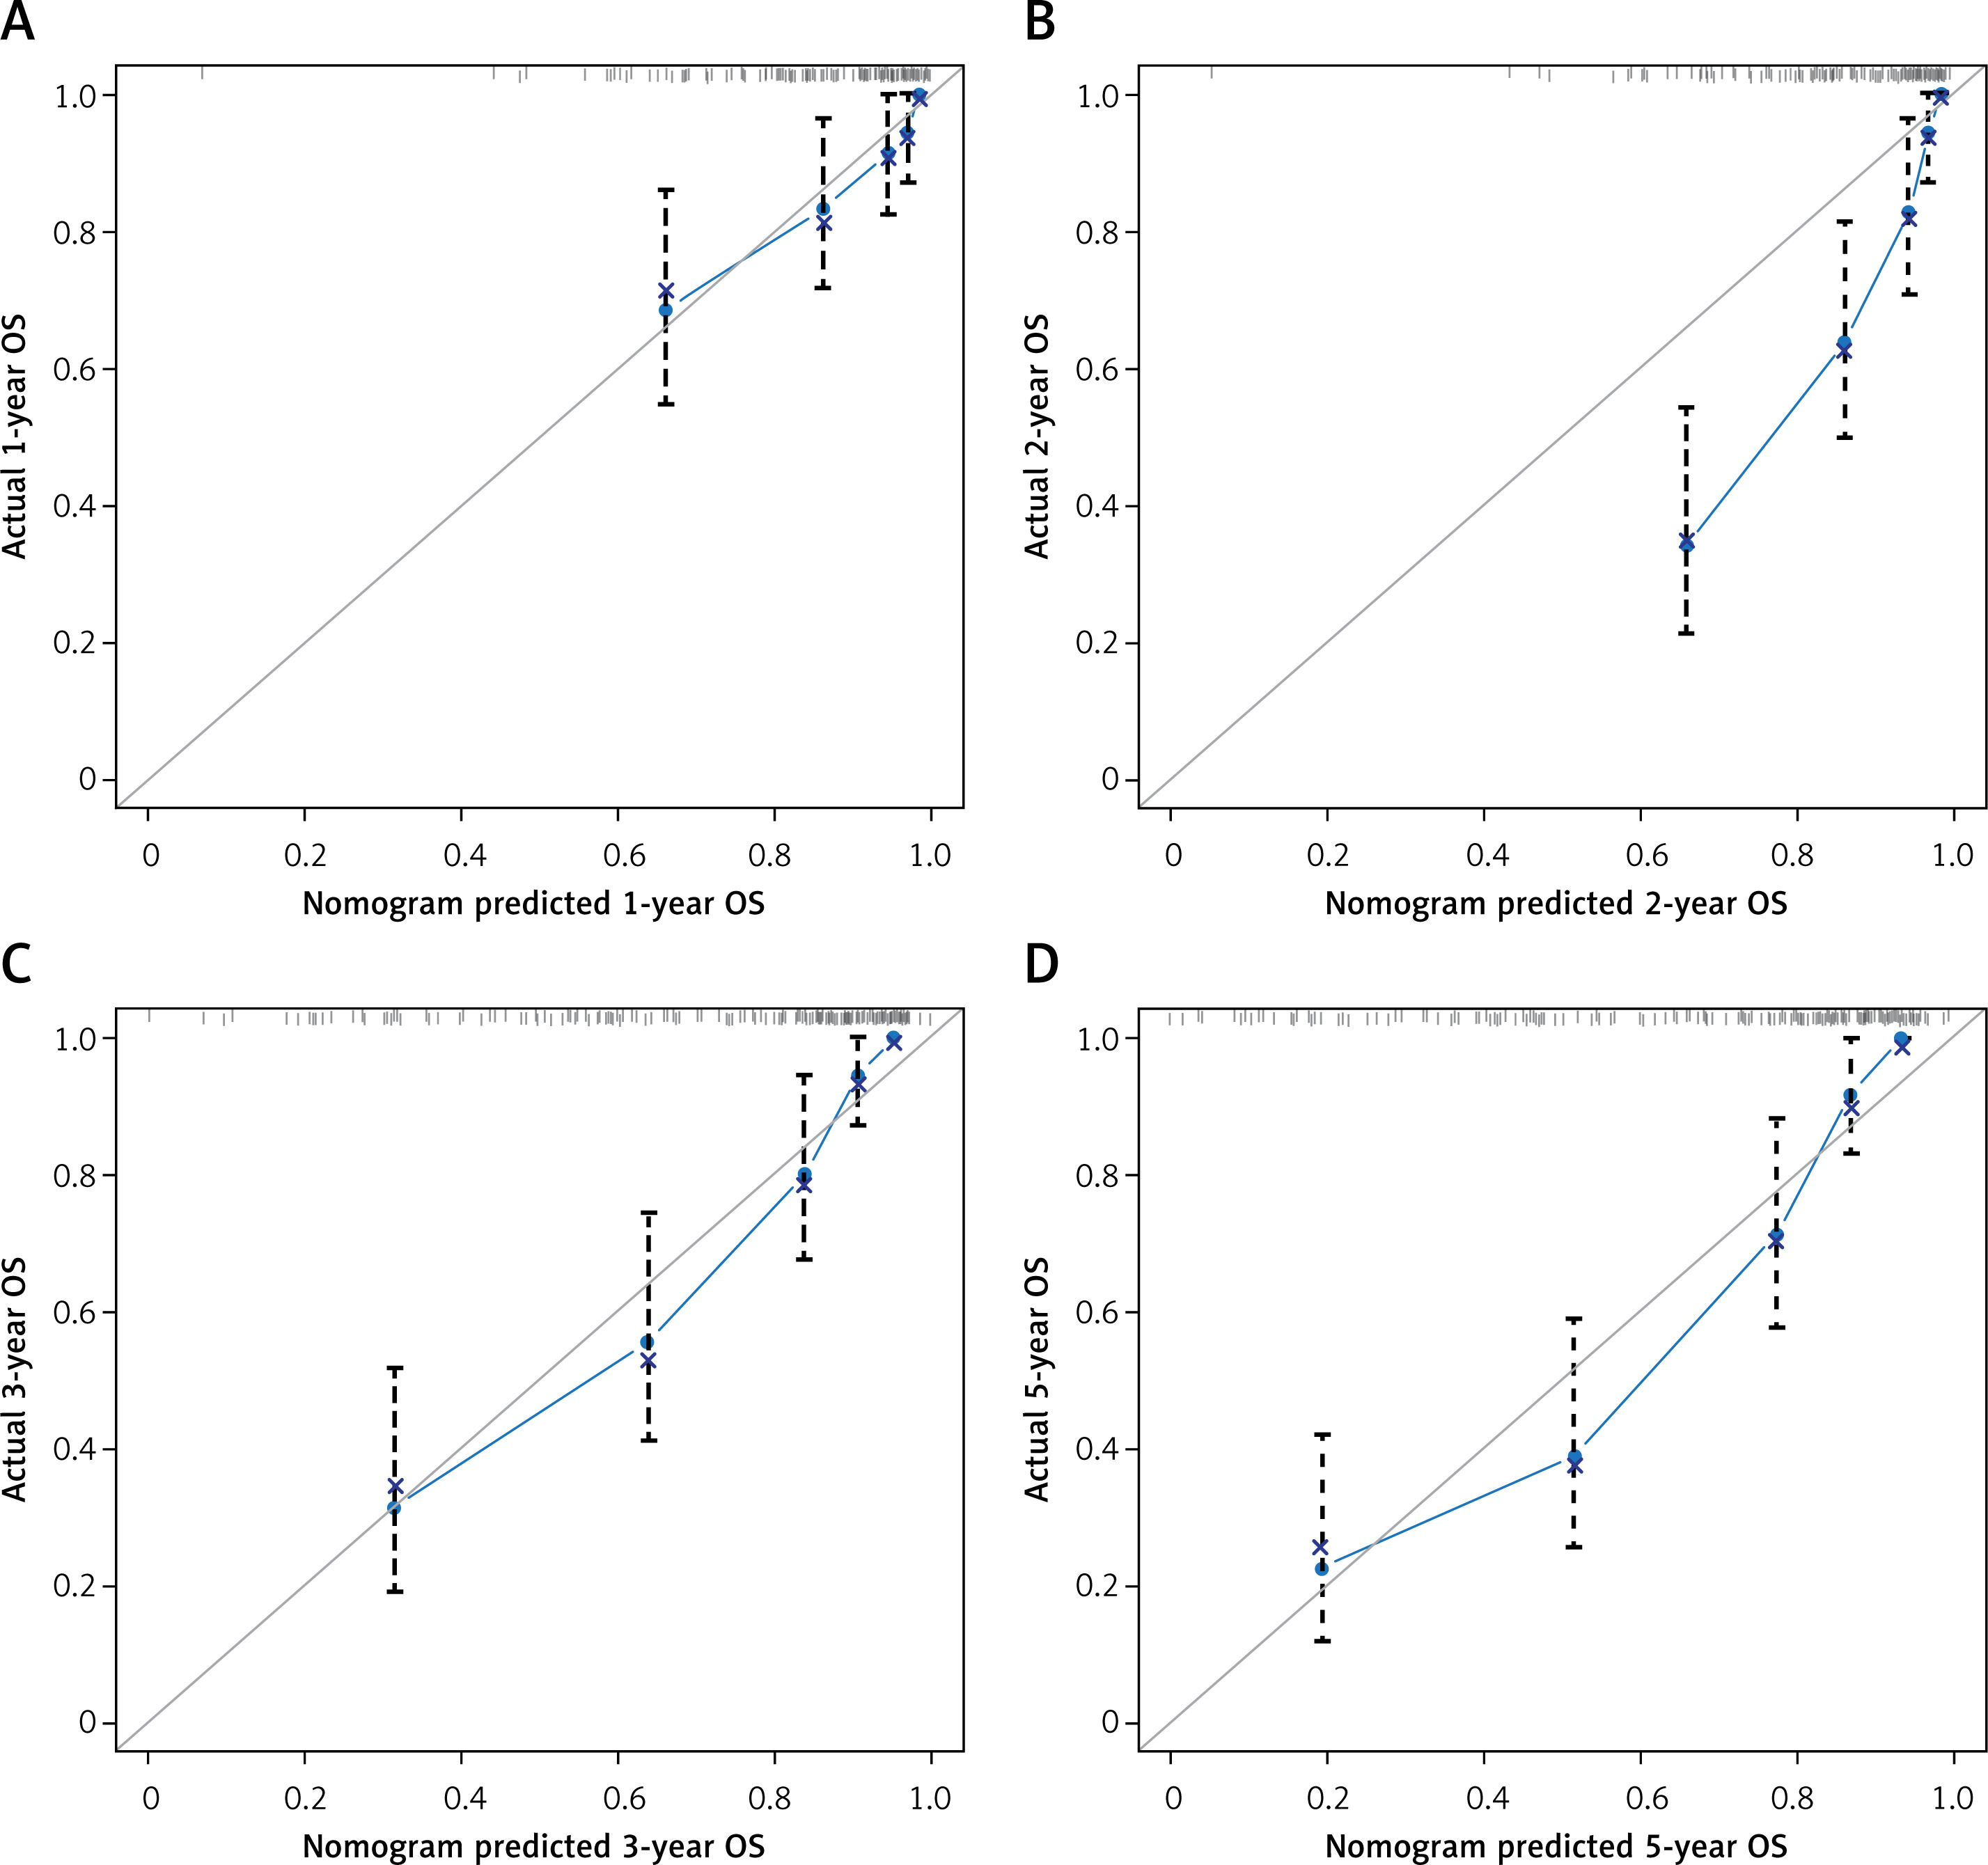
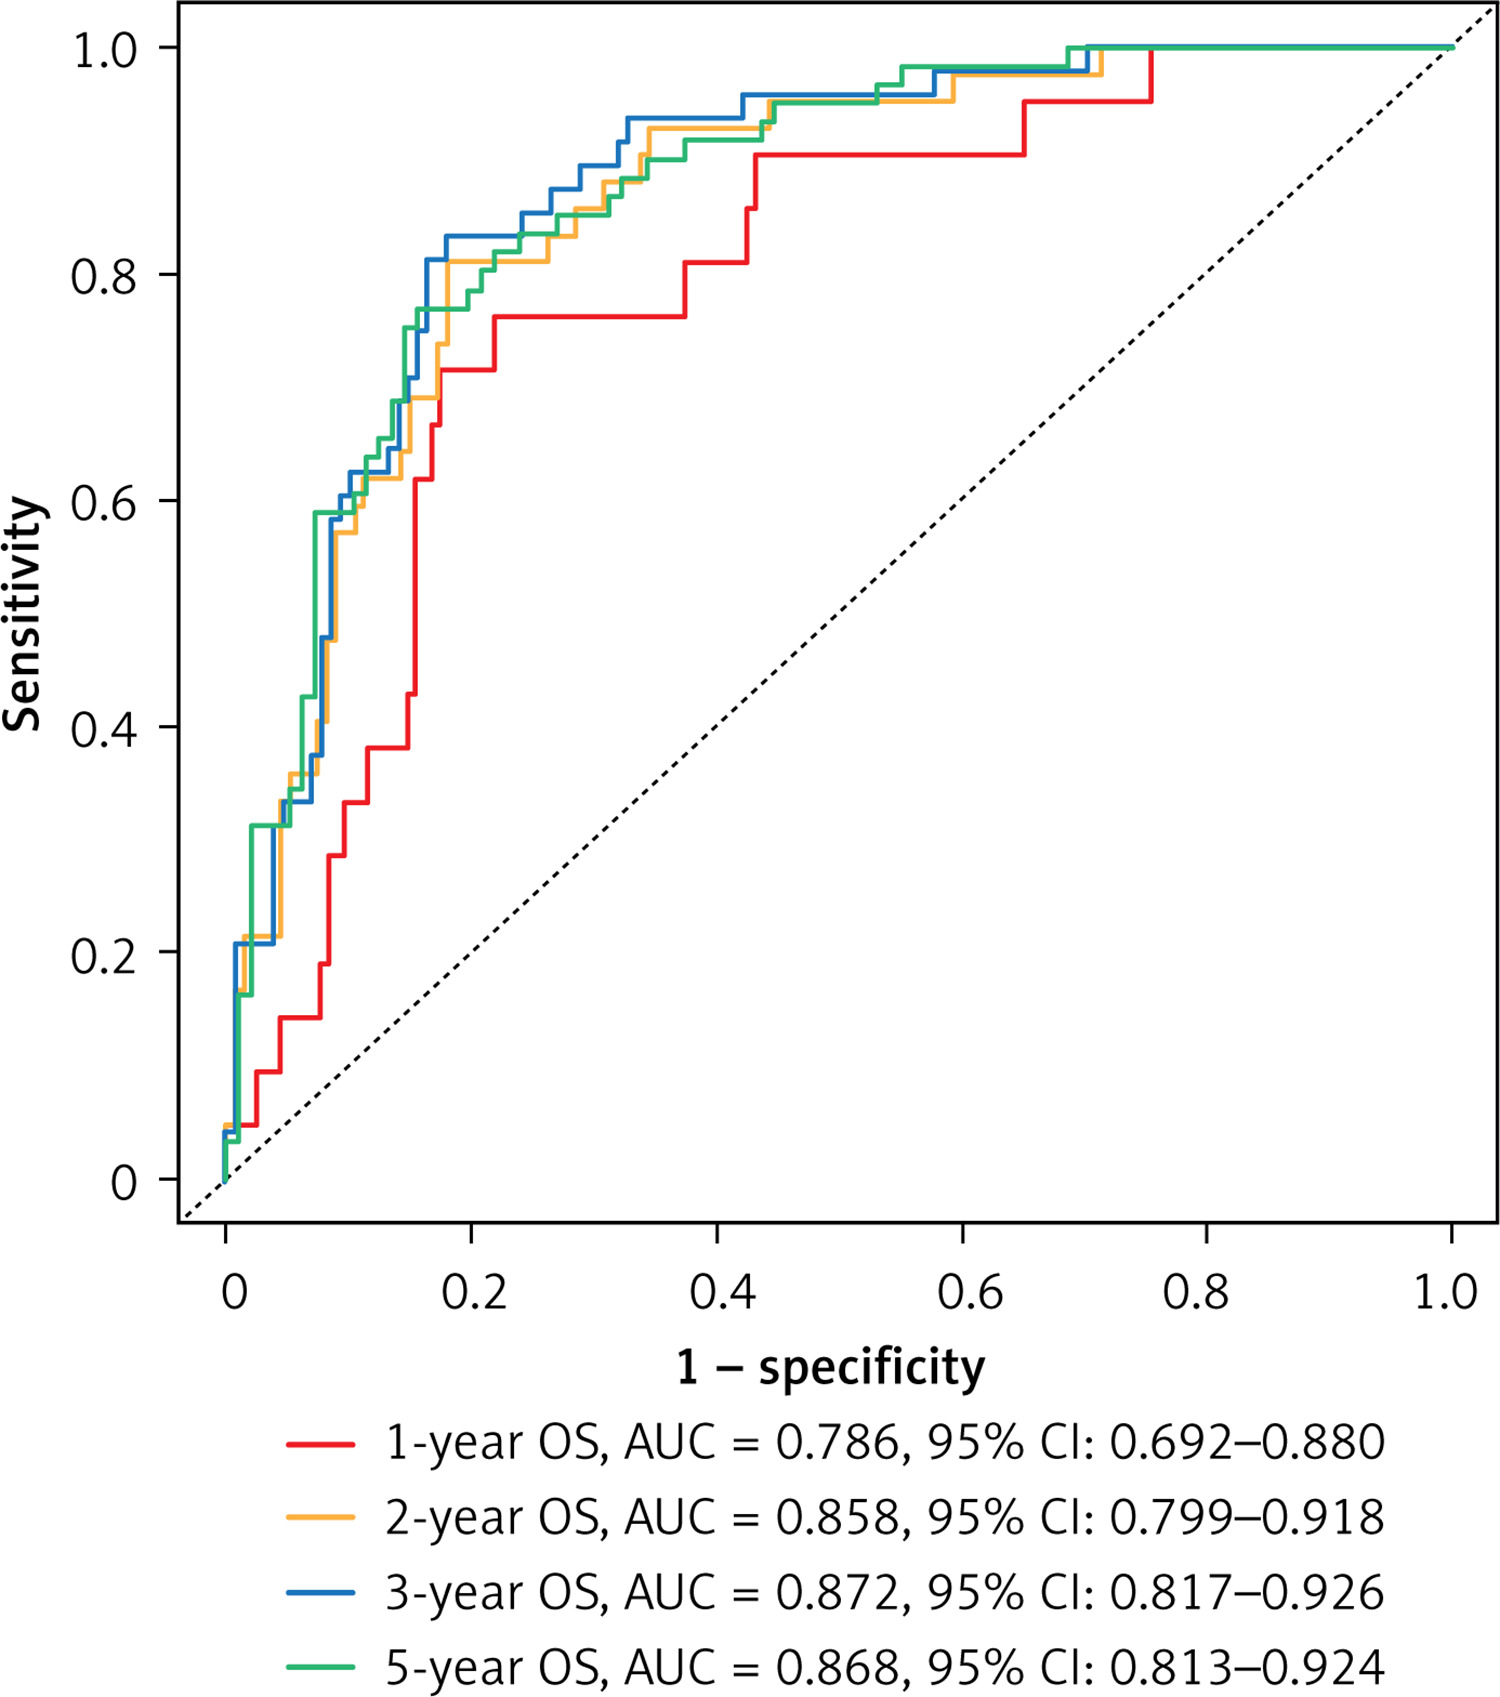
Figure 8
Decision curve analysis (DCA) of overall survival (OS): A – 1 year; B – 2 years; C – 3 years; D – 5 years
The prognostic nomogram for 1-, 2-, 3-, and 5-year RFS prediction in patients after resection is shown in Figure 9. Five variables were selected for the final predictive model: age, tumor stage, tumor size, tumor number, and VTL (portal vein thrombosis and other cancer embolisms). The C-index of the nomogram for RFS prediction was 0.80 (95% CI: 0.748‒0.851 (p < 0.001)) (Table VII). The calibration curves predicted the observed RFS probabilities for 1-, 2-, 3-, and 5-year RFS (Figure 10). These outcomes suggest that the nomogram has the potential to stratify HCC patients.
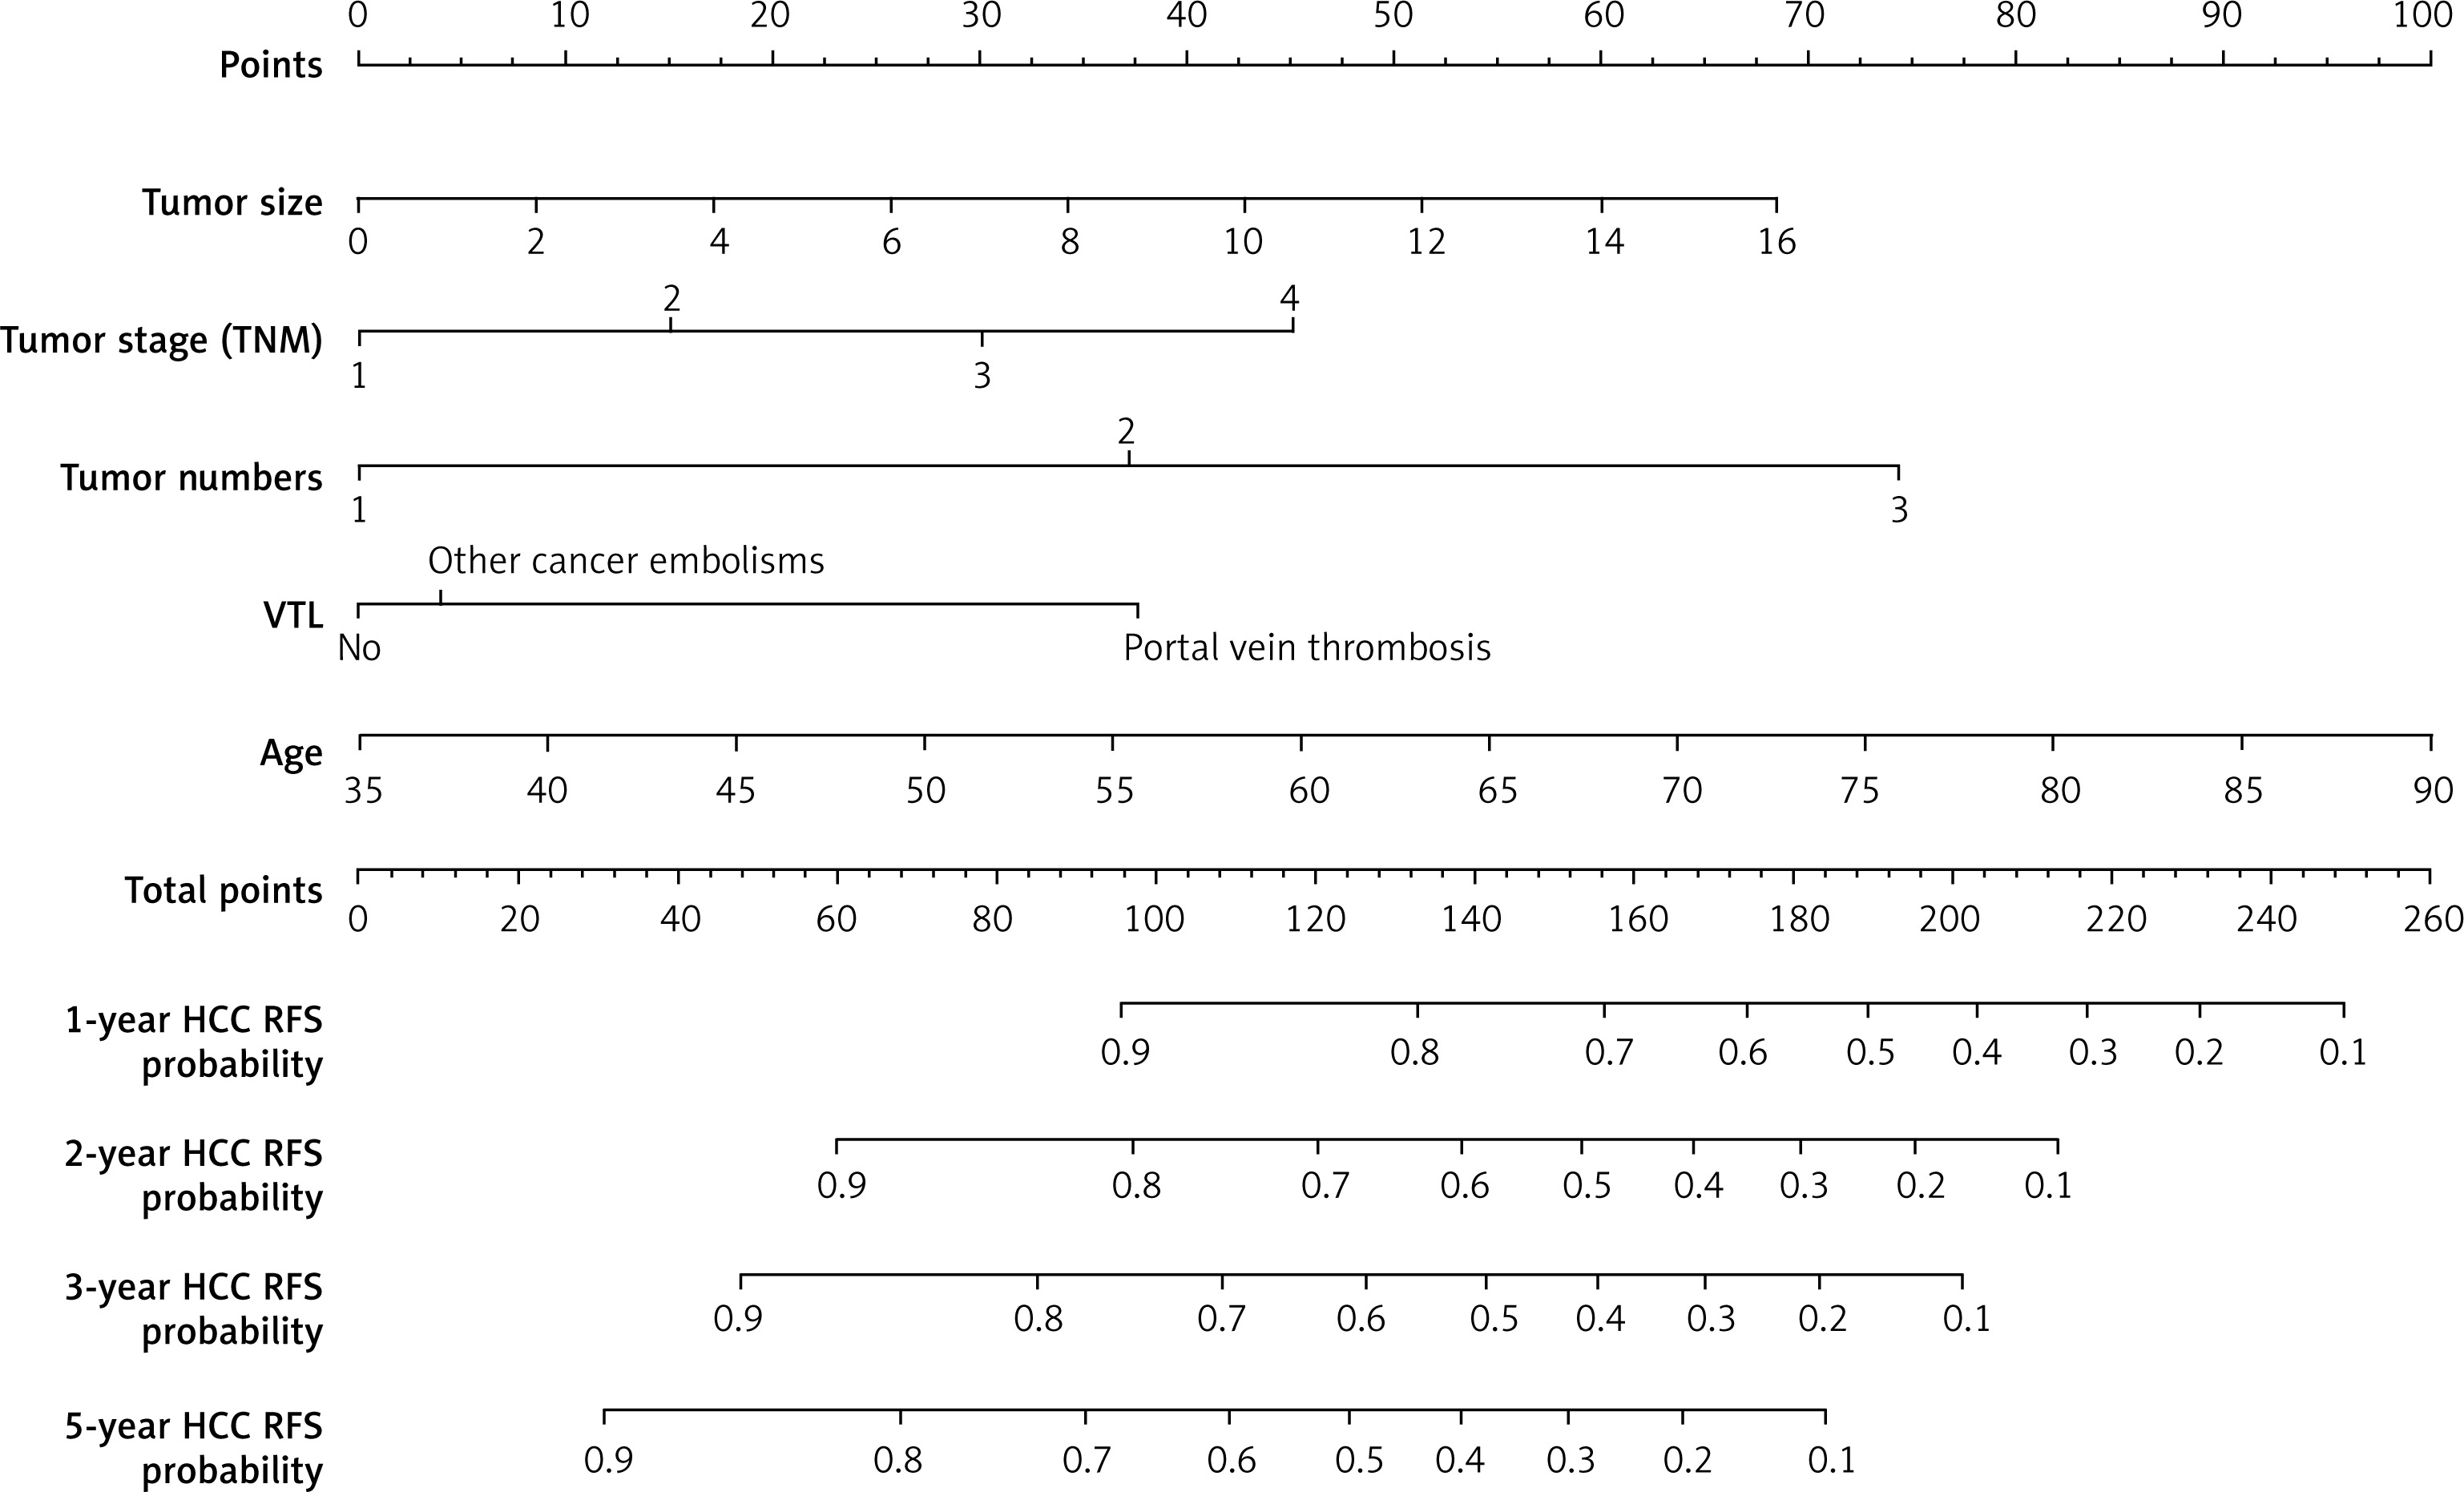
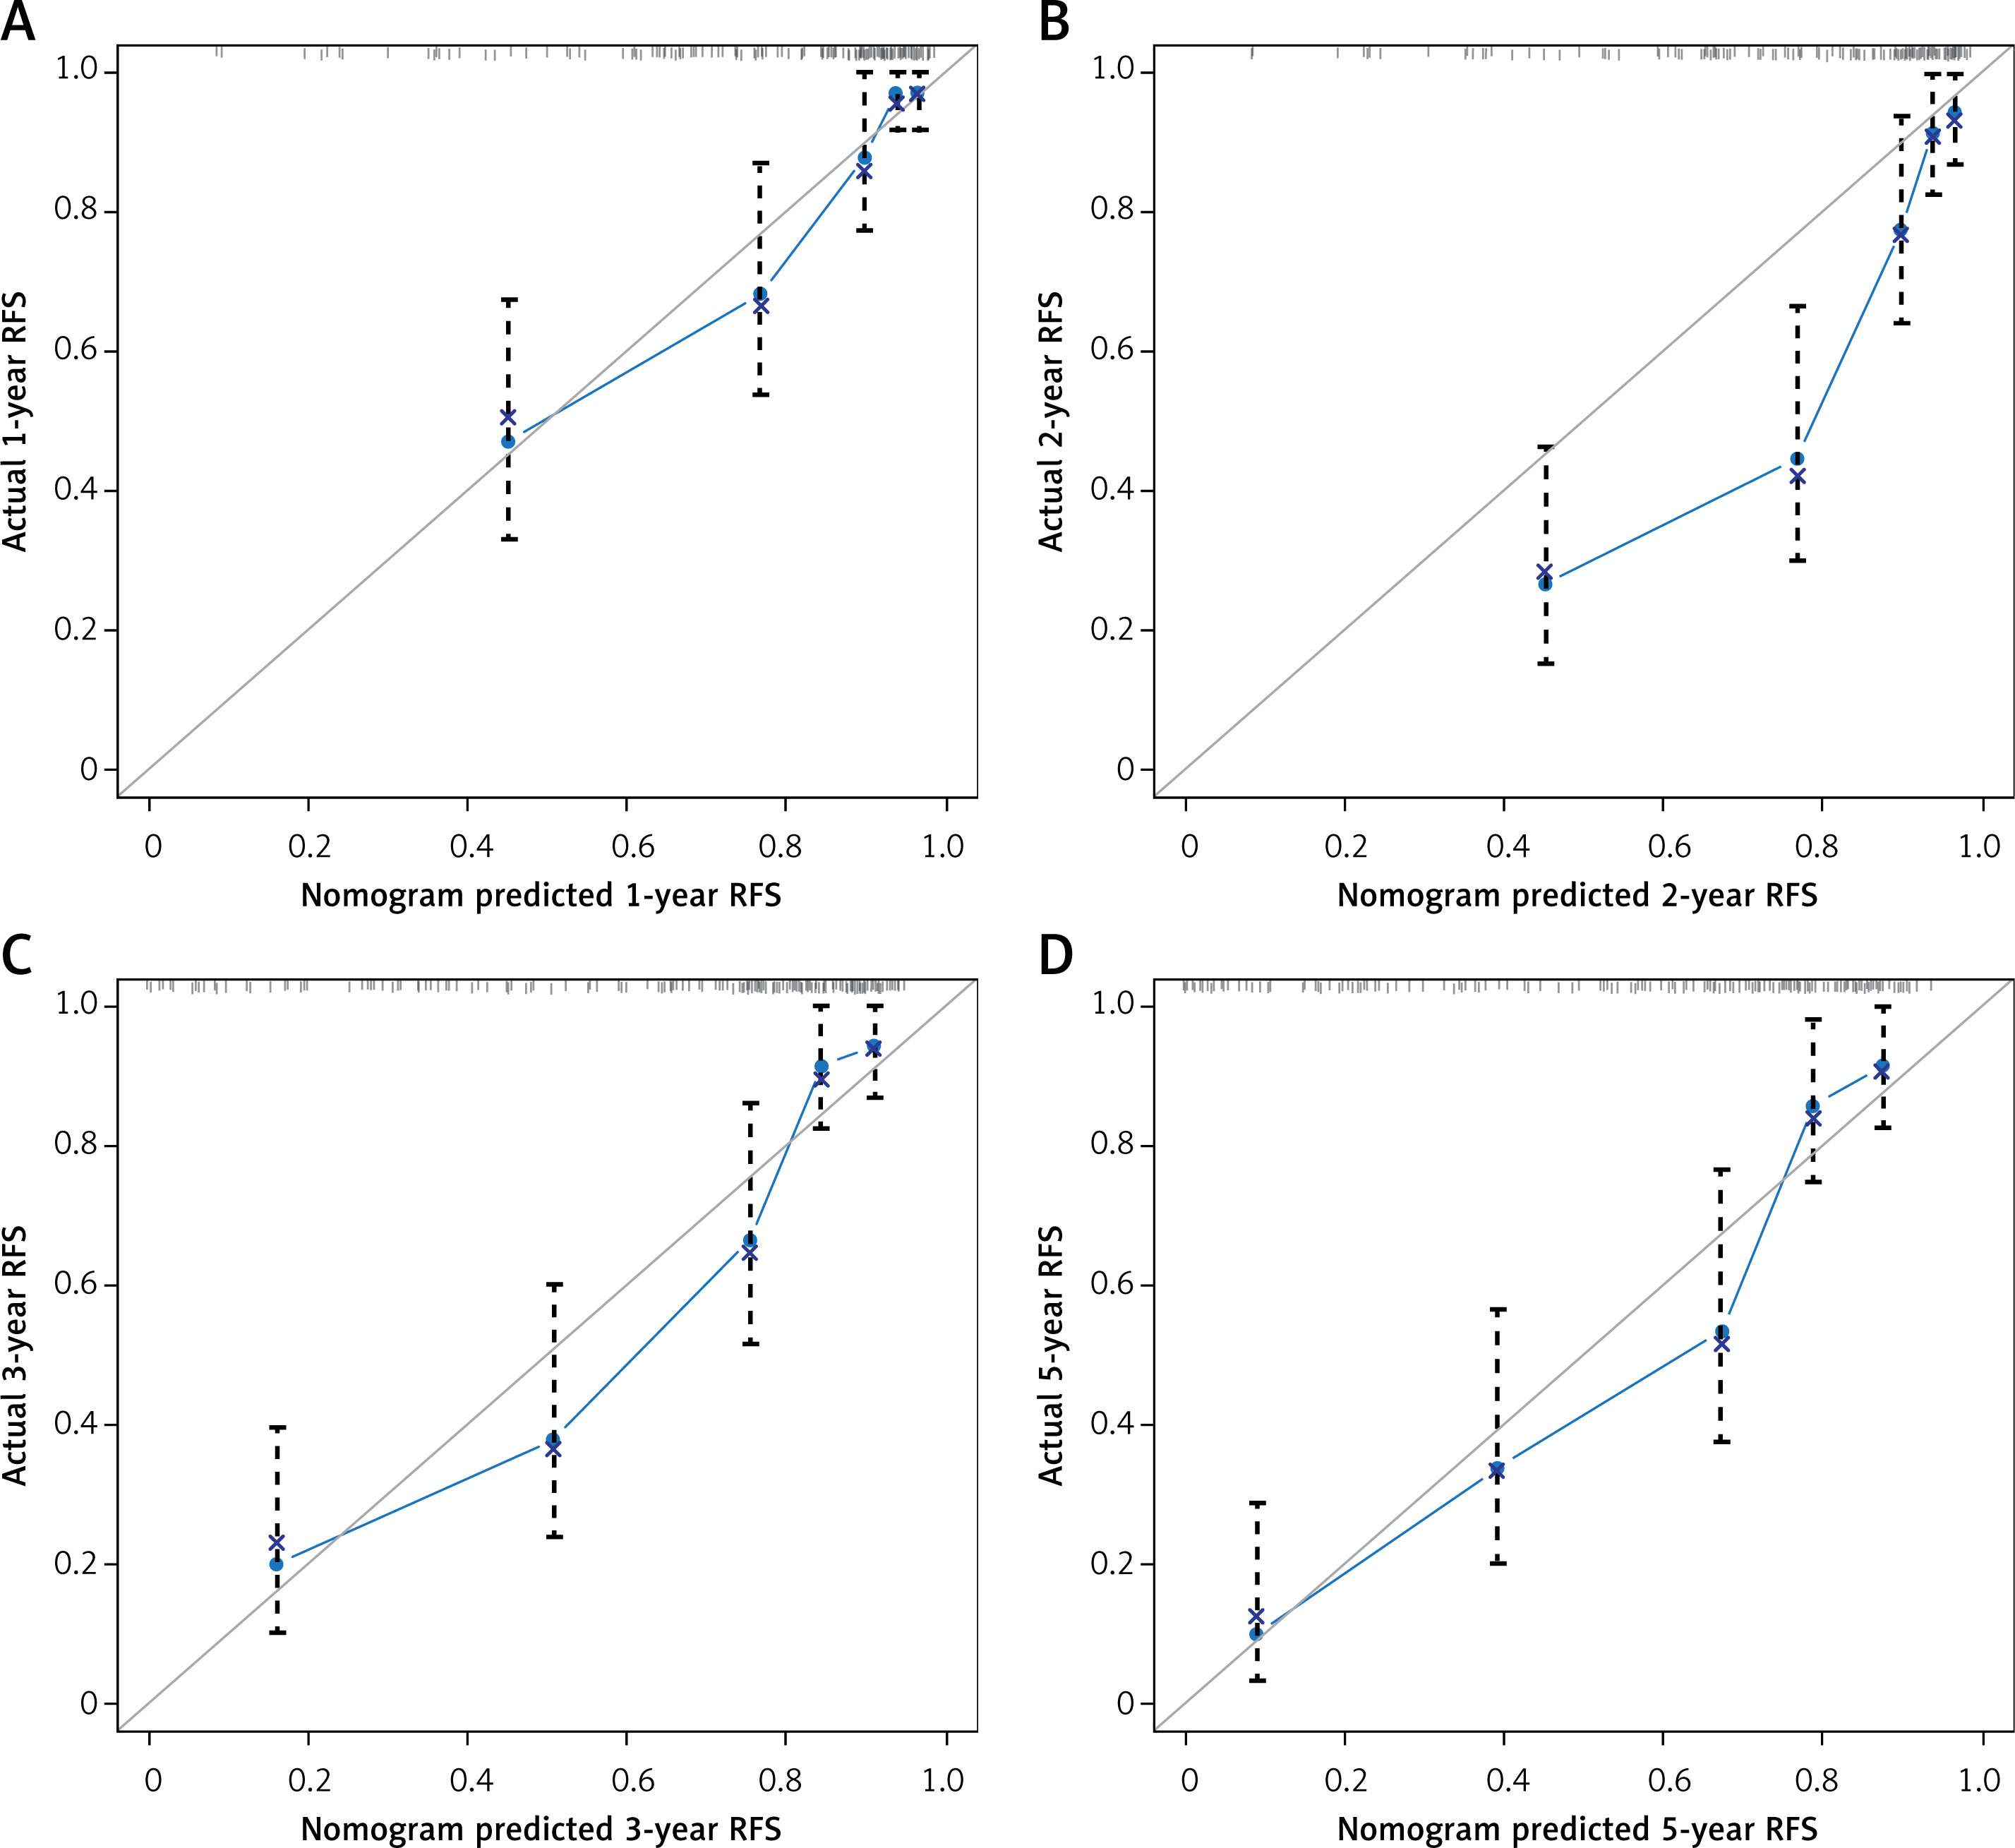
Figure 10
Recurrence-free survival calibration curve for predicting patient survival at 1 year (A), 2 years (B), 3 years (C), and 5 years (D)
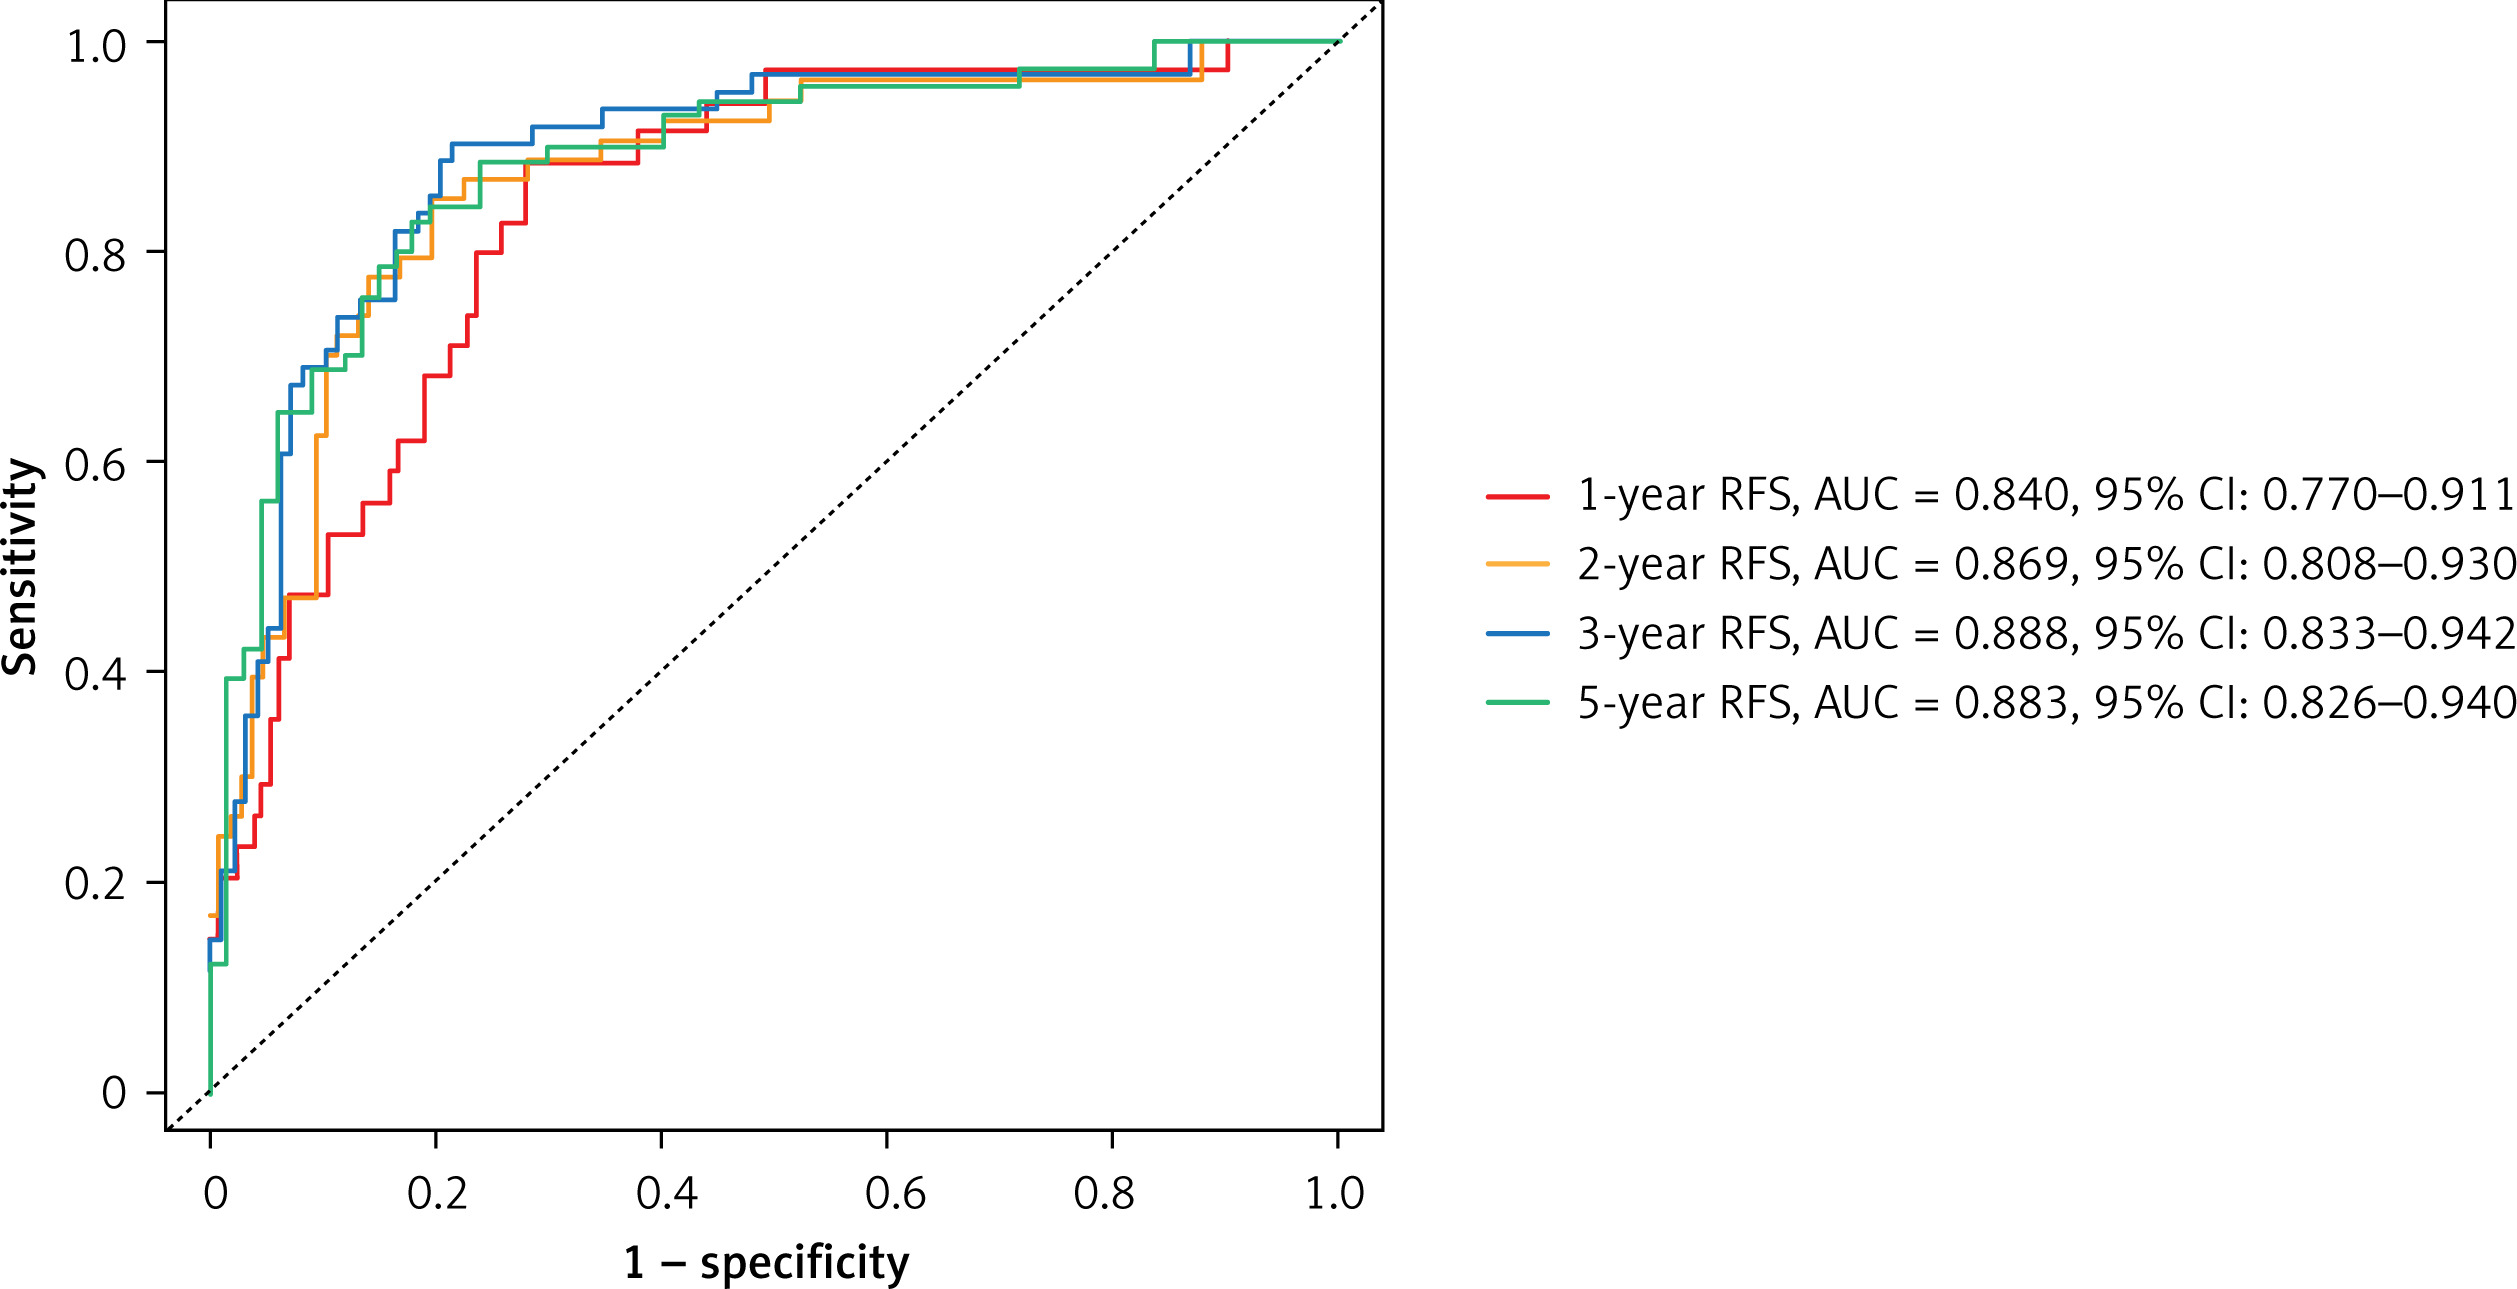
The RFS ROC curves for 1-, 2-, 3-, and 5-year survival in the present study and the AUC values for 1-, 2-, 3-, and 5-year survival were 0.840-, 0.869-, 0.888-, and 0.883, respectively (Figure 11). Furthermore, DCA was performed, and the nomogram results revealed better net benefits with a wider range of thresholds (Figures 12 A–D).
Independent prognostic factors for HCC
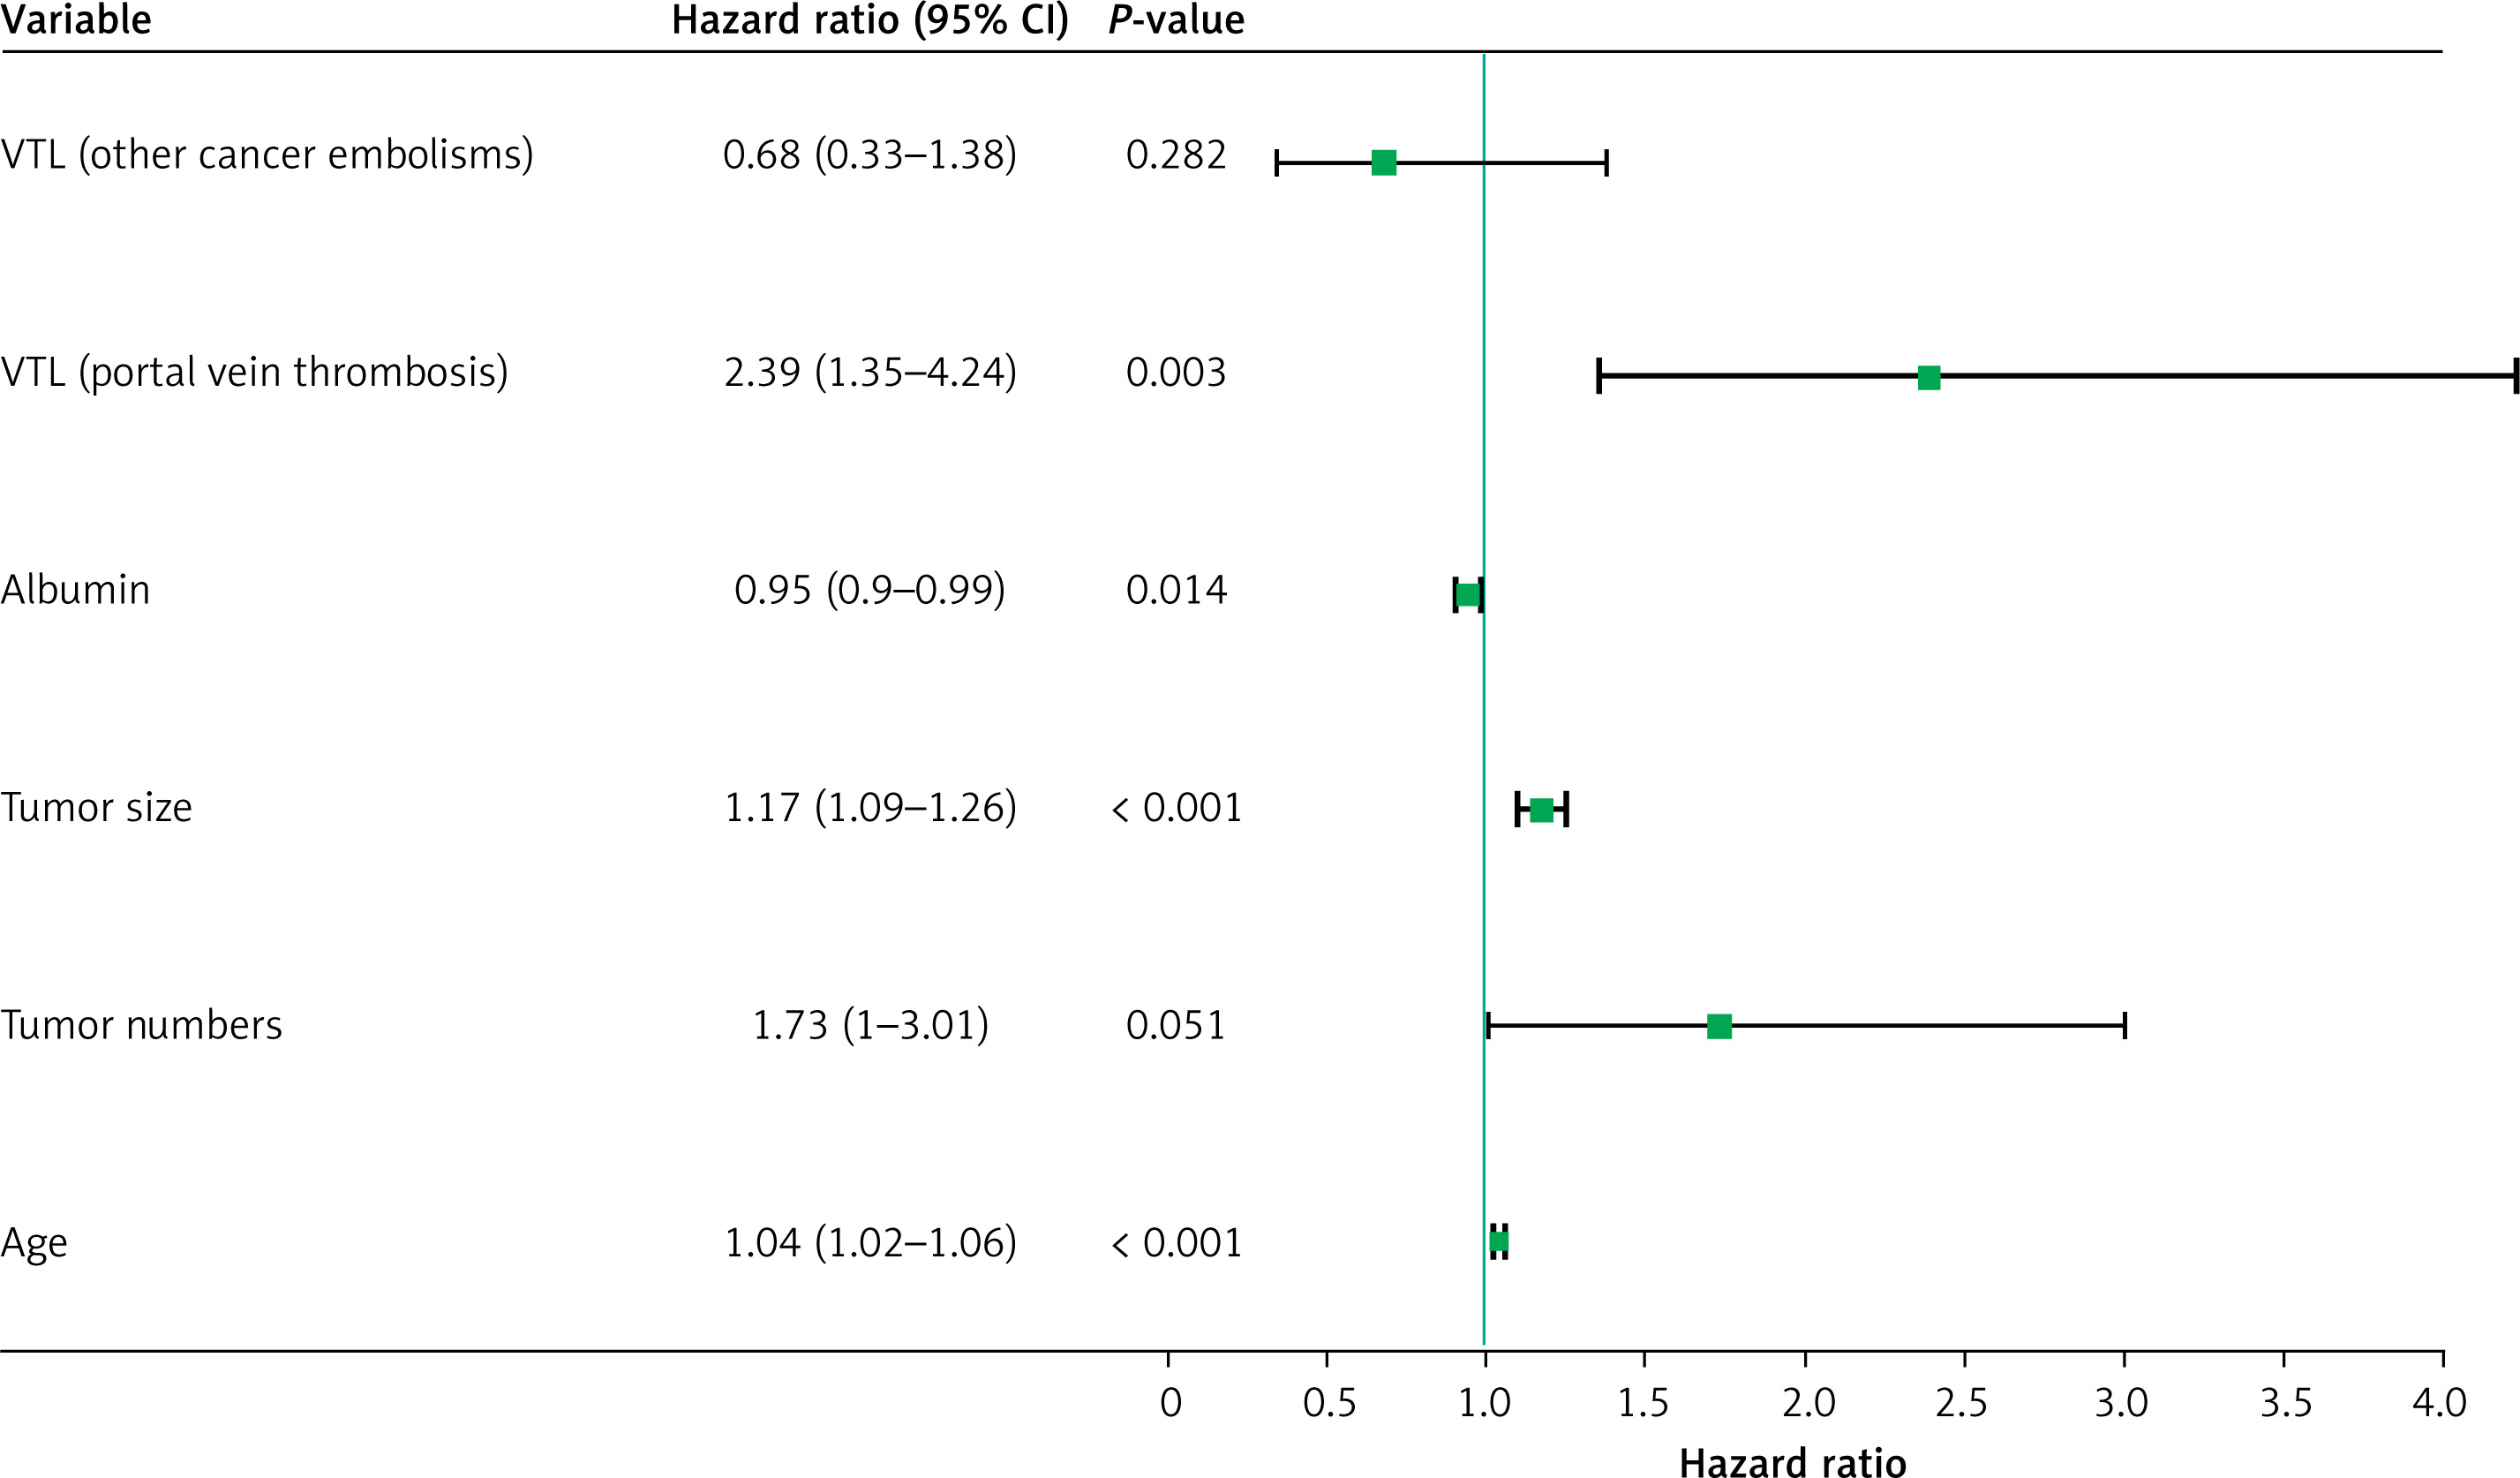
We performed multivariate Cox proportional regression OS analysis for 24 potential factors and identified six independent factors (Figure 13). The variables included age, albumin level, tumor size, tumor number, and portal vein thrombosis. Most variables were highly significant (p = 0.05).
Figure 13
Forest plots of the multivariate Cox regression model results for the selection of prognostic variables for overall survival (OS)
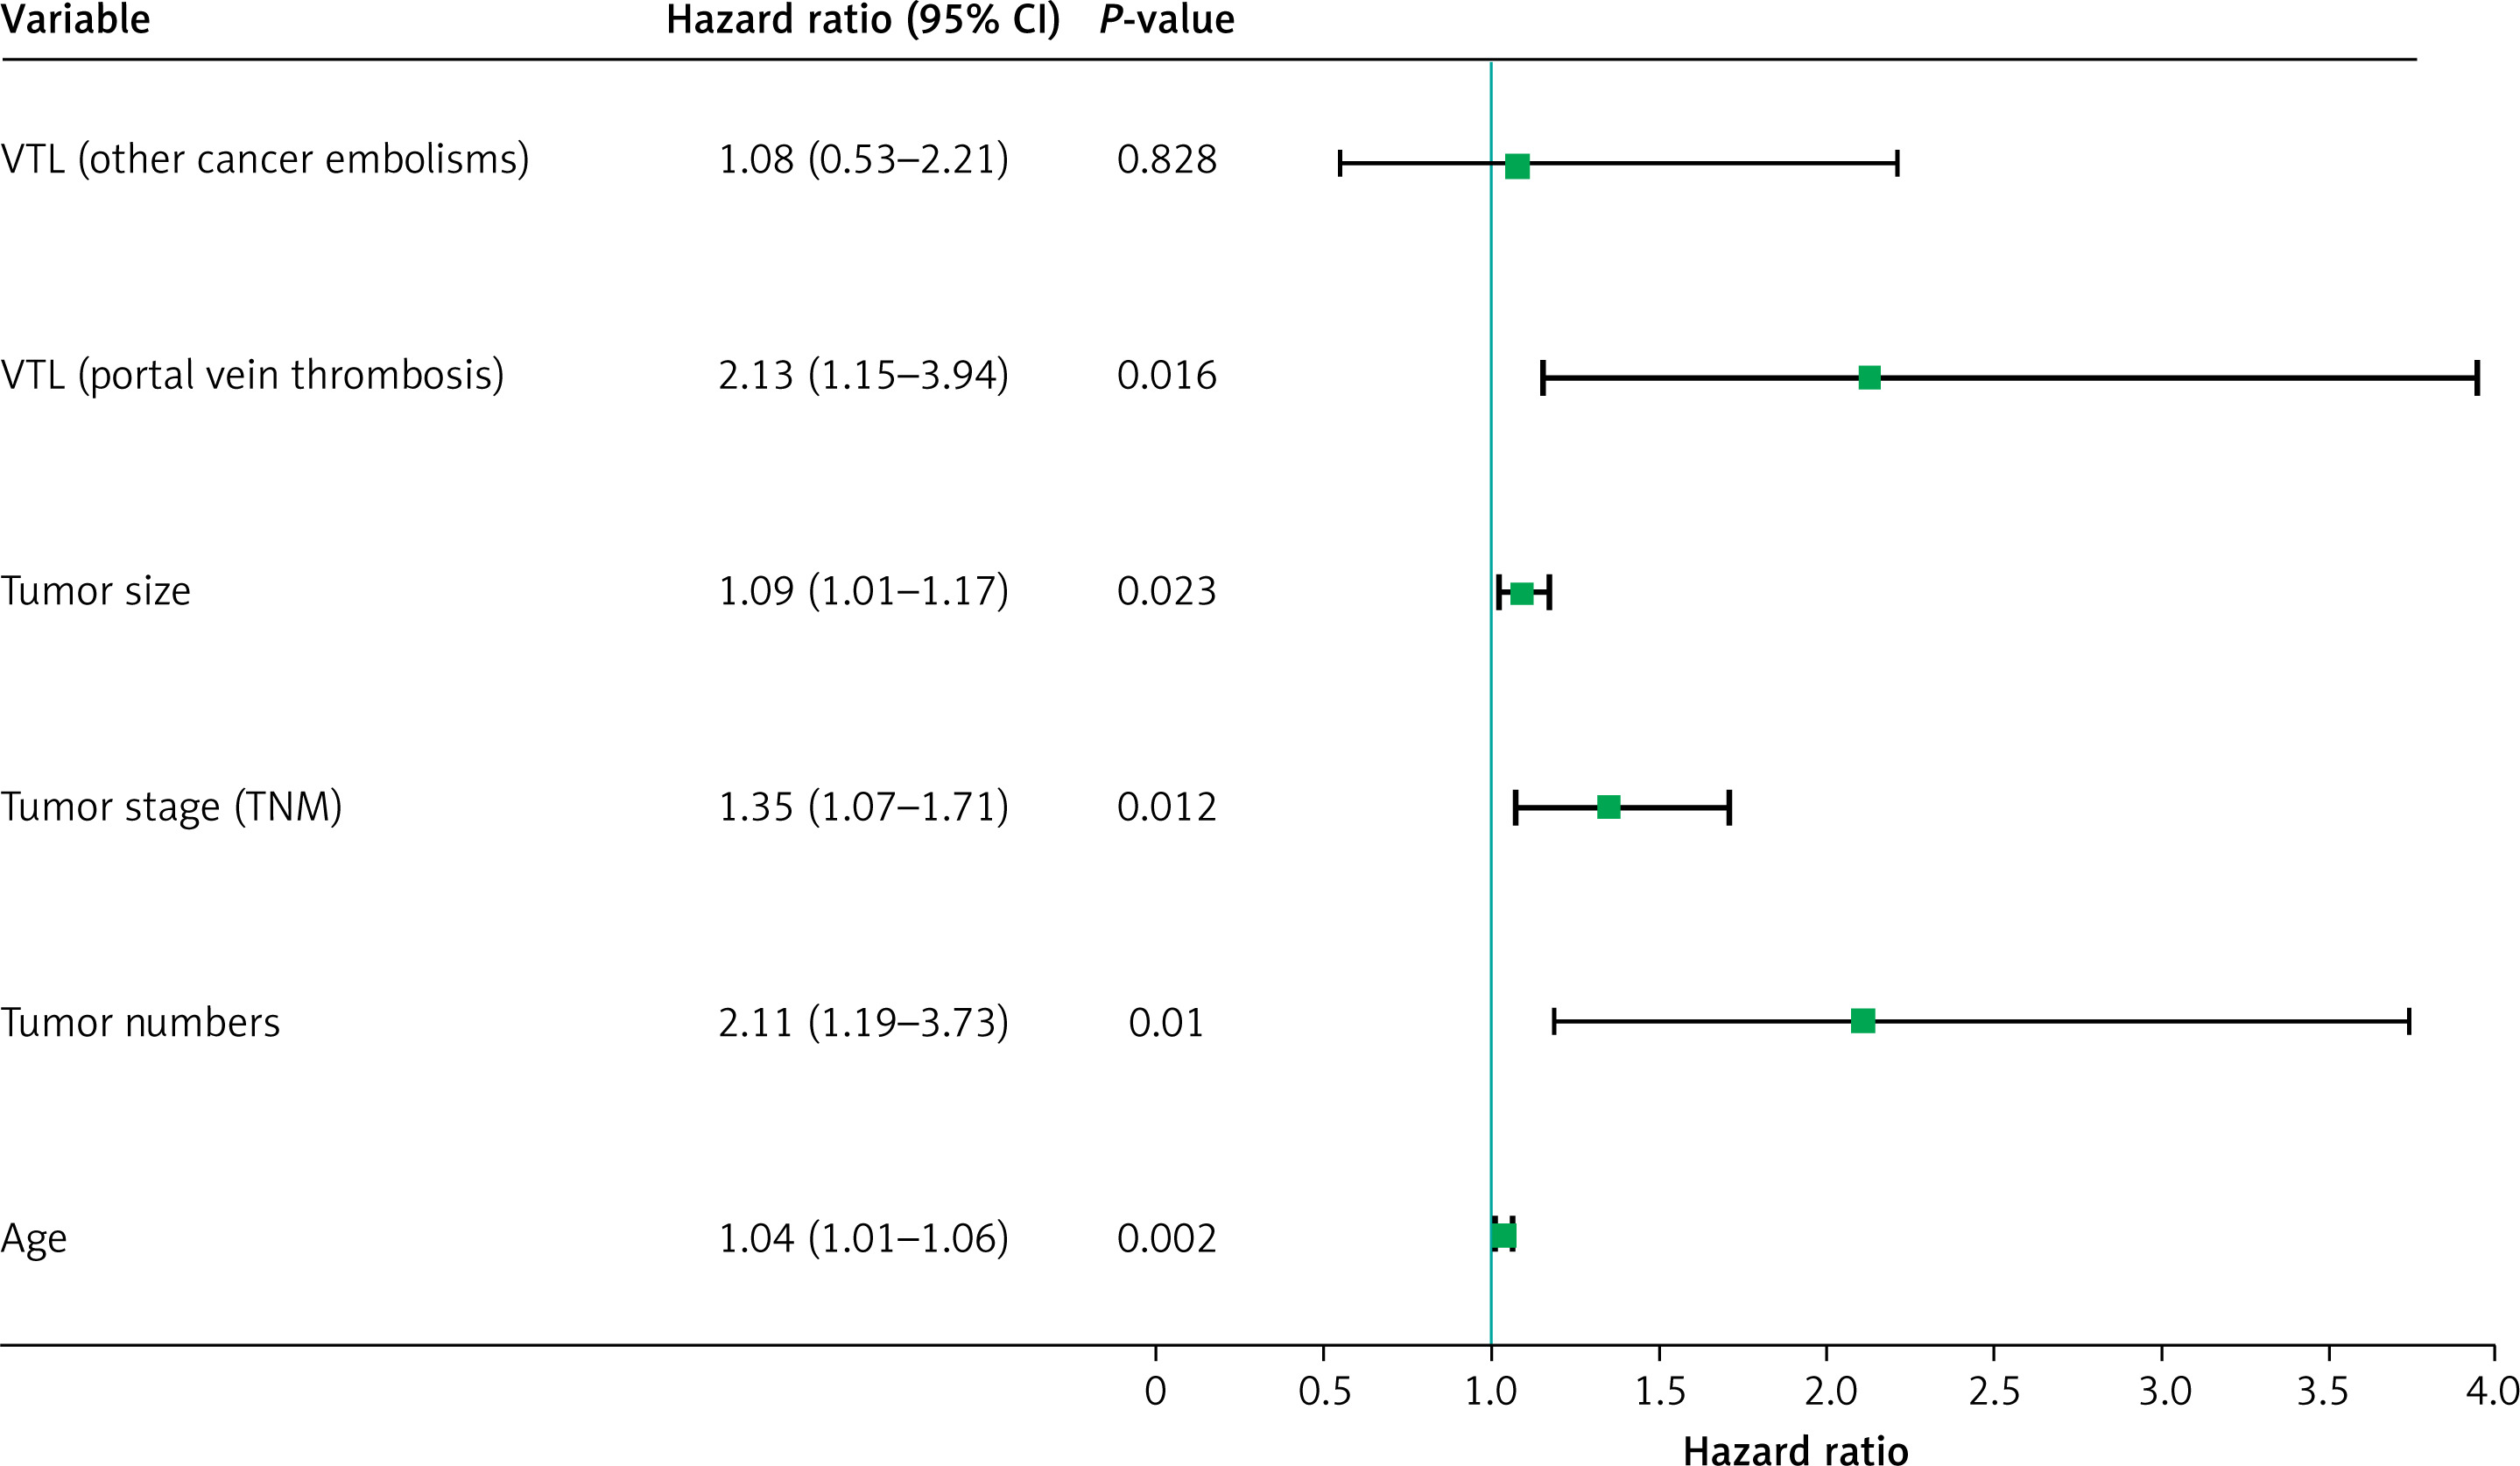
The multivariate Cox proportional regression RFS analysis clearly identified six potential factors in a forest plot (Figure 14). The variables included age, tumor stage, tumor size, tumor number, and portal vein thrombosis. Most of the factors were significant (p = 0.05).
Risk stratification for HCC with survival outcomes
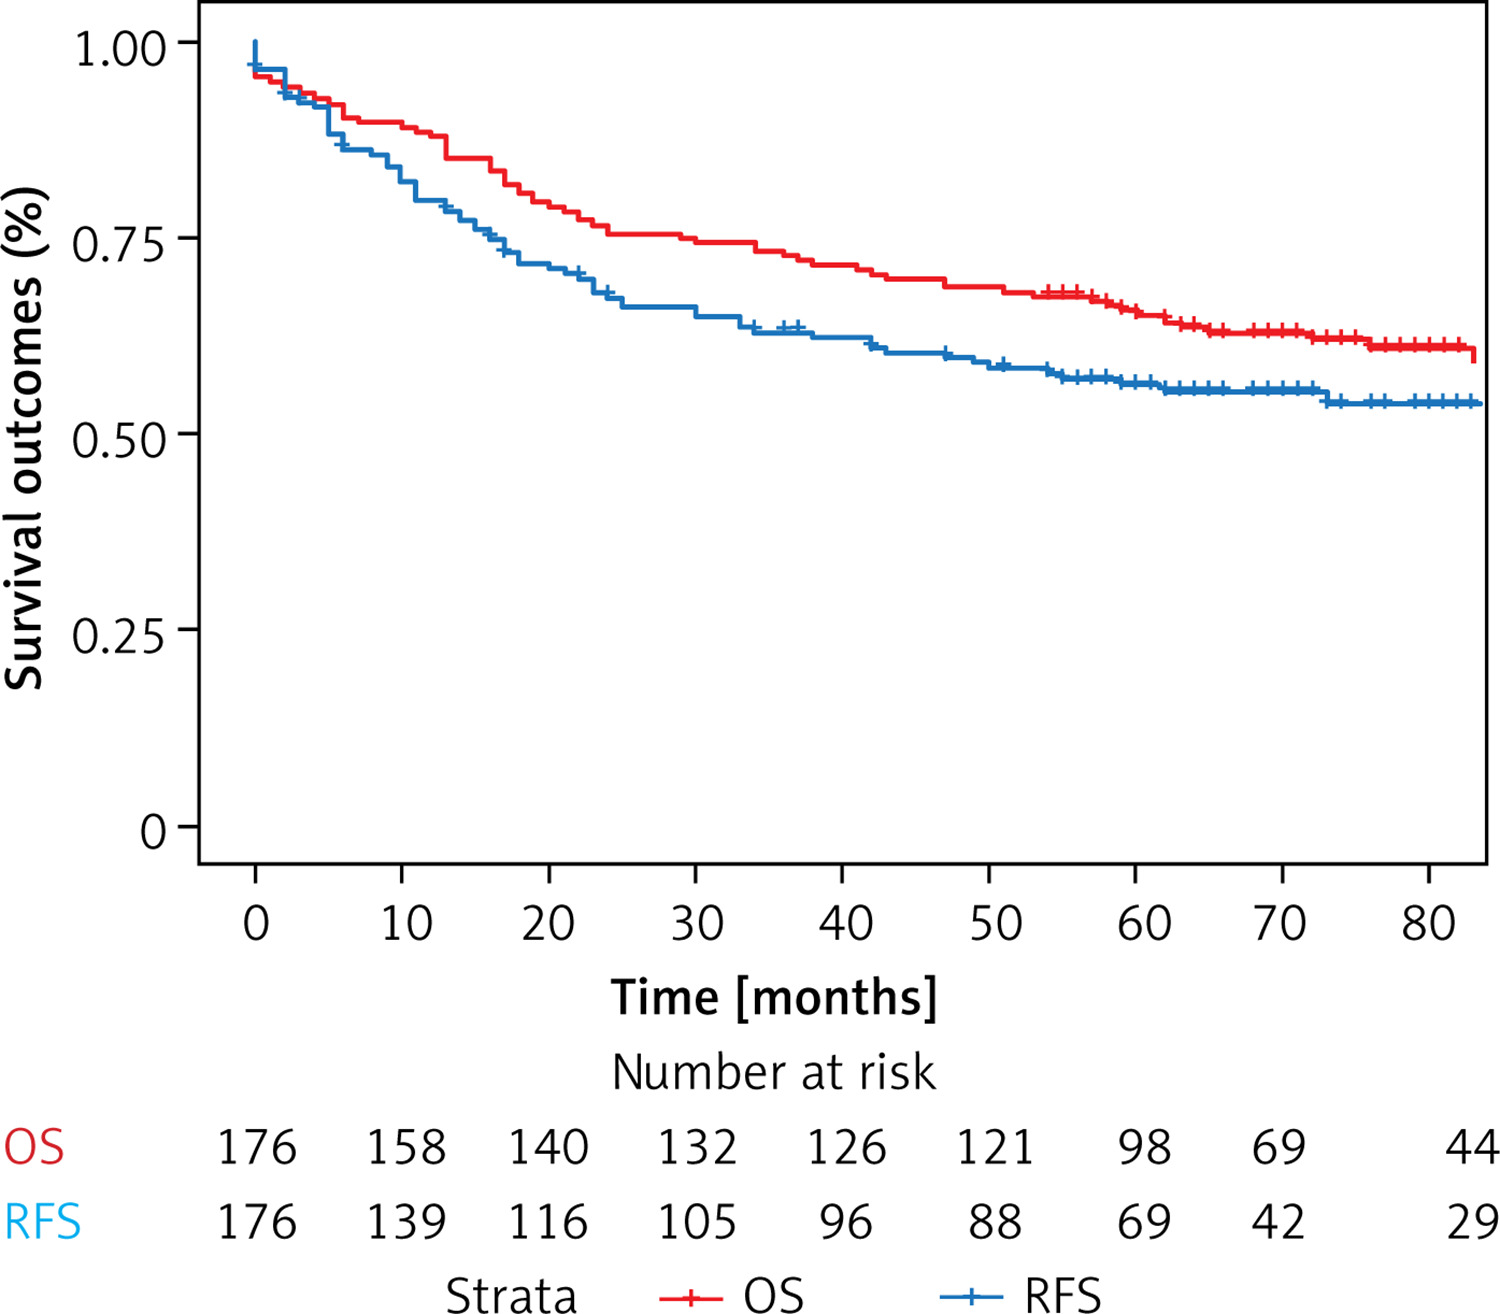
At-risk classification systems for OS and RFS were developed according to the total scores of each patient produced by the nomograms, and the patients were divided into two groups. The results of the KM survival analysis with a log-rank test revealed differences in OS and RFS between the groups of patients with HCC (Figure 15). The OS group had a better prognosis than the RFS group did (p < 0.001).
Discussion
Over the past few decades, liver resection has been the preferred method for treating HCC. Recently, it has been recognized as the gold standard treatment in the early and intermediate stages of HCC [20, 21]. Tumor recurrence is one of the most significant poor prognostic factors for patients with HCC [22].
In our investigation, we identified 176 patients as candidates who underwent liver resection for HCC. We investigated pre- and postoperative predictive factors related to survival in patients with < 3 years of survival compared with those with > 3 years of survival.
The results of the model analysis predicted long-term OS and RFS and was validated with data from patients treated at our hospital.
Liver function is important for determining the primary treatment option and treatment results in patients with HCC. The serum albumin and bilirubin levels are reliable markers of a decline in liver function. The preoperative factors included in our model may aid in prognostication and shared decision-making for individual patients after resection of HCC. These factors include serum AFP, CA19-9, CA-125, HBsAg, HCV, postoperative vascular resection status, tumor stage (TNM), tumor size, tumor number, lymph node metastasis, and resection margin status.
The nomogram provides personalized predictions of patient prognosis after liver resection. However, several major problems remain. In the present analysis, we established a nomogram model of clinical characteristics and pathology for predicting survival outcomes in patients with HCC after resection on the basis of OS and RFS.
The nomogram demonstrated favorable accuracy when the C-index was calculated for OS (C-index 0.815, 95% CI: 0.769–0.862; p < 0.001) and RFS (C-index 0.80, 95% CI: 0.748–0.851; p < 0.001). Moreover, its predictions for individual patient follow-up and treatment were excellent. Furthermore, the nomogram was able to predict OS and RFS in patients with HCC who had undergone various invasive therapies.
The nomogram was validated as an effective tool for predicting long-term results. Nonetheless, the current findings will need to be confirmed by larger prospective studies of different invasive treatments.
A recent study by Endo et al. [23] proposed a model to preoperatively predict overall survival among patients undergoing liver resection for primary HCC.
In our present work, age and tumor number were found to play a role in the OS and RFS nomogram. Several studies have revealed that the age of the patient at the time of surgery and the presence of multiple tumors are crucial risk factors for recurrence, which is consistent with the findings of our present work [14, 24]. Another study by Xiao et al. [25] reported that HCC patients have a poor prognosis because of metastasis and recurrence. There is a good association between tumor number and 1-year, 3-year, and 5-year OS.
Our study revealed that for OS nomograms, tumor size is one of the anatomical factors associated with primary tumors. Previous studies have reported that pathological tumor size is a strong predictor of prognosis risk for patients with HCC [26, 27].
A previous study by Chen et al. [28] noted that recurrent tumor factors, such as the tumor number, the size of the recurrent lesion, extrahepatic recurrence, and the development of recurrence within 12 months of primary resection, were independent adverse prognostic factors for survival after recurrence.
Our survival forest plot analysis revealed that PVT classification was another important factor affecting the OS and RFS results. Although various treatment options have been considered for PVT, the presence of PVT is associated with poor outcomes [29, 30]. Another study by Mähringer-Kunz et al. [31] reported that the extent of PVT and OS were significantly related.
Moreover, our nomogram results, which are based on initial diagnosis and treatment, could be informative and helpful to both patients and physicians. Incorporating patient and treatment factors with tumor factors, such as tumor stage (TNM), PVT classification, albumin level, tumor size, and tumor number, improved the prediction of OS and RFS. Further studies are needed to validate the use of this nomogram in clinical practice.
However, there are several limitations in this study. First, it was a retrospective study conducted at a single center. A prospective study with a larger number of patients is needed for further validation of our results. Second, our prognostic prediction model clearly classified patients with resectable HCC with respect to their prognosis. The effect of this prognostic prediction model according to follow-up outcomes must be further investigated to establish its effectiveness for patients with resectable HCC. In the future, we will compare the OS of patients with recurrent HCC who are receiving various specific treatments.
In conclusion, in our study, we identified a cohort of patients with favorable oncological outcomes after resection by using a prognostic prediction model. Our findings may be applied to accurately predict prolonged life expectancy in patients with HCC who undergo resection. Predictive factors are essential for appropriate treatment selection given the increased number of patients with HCC who experience long-term survival following resection. Measuring liver function combined with AFP, CA125, and CA19-9 levels will be crucial for making better decisions regarding resection strategies in HCC patients.

