Introduction
Duchenne muscular dystrophy (DMD) is a severe, progressive, X-linked disorder affecting 1 in every 3500–5000 male births [1]. Mutations in the dystrophin gene lead to an absence or defect in the protein product resulting in progressive muscle weakness and, in consequence, loss of ambulation, and cardiac and respiratory failure [2, 3]. The respiratory status is among the main factors determining the length of survival in DMD patients. Initially, patients have no difficulties in breathing or coughing and their pulmonary function test (PFT) results are within normal limits. The progression of the disease causes gradually increasing muscular weakness, which leads to respiratory complications [4–7]. Typically it is manifested by nocturnal hypoventilation, followed by day-time hypoxaemia, hypercapnia, and finally respiratory failure. Additionally, from the moment when the patient becomes non-ambulant (usually by the age of 10–12 years), and spends more time in a wheelchair in a forced sitting position, the impairment of lung function increases. This is particularly evident in patients who suffer from scoliosis [3, 8–10]. Historically, DMD results in death in the teens. Currently, through appropriate supportive treatment, the average life expectancy of a patient with DMD is approximately 30 years [6, 7]. A careful and systematic approach to patients’ respiratory management may prolong survival [4, 11]; thus it is important to identify the moment of deterioration of pulmonary function in DMD patients.
The American Thoracic Society (ATS) recommends baseline pulmonary function assessment optimally between 4 and 6 years of age or before confinement to a wheelchair [10]. Patients should visit a paediatric pulmonologist twice yearly or while on mechanically assisted ventilation even every 3 months [5]. Although the Global Lung Initiative (GLI) and the European Respiratory Society (ERS) Taskforce Report recommend analysis of PFT based on the z-score, this method is still not used in DMD patients [12, 13]. Besides, large-scale, randomized controlled trials are rare in this field, so knowledge of the pulmonary status of DMD patients is often obtained from small clinical groups [14–16]. Therefore, subsequent studies of pulmonary function in DMD patients remain constantly up-to-date and important.
The aim of this study was (1) to assess pulmonary function in DMD patients using the z-score method and (2) to identify factors affecting it, irrespective of the disease progression.
Material and methods
Study design
In this prospective, single-centre, cross-sectional study, the pulmonary status of muscular dystrophy patients was evaluated. Boys visited the regional reference Rare Disease Centre in Gdansk for the first time, between the years 2015 and 2017. The study was performed in compliance with the Code of Ethics of the World Medical Association (Declaration of Helsinki). Approval for the study was obtained from the Committee of Ethics, no. NKBBN/105/2018, and informed written consent was obtained from all subjects. This study was funded by the Medical University of Gdansk, Poland (Institutional Grant ST 554).
Patients
Inclusion criteria were: (1) male aged 5–18 years, (2) confirmed diagnosis of DMD based on guidelines [6] – the presence of typical clinical symptoms, genetic testing, muscle biopsy results, (3) the ability to perform PFT.
Patients were evaluated according to the study protocol by a multidisciplinary team, including a paediatric pulmonologist. Interview, physical examination and spirometry were performed in all patients. Information on the need of ventilation support, ambulatory status, and steroid therapy (ST) (presence, type, dose, length and age of onset) was collected from interview and medical records. Anthropometric data – weight (a calibrated weighing chair – AXIS, model B 150 K, with accuracy to 50 g), height (in non-ambulatory patients as recumbent segmental length: head to hip, hip to knee, and knee to foot) – were measured according to the guidelines [6, 7].
Pulmonary function test
Spirometry was performed using the calibrated, computerized spirometer Pneumo Screen, Jaeger, Germany, according to the ATS recommendations, by a certificated teenagers’ physical therapist, experienced with children [10]. A minimum of three, and up to five, manoeuvres with maximum effort were attempted by each subject. The highest values of forced vital capacity (FVC), forced expiratory volume in 1 s (FEV1) expressed as litres [l], and peak expiratory flow (PEF) in litres per minute [l/min], from correct acceptable attempts, were included in the analysis. Corresponding % predicted value (%pv) and z-scores [z] for age, ethnicity, gender and height were calculated, based on the GAMLSS (Generalized Additive Model for Location, Scale and Shape) method in accordance with the 2012 GLI and ERS Taskforce Report, and recommendations using GLI-2012 Excel Sheet Calculator (Version 4, 25 May 2014) [13].
Statistical analysis
Statistical analyses were performed using Wizard Pro 1.9.16 (Evan Miller, Chicago, IL). Data are given as mean (±SD) or median (min.–max.) depending on the distribution. Normality of the distribution was tested using the Shapiro-Wilk test. Student’s t-test and the Mann-Whitney test were used as indicated. For multiple comparisons, proper ANOVA or Friedman tests were used. Categorical data were compared with the χ2 test and χ2 test for a trend (Cochran-Armitage). Pearson correlations, linear regression and multivariable linear models were additionally employed. To compare the rates of the disease progression between two groups we used the test for equality of two regression coefficients as recommended [17, 18]. Results having a p-value < 0.05 were considered statistically significant.
Patients’ characteristics
Out of 78 patients diagnosed previously with muscular dystrophy, 55 children met the inclusion criteria. Twenty-three patients were excluded for the following reasons: age below 5 years, mutation other than DMD (Becker muscular dystrophy), inability to perform PFT (9, 9, 5 males respectively). All patients were male Caucasians. Their characteristics are presented in Table I.
Table I
Anthropometric and baseline characteristics of subjects
Pulmonary function tests
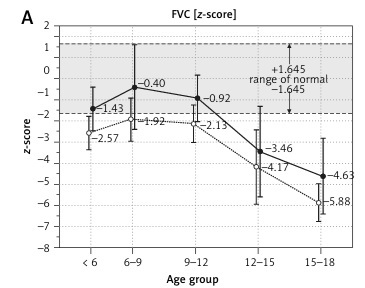
PFT results are shown in Table II. Absolute FVC [l], FEV1 [l], PEF [l/min] values increased with age, reaching peak numbers in children aged 9–12 years and then subsequently decreasing in older ones (Figures 1 A–C). Normalized FVC[z], FEV1[z], PEF[z] values start to decline earlier after reaching the highest z-score values in subjects aged 6–9 years (Figures 1 D, E).
Table II
Descriptive statistics [mean ±SD (range)] of spirometric variables by age group
Figure 1
Comparison of pulmonary function testing (PFT) measured as absolute values (l or l/min, top panel A–C). Normalized as z-scores (D–F) and % predicted volume (G–I) by age
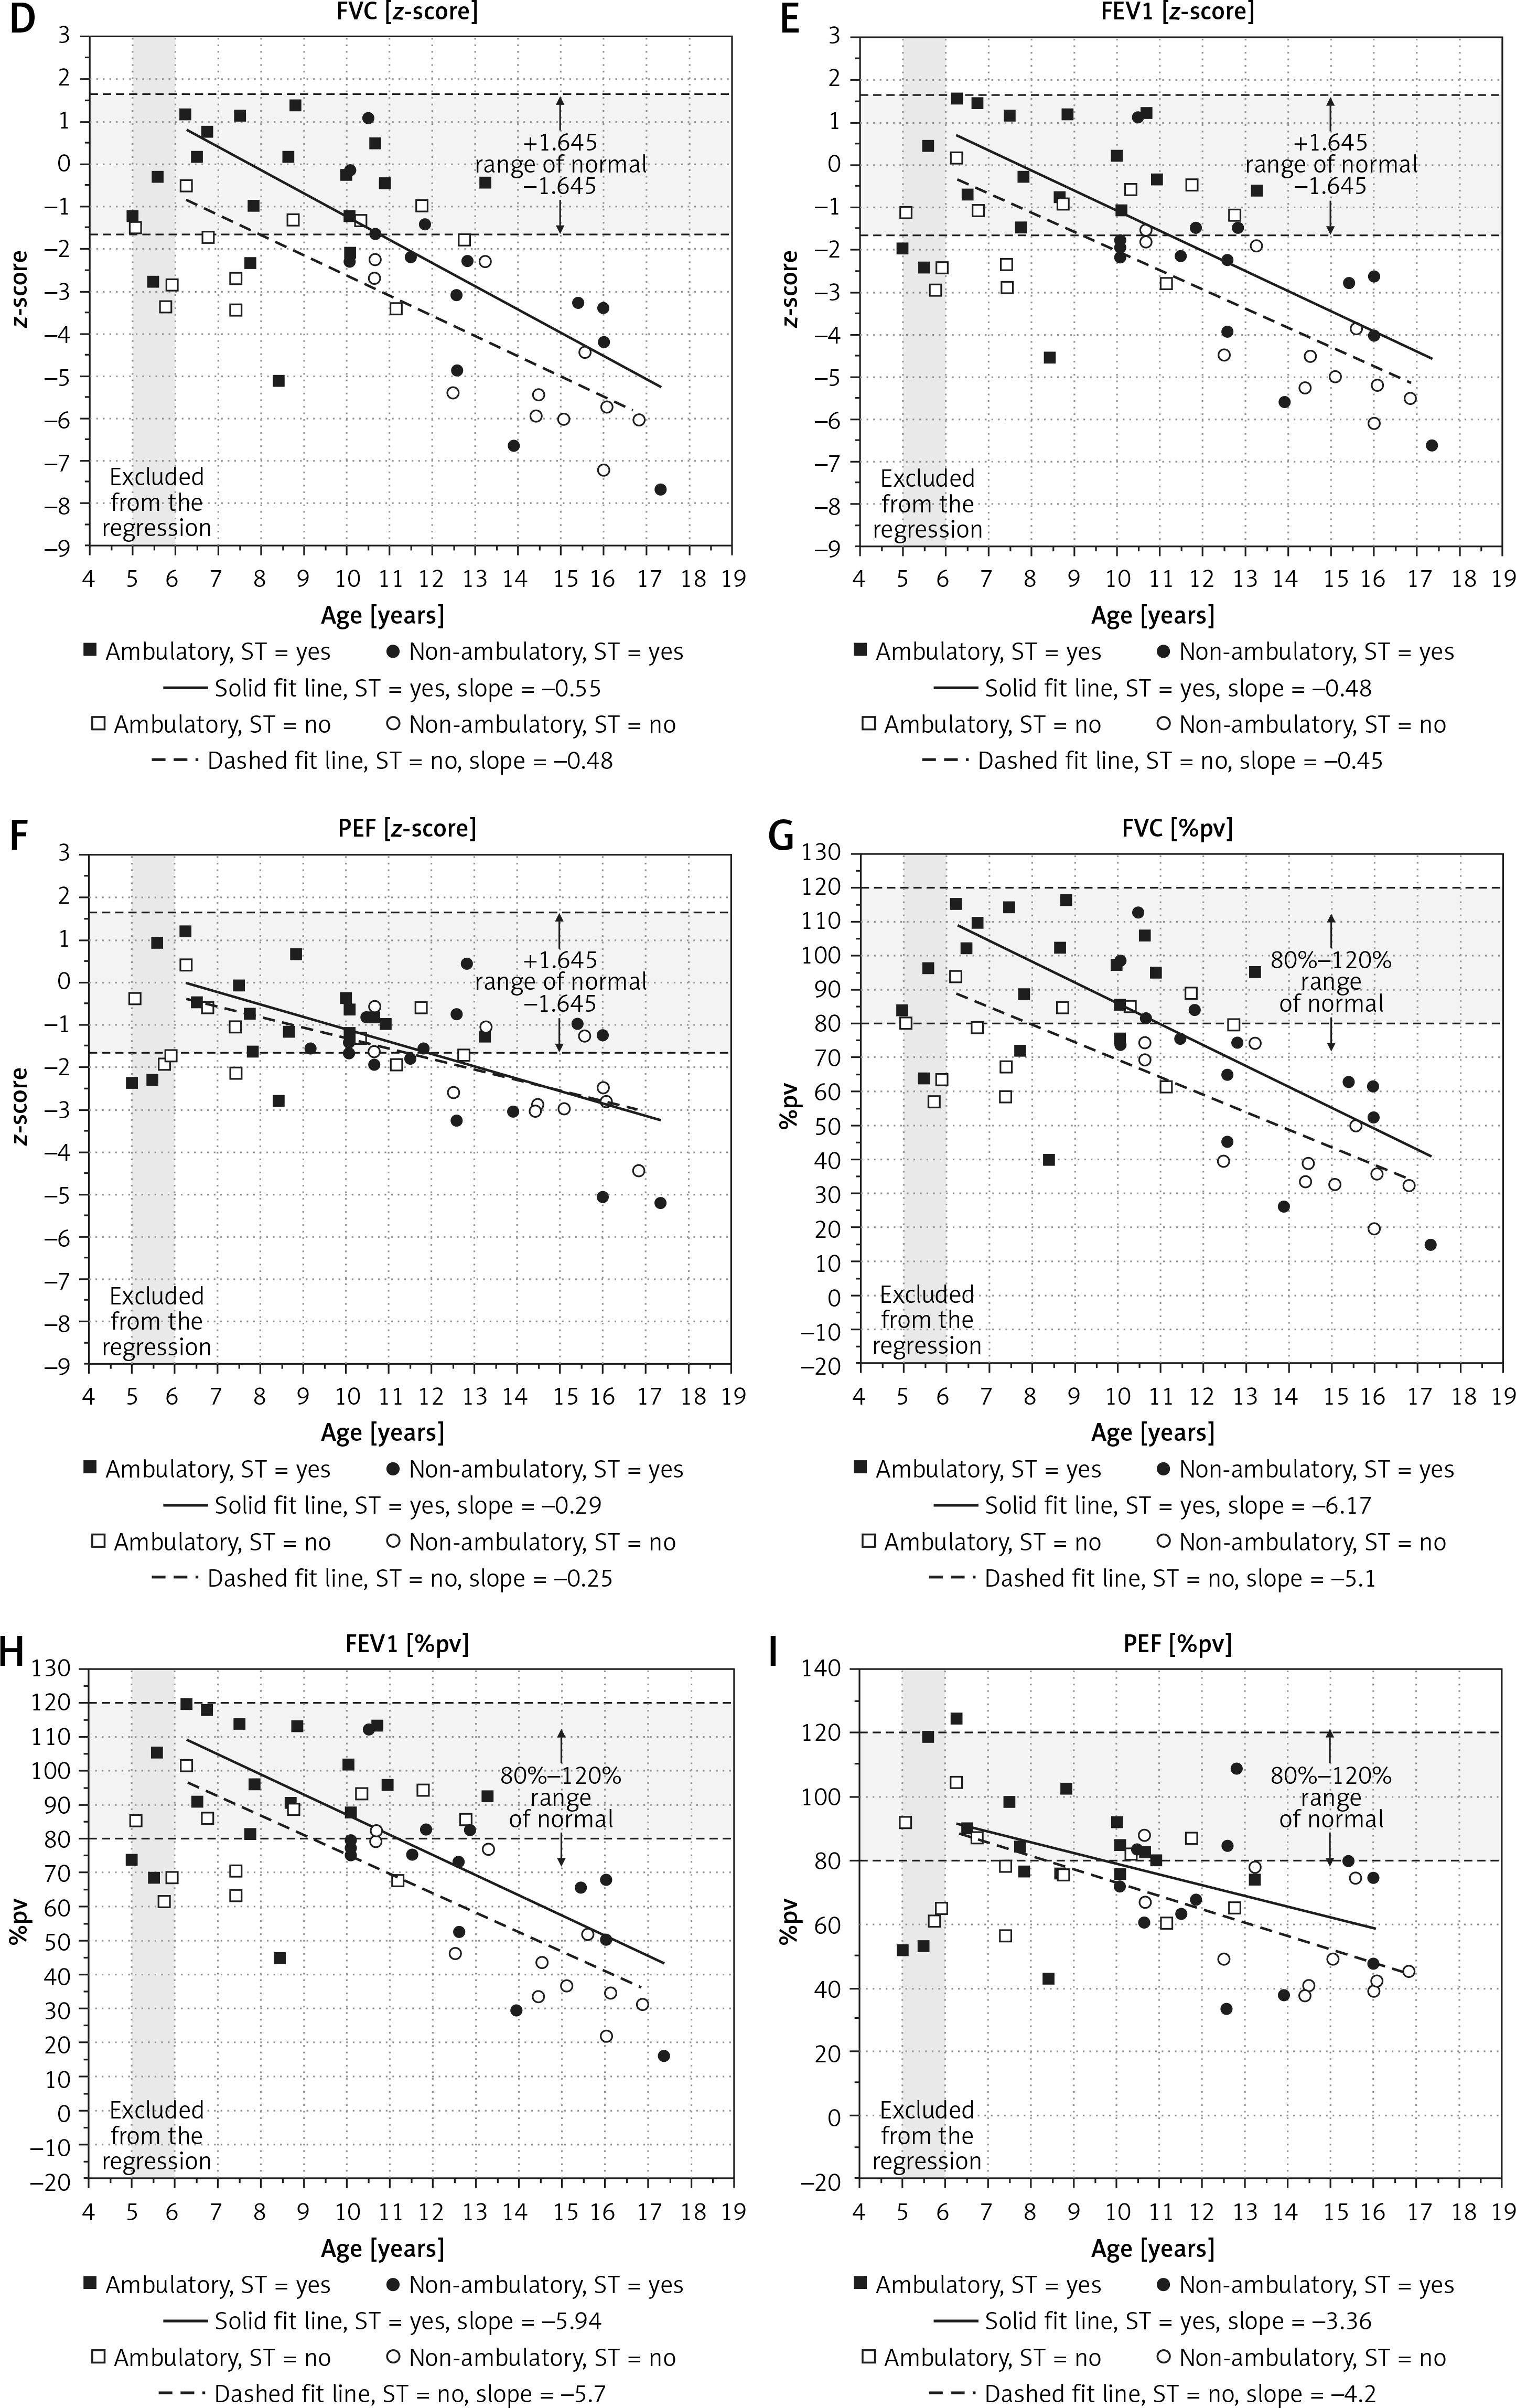
While the correlation between %pv and z-score values was strong (R = 0.96, R = 0.98, R = 0.68, p = 0.0001 for FVC, FEV1, PEF respectively), analysis of the linear regressions for the whole sample revealed that the results fell below the normal range (z-score < –1.64) at the age of 9.8, 10.4, 11.6 years for FVC[z], FEV1[z], PEF[z], respectively, and fell below the normal range (value < 80%pv) at the age of 10.7, 12.2, 13.2 years for FVC%pv, FEV1%pv, PEF%pv, respectively.
There was a negative correlation between PFT described by z-scores of measured parameters and age: FVC[z] (r = –0.62; p < 0.001), FEV1[z] (r = –0.65, p < 0.001), and PEF[z] (r = –0.55; p < 0.001). A multiple linear regression was calculated to predict PFT results based on age. Significant regression equations were found for FVC[z], FEV1[z], PEF[z] (Table III). Participants’ predicted FVC[z] was 3.73, predicted FEV1[z] was 3.47 and PEF[z] was 1.57. Therefore annual z-score decline rates were 0.55, 0.49, 0.28 for FVC, FEV1, PEF respectively (Figures 1 D, E, regressions lines for the overall sample not depicted).
Table III
Multivariate regression models predicting the pulmonary function testing (PFT)
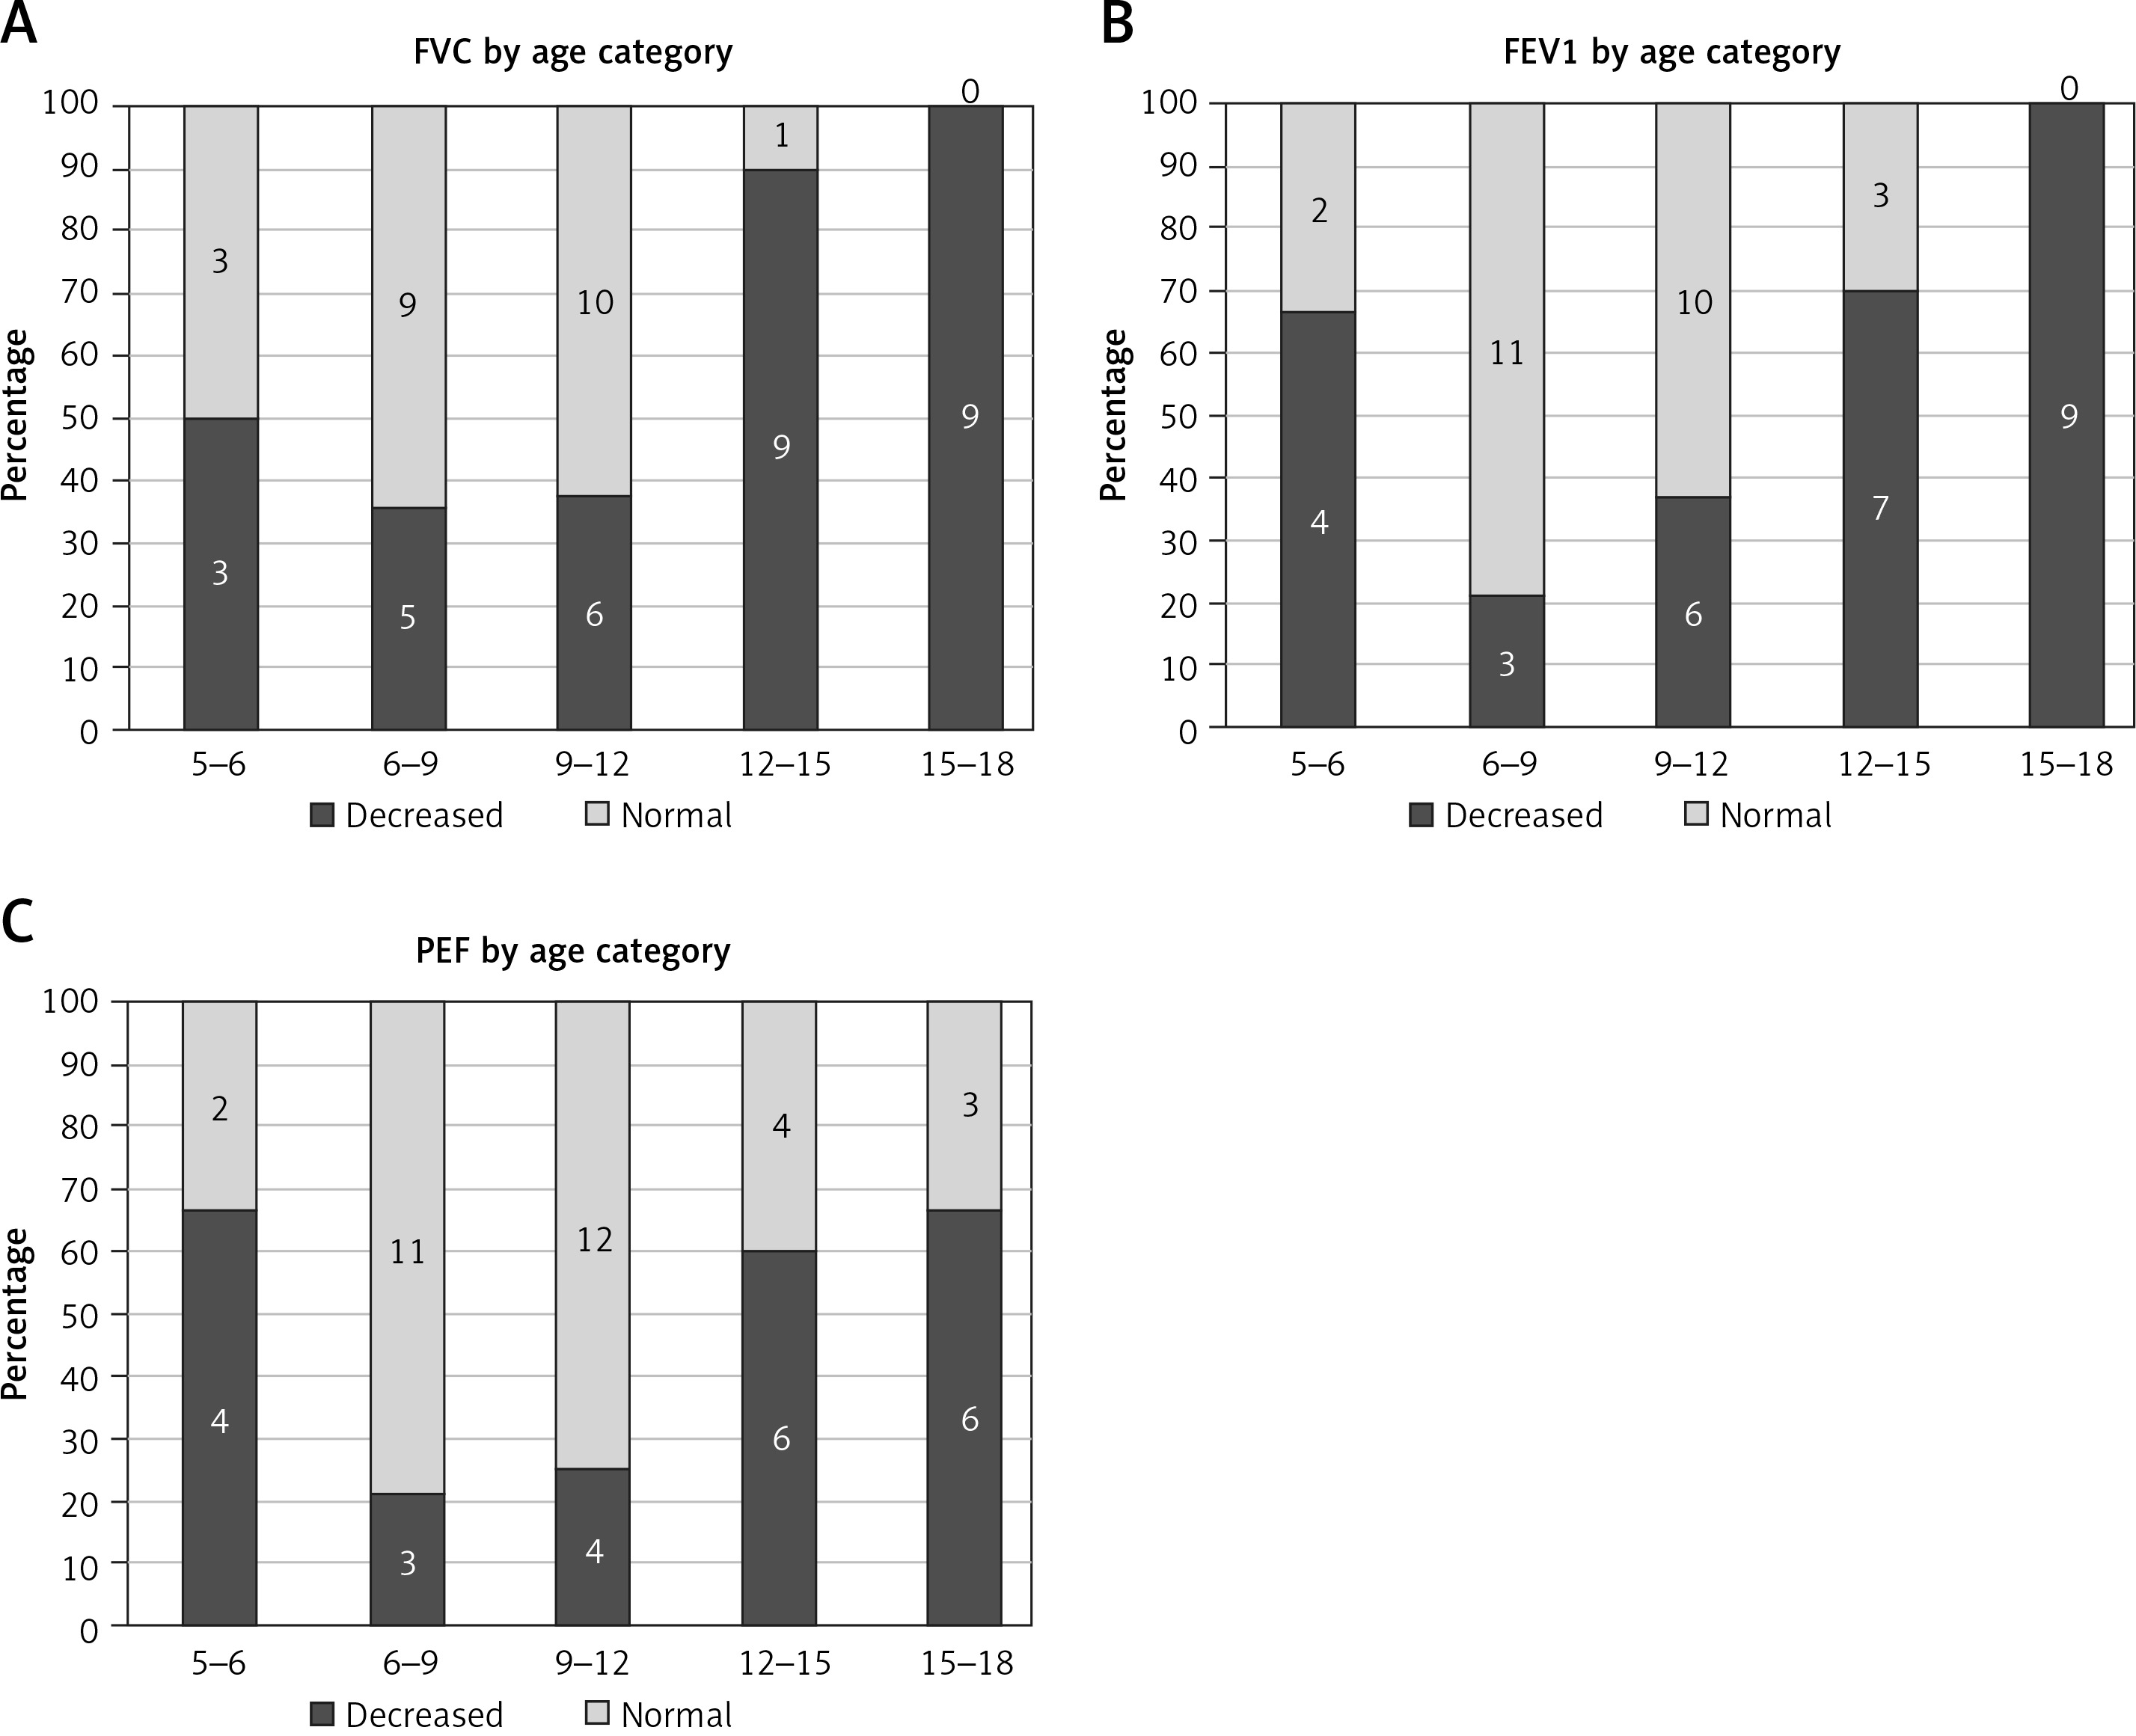
Consequently, the number of subjects with abnormal absolute and normative FVC, FEV1, PEF values increased with age (p = 0.001, p = 0.002, p = 0.048; respectively, Cochran-Armitage test) (Figures 2 A–C).
Figure 2
Number of patients with normal and abnormal results of pulmonary function testing (PFT) z-score by age group (n given inside the bars)
All children older than 14.0 years had abnormal PFT with significant variability in the results. Interestingly, absolute FVC ranged from 0.6 l to 2.5 l (3 patients presented FVC under 1 l) (Figures 1 D, E).
Pulmonary function test and ambulatory status
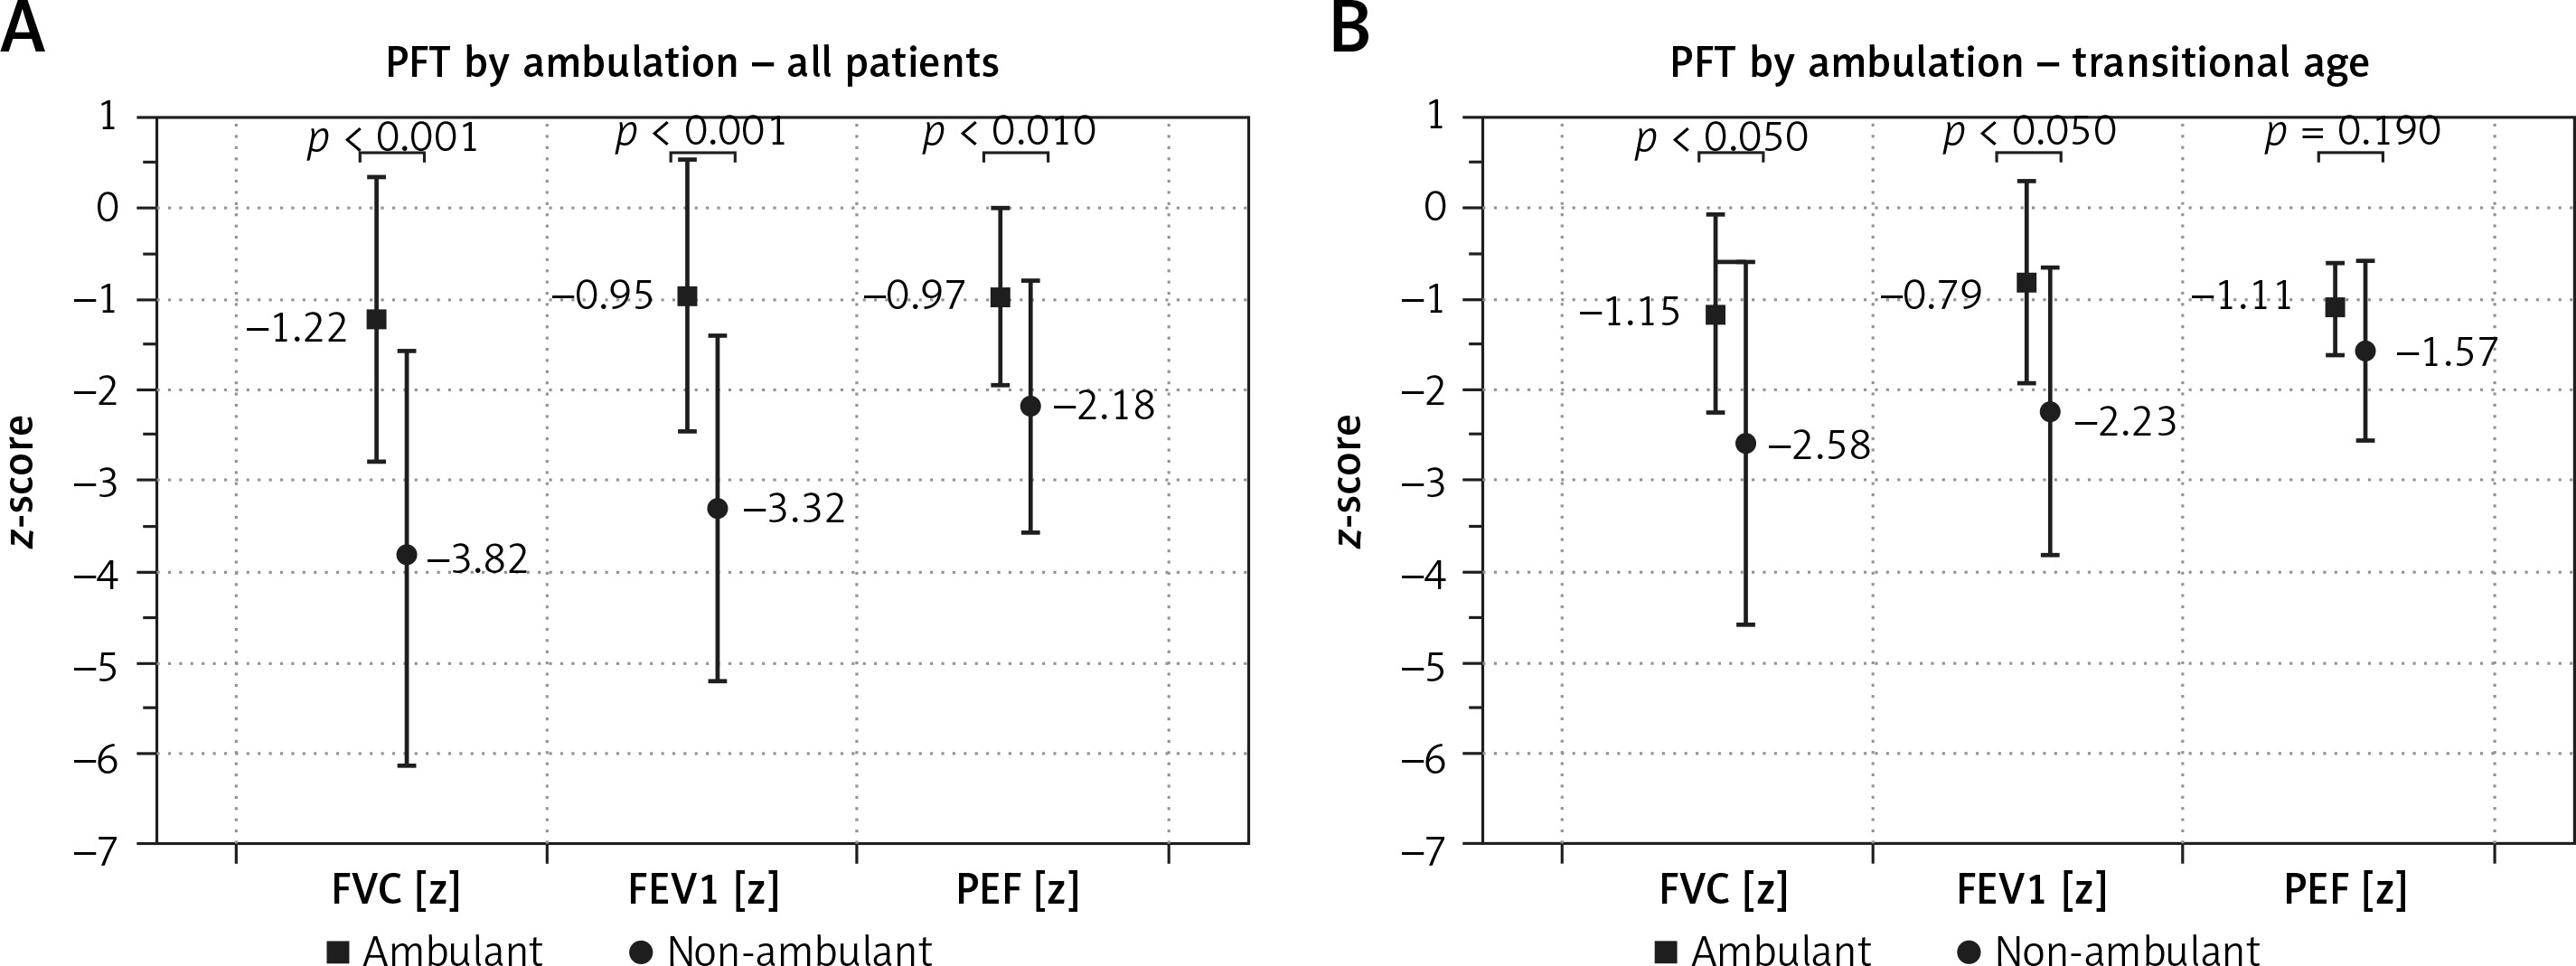
Patients who were able to walk on their own had significantly higher PFT results than non-ambulatory patients (Figure 3 A). The ambulatory transitional period is established between 10 and 14 years of age (n = 24). In our study group 10 (42%) patients in this period were ambulant. Ambulatory patients in transitional age had significantly higher FVC[z] and FEV1[z] (p < 0.05 for both variables), but not PEF[z] (p = 0.190), in comparison to the non-ambulatory patients (Figure 3 B). Similar results were obtained for FVC %pv, FEV1 %pv, PEF %pv: 87.3 vs. 57.7; 94.5 vs. 63.6 and 79.7 vs. 60.7, respectively (p = 0.0001).
Pulmonary function test and steroid therapy
Patients treated with steroid therapy (on-ST) presented significantly higher values of FVC %pv (81.1 ±27.1 vs. 61.1 ± 22.2, p = 0.002), FEV1 %pv (87.1 ±27.8 vs. 69.1 ±25.1, p = 0.02), PEF %pv (74.5 ±21.8 vs. 65.1 ±20.1, p = 0.11) and also FVC[z] (–1.7 ±2.3 vs. –3.4 ±2.0, p = 0.005), FEV1[z] (–1.5 ±2.0 vs. –2.8 ±1.9, p = 0.016), but not PEF[z] (–1.4 ±1.4 vs. –1.8 ±1.1, p = 0.257), than patients without steroid therapy (non-ST). This difference did not reach statistical significance within age subgroups (Figures 4 A–C), probably as a result of small sample sizes.
Figure 4
Mean normalized pulmonary function testing (PFT) values by age group and current steroid treatment (ST) status
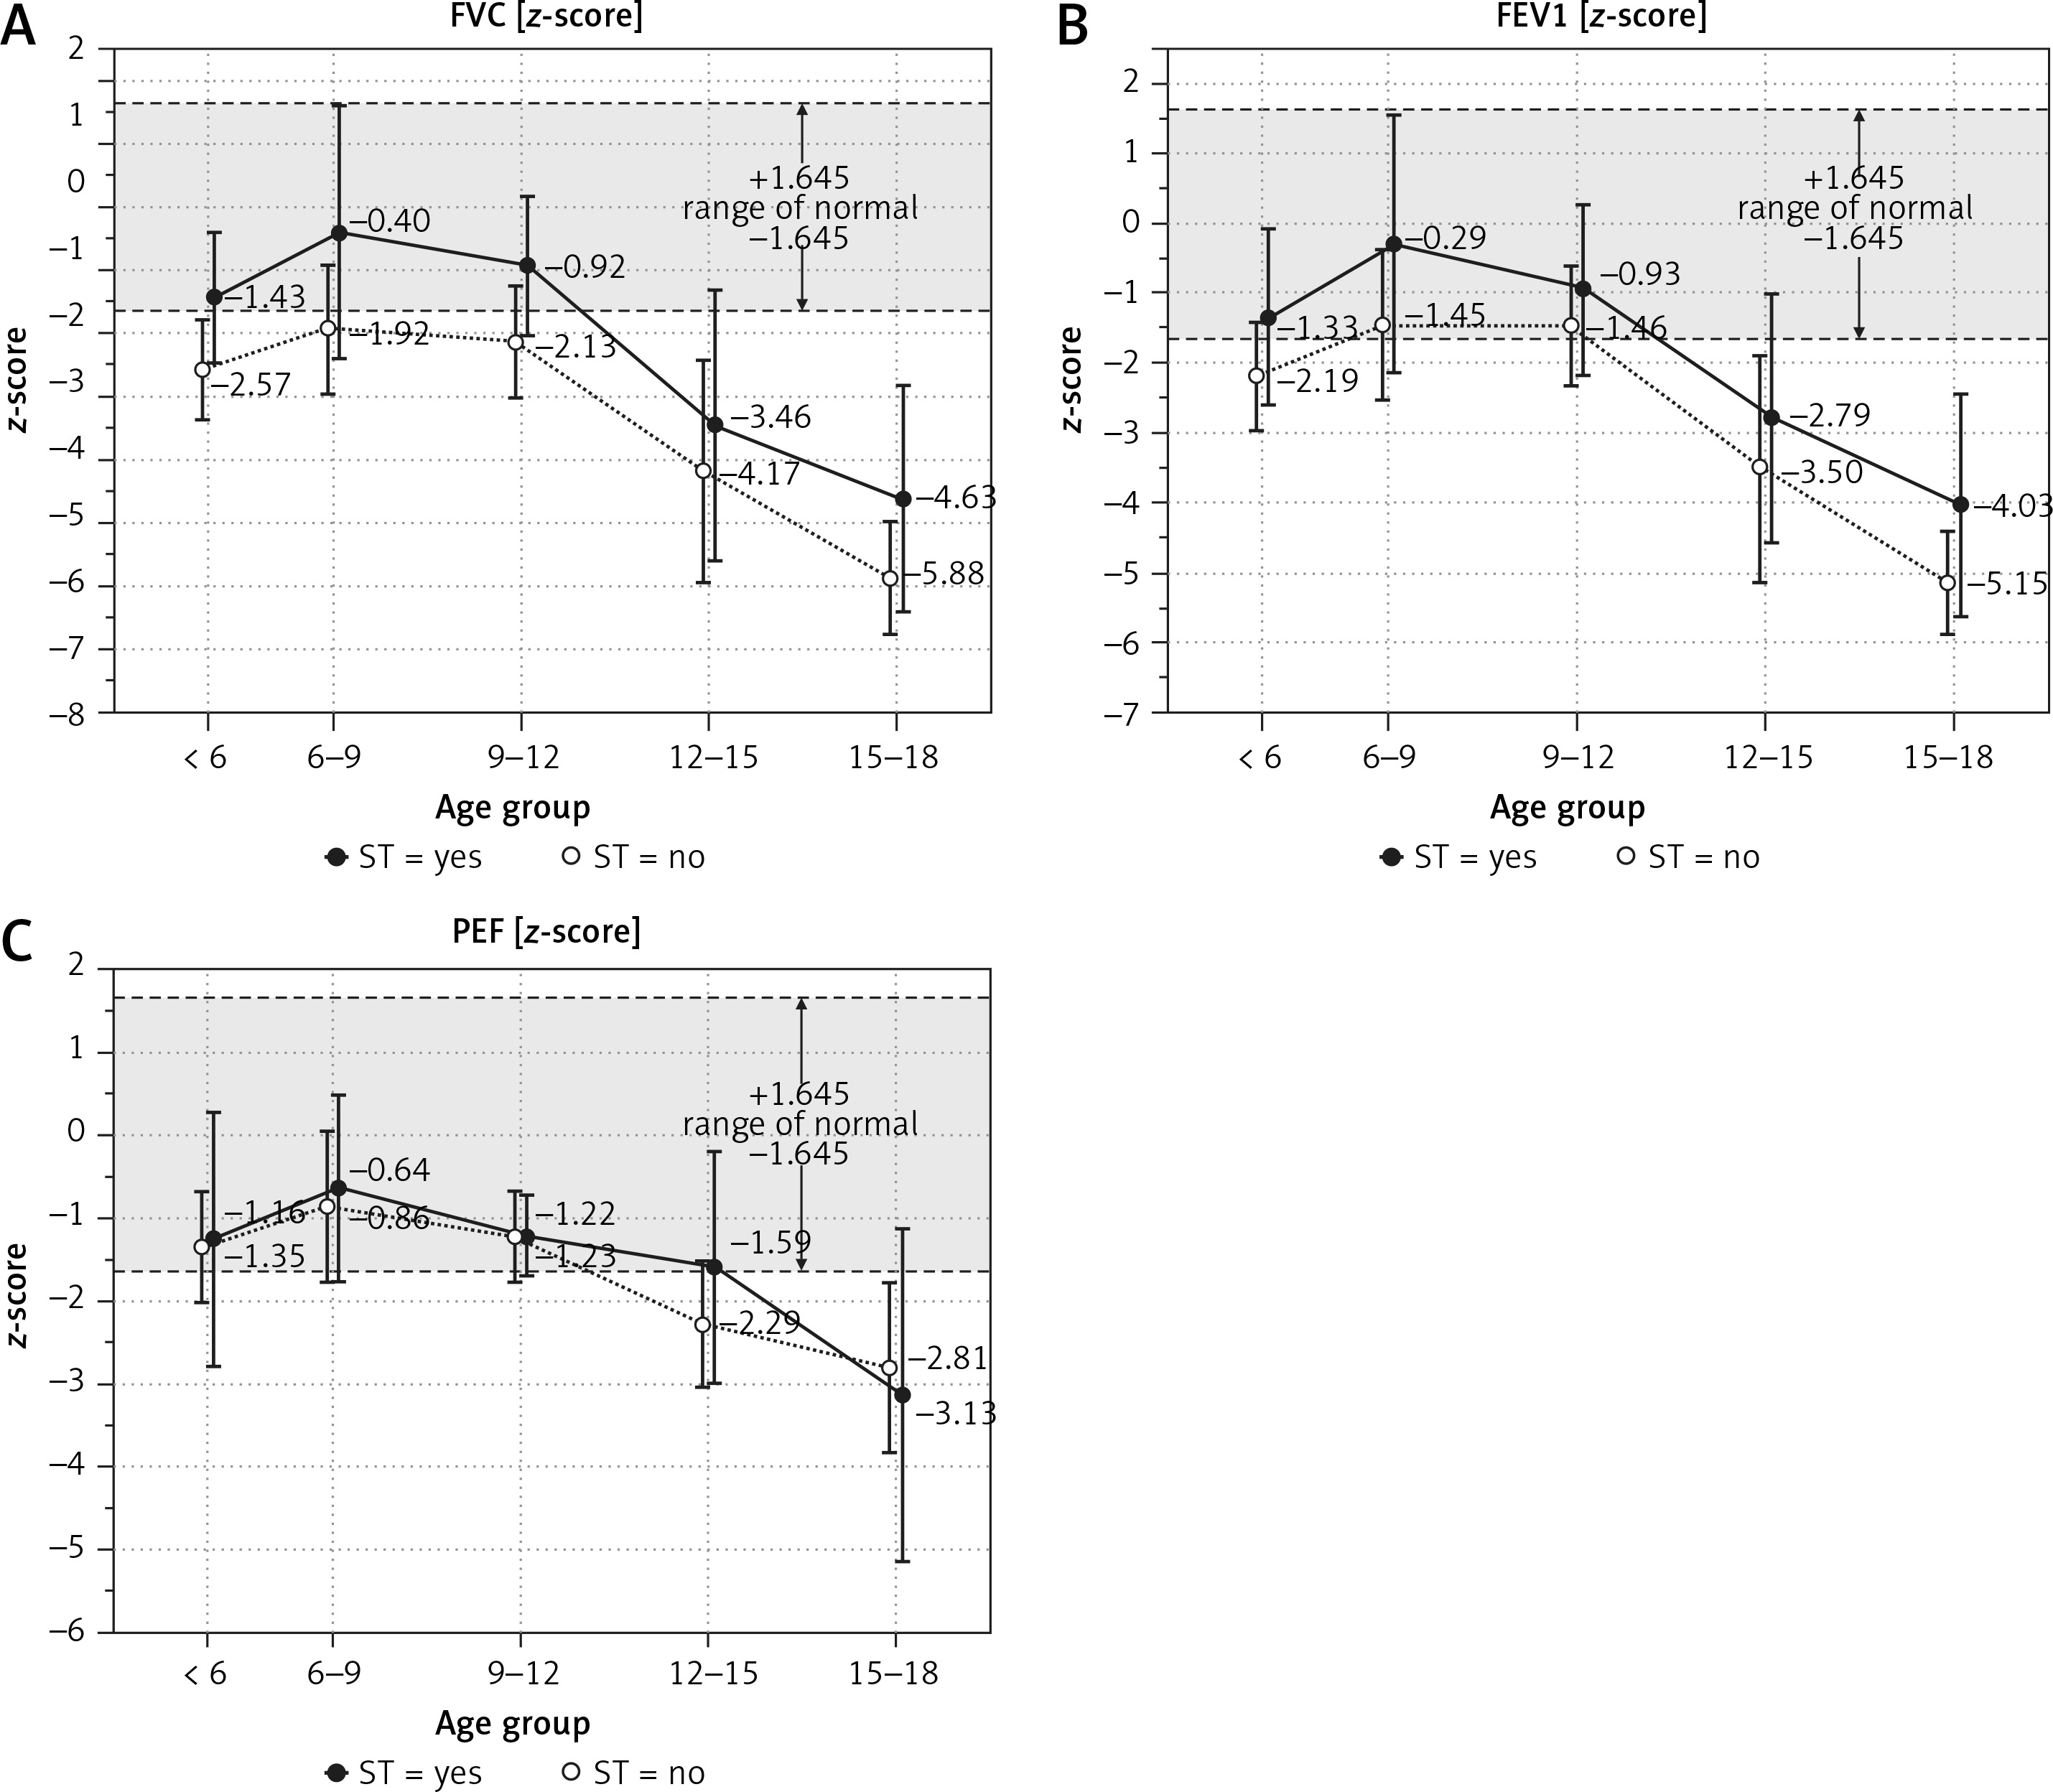
Analysing the possible effect of the type of steroid used (deflazacort vs. prednisone) we did not find any significant difference in FVC[z] (–1.4 ±2.1 vs. –2.4 ±2.5, p = 0.189), FEV1[z] (–1.2 ±1.9 vs. –2.1 ±2.2, p = 0.246), PEF[z] (–1.3 ±1.3 vs. –1.6 ±1.6, p = 0.478) or in the proportion of ambulant and non-ambulant patients (56% vs. 45%, p = 0.511). Similarly, there were no significant differences for FVC %pv (75.1 vs. 84.9, p = 0.125), FEV1 %pv (80.9 vs. 91.7, p = 0.253), PEF %pv (71.7 vs. 76.5, p = 0.510).
A positive correlation between use of steroids and FVC[z], and FEV1[z] (Spearman R = 0.55; p < 0.05 for both variables) and PEF (Spearman R = 0.31; p < 0.05) was noted. Also, we observed a positive correlation between use of steroids and FVC %pv, FEV1 %pv (Spearman R = 0.36 for both variables; p < 0.05), but not for PEF.
Additionally, the duration of ST had a positive effect on PFT outcomes correcting for age (multiple linear model; Table III).
To determine the effect of ST on the disease progression rate we fitted linear regression models separately for the on-ST and non-ST patients. The predicted levels of FVC[z], FEV1[z] and PEF[z] are presented in Table IV.
Table IV
Predicted statistically significant (p < 0.001) levels of FVC[z], FEV1[z] and PEF[z] by age in patients treated with steroid therapy (ST) and patients without steroid therapy (non-ST)
| Parameters | ST patients | Non-ST patients |
|---|---|---|
| FVC [z] | 4.23 | 2.13 |
| FEV1 [z] | 3.68 | 2.50 |
| PEF [z] | 1.80 | 1.14 |
Comparing the slopes of the annual decline rate of PFT, they were similar in both on-ST and non-ST subgroups (Figure 4), for FVC[z] (–0.55 and –0.48; p = 0.637), FEV1[z] –0.48 and –0.45; p = 0.863), PEF[z] (–0.25 and –0.29 respectively; p = 0.660). Thus, we found no significant differences in the rate of PFT decline between the two subgroups.
However, the regression lines are shifted and intersect the threshold for a lower level of normal (z-score < –1.64) at different ages for on-ST vs. non-ST patients: FVC (10.7 vs. 7.9), FEV1 (11.2 vs. 9.2 years of age respectively). This could be interpreted as 3 years of advantage for FVC and 2 years of advantage for FEV1 of the treated vs untreated patients. The results presented as %pv showed slower progression with steroid treatment, and the regression lines shifted the threshold for a lower level of normal (< 80%pv) later than presented in the z-score (on-ST vs. non -ST patients: FVC 11.0 vs. 8.1, FEV1 11.5 vs. 9.6 years of age respectively, Figures 1 G–I).
Multivariable regression model
Finally, including all the identified risk factors (patient age, ambulatory status, ST) we calculated multiple-linear regression models to predict FVC[z], FEV1[z], PEF[z] for DMD patients. Age was considered a continuous variable, ambulatory status and ST were coded 0 = no, 1 = yes. FVC[z] and FEV1[z] were significantly dependent on age, ambulatory status and ST, PEF[z] only on age and ambulatory status (Table III). Specifically, FVC[z], FEV1[z], PEF[z] decreased with age by 0.359, 0.303, 0.166 respectively annually but were 1.188, 1.233, 1.619 higher if the patient was ambulant. ST influenced FVC[z] and FEV1[z], by 1.525 and 1.125 respectively.
Discussion
Our study provides an insight into the respiratory system condition assessed by PFT in 5–18-year-old, male Caucasian DMD patients in different stages of the disease, addressing for the first time the reference centre in northern Poland. More than half (55%) were non-ambulatory, and the majority (69%) were treated with glucocorticoids. We have used state-of-the-art methodology to interpret PFT results in children, that is calculating z-scores based on the GAMLSS method. This method has been recently recommended by the GLI 2012 and ERS, as it is considered to be superior to the still commonly used method of expressing the results as a percentage of the predicted value [10, 13].
Pulmonary function parameters in different stages of the disease
The most important finding of our study was that, using the GAMLSS method, we determined the difference in time of PFT peak between absolute values, percentage of predicted volume and z-score values. Noticeably, the measured parameters still increase until the age of 9–12 years, but with normalized data it becomes apparent that pulmonary status deceivingly starts to decline much earlier – from the age of 6–9 years after reaching the highest z-score values. While the correlation between %pv and z-score values was strong, our analysis showed that the z-score could predict a faster decline of PFT value than %pv in patients with DMD. It is an interesting finding that may change everyday practice, focusing the clinician’s attention on z-score values of PFT results. Earlier pulmonary function decline should lead to earlier introduction of respiratory physiotherapy in DMD patients. It also means that their pulmonary capacity never develops to its full potential as in healthy peers. The observation above further underlines the necessity to use normalized data in interpretation of the results in children as they account for the effects of development (growth) and body size among others.
Generally, all PFT values significantly decrease with age after reaching the peak values, which is consistent with the natural history of pulmonary function in DMD patients described in two prospective studies of a longitudinal observational cohort: the Cooperative International Neuromuscular Research Group (CINRG) Duchenne Natural History Study (DNHS) and an Institutional Review Board approved United Dystrophinopathy Project (UDP) cohort study [19, 20].
Interestingly, out of all analysed z-score parameters, FVC started to fall in the earliest age, and faster than others. This indicates that the FVC is a good and sensitive parameter for monitoring the progression of the disease, which is confirmed by the updated guidelines [5]. Also, the decline in FVC is historically the best validated pulmonary function predictor of mortality in DMD patients [10, 21].
The next interesting fact is that all children over the age of 14.0 years had FVC values below the normal range for age, but at the same time, there was significant variability in the measured FVC in litres. Phillips et al. evaluated a threshold of FVC of 1 l as a predictor of unfavourable outcome (5-year survival – 8%) [21]. Similar lung function deterioration rate and course of the disease have been reported in the literature [22–27]. To validate these findings, we need to recruit more patients and continue with a longitudinal study.
Effect of loss of ambulation on PFT
Per subgroup analysis we concluded that patients who were not able to walk on their own had lower PFT results than ambulatory patients at the same age. The moment of loss of ambulation coincides with the onset of decline of measured FVC and FEV1. We are unsure whether to treat it as a consequence of the natural course of the disease or as a complication of immobilization together with progressive scoliosis, which may worsen conditions for ventilation by itself. Such conclusions were drawn by some authors previously [20, 28, 29]. Moreover, Philips et al. concluded that a reduction in FVC to less than 1 l increased the risk of a faster transition to a wheelchair and also predicted median survival length of 3.1 years [21].
Pulmonary function parameters and ST
The results of our study indicated that steroids positively influence pulmonary outcome; steroid treatment delays, but does not prevent, the progression of the disease. Independently of steroid regimens (prednisone or deflazacort), we found better PFT results, both absolute and normalized. The onset of pulmonary function loss was delayed from 2 to 3 years in patients on ST compared to non-ST.
Our PFT results performed in the Polish cohort are similar to other authors’ findings. Two randomized controlled trial studies described the impact of ST on pulmonary function assessed by FVC [16, 30]. Griggs et al. reported an improvement in FVC of about 0.16 l in subjects treated with prednisone (0.3 mg/kg/day) for 6 months compared to the placebo group [16]. Mendell et al. evaluated treatment with prednisone 1.5 mg/kg/day versus placebo for 6 months, finding a mean improvement in FVC in the treatment group, similarly to the Griggs study (0.14 l more than in the placebo group) [30]. Similar results are available from non-randomized cohort studies which showed improvement of FVC in patients on ST [31–34].
Although a Cochrane review confirmed the positive effect of steroids on pulmonary function, administration of ST in DMD is still controversial due to multiple adverse reactions associated with chronic uptake [14, 15, 35, 36]. Further, the optimal standard regimen is still under discussion; there are questions about the frequency of administration and the optimum dose – adequate to be efficient, but at the same time not provoking significant side-effects. Bushby et al. recommended starting the treatment during the plateau phase – while there is no longer progress in motor skills, but prior to the decline, as described by medical history and exercise testing [4]. So far it is proven that 0.75 mg/kg of prednisone daily or the deflazacort equivalent of 0.9 mg/kg stabilizes strength in DMD [37]. In our study the data come from a first-time visit to our centre – consequently, the cohort is heterogenous in the prior approach to the ST. Also, frequently the prior follow-up intervals were longer than recommended and thus the ST doses were not updated adequately for growth. Surprisingly, despite that fact, we were able to detect statistically significant effects of the treatment on the PFT, delaying pulmonary function decrease by 2–3 years.
Despite the limitation of the study in the form of a relatively small sample size, our results show the benefits of using normalized values (z-score) for parameters determining pulmonary function. Additionally, our study is the first to analyse pulmonary function of the DMD population in northern Poland. Furthermore, according to our best knowledge, this is also the first study of pulmonary function in DMD patients to employ the GLI 2012 guidelines and recommended normative values of z-scores and GAMLSS methodology.
Clinical implications
Deterioration of respiratory function in DMD boys may occur even earlier than previously thought. Patients, their carers and health care providers should be informed about the necessity of frequent assessment of the respiratory system. PFT results should be interpreted also as z-score values. Better respiratory system evaluation may lead to earlier medical intervention, resulting in improved quality of life for DMD patients.
Conclusions
The results of the current study show the difference in the time of peak of PFT between values measured as absolute, % predicted and z-scores, which decrease with the progression of the disease. Interpretation of PFT results based on the z-score, reflects changes in pulmonary function earlier and more specifically than the other values. As a consequence, appropriate physiotherapy will be applied sooner. This is especially important for patients with risk factors for worse pulmonary outcomes, which were: early loss of ambulation and lack of or delayed steroid therapy.