The decrease in muscle mass and function along with aging is a well-known natural process. However, from as early as about 30 years old the muscle mass and strength begin to physiologically decrease. It may accelerate around the age of 75, but this varies individually, starting as early at 65 or as late at 80 years old. The dynamics of this process depends on many intrinsic and extrinsic factors. These include hormonal changes, co-morbidities with especially chronic heart failure, decreased physical activity, inappropriate protein and caloric intake or their decreased turnover [1, 2]. The limited physical activity due to impaired muscle function contributes to a vicious circle, further accelerating atrophy of muscles when they are not stressed by exertion or exercise. The loss of muscle mass, their strength and function is referred to as sarcopenia. The term sarcopenia (from the Greek ‘sarx’ – the flesh and ‘penia’ – loss) was used for the first time, however, in 1989 by Rosenberg to determine the loss of muscle mass associated with aging [3]. The process of primary sarcopenia naturally follows chronological aging. It is significantly exacerbated by multiple diseases that usually affect the geriatric population, results in increasing pathological aging and leads to secondary sarcopenia, that is muscle loss when other evident causes are also involved, besides aging [4, 5]. According to the present criteria, sarcopenia means loss of muscle mass, muscle strength and/or physical performance [6]. Sarcopenia affects 5–10% of people over 65 years of age and affects more than 50% of people aged over 80 years, significantly contributing to a decrease in the functional capacity, institutionalization and dependence on third parties [7]. Sarcopenia is to a certain extent associated with frailty syndrome, and the low muscle mass is a factor increasing mortality [8, 9]. Patients with sarcopenia have reduced quality of life (SF-36) in the domain of physical performance, tendency to falls, and in the case of women, dependence when performing domestic tasks was increased [10]. Due to the aging of the European population, sarcopenia has become a challenge in the field of public health. The number of individuals with sarcopenia in Europe may rise from around 11–20 millions in 2016 to more than 19-32 millions in 2045 (a 64–72% increase), depending on criteria assumed [11]. In 2016 sarcopenia was classified as a separate disease according to ICD-10 (M62.84) [12]. The pathophysiological background for sarcopenia includes processes that impair myogenesis and decrease the synthesis of muscle fibers as well as disturbances in the functioning of muscle satellite cells. In particular, a decrease in the amount of fast-twitching myosin type II fibers occurs, conversion of fast- to slow-twitching muscle fibers takes place and infiltration of muscles by fat tissue progresses with age (e.g. myosteatosis) [13]. Sarcopenia is associated with an imbalance between catabolism and anabolism resulting from decreased levels of anabolic hormones, such as testosterone and adrenal androgens, a decrease in growth hormone secretion leading to a state called somatopause, and a decrease in the secretion of insulin-like growth factor 1. On the other hand, the levels of catabolic hormones increase, and especially in the elderly, unrecognized hyperthyroidism is often observed [14, 15]. Chronic inflammation with the participation of cytokines (IL-1, IL-6, TNF-α), as well as myostatin belonging to the myokines family, inhibits the synthesis of muscle tissue and contributes to muscle atrophy [16]. There is also involvement of a neurogenic background in sarcopenia with synaptic and neuronal degeneration leading to impaired muscle stimulation and atrophy [17]. Protein-energy malnutrition, especially affecting hospitalized elderly, people living alone and residents of long-term care facilities, is a common external cause that contributes to increased muscle loss [18]. On the other hand, concomitant obesity can mask sarcopenia, although seemingly normal anthropometric parameters are observed. This is a commonly occurring hidden condition of reduced lean soft tissue in favor of excess adiposity and was called sarcopenic obesity. Although emerging data suggest that obesity may coexist with sarcopenia, one should know that this sarcopenia phenotype cannot be identified without body composition analysis techniques [19]. The clinical significance of sarcopenic obesity is, however, not clearly established [20]. Sarcopenic obesity should be considered also in the context of the obesity paradox. This phenomenon means that in some chronic conditions, especially cardiovascular diseases, obese patients exhibit reverse epidemiology, contrary to intuitively expected, and have a better prognosis than would result from the estimated risk related to cardiovascular complications. It is observed, however, in body mass index (BMI) between 25 and 35 kg/m2 but not beyond that range. It seems that sarcopenic but obese subjects benefit from the obesity paradox [21]. However, there are also contradictory conclusions, which deny benefits from such a protective function of obesity, stating that the obesity paradox may be a result of survival bias or that normal weight reflects comorbidities, malnutrition, and anabolic deficiency [22]. Sarcopenia should not be, however, confused with cachexia. Although these conditions have a common hallmark such as loss of muscle mass and strength, they should be considered distinct clinical entities [23]. Cachexia (from the Greek ‘cacos’ – bad and ‘hexis’ – having) is characterized by severe body weight loss, including fat and muscle loss, due to an underlying devastating illness [24]. Contrary to osteoporosis diagnosed on the basis of widely recognized and applied criteria, the importance of sarcopenia, which inevitably although slowly, weakens the efficiency of the musculoskeletal system, is still underappreciated. Deterioration of the physical performance is basically caused by loss of the muscle weight and function. However, there is a known unfavorable relationship between a decrease in the lean body mass in older men and loss of bone density that aggravates osteoporosis, increasing risk of fractures [25]. This is explained by the hypothesis of decrease in osteogenic activity due to either minor mechanical stimulation imposed on the bone by reduced muscles or decreased mechanical stimuli due to lower physical activity in the case of sarcopenia [25]. It is also discussed whether sarcopenia and osteoporosis should be considered as one or two separate diseases; in fact many studies support the idea of a “bone-muscle unit” with bone and muscle mutually interacting via secreted cytokines [26]. The muscle component of this complex entity is however underappreciated. The reason why sarcopenia is under-diagnosed is, among others, associated with low awareness of this problem. Screening tests are not widely popular or used in the geriatric population. When the approach to this commonly neglected health issue has been changed it may prolong independence of the elderly through preventive actions including nutritional supplementation, as well as appropriate physical exercises [27, 28]. It can also be mentioned that increased risk of falls and pathological fractures, as well as impaired functionality associated with sarcopenia, increases healthcare costs, which could be reduced by appropriate prevention.
Criteria for sarcopenia. Criteria for sarcopenia have been evaluated by a number of working groups, including the International Working Group on Sarcopenia of the International Academy on Nutrition and Aging (IANA); the European Working Group on Sarcopenia in Older People (EWGSOP); the Asian Working Group for Sarcopenia (AWGS); and the Foundation for the National Institutes of Health (FNIH) Sarcopenia Project. However, the methodology and cut-off points are slightly different [29]. Reviewing these issues we searched the PubMed electronic database and also used the Google search engine for the main search terms: sarcopenia, bioimpedance, densitometry, lean mass, fat free mass, appendicular muscle mass, and acronyms commonly used in this field such as DEXA, DXA, BIA, ALM, SMI. The European EWGSOP criteria published in 2010 include at first low mass of the skeletal muscles in relation to a reference young health population, and additionally, either reduced muscle strength and/or reduced overall physical performance. When only a criterion of low muscle mass is met but without compromising strength and physical performance pre-sarcopenia is diagnosed. A decrease in muscle mass and meeting one of the other two criteria characterize sarcopenia. Meeting all three conditions indicates severe sarcopenia (Table I) [30]. However, in a more recent, large FNIH sarcopenia project which included 26 625 patients, evidence-based criteria were determined [31].
Table I
| Parameter | Pre-sarcopenia | Sarcopenia | Severe sarcopenia |
|---|---|---|---|
| Decreased skeletal muscle mass | X | X | X |
| Decreased muscle strength | – | Present one of those two criteria | X |
| Impaired physical performance | X | X |
Assessment of muscle mass. According to EWGSOP, reliable, gold standard methods for assessing muscle mass include computed tomography (CT) and magnetic resonance imaging (MRI). The use of these relatively expensive tools that can be as burdening as the CT scan is not always clinically appropriate. Regarding minimally invasive features, easy access and affordable cost, preferred alternative methods have been designated. Whole-body dual-energy X-ray absorptiometry (DEXA, DXA), also called dual photon absorptiometry (DPA), and bioimpedance analysis (BIA) are both cost-effective and sufficiently accurate [22]. The analysis of the body contents in whole body densitometry (DXA) is carried out by the same instruments which are routinely used for bone mineral density measurement in diagnostic tests for osteoporosis [32]. The effective dose of radiation in a protocol with the analysis of whole body composition is extremely small and is in the approximate range of 0.001–0.008 mSv (1–8 µSv) depending on the equipment and applied mode. For comparison, the effective dose of exposure during one chest X-ray is 0.08–0.1 mSv (80–100 µSv) [33–35].
Whole body densitometry uses a three-component model, but as it is based on dual energy X-ray absorptiometry, it analyzes two components at the same time. They relate either to the content of bone minerals and soft tissues including muscles, or the content of fat and fat free mass also including muscles, when there is no bone along the beam path. The appendicular muscle mass is estimated to be equal to the lean mass of the extremities without bone minerals, whereas the total muscle mass is extrapolated from the weight of the extremities using empirical formulas [36, 37]. There is some confusion in the definition of the lean mass. According to some sources, the bone mineral content is included in the lean mass, while others treat it separately. The results of the whole body composition analysis by DXA include the summary parameter as “lean + BMC” indicating that the lean mass (LM) and bone mineral content (BMC) are separate entities. However, the separate lean mass also can be assessed and should be listed in the report [38].
In turn, bioimpedance analysis is based on a two-compartment model of fat mass and fat free mass, including both muscle mass and bone mineral content. A number of empirical equations to estimate fat free mass based on growth, body weight, resistance and reactance derived from BIA have been developed [39]. One of them has been validated against reference values for a multiethnic population of 5225 healthy adult men and women aged 15–98 years [40]. The results of the body content analysis by BIA correlated well with body composition estimated in MRI. In the studied group of 2735 men and 2490 women the maximum values of the lean body mass (fat free mass) attributable to the age range of 35–44 years for men and 45–54 years for women have been determined by bioimpedance analysis. A decrease of 8.9 kg (14.8%) in men over 85 years of age and about 6.2 kg (14.3%) in women relative to the maximum values has been observed. The fat mass content was, however, increasing with age. Predictive models in bioimpedance analysis have been developed for specific reference groups, hence their dependence on the ethnic group and age should be considered while choosing adequate equations. Those factors affect estimated muscle parameters; therefore DXA seems to be a more universal method for the body content analysis [41].
There are limited reports on the assessment of the lean body mass and evaluation of progression of sarcopenia with ultrasonography. The analysis carried out in a group of 20 people aged 43.4 ±20.9 years showed improvement in the correlation between BMI and an indicator of the appendicular lean mass index after taking into account ultrasound morphometric parameters. Moreover, muscles’ echogenicity correlated better with their strength than muscle mass [42]. A meta-analysis on the use of ultrasonography to evaluate peripheral skeletal muscles consisted of seven studies, involving a total of 300 critically ill patients. Although the reference values are not available for such studies, usefulness of assessing the cross-section of the quadriceps, the thickness of the muscle tissue or even its echogenicity was demonstrated [43]. Ultrasonography is a non-invasive tool with potential; however, due to the operator’s subjectivity and lack of standardization, it still cannot be as competitive as recognized reference methods [44].
Parameters for assessing muscle mass. A key issue in the assessment of muscle mass during classification of patients with sarcopenia is to define parameters correlated with muscle mass, and to determine reference ranges and universal cut-off values, independent of a variable individual body structure. The skeletal muscles of the extremities play a special role in maintaining mobility, and thus specified criteria and reference ranges refer to such muscles. However, one cannot forget about the role of the respiratory muscles that determine the overall patient’s efficiency. Nevertheless, there is a lack of standard methodology to assess such parameters, despite the fact that it is possible to use a peak flow meter to estimate the respiratory muscle strength [45]. Fat free mass (FFM) of the extremities estimated by DXA refers to the appendicular lean mass (ALM) but apart from the fat free soft tissue (FFST) of the extremities it includes bone mineral content (BMC) as well. The total lean body mass includes the weight of all body parts except for the fat, and thus it is simply fat free mass. However, in the literature one can also see that exclusion of the bone minerals from the lean mass and terminology are both inconsistent (Figure 1). The appendicular skeletal muscle mass does not include bone minerals and represents around 38.7% of the fat free body mass [46]. The appendicular skeletal muscle mass should be denoted as ASMM, although this abbreviation appears rarely and ASM is preferred [47, 48]. There is some ambiguity with regard to the meaning of the ‘lean’ and muscle mass, also in the context of the mass of extremities. Appendicular skeletal muscle (ASM) is often used interchangeably instead of appendicular lean mass (ALM). These values are not exactly the same; however, they are similar, if the bone mineral is not included and the skin mass is disregarded. Regardless of the terminology, one should remember that variables are proportional and that measured values should be interpreted with regard to their correct references. A derivative parameter to assess sarcopenia, which normalizes the muscle content with regard to the individual body type, is the appendicular lean mass index; it is expressed as the ratio of the lean skeletal muscle of the extremities and square of the height (ALM[kg]/(height[m])2), analogously to the body mass index (weight[kg])/(height[m])2). The acronym ALMI for the appendicular lean mass index is not used, and an equivalent, relative appendicular skeletal muscle mass (RASM), appears instead in the literature. This parameter exactly indicates the appendicular lean mass, rather than the absolute mass of the extremity muscles [25]. The appendicular skeletal muscle mass index (ASMI) that normalizes the appendicular skeletal muscle mass (ASM) to the square of the height ([kg]/[m])2) was also defined. This variable should be precisely indicated by ASMMI, although the abbreviation SMI is commonly used.
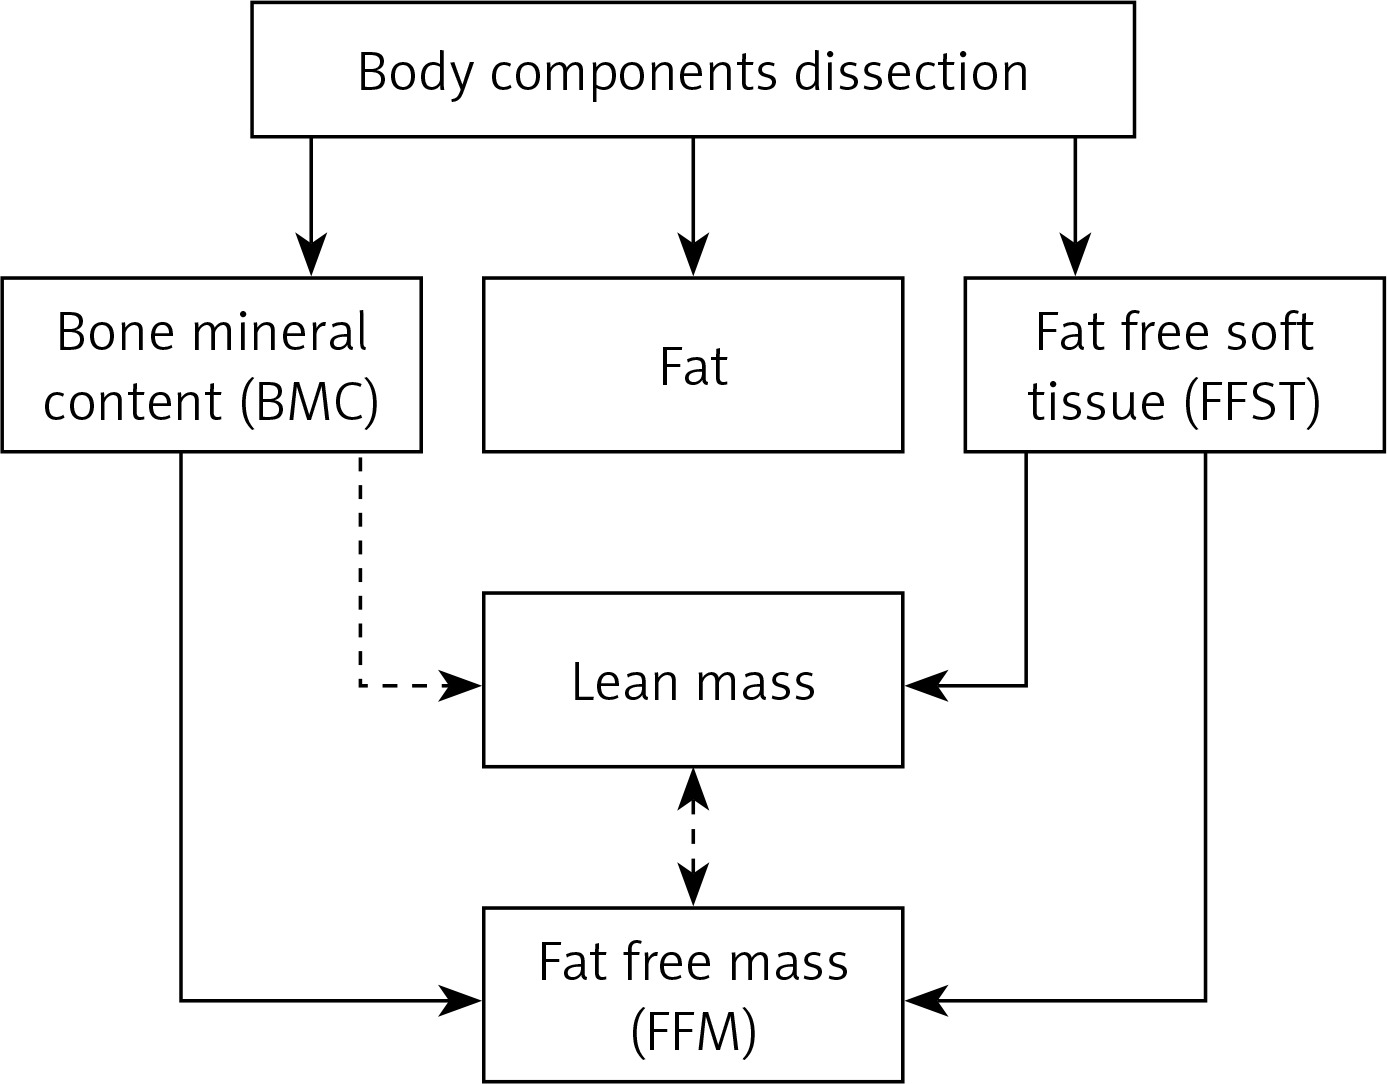
Figure 1
Body components dissected in dual X-ray absorptiometry (DEXA). There are some disagreements about whether or not to include the bone mineral in the lean mass (the dotted line). Thus, the lean mass may not be equivalent to the fat free mass (FFM), depending on the assumption
The abbreviation SMI is not unequivocal and may be misleading as there is also the term of skeletal mass to body mass ratio i.e. the muscle mass normalized to the total body weight, sometimes referred to as the skeletal muscle percentage index, but usually referred to by the same acronym SMI [49]. Inconsistencies in terminology substantially were enhacitated in the work published in Scientific Reports (nature.com) in which the simple distinction has been made for clarification of skeletal muscle index (SMI). The derivative adjusted to the square of the height was denoted as hSMI and a variable adjusted to the total body weight was denoted as wSMI [50]. Unfortunately, such clarification rarely appears in the literature, and authors normally refer to the SMI as a variable normalized by the square of the height but not weight, by default. In the present study, the cut-off point for the low muscle mass was defined as 7.40 kg/m2 (for hSMI) and 35.7 % of the body weight (for wSMI) for men and 5.14 kg/m2 (hSMI) and 30.7 % (wSMI) for women. A very important conclusion from the study was that the hSMI value correlated better with the hand grip strength and with more functions assessed as a derivative of the muscle strength (e.g. cardiopulmonary endurance) than wSMI, so this parameter is currently recommended in order to evaluate sarcopenia. Nevertheless, a debate over the choice of the most suitable parameter describing the correct muscle mass is still ongoing, and an attempt of standardization is a pending challenge. Clarification of correlations between different parameters relating to the criterion of the reduced muscle mass in sarcopenia was outlined (Figure 2).
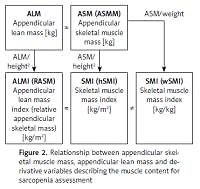
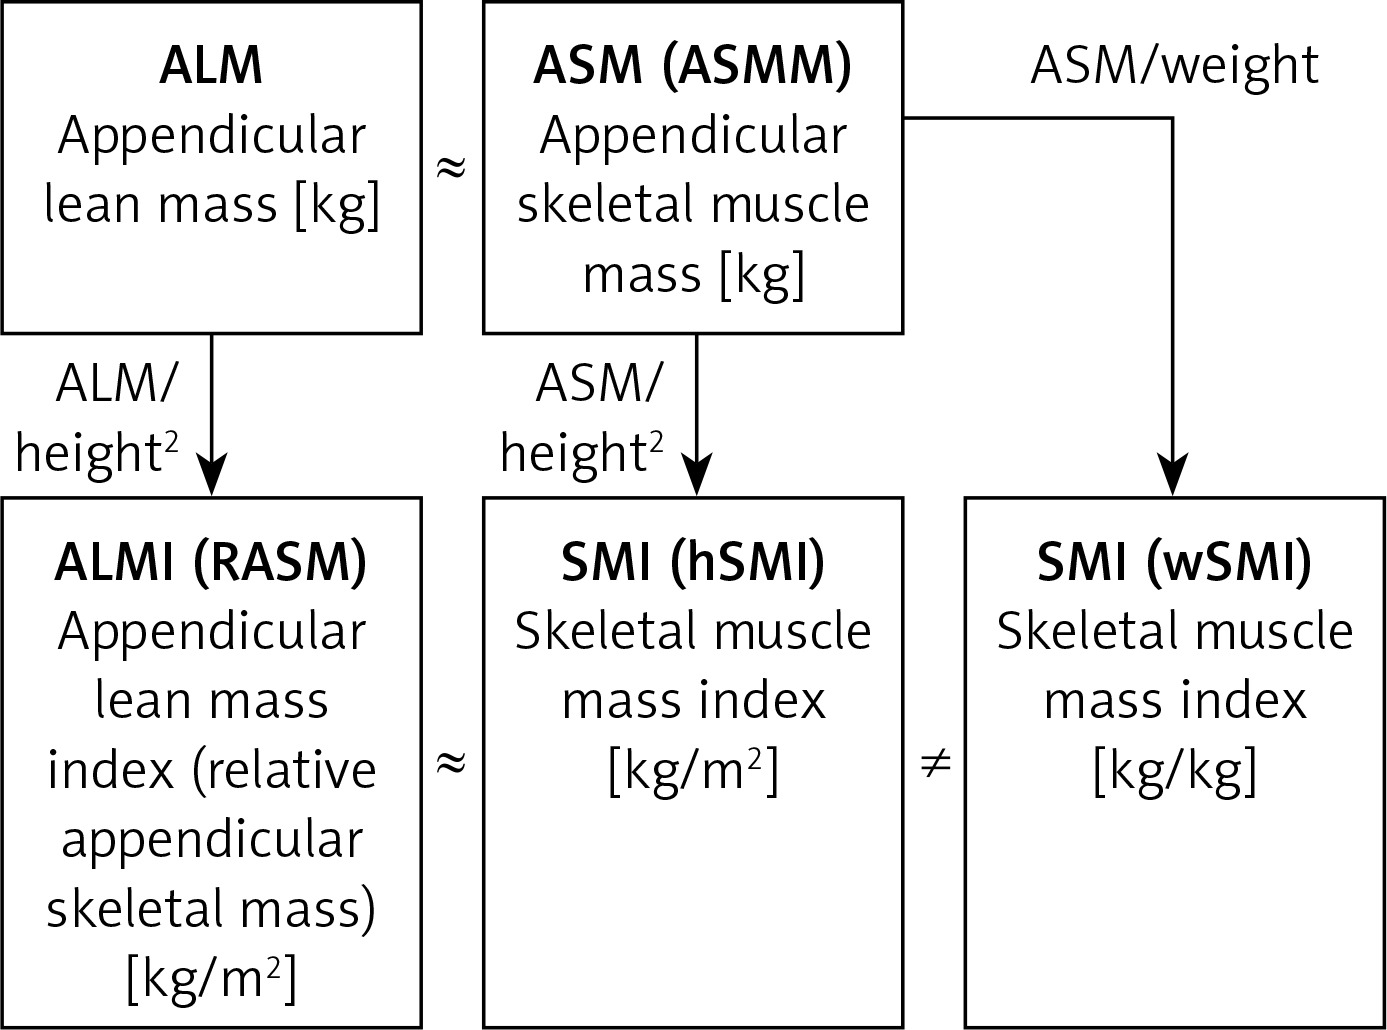
Figure 2
Relationship between appendicular skeletal muscle mass, appendicular lean mass and derivative variables describing the muscle content for sarcopenia assessment
Cut-off values for the criterion of a decrease in muscle mass. According to the EWGSOP recommendations a cut-off point for the main criterion of sarcopenia determining a reduction in muscle mass is a value of ALM (RASM) below two standard deviations (2SD) from the mean for the reference group of young women or men in the corresponding population [51]. For comparison, regarding a more widely known phenomenon of osteopenia and osteoporosis, the assessment of the bone mineral density assumes the cut-off at –1.0 < T-score < –2.5 for osteopenia and T-score < –2.5 for osteoporosis, when the T-score means deviation from the mean bone mineral density for a young adult population, estimated separately for both sexes [52]. There is also classification of sarcopenia severity regarding the extent of a muscle mass decrease. The ALM values in the range of 0 SD – 1 SD, 1 SD – 2 SD, and a decrease greater than 2 SD mean increasing stages of sarcopenia. In the case of a muscle mass assessment by dual X-ray absorptiometry the cut-off value referring to the skeletal muscle mass index was 7.23–7.26 kg/m2 for men and 5.50–5.67 kg/m2 for women, and referred to the mean of the reference group diminished by two standard deviations [30]. The authors recommend the use of reference values for a young age group representing a particular ethnic population [53]. The reference range and cut-off points for the criterion of reduced muscle mass were also developed with regard to specific ethnicity of the Polish population. The mean appendicular lean mass estimated on the basis of a bioimpedance analysis for a population of 1113 young people in Poland was 8.64 ±0.66 kg/m2 for men (n = 465), and the cut-off point that defines low lean mass (LLM) as a decrease from the mean greater than two standard deviations (–2SD) was 7.29–7.32 kg/m2 for men. For young adult women (n = 648), the mean ALM was 6.55 ±0.59 kg/m2, and the cut-off point defining low muscle mass (LMM) had a value of 5.37 kg/m2 [54]. Defined cut-off points for low skeletal muscle mass in the Polish population were practically consistent with the values given by EWGSOP. The authors noted, however, that the cut-off point determining LMM in women was different for the population with normal BMI compared to that calculated for all women. It was slightly higher and was 5.52 kg/m2, while no significant differences were observed for men when those two variables were compared.
Interestingly, the authors of the FNIH project have noted that body weight correction is relevant in women, but not in men. It appears to have a strong modifying effect on the impact of lean mass on gait slowness in women [31].
It should also be mentioned that EWGSOP has recognized the assessment of anthropometric parameters, e.g. arm and calf circumference or skinfold thickness, as unreliable due to a high error rate. These parameters, however, correlate with physical performance, determine a general patient’s condition, but due to interindividual variability regarding the body fat, its distribution and different skin elasticity it is impossible to assess the muscle tissue content reliably [55]. Nonetheless, it is not reasonable to omit these simple parameters showing an approximate nutritional status in the overall clinical evaluation. Apart from physical parameters describing muscle content, new biomarkers corresponding to degree of muscle atrophy could be mentioned here, but deserve a separate paper. For example, the irisin representing myokines secreted by the muscles is considered as a potential biomarker for muscle dysfunction that could help predict the onset of sarcopenia [56].
Parameters for assessing muscle strength. A recognized tool to measure muscle strength is an electronic dynamometer recording the maximum hand grip strength. Preserving muscle strength and functions of the extremities is crucial for elderly patients in order to maintain their self-care. Hand grip strength was considered to be a representative parameter in this context; however, it does not necessarily correlate with the efficiency of the overall complex physical performance. A cut-off point indicating weakening of the hand grip strength that meets a criterion of sarcopenia is based on the data from the InCHIANTI study, and it was defined as a decrease in this strength below two standard deviations from the mean for young adults, depending on the sex. The cut-off point recognized by EWGSOP for hand grip strength is less than 30 kg for men and less than 20 kg for women [30]. However, according to the FNIH Sarcopenia Project stricter cut-off points of 26 kg in men and 16 kg in women identified the best individuals with mobility impairment at the age equal to or above 65 years [57]. In addition, a data analysis regarding 9897 men and 10950 women allowed hand grip strength of 26–32 kg to be classified as average and under 26 kg as weak, for men. In women, hand grip strength of 16–20 kg was classified as average and less than 16 kg as weak [58].
Evaluation of complex physical performance. According to the EWGSOP recommendations physical performance may be evaluated by a gait speed assessment or by more complex tests. The threshold for a significant decrease in the overall physical performance was determined as lower than 0.8 m/s. Alternatively, in the Short Physical Performance Battery test (SPPB) the cut-off point was set to below 8 points. The test estimates three categories of efficiency, i.e. maintaining balance, gait speed and time of getting up from a chair. These activities represent a complex function of the musculoskeletal system involving multiple muscle groups. The SPPB test correlated well with mobility evaluated in the elderly. The most sensitive section of the test was the measurement of gait speed [59]. Cut-off values for the SPPB test should be referred to the appropriate reference population. In this study, they even depended on the economic status of participants [60, 61]. Alternatively, the geriatric Timed Up and Go Test has also become popular in Poland and it similarly evaluates complex physical performance, including gait speed [62]. The basic measures that comply with the EWGSOP sarcopenia criteria have been summarized together with their cut-off points (Table II).
Table II
Short view on general cut-off points that are criteria of sarcopenia. A particular low muscle mass (LMM) cut-off point for the Polish population was shown
| Low muscle mass (LMM) | Decreased muscle strength | Decreased physical performance | ||
|---|---|---|---|---|
| ALM [kg/m2] | F < 5.50–5.67 M < 7.23–7.26 | Hand grip strength [kg] | F < 20*(16)** M < 30*(26)** | Gait speed < 0.8 m/s SPPB < 8 points |
In conclusion, while the importance of osteoporosis diagnosis and treatment has been well established in the social consciousness and guidelines, sarcopenia remains an underestimated issue. Factors influencing the dynamics of weight and muscle function loss may be modified, slowing the rate of physical performance deterioration. These factors include improvement of the nutritional status and appropriate physical training. Adequate prevention is achievable if a problem has been identified and early screening has been performed. A debate on the methodology of sarcopenia assessment is still ongoing. It is a priority to elucidate this essential elderly-related phenomenon to a wider medical community outside the narrow group of geriatricians. We believe that clarification of some ambiguities in terminology and misunderstanding in methodology is crucial for better communication and a further discussion on the selection of universal parameters that classify sarcopenia the best.