Depressive disorder is a serious, widely diagnosed disease with an inflammatory mechanism [1] and often coexists with infectious diseases [2]. As in another inflammatory-related disease [3], increased concentrations of “pivotal cytokines”, including interleukin (IL)-1β, IL-6, tumour necrosis factor (TNF)-α, and interferon (IFN)-γ, have been confirmed [1]. Other cytokines and molecules have been less studied in the aetiology of depressive disorder but warrant exploration due to interactions with the signalling pathways of pivotal cytokines.
Interleukin-18 may be one of the cytokines of potential interest in the mechanism of depression for its involvement in “pivotal cytokine” signalling. IL-18 in some conditions has the ability to induce IFN-γ secretion that subsequently induces secretion of TNF-α. IL-18 is also responsible for the synthesis of IL-6 and influences cell adhesion molecule levels [4]. Another cytokine possibly involved in processes related to depressive disorder is anti-inflammatory transforming growth factor (TGF)-β, which also interacts with pivotal cytokines [5]. Pro-inflammatory IL-1β and IL-6 have an effect on TGF-β signalling, and IL-1β has an early effect on TGF-β and IL-6 via nuclear factor κB-related inhibition through delayed sensitization [6].
Cytokines possessing chemotactic activity can participate in depression occurrence. One of the chemokines affected by pivotal cytokines is RANTES. For example, IL-1β and TNF-α have been found to induce RANTES gene expression and protein production [7]. Pivotal cytokines, with their pleiotropic effects, influence vascular process-related molecules such as intercellular adhesion molecule-1 (ICAM-1) [8].
A link also exists between pivotal cytokine and fibrinolytic system factors. Diagnostic potential of soluble urokinase plasminogen activator (suPAR) in correlation with IL-1β, IL-6, and TNF-α has been observed [9].
When choosing a panel of proteins, we selected proteins that are involved in the inflammatory-related mechanism of depressive disorder and are described as being governed by pivotal cytokines. We also consider these molecules to be involved in brain abnormalities related to depressive disorder. Peripheral IL-18 is negatively associated with abnormal brain activity in depressive disorder patients [10]. IL-18 deficiency may result in the development of hippocampal abnormalities and depressive-like behaviour [11]. An association between TGF-β concentration and cognitive deficits related to depressive disorder and a relationship between TGF-β concentration and hippocampal structure related to memory performance have been observed [12, 13]. Vascular process-related molecules such as ICAM-1 are worth investigating in depressive disorder due to the vascular hypothesis of depression development [14] and increased expression of ICAM-1 in the prefrontal cortex of depressive patients [15]. An animal model study by Lin et al. [16] found that stress-mediated dysregulation of RANTES, also known as CCL5, and the CCR5 axis induces abnormal phagocytosis, disrupts neurotransmission and increases stress susceptibility, a known cause of depressive disorder [17]. To explain the mechanism of suPAR, we emphasize the role of fibrinolytic system molecules in neurogenesis and synaptic plasticity, in which disturbances are observed in depression [18].
The scope of the present study was to assess the concentrations of IL-18, TGF-β, RANTES, ICAM-1 and suPAR in patients with rDD and controls, and the main aim was to assess the potential involvement of the investigated molecules in depression risk and assess their clinical usefulness in the discrimination of depressive patients from control patients.
Similarly as in our previous study [19], a total of 127 patients were included in the study. Blood samples were taken from 73 patients (39; 53.4% women vs. 34; 46.6% men) diagnosed with recurrent depressive disorder (rDD) and 54 (29; 53.7% women vs. 25; 46.3% men) control patients without the diagnosis of rDD. The patients were included in the study according to the ICD-10 criteria [20]. Patients suffering from other psychiatric diseases, including axis I and II disorders, did not participate in the study. Exclusion criteria also included presence of severe or chronic diseases with inflammatory or autoimmune mechanism. All participants gave informed consent. The Bioethical Committee of the Medical University of Lodz approved the study (approval no. RNN/110/10/KE). The study protocol was carried out based on the principles of the Declaration of Helsinki.
The measurement of investigated molecules IL-18, TFG-β, ICAM-1 RANTES and suPAR was performed in serum using enzyme-linked immunosorbent assay (ELISA – R&D Systems, Inc. MIN USA). Experiments were performed and results were calculated according to the manufacturer’s protocol.
Statistical analysis was conducted using Statistica 13.1. The value of p = 0.05 was set as the level of significance. The normality of the distributions of the variables was estimated with the Shapiro-Wilk test. Numerical variables were presented as median (first quartile – Q1, third quartile – Q3). The Mann-Whitney U test was used to assess the differences between two independent groups The independence of two categorical variables was examined with the Pearson χ2 test. Spearman’s rank correlation coefficient (rho) was used to examine the relationship between two variables. To assess the relationship between the presence of rDD and investigated biomarkers, binomial logistic regression analysis was used. The discriminative role of the fitted model was presented using a receiver operating characteristic (ROC) curve and the area under the curve (AUC) was calculated. For the goodness-of-fit test for the logistic regression the Hosmer-Lemeshow test was performed.
Statistical analysis revealed that in terms of gender, both groups have a similar distribution. Pearson’s χ2 test confirmed that there was no significant difference in gender between the groups (p = 0.975). Regarding age, the median ages of the control and rDD groups were 48.5 (44–53) and 49 (46–52) years, respectively. The clinical data of patients are as follows: number of depressive episodes 2 (1–4); 1.5 (−3); number of hospitalizations 1 (1–2); duration of the disease in years 2 (1–6); HDRS (Hamilton Depression Rating Scale (HDRS)) at the beginning of hospitalization 24 (20–28).
The distribution of examined biomarkers IL-18, TGF-β, RANTES, ICAM-1 and uPAR by group are presented in Table I. We noted significant differences in all measures between control patients and rDD patients, with p values less than 0.001.
Table I
Distribution of analysed molecules by group
| Characteristic | Control group n = 54 | rDD group n = 73 | Statistical analysis P-value2 |
|---|---|---|---|
| IL-18 [pg/ml] | 142.62 (123.45–167.37)1 | 282.23 (202.98–401.22) | < 0.001 |
| TGF-β [pg/ml] | 98.15 (89.45–112.38) | 197.80 (179.80–273.40) | < 0.001 |
| ICAM-1 [ng/ml] | 112.61 (102.39–122.63) | 265.78 (203.43–342.67) | < 0.001 |
| RANTES [ng/ml] | 33.06 (22.93–46.38) | 79.44 (67.87–95.66) | < 0.001 |
| uPAR [ng/ml] | 1.72 (1.52–1.93) | 2.36 (2.17–2.87) | < 0.001 |
The investigation of the relationship between the protein and clinical value yielded substantial findings. RANTES displayed a correlation with the number of episodes (r = 0.28, p = 0.02), and suPAR serum levels displayed a correlation with the HDRS baseline value (r = 0.308, p = 0.03). There was no significant correlation between the concentrations of IL-18, TGF-β, and ICAM-1 and the number of episodes and HDRS baseline values. No significant correlations were found among the levels of all studied molecules, number of hospitalizations, or duration of the disease in years.
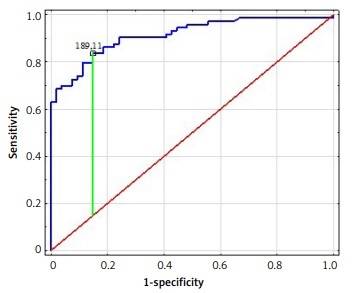
The logistic regression models presented aimed to investigate the effects of different proteins on the incidence of rDD. Table II presents the results of the matching with individual proteins. The binary logistic regression analysis showed that increases in IL-18, TGF-β, RANTES, ICAM-1 and suPAR determined the risk of rDD. The AUC values for each protein and the results of the Hosmer-Lemeshow test can be found in Table II with the graphical presentation in Figure 1. Based on data in Table II, all proteins showed an excellent discrimination fit.
Figure 1
ROC analysis of IL-18 (A), TGF-β (B), RANTES (C), ICAM-1 (D), suPAR (E) protein concentrations for distinguishing patients with depressive disorder from healthy controls
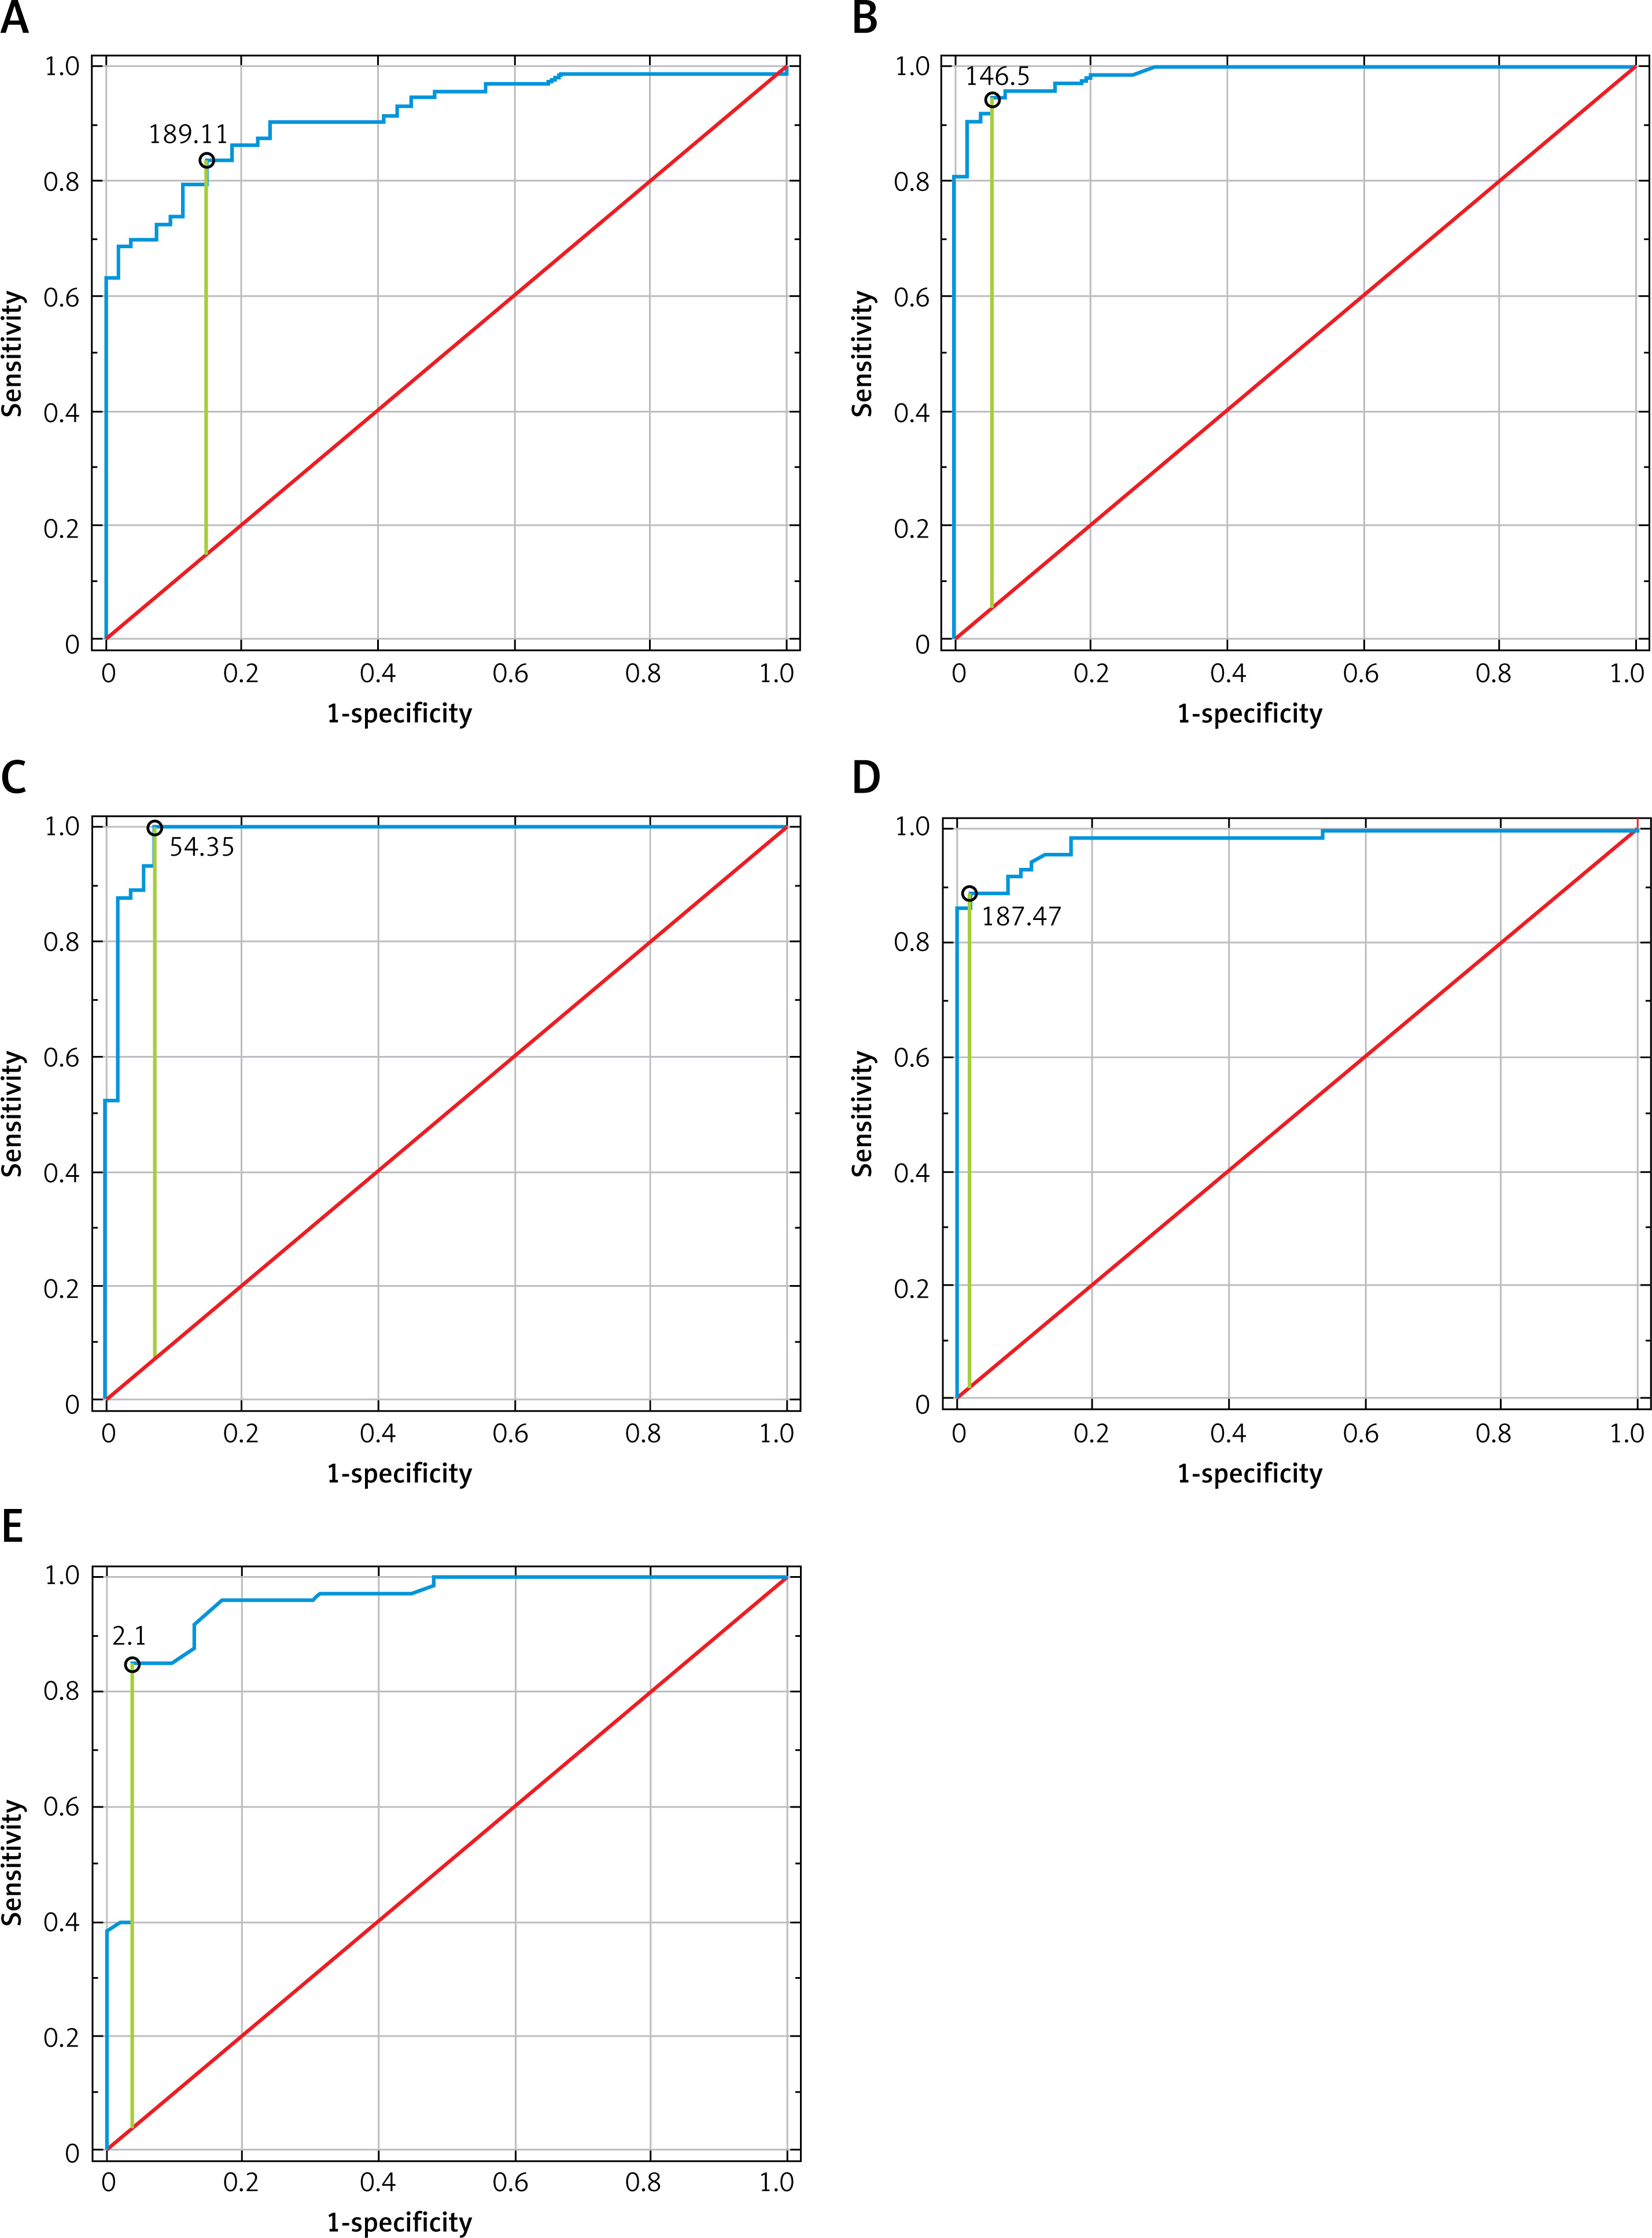
Table II
Logistic regression and ROC curve analysis for examined parameters
Due to the diversity of therapies (different antidepressants and different doses), we were not able to compare the exact levels of the examined molecules stratified according to the antidepressant used within the rDD group. We compared the levels of the proteins after treatment with selective serotonin reuptake inhibitors (SSRIs) and other therapies (mirtazapine, quetiapine, mianserin, venlafaxine, trazodone, agomelatine, and doxepin). The results revealed no significant differences except for in the RANTES concentration. The data are presented in Table III.
Table III
Distribution of analyzed molecules by the rDD groups
| Variable | rDD patients treated with SSRI n = 39 | rDD patients treated with other antidepressants n = 34 | Statistical analysis P-value2 |
|---|---|---|---|
| IL-18 [pg/ml] | 272.43 (180.35–328.42)1 | 351.53 (218.21–418.75) | 0.064 |
| TGF-β [pg/ml] | 196.7 (172.3–273.4) | 199.3 (184.9–283.10) | 0.45 |
| RANTES [ng/ml] | 92.78 (84.35–113.56) | 66.66 (60.71–72.03) | < 0.0001 |
| ICAM-1 [ng/ml] | 265.48 (197.56–342.67) | 266.56 (230.68–345.22) | 0.53 |
| suPAR [ng/ml] | 2.44 (2.19–3.03) | 2.3 (2.14–2.78) | 0.36 |
Our study aimed to examine whether a combined set of proteins with potential roles in depressive disorder mechanisms could be included in a wider set of proteins that act as biomarkers for depressive disorder. Moreover, we also sought to determine the processes involved in the development of the disease and further differentiate between depressive patients and control patients via these potential biomarker proteins. With respect to the pleiotropic action of the examined proteins, constructing a profile of proteins involved in the mechanism of depressive disorder may further improve diagnostic and therapeutic strategies by developing novel molecule-affecting signals related to depression-associated proteins. There is evidence that the inhibition of even one molecule or signalling pathway may reduce the pathological processes of the disease in some cases.
In this study, we indicatively combined the representative or key factors involved in the mechanism of development of depressive disorder.
Kokai et al. [21] suggested that measurements of peripheral levels of IL-18 can importantly participate as a marker of immunity in psychiatric disorders. Our results revealed that patients with rDD had significantly higher IL-18 levels than controls. According to Tian et al. [22], higher peripheral levels of IL-18 may contribute to cognitive deficits in depressive patients.
Measurement of TGF-β concentrations can be a clinically useful approach. Similar to our results, the study by Davami et al. [23] presented higher concentration of TGFβ in depression compared to controls. A preclinical study by Białek et al. [24] confirmed an association between TGF-β gene expression and methylation in depressive disorder. The findings of the current study are that the serum ICAM-1 concentrations were significantly lower in controls than in patients. To date, relationship between depressive disorder and the levels of ICAM-1 have been rarely investigated [25]. The upregulation of plasma adhesion molecules, including ICAM-1, and the possible role of vascular pathology in depression development were suggested by Waldman et al. [26]. Changes in the concentrations of ICAM-1 have been used as potential biomarkers in distinguishing antidepressant non-responders from responders [27]. RANTES and uPAR were evaluated in this study as a continuation and enlargement of the analysis of our previous results [28, 29], and the results were confirmed. When comparing depressive disorder patients and control patients a significant increase in the concentration of both molecules was found in patients suffering from depression. In addition, in this study, both molecules were found to correlate with clinical data. The RANTES data have been confirmed. In addition, circulating levels of RANTES were found to be a risk factor for depressive disorder by Wang et al. [30]. Recent studies have found that a higher level of suPAR is associated with depressive disorder risk [31] and a better response to treatment [32].
To explore the possible concentrations of IL-18, TGF-β, RANTES ICAM-1, and uPAR as useful diagnostic markers of rDD, ROC analysis was performed. To our knowledge, this is the first such study. All investigated molecules met the conditions of an AUC value > 0.7 – a clinical value for screening. To be a clinically helpful biomarker for the correct diagnosis and classification of a disorder, at least 80% sensitivity and specificity must be provided. In our study, the specificity and sensitivity were above 80%. The obtained ROC curve analysis significantly discriminated patients with rDD from those without rDD, indicating that these molecules may play a role as biomarkers for the diagnosis of depressive disorder.
Limitations. Firstly, we included only a few serum molecules. Because depressive disorder is multifactorial, a more comprehensive selection would be helpful to make a diagnostic panel with higher effectiveness. Moreover, estimation of mRNA expression would add value to the study. Secondly, the sample size was relatively small. Studies using more participants are needed to further explore the results. Patients were undergoing medication treatment, which may have affected the protein levels, but this aspect may need further examination comparing the levels between the different types of therapy and evaluating the differences. One of the exclusion criteria was known inflammatory diseases, but markers of inflammation, such as C-reactive protein, were not examined. We realize that further examination with more inclusion/exclusion criteria potentially affecting the concentration of protein measured needs to be considered.
In conclusion, this study found that the serum levels of a set of five markers – IL-18, TGF-β, ICAM-1, RANTES, and uPAR – differed significantly in patients with rDD compared to controls. According to the obtained data, the examined molecules are involved in processes related to development of depression. These five serum molecules assisted in distinguishing rDD patients from healthy controls. The differential expression of these molecules suggests their potential role in the pathophysiology of rDD and they also could serve as possible predictive markers and/or markers of therapeutic efficiency. These findings may improve the accuracy of the diagnosis and direct patients earlier to an effective therapeutic regimen.