Introduction
Osteoporosis is a systemic skeletal disorder characterized by diminished bone mass and the deterioration of bone microarchitecture, resulting in bone fragility and fracture susceptibility [1–3]. The condition is highly prevalent in middle-aged and older populations, showing a higher incidence in women [4]. Fractures, particularly of the hip and lumbar spine, are the most common complication of osteoporosis. Globally, 8.9 million cases of osteoporosis-related fractures are reported annually [5], the majority of which necessitate surgical interventions such as hemiarthroplasty, total arthroplasty, open reduction and internal fixation, and vertebroplasty [6, 7]. These fractures impose significant economic and healthcare burdens on individuals and governments.
Minimizing perioperative hemorrhage is of paramount importance to ensure procedural efficacy and improve therapeutic outcomes [8]. Despite the widespread use of tranexamic acid, controlling bleeding remains a challenge in surgery [9]. Therefore, the factors affecting perioperative bleeding require further research. A previous study [10] reported that higher bone mineral density (BMD) was associated with less bleeding during total hip arthroplasty. The amount of bleeding during an operation is largely determined by the coagulation function. Hence, coagulation function is hypothesized to be associated with bone turnover or mass.
Prothrombin time (PT) and the international normalized ratio (INR) are the most common coagulation tests, providing an assessment of the extrinsic coagulation pathway [11]. Conversely, activated partial thromboplastin time (APTT) measures the activity of the intrinsic coagulation pathways [12]. Fibrinogen is a soluble glycoprotein that plays a crucial role in platelet aggregation and interactions with various plasma proteins, participating in the blood clotting response to tissue injury [13]. Moreover, D-dimer is a highly sensitive marker of intravascular blood clots and hypercoagulability and is associated with both arterial and venous thrombotic events [14]. Collectively, fibrinogen, APTT, TT, PT, and INR provide a comprehensive assessment of patients’ coagulation status [15]. Additionally, platelet (PLT) activation and aggregation play an essential role in hemostasis and thrombosis [16]. These parameters were measured as coagulation biomarkers in this study. Consequently, this study aimed to evaluate the relationship between bone turnover markers (BTMs), BMD, and coagulation biomarkers.
Material and methods
Patients
The study was approved by the Ethics Committee and written informed consent was waived (2023-KLS-223-01). A total of 306 eligible patients from our hospital were enrolled between January 2020 and December 2021. All diagnoses were established according to the World Health Organization’s criteria for osteoporosis [17]. The exclusion criteria were as follows: estimated creatine clearance < 60 ml/min, diabetes, dyslipidemia, tumors, hepatitis virus infection, fractures within the past year, age < 50 years, and body mass index (BMI) > 36.0 kg/m2. Additionally, none of the patients had a history of prior bone-active medication or treatments that could impact bone mineral metabolism (such as steroids, diuretics, thyroid hormones, anticonvulsant drugs, and lithium) or coagulation. Furthermore, no patient reported a history of secondary osteoporosis.
Laboratory examination
The markers in this study were measured following established protocols [18, 19]. Patients were fasted for a minimum period of 8 h, and blood samples were collected from the cubital vein. The obtained venous blood serum was analyzed using a fully automated biochemical instrument. All BTMs were analyzed at a clinical laboratory using a COBAS E601 automated analyzer (Roche Diagnostics, Germany) via the electrochemiluminescence immunoassay method, following the manufacturer’s instructions. In addition, the coagulation biomarkers were all measured at our central coagulation laboratory, using the Sysmex CN-6000 System (Siemens Healthineers, GmbH, Marburg, Germany). All tests were carried out according to the manufacturer’s instructions. The normal range of laboratory test indexes is displayed in Supplementary Table SI.
Evaluation of bone mineral density
Dual-energy X-ray absorptiometry scans were performed to assess BMD in all subjects using the Prodigy Advance system (General Electric Company, Fairfield, CT, USA). These scans evaluated the femoral neck, Ward’s triangle, total hip, and lumbar spine 1 to 4, and were conducted within 2 weeks of the laboratory tests. The acquired scan data were transferred to a computer for detailed analysis, including the determination of bone mineral content. BMD (g/cm2) was calculated based on the bone area and bone mineral content scores, and T-scores were calculated for all measured anatomical regions. The scans were performed by an independent operator who was blinded to the analytical outcomes.
Statistical analysis
All statistical analyses were conducted using SPSS version 25.0 (IBM, Armonk, NY, USA). Data conforming to a normal distribution were compared by an unpaired t-test; otherwise, the nonparametric Mann-Whitney U test was utilized. Normally distributed data were presented as mean ± standard deviation, whereas non-normally distributed data were presented as median and interquartile range. Differences in categorical data were assessed using the χ2 test, and the results are expressed as n (%).
Spearman correlation analysis was employed to assess the correlation between patient information and coagulation evaluation indexes. Additionally, the relationships between patient information (independent variables, X) and coagulation evaluation indexes (dependent variables, Y) were examined using canonical correlation analysis (CCA) [20]. The canonical correlation coefficient represents the maximum possible correlation between linear combinations of variables in the independent variable set X and dependent variable set Y [21]. Consequently, this study focused solely on the first set of canonical correlations. First, significant influencing factors were identified by logistic regression analysis. Subsequently, multivariate logistic regression was conducted to evaluate the factors with p-values < 0.05 in the univariate logistic regression, thereby identifying the variables significantly affecting the outcome. The significance level was set at 0.05, and confidence intervals were reported at the 95% level.
Results
Participant characteristics
The demographics and clinical characteristics of all subjects are listed in Table I. The median age of all participants was 64.0 years, ranging from 50 to 90. The mean BMI was 23.5 (4.0) and ranged from 15.8 to 35.6. The study included 56 male participants and 97 individuals diagnosed with hypertension. Apart from 25-hydroxyvitamin D (25-(OH)D), all laboratory tests, including coagulation biomarkers and BTMs, were within the normal range. The median level of 25-(OH)D was 43.9, with a minimum of 7.0 and a maximum of 144.0. The mean BMD of the entire group of participants exhibited the osteopenia level.
Table I
General demographic and clinical characteristics of subjects
[i] BMI – body mass index, PT – prothrombin time, APTT – activated partial thromboplastin time, INR – international normalized ratio, MPV – mean platelet volume, BTMs – bone turnover markers, β-CTX – β-cross-linked C-terminal telopeptide of type I, 25-(OH)D – 25-hydroxyvitamin D, PINP – procollagen type I N propeptide. BMD – bone mineral density, boldface indicates p-value < 0.05.
Comparison of bone mineral density characteristics
Patients were divided into three groups according to the established osteoporosis diagnostic criteria: 46 cases were assigned to the normal group, 129 cases to the osteopenia group, and 131 cases to the osteoporosis group (Table I). Except for the prevalence of hypertension (p = 0.205), significant differences were observed in age, BMI, and gender among the three groups (all p < 0.001). In terms of coagulation, several indicators demonstrated significant differences among the three groups, including PT, fibrinogen, INR, D-dimer, and PLT (all p < 0.05); in contrast, APTT and MPV showed no significant difference (mean platelet volume, p = 0.772, p = 0.672, respectively). Consistently, procollagen type I N propeptide (PINP, a bone formation biomarker) and β-cross-linked C-terminal telopeptide of type I (β-CTX, a bone resorption biomarker) showed significant differences and increasing trends across the three groups (p = 0.014, p = 0.013, respectively). Furthermore, the levels of 25-(OH)D and osteocalcin exhibited similar patterns across the three groups (p = 0.336, p = 0.088, respectively). However, significant differences in calcium levels were observed among the three groups (p = 0.045). Notably, BMD exhibited significant differences in various anatomical regions among the three groups, including the L1-4 of the lumbar spine, femoral neck, Ward’s triangle, and total hip (all p < 0.001).
Correlation of coagulation biomarkers with BTMs and BMD
Spearman’s rank correlation coefficient values are presented in Table II. Positive correlations were observed between age and bone mass stage with PT, INR, and D-dimer (all p < 0.05). Furthermore, a significant positive association was found between bone mass status and fibrinogen (r = 0.169, p = 0.003). Within the osteopenia group, age was significantly correlated with D-dimer (r = 0.298, p = 0.001, Supplementary Table SII). In the osteoporosis group, age was positively correlated with PT, INR, and D-dimer levels (all p < 0.05, Supplementary Table SII).
Table II
Correlation of coagulation biomarkers with characteristics, bone turnover markers, and bone mineral density
[i] BTMs – bone turnover markers, BMD – bone mineral density, BMI: body mass index, PT – prothrombin time, APTT – activated partial thromboplastin time, INR – international normalized ratio, PLT – platelets, MPV – mean platelet volume, β-CTX – β-cross-linked C-terminal telopeptide of type I, 25-(OH)D – 25-hydroxyvitamin D, PINP – procollagen type I N propeptide. Boldface indicates p-value < 0.05.
In addition, a positive correlation was observed between 25-(OH)D and PT, INR, and PLT within the context of the association between coagulation biomarkers and BTMs (Table II). However, an inverse relationship was found between 25-(OH)D, APTT, and MPV. Moreover, calcium was significantly negatively correlated with PT, APTT, INR, and D-dimer, while it was positively correlated with PLT (all p < 0.05). The relationship between coagulation biomarkers and BTMs in the three groups is presented in Supplementary Table SIII.
Furthermore, the relationship between coagulation biomarkers and BMD was explored, revealing negative correlations between PT, fibrinogen, INR, and D-dimer and BMD at various anatomical sites, including the lumbar spine, femoral neck, Ward’s triangle, and total hip. Importantly, these correlations were statistically significant (all p < 0.05, Table II), except for the association between femoral neck, PT, and INR. Within each group, only the BMD of the total hip in the osteoporosis group displayed a negative correlation with the D-dimer levels (r = –0.207, p = 0.018 < 0.05, Supplementary Table SIV).
Canonical correlation analysis
To identify the most influential factors affecting coagulation, patient information was divided into three categories as independent variables. The patients’ basic characteristics (age, BMI, sex, stage of bone mass, and hypertension) were denoted as X1, the BTMs (β-CTX, 25-(OH)D, PINP, and osteocalcin) were denoted as X2, and BMD at various sites (lumbar spine 1-4, femoral neck, Ward’s triangle, and total hip) was denoted as X3. Three canonical functions were constructed using common coagulation evaluation indices as the dependent variable Y (Figure 1). Finally, the most highly correlated canonical correlation coefficients for the three canonical functions were 0.328 (X1 and Y, p = 0.007), 0.370 (X2 and Y, p < 0.001), and 0.268 (X3 and Y, p = 0.048), respectively (Table III, Supplementary Table SV).
Table III
Canonical correlation analysis of the three sets of variables
| Variables | Canonical correlation coefficient | Wilk’s | F | P-value |
|---|---|---|---|---|
| X1 and Y | 0.328 | 0.822 | 1.694 | 0.007 |
| X2 and Y | 0.370 | 0.717 | 2.917 | < 0.001 |
| X3 and Y | 0.268 | 0.870 | 1.496 | 0.048 |
[i] X1 indicates patients’ basic characteristics (age, body mass index, sex, stage of bone mass, and hypertension). X2 indicates the bone turnover markers (β-cross-linked C-terminal telopeptide of type I, 25-hydroxyvitamin D, procollagen type I N propeptide, osteocalcin, and calcium). X3 indicates bone mineral density in various anatomical regions (lumbar spine 1-4, femoral neck, Ward’s triangle, and total hip). The dependent variable Y indicates coagulation biomarkers (prothrombin time, activated partial thromboplastin time, fibrinogen, international normalized ratio, platelets, and mean platelet volume). Boldface indicates p-value < 0.05.
Figure 1
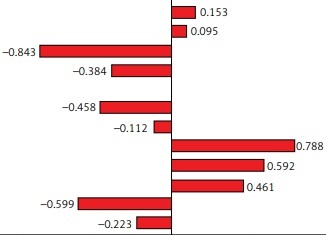
Canonical correlation analysis of patient information and coagulation biomarkers. A – Correlation coefficients between patients’ characteristics and coagulation biomarkers. B – Correlation coefficients between bone turnover markers and coagulation biomarkers. C – Correlation coefficients between bone mineral density and coagulation biomarkers
BMI – body mass index, PT – prothrombin time, APTT – activated partial thromboplastin time, FIB – fibrinogen, INR – international normalized ratio, PLT – platelets, MPV – mean platelet volume, β-CTX – β-cross-linked C-terminal telopeptide of type I, 25-(OH)D – 25-hydroxyvitamin D, PINP – procollagen type I N propeptide.
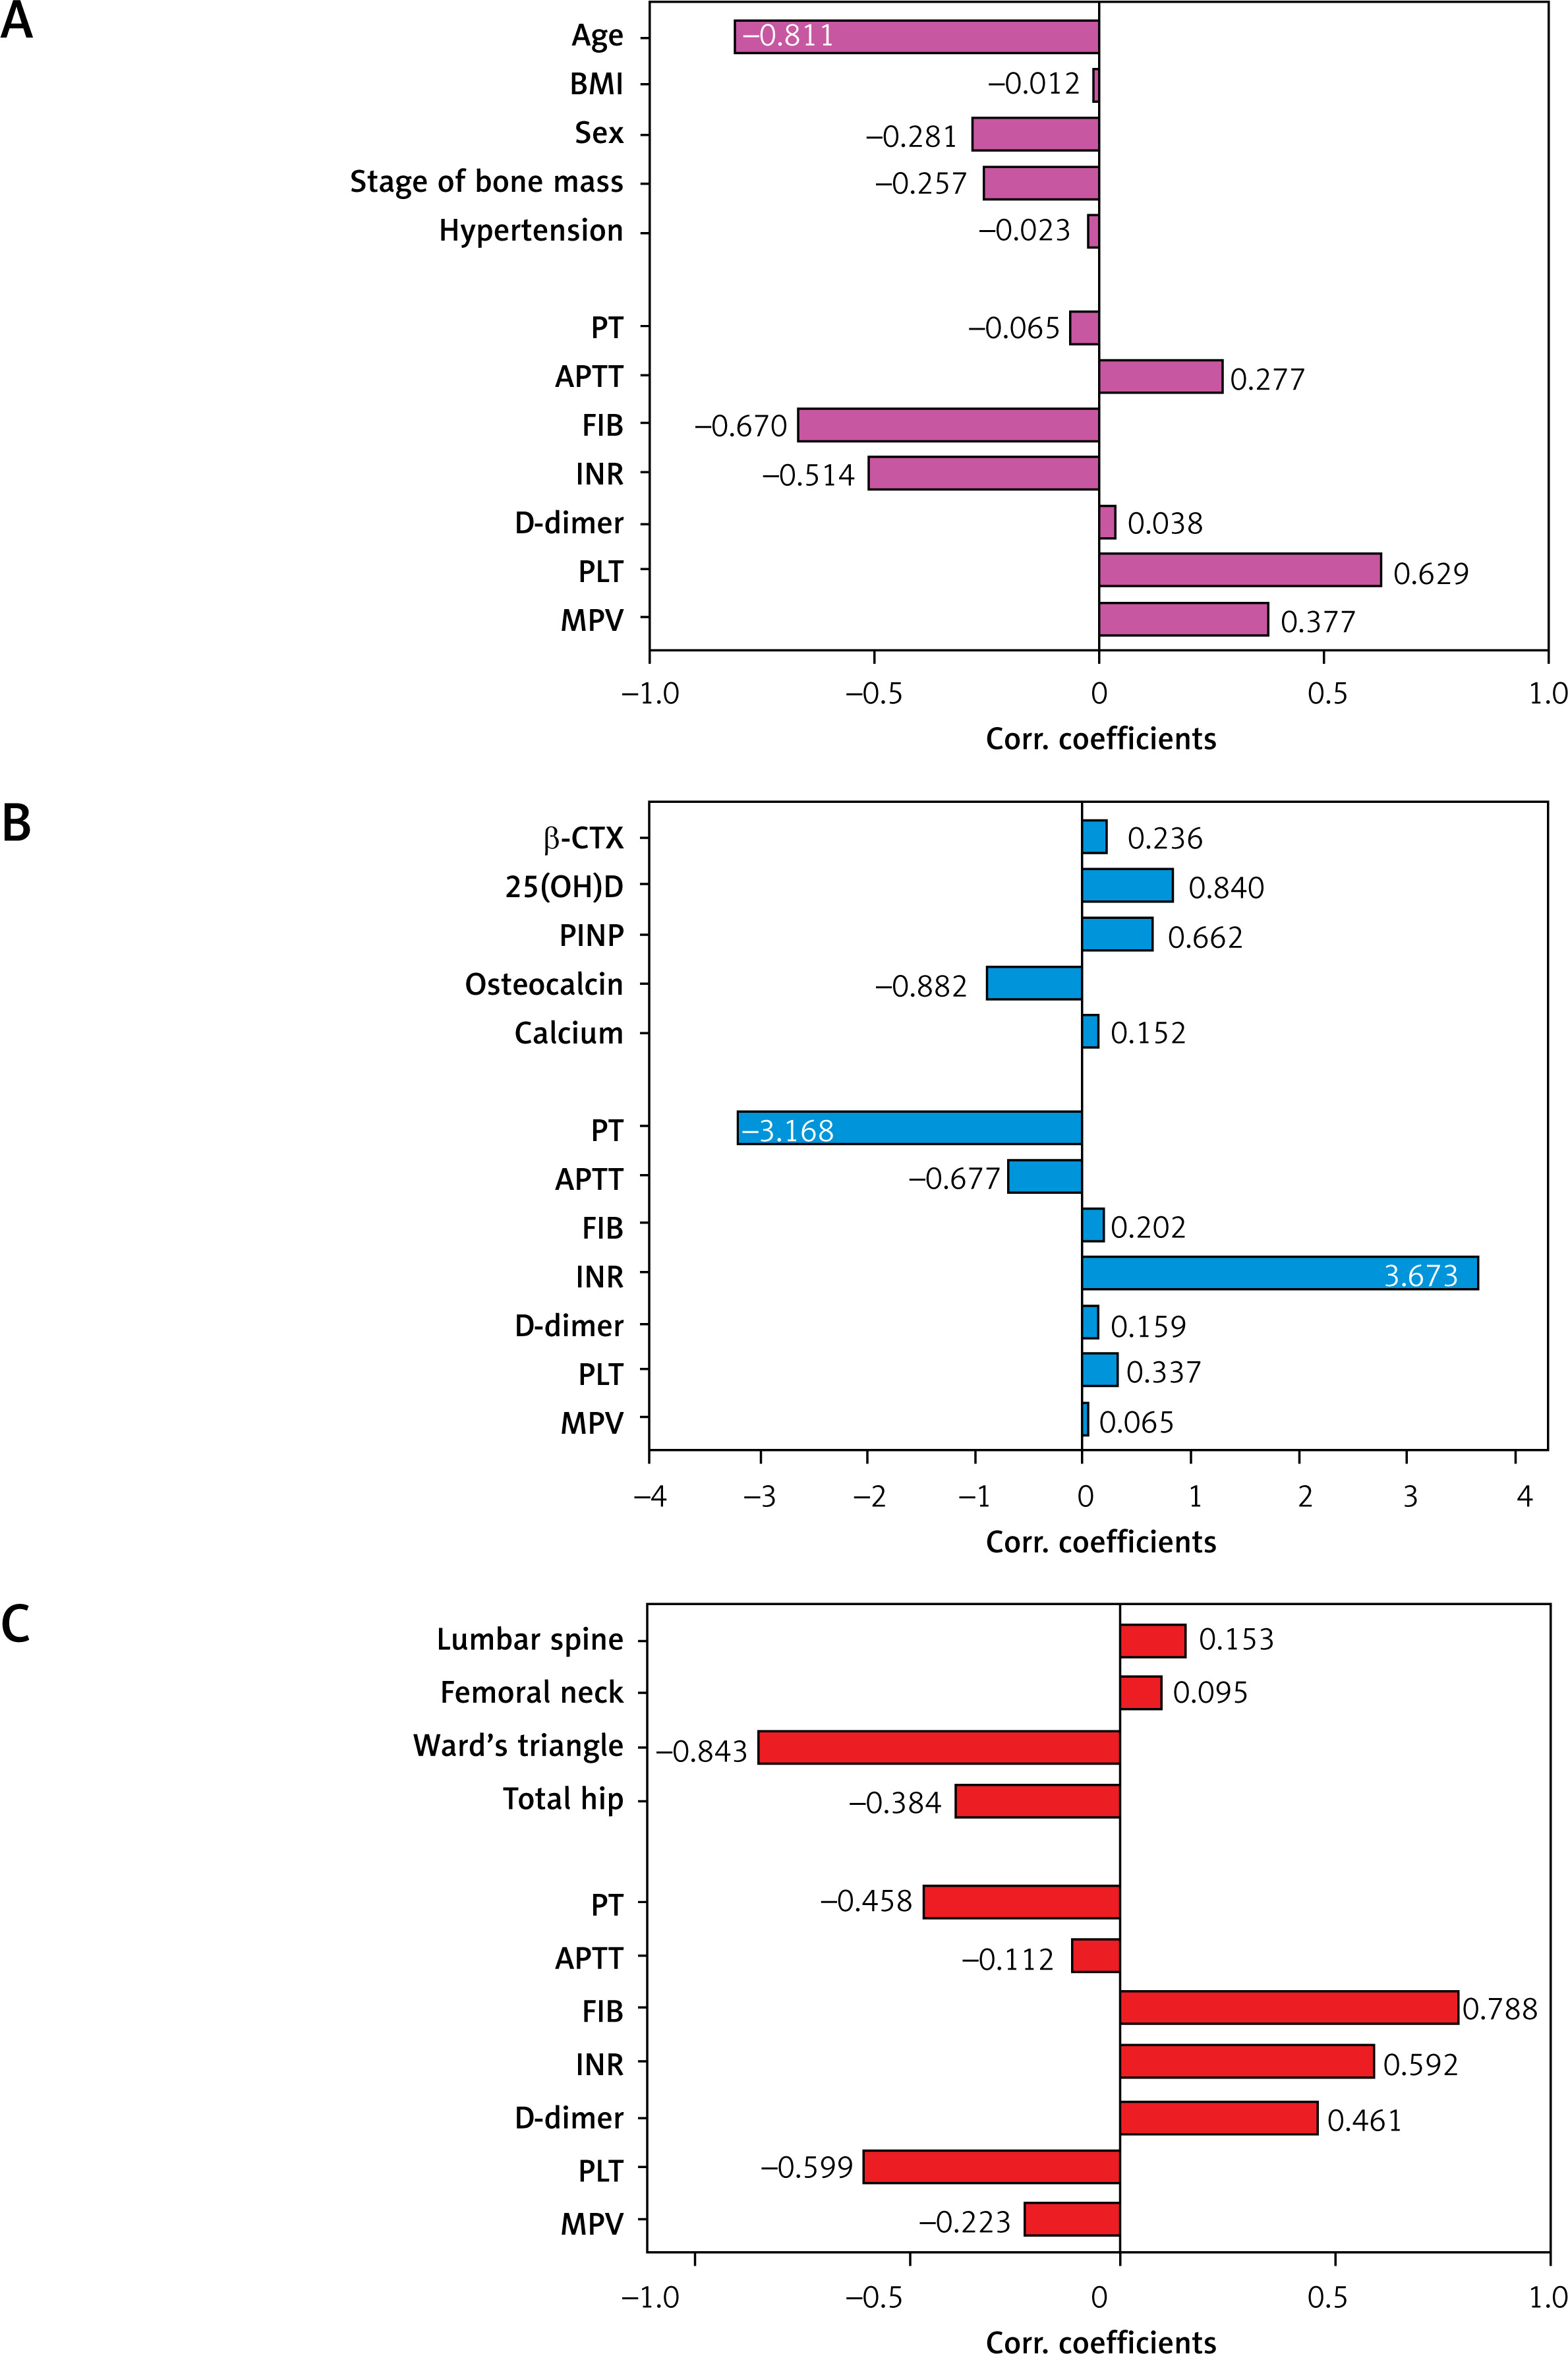
Highly influential variables were selected based on the structural coefficients. The structural coefficients of the three canonical functions are displayed in Figure 1. In the first canonical function, age showed the largest contribution to the canonical variable X1 (r = –0.811), while fibrinogen (r = –0.670) and PLT (r = 0.629) contributed the most to the canonical variable Y. Moreover, the largest contributions to the canonical variable X2 were attributed to osteocalcin and 25-(OH)D (r = –0.882 and 0.840, respectively), and the most relevant contribution of the related canonical variable Y was INR (r = 3.673). The BMD of Ward’s triangle (r = –0.843) was the key factor influencing the canonical variable X3, and fibrinogen (r = 0.788) was the most essential element defining the canonical variable Y in the third canonical function.
Logistic regression analysis of the characteristics, BTMs, BMD, and coagulation biomarkers
Based on the above statistical results, age and stage of bone mass were included as independent variables in X1 for the logistic regression analysis, 25-(OH)D in X2, and all variables in X3. Subsequently, the variables INR, fibrinogen, PLT, and D-dimer were transformed into binary variables based on whether their levels were within the normal range. These binary variables served as the dependent variables in the analysis. The data underwent initial univariate logistic regression analysis (Table IV, Supplementary Tables SVI–VIII). The multivariate analysis of INR, fibrinogen, and PLT did not reveal any significant differences (p > 0.05, Supplementary Tables SVI–VIII). However, the multivariate analysis of D-dimer identified two statistically significant variables, namely age (OR = 1.046, p = 0.007) and the BMD of Ward’s triangle (OR = 0.004, p = 0.017, Table IV).
Table IV
Logistic regression analysis between D-dimer and characteristics, bone turnover markers, and bone mineral density
Discussion
Despite the implementation of various interventions aimed at addressing cardiovascular events, these conditions remain common in individuals of middle and advanced age [22]. Additionally, particular attention should be paid to perioperative thrombosis and bleeding risks in elderly patients undergoing surgical procedures [23]. This study explored the factors affecting blood coagulation in a specific population over 50 years old. The results indicated statistically significant differences in coagulation biomarkers, including PT, fibrinogen, INR, D-dimer, and PLT, among the normal, osteopenia, and osteoporosis groups (all p < 0.05). Given the increased risk of organ dysfunction and mortality in older individuals, bleeding presents a major surgical challenge [24]. Therefore, patients aged over 50 undergoing surgery should be provided with additional measures to optimize perioperative management. Identifying predictors of bleeding may facilitate tailored individual interventions before surgery, enhancing patient safety and reducing the need for blood transfusions [25, 26]. Moreover, individuals with abnormal bone mass should receive additional hematological monitoring in their daily lives to mitigate the risk of spontaneous bleeding or thrombotic events.
Furthermore, correlation coefficient analysis revealed a significant positive correlation between age and bone mass stage with PT, INR, and D-dimer (all p < 0.05). Notably, D-dimer exhibited the most significant positive association with age and the most pronounced negative correlation with Ward’s triangle bone mineral density. Additionally, among the bone metabolism indicators, only 25-(OH)D was related to coagulation biomarkers.
CCA involves the multivariate evaluation of the interaction between two groups of variables, each of which contains multiple variables [27]. This method enables the exploration of complex interactions and the determination of the significance of each variable’s contribution [28]. In this study, a CCA approach was employed to investigate the canonical correlation between seven coagulation indicators (Y) and patient characteristics (X). The study aimed to comprehensively assess patient information, which was categorized into three distinct groups: patients’ fundamental characteristics (X1, five variables), BTMs (X2, five variables), and BMD of various anatomical regions (X3, four variables). Based on the correlation and CCA analysis results, INR, fibrinogen, PLT, and D-dimer were selected as dependent variables, whereas age, stage of bone mass, 25-(OH)D, calcium, and BMD in four anatomical regions were designated as independent variables.
The results of the logistic regression analysis revealed that advanced age significantly influenced D-dimer levels. Generally, the elderly are more susceptible to thromboembolism due to higher coagulation activation and a predisposition to a ‘prethrombotic state’, characterized by elevated coagulation activation peptide levels and a weakened fibrinolytic system [29]. However, despite D-dimer being a widely used marker for various thrombotic conditions, its levels tend to naturally increase with age, particularly in individuals over 80; thus, its diagnostic value is limited to a certain patient population [30, 31]. Therefore, further studies are warranted to determine the potential predictive value of age for thrombosis in the elderly population.
Ward’s triangle refers to a radiolucent area between the principal compressive, secondary compressive, and primary tensile trabeculae in the femoral neck [32]. Typically, this area exhibits the lowest BMD within the femoral head. Interestingly, the findings of our study indicated that a decrease in BMD within Ward’s triangle may be correlated with a reduced risk of thrombosis. After controlling for other variables, no significant link was found between D-dimer levels and BMD in other anatomical regions. Consequently, elderly individuals with osteoporosis may be exposed to a higher risk of spontaneous bleeding. As reported by Zhu et al. [10], increased local bone density was associated with reduced bleeding during surgery. The variability in bleeding may be attributed to the rich intraosseous vascular conditions within Ward’s triangle. Hence, despite the diminished coagulation function observed in individuals with osteoporosis, the extent of bleeding remains limited. However, D-dimer lacks specificity and can be elevated in various disorders [33]. Therefore, additional clinical indicators are required to assess the need for appropriate interventions [34].
Among BTMs, vitamin D is thought to significantly influence vascular physiology via direct effects on endothelial cells and indirect pathways, including endocrine and immunomodulatory mechanisms [35]. Nevertheless, our regression analysis revealed that the 25-(OH)D levels showed no significant effect on the odds ratio of coagulation biomarkers (all p > 0.05), aligning with certain previous studies [36, 37]. The role of vitamin D in cardiovascular disorders remains controversial [38]. Besides, calcium is not only a biomarker of bone metabolism but is also involved in the intrinsic and extrinsic pathways of blood coagulation. Previous epidemiological studies reported an association between calcium levels and vascular risk [39]. The present correlation research also showed that serum calcium was negatively correlated with PT, APTT, and D-dimer, and positively correlated with platelets. These findings supported other research results indicating that an increase in calcium concentration can shorten coagulation time [39, 40]. This may be related to platelets expressing the calcium-sensing receptor, with changes in serum calcium potentially influencing blood coagulability [41]. However, the multivariate regression analysis of this study indicated that calcium and D-dimer showed no statistically significant association with coagulation. Nonetheless, the lack of association might be attributed to the plasma being collected into calcium chelator-containing tubes for laboratory analysis; the samples would be unsuitable for examining the influence of physiological changes in serum calcium on whole-blood coagulation [42]. Therefore, a new method for measuring blood coagulation is required to comprehensively evaluate the coagulation system in natural whole blood, to clarify the relationship between calcium and coagulation.
This study presents the first comprehensive analysis of the relationship between coagulation biomarkers and patient characteristics, BTMs, and BMD. Nevertheless, the limitations of this study should be acknowledged. First, this single-center study employed a retrospective design, potentially introducing confounding factors, selection biases, and disparities. Second, the relatively small sample size could introduce bias into our analysis. Third, our study exclusively involved Chinese subjects, limiting the direct generalizability of our findings to other populations. Therefore, larger, multicenter prospective studies are required to validate the predictive ability of BTMs and BMD for coagulation disorders in individuals over 50 years of age. In addition, considering the inherent complexity of in vivo hemostasis, our exploration of hemostasis via coagulation biomarker measurements only provides an estimation of the relationship. Finally, due to the relatively weak correlations found in this study, and the presence of multiple confounding factors, further high-quality research is needed to confirm the association between bone mass status and coagulation biomarkers.
In conclusion, for the Chinese population aged 50 and above, attention should be paid to changes in coagulation biomarkers.