Introduction
Breast cancer is the most common malignancy reported in females worldwide. It considered as the top reason for cancer mortality among females globally [1]. In 2018, about two million cases of breast cancer in females were expected to be diagnosed worldwide, which accounts for almost one-fourth of all cancer cases among women [2]. Fortunately, several developed countries have experienced a fall in breast cancer morbidity and mortality during the past few decades, which was partly attributable to an increase in breast cancer screening and optimal management [3–5]. However, the incidence rates of this serious disease continue to rise rapidly, especially in countries that had low incidence rates historically [1]. According to the latest Saudi cancer incidence report, breast cancer was classified as the most frequent malignancy reported in Saudi females who were newly diagnosed with cancer in 2015. It accounted for 16.7% and 30.1% of all cancers reported among both genders combined and females at all ages respectively [6]. Although Saudi Arabia has relatively low breast cancer incidence rates at the global level, the available data show that breast cancer incidence rates rise with time among Saudi women [7].
The high burden of breast cancer at the global level inspires extensive literature to explore the risk factors of this disease. Several factors are proved to be commonly linked with an elevated breast cancer risk in women such as factors related to genetics, menstruation, reproduction, exogenous hormone intake, and nutrition [8]. Nevertheless, there are emerging factors thought to contribute to breast cancer risk, such as anthropometry and bone mineral density (BMD) [9, 10]. Prior research suggested a possible link between breast cancer risk and anthropometric measurements such as body mass index (BMI). Although the outcomes from different studies regarding the nature and the magnitude of such risk factor relationships are still controversial, many studies have reported some association and indicated that this association seems to be interrelated with menopausal status and connected with the levels of steroid hormone in the body [9]. Another evolving risk factor is BMD. Numerous studies have shown that high BMD might be associated with higher breast cancer risk, mainly in postmenopausal females due to long-term estrogen exposure. However, this relationship is still inconclusive and needs further investigation [10].
Natural menopause is defined as the time when female menstrual cycles cease permanently (recognized after one year of amenorrhea) due to age-related hormonal changes in the reproductive system. It usually occurs at age 49 to 52 years [11, 12]. Care about women’s health should be started at a young age to minimize health problems at older ages [13]. Women experience several somatic and mental changes at menopause that negatively affect their health status and life quality [14, 15]. Obesity and central obesity are particularly considered as common disturbances associated with menopause [16, 17]. The key cause of weight gain and body composition changes associated with menopause appears to be the quick reduction in body levels of the specific sex hormone estrogen. In the female body, estrogens stimulate fat accumulation in the subcutaneous tissue, mostly in the femoral and gluteal areas. Contrarily, another sex hormone, androgens, stimulate fat accumulation in the abdominal region. Consequently, the relative hyperandrogenemia concurrent with lack of estrogens during menopause contributes to metabolically unfavorable fat redistribution from a gynoid to android site and thus central obesity development [18]. Another health problem associated with menopause in women is bone loss. Reduction in BMD occurs significantly during late perimenopause and occurs at a similar rate during the early postmenopausal years [19, 20]. Besides the effect of declining estrogen levels at menopause, current evidence suggests that bone loss during the menopausal transition could be linked with a rise in serum follicle-stimulating hormone (FSH) through osteoclastogenesis stimulation leading to bone resorption by osteoclasts [21].
Generally, there are differences between premenopausal and postmenopausal women in terms of breast cancer risk factors [22]. Moreover, there are variations in the relationship between the common risk factors and breast cancer occurrence among different ethnicities [23]. Furthermore, most of the existing literature on different aspects of breast cancer risk factors has been mainly reported for populations from developed countries, whereas these data from Saudi Arabia seem either scattered or not made public [7]. Consequently, discovering risk factors associated with breast carcinogenesis among Saudi women will provide guidance for the needed strategies that could potentially reduce the burden of this serious disease. Therefore, the current study objective is to explore relationships between selected anthropometric and BMD parameters and breast cancer risk among Saudi women after stratification of study subjects based on menopausal status. The current study question is whether there any relationships between anthropometric and BMD parameters and breast cancer risk among premenopausal and postmenopausal Saudi women. We hypothesized that anthropometric and BMD parameters could be associated with breast cancer risk among Saudi women. Also, we suppose that this association could differ depending on menopausal status.
Material and methods
Study design and participants
The design of the current study is cross-sectional. In total, 456 women joined the present study between May 2015 and June 2016 from King Saud Medical City (n = 120) and King Fahad Medical City (n = 336) in Riyadh, the capital city of Saudi Arabia. The study subjects were chosen using the method of systematic random sampling from women who visited the surgical clinics to undergo breast cancer screening using mammography. The diagnosis of breast cancer was made by oncologists in the above-mentioned hospitals. The inclusion criteria were: Saudi women aged 20–65 years, not pregnant or lactating at the time of recruitment and who had not been diagnosed with any other malignancy. The recruited subjects had not received any types of therapies before or at the times of recruitment and data collection. The study subjects provided informed written consent in their native language to sign prior to enrollment in line with the Helsinki Declaration. Ethical approval for the study protocol was obtained from the Institutional Review Boards of the King Saud Medical City and the King Fahad Medical City, Riyadh, Saudi Arabia.
Descriptive data collection
Personal interview by administering a specific questionnaire was adopted to collect descriptive data. These data include selected sociodemographic characteristics: age, education level, employment status, and marital status, and selected lifestyle and maternal characteristics: sunlight exposure and tobacco smoking as well as menopausal status and were collected by trained dietitians from the study participants. The frequency of sunlight exposure was defined as exposure to sunlight three times weekly at least. Each time, at least 20% of their body surface area had to be exposed to sunlight directly. Presence or absence of menses throughout the previous year or hysterectomy was used to determine menopause status. Postmenopausal women are those with cessation of menstrual periods for at least twelve consecutive months. Health characteristics of participants were collected from their patient medical records.
Anthropometric measurements
Anthropometric measurements were collected by trained dietitians from the study subjects using standardized methods. Collected anthropometric measurements include body height, body weight, circumferences of waist, hip, and mid-upper arm, skinfold thickness at triceps and body composition (body protein, fat, water, and mineral percentages). The measurement of body height was done with a stadiometer to the nearest 0.1 cm. The measurement of body weight was done with a calibrated weight scale to the nearest 0.1 kg. Body mass index was obtained by dividing weight (kg) by height (m2). Participants were considered obese when BMI was equal to 30 or higher. The measurement of waist, hip, and mid-upper arm circumferences was carried out by non-stretchable measuring tape to the nearest 1 mm. Waist circumference was divided by hip circumference to calculate the waist-hip ratio. Triceps skinfold thickness was measured in duplicate from the left hand with a calibrated skinfold caliper to the nearest 1 mm. Finally, the body composition, including body protein, fat, water, and mineral percentages, was measured using a body fat analyzer (IOI 353, Danilsmc Co., Ltd, South Korea).
Measurement of bone mineral density
Measurement of BMD was done for all study subjects using dual-energy X-ray absorptiometry (DXA) (Lunar Prodigy, GE Healthcare, United States). Dual-energy X-ray absorptiometry scans were performed in the Department of Radiology at the King Saud Medical City and the King Fahad Medical City, Riyadh, Saudi Arabia. Two sites were selected to measure BMD: the right hip and the lumbar spine (L1 to L4). Bone mineral density values of each participant were automatically compared to ideal BMD, and T-score values (standard deviation from the mean for young adults) were given. Consequently, the bone health status was classified based on WHO criteria as follows: normal (BMD T-score is –1.0 or higher), osteopenia (BMD T-score is between –1.0 and –2.5) or osteoporosis (BMD T-score is –2.5 or lower). The bone health status was diagnosed by radiologists.
Statistical analysis
SPSS version 23 was used to complete data analysis. Statistical analysis was carried out after study subjects were stratified based on menopausal status. Categorical variables were given as frequencies (%). The normality of variables was investigated using the Shapiro-Wilk test. The χ2 test was used to analyze them. Continuous variables were given as means (SD). The one-way ANOVA test was used to analyze them. The Tukey post hoc test was used to determine significant differences. Univariate logistic regression analysis was performed to detect the factors which might be related to breast cancer risk. Differences were considered statistically significant when p-values < 0.05.
Results
Four hundred and fifty-six Saudi women (308 premenopausal and 148 postmenopausal) participated in the current study. Selected sociodemographic, lifestyle, maternal and health characteristics of subjects are given in Table I. The average age of premenopausal and postmenopausal subjects was 41.5 (±6.2) years and 51.7 (±5.2) years, respectively. Postmenopausal participants had lived about 4 years on average after menopause. About two-fifths of premenopausal participants (39.9%) and only 14.2% of postmenopausal participants had a college degree at least, whereas the education level did not exceed high school for the rest. Similarly, 42.5% and 15.5% of premenopausal and postmenopausal participants were employed, respectively. In addition, most of the premenopausal (78.2%) and postmenopausal (72.3%) women were married, while the remaining women were unmarried, including single, divorced and widowed women. Frequent sunlight exposure was reported among 73.4% and 70.9% of premenopausal and postmenopausal subjects, respectively. Moreover, tobacco smoking was reported by only 3.9% and 1.4% of premenopausal and postmenopausal subjects respectively. The vast majority of participants have pregnancy and lactation history. Finally, some participants had been diagnosed with certain endocrine diseases, including diabetes, hypothyroidism and hyperthyroidism.
Table I
Sociodemographic, lifestyle, maternal and health characteristics of premenopausal and postmenopausal study subjects
| Variables* | Premenopausal women | Postmenopausal women | ||||
|---|---|---|---|---|---|---|
| Total (n = 308) | No-BC‡ (n = 170) | BC‡ (n = 138) | Total (n = 148) | No-BC (n = 73) | BC (n = 75) | |
| Age [years] | 41.5 (6.2) | 41.1 (6.5) | 41.9 (5.8) | 51.7 (5.2) | 50.5 (5.3) | 52.9 (5.0) |
| Time after menopause [years] | – | – | – | 4.0 (5.0) | 4.0 (5.5) | 4.1 (4.6) |
| Education level, n (%): | ||||||
| High school or less | 185 (60.1) | 95 (55.9) | 90 (65.2) | 127 (85.8) | 58 (79.5) | 69 (92.0) |
| College or more | 123 (39.9) | 75 (44.1) | 48 (34.8) | 21 (14.2) | 15 (20.5) | 6 (8.0) |
| Employment status, n (%): | ||||||
| Employed | 131 (42.5) | 75 (44.1) | 56 (40.6) | 23 (15.5) | 15 (20.5) | 8 (10.7) |
| Unemployed | 177 (57.5) | 95 (55.9) | 82 (59.4) | 125 (84.5) | 58 (79.5) | 67 (89.3) |
| Marital status, n (%): | ||||||
| Married | 241 (78.2) | 126 (74.1) | 115 (83.3) | 107 (72.3) | 46 (63.0) | 61 (81.3) |
| Unmarried | 67 (21.8) | 44 (25.9) | 23 (16.7) | 41 (27.7) | 27 (37.0) | 14 (18.7) |
| Frequent sunlight exposure, n (%): | ||||||
| No | 82 (26.6) | 43 (25.3) | 39 (28.3) | 43 (29.1) | 20 (27.4) | 23 (30.7) |
| Yes | 226 (73.4) | 127 (74.7) | 99 (71.7) | 105 (70.9) | 53 (72.6) | 52 (69.3) |
| Tobacco smoking, n (%): | ||||||
| No | 296 (96.1) | 164 (96.5) | 132 (95.7) | 146 (98.6) | 71 (97.3) | 75 (100) |
| Yes | 12 (3.9) | 6 (3.5) | 6 (4.3) | 2 (1.4) | 2 (2.7) | 0.0 (0.0) |
| Pregnancy history, n (%): | ||||||
| No | 43 (14.0) | 30 (17.6) | 13 (9.4) | 6 (4.1) | 4 (5.5) | 2 (2.7) |
| Yes | 265 (86.0) | 140 (82.4) | 125 (90.6) | 142 (95.9) | 69 (94.5) | 73 (97.3) |
| Parity, n (%): | ||||||
| Nullipara | 46 (14.9) | 31 (18.2) | 15 (10.9) | 7 (4.7) | 5 (6.8) | 2 (2.7) |
| Primipara | 19 (6.2) | 11 (6.5) | 8 (5.8) | 5 (3.4) | 3 (4.1) | 2 (2.7) |
| Multipara | 243 (78.9) | 128 (75.3) | 115 (83.3) | 136 (91.9) | 65 (89.0) | 71 (91.9) |
| Lactation history (6 months at least), n (%): | ||||||
| No | 65 (21.1) | 59 (34.7) | 6 (4.3) | 18 (12.2) | 10 (13.7) | 8 (10.7) |
| Yes | 243 (78.9) | 111 (65.3) | 132 (95.7) | 130 (87.8) | 63 (86.3) | 67 (89.3) |
| Diabetes, n (%): | ||||||
| No | 262 (85.1) | 144 (84.7) | 118 (85.5) | 30 (7.4) | 12 (5.8) | 18 (9.2) |
| Yes | 46 (14.9) | 26 (15.3) | 20 (14.5) | 37 (92.6) | 18 (94.2) | 19 (90.8) |
| Hypothyroidism, n (%): | ||||||
| No | 273 (88.6) | 148 (87.1) | 125 (90.6) | 126 (85.1) | 60 (82.2) | 66 (88.0) |
| Yes | 35 (11.4) | 22 (12.9) | 13 (9.4) | 22 (14.9) | 13 (17.8) | 9 (12.0) |
| Hyperthyroidism, n (%): | ||||||
| No | 301 (97.7) | 167 (98.2) | 134 (97.1) | 147 (99.3) | 73 (100.0) | 74 (98.7) |
| Yes | 7 (2.3) | 3 (1.8) | 4 (2.9) | 1 (0.7) | 0 (0.0) | 1 (1.3) |
An analysis of anthropometric and BMD parameters after stratification according to menopausal status revealed a few differences between patients with breast cancer and cancer-free participants in both premenopausal and postmenopausal women (Tables II and III). For premenopausal women, significant differences were found in waist circumference and triceps skinfold thickness. The mean waist circumference in breast cancer patients (102.2 ±14.0) was significantly higher than that in cancer-free women (98.4 ±16.0, p = 0.029). Similarly, the mean triceps skinfold thickness in women with breast cancer (25.8 ±9.7) was significantly lower than that in cancer-free women (30.6 ±8.3, p = 0.001). For postmenopausal women, a significant difference was only found in triceps skinfold thickness. The mean triceps skinfold thickness in women with breast cancer (23.4 ±10.3) was significantly lower than that in cancer-free women (28.9 ±8.6, p = 0.001).
Table II
Anthropometric and bone health parameters of premenopausal study subjects
| Variables | Total (n = 308) | No-BC‡ (n = 170) | BC‡ (n = 138) | P-value |
|---|---|---|---|---|
| Weight [kg] | 76.8 (16.0) | 75.8 (16.6) | 77.9 (15.3) | 0.261 |
| Height [cm] | 158.1 (9.5) | 158.1 (10.3) | 158.1 (8.5) | 0.981 |
| BMI [kg/m2] | 30.9 (7.2) | 30.7 (7.9) | 31.3 (6.3) | 0.449 |
| Obesity, n (%): | ||||
| No (BMI < 30 kg/m2) | 137 (44.5) | 77 (45.3) | 60 (43.5) | 0.750 |
| Yes (BMI ≥ 30 kg/m2) | 171 (55.5) | 93 (54.7) | 78 (56.5) | |
| Waist circumference [cm] | 100.1 (15.2) | 98.4 (16.0) | 102.2 (14.0) | 0.029 |
| Hip circumference [cm] | 86.9 (32.4) | 88.3 (32.7) | 85.1 (32.0) | 0.380 |
| Waist-hip ratio | 1.32 (0.50) | 1.27 (0.49) | 1.38 (0.50) | 0.069 |
| Triceps skinfold thickness [mm] | 27.9 (9.4) | 25.8 (9.7) | 30.6 (8.3) | 0.001 |
| Mid-upper arm circumference [cm] | 35.9 (9.9) | 35.1 (10.2) | 36.9 (9.5) | 0.102 |
| Body protein (%) | 12.1 (2.3) | 12.2 (2.4) | 12.0 (2.2) | 0.424 |
| Body fat (%) | 36.7 (8.2) | 36.4 (8.4) | 37.1 (8.1) | 0.439 |
| Body water (%) | 45.6 (5.9) | 45.8 (6.0) | 45.3 (5.8) | 0.432 |
| Body mineral (%) | 5.6 (0.2) | 5.6 (0.2) | 5.6 (0.2) | 0.539 |
| BMD T-score (at right hip) | –0.2 (1.0) | –0.3 (1.1) | 0.0 (1.0) | 0.079 |
| BMD T-score (at lumbar spine) | –0.4 (1.1) | –0.5 (1.0) | –0.3 (1.1) | 0.138 |
| Bone health status, n (%): | ||||
| Normal | 197 (64.0) | 107 (62.9) | 90 (65.2) | 0.829 |
| Osteopenia | 101 (32.8) | 58 (34.1) | 43 (31.2) | |
| Osteoporosis | 10 (3.2) | 5 (2.9) | 5 (3.6) | |
Table III
Anthropometric and bone health parameters of postmenopausal study subjects
| Variables | Total (n = 148) | No-BC‡ (n = 73) | BC‡ (n = 75) | P-value |
|---|---|---|---|---|
| Weight [kg] | 77.0 (16.0) | 76.2 (17.1) | 77.7 (15.1) | 0.578 |
| Height [cm] | 156.3 (9.2) | 155.3 (8.3) | 157.3 (10.0) | 0.208 |
| BMI [kg/m2] | 31.7 (7.0) | 31.6 (6.5) | 31.8 (7.5) | 0.873 |
| Obesity, n (%): | ||||
| No (BMI < 30 kg/m2) | 62 (41.9) | 32 (43.8) | 30 (40.0) | 0.636 |
| Yes (BMI ≥ 30 kg/m2) | 86 (58.1) | 41 (56.2) | 45 (60.0) | – |
| Waist circumference [cm] | 103.2 (14.7) | 105.1 (13.3) | 101.5 (15.9) | 0.142 |
| Hip circumference [cm] | 92.0 (33.3) | 93.4 (33.3) | 90.6 (33.5) | 0.606 |
| Waist-hip ratio | 1.28 (0.49) | 1.28 (0.49) | 1.27 (0.49) | 0.915 |
| Triceps skinfold thickness [mm] | 26.2 (9.8) | 23.4 (10.3) | 28.9 (8.6) | 0.001 |
| Mid-upper arm circumference [cm] | 37.6 (11.1) | 37.4 (12.9) | 37.9 (9.0) | 0.795 |
| Body protein (%) | 11.6 (2.2) | 11.6 (1.9) | 11.5 (2.5) | 0.775 |
| Body fat (%) | 38.9 (8.5) | 38.7 (7.1) | 39.1 (9.7) | 0.763 |
| Body water (%) | 44.0 (6.3) | 44.2 (5.3) | 43.8 (7.1) | 0.751 |
| Body mineral (%) | 5.6 (0.3) | 5.6 (0.3) | 5.6 (0.3) | 0.925 |
| BMD T-score (at right hip) | –0.7 (1.0) | –0.8 (1.1) | –0.6 (0.9) | 0.500 |
| BMD T-score (at lumbar spine) | –1.3 (1.3) | –1.2 (1.2) | –1.3 (1.3) | 0.653 |
| Bone health status, n (%): | ||||
| Normal | 44 (29.7) | 26 (35.6) | 18 (24.0) | 0.291 |
| Osteopenia | 81 (54.7) | 36 (49.3) | 45 (60.0) | – |
| Osteoporosis | 23 (15.5) | 11 (15.1) | 12 (16.0) | – |
Two anthropometric measurements were found to be significantly correlated with breast cancer risk in premenopausal subjects (Table IV). Greater waist circumference and greater triceps skinfold thickness were significantly linked with a higher breast cancer risk (odds ratio [OR] = 1.02, p = 0.03 and OR = 1.06, p = 0.001 respectively). A higher waist-hip ratio was correlated with a higher breast cancer risk, but not significantly (OR = 1.53, p = 0.07). In postmenopausal women, triceps skinfold thickness was the only anthropometric measurement that was significantly linked with breast cancer risk. Greater triceps skinfold thickness was found to be significantly correlated with a higher breast cancer risk in postmenopausal subjects (OR = 1.06, p = 0.001; Table V). On the other hand, the used BMD parameters were not significantly linked with breast cancer risk in premenopausal and postmenopausal participants.
Table IV
Risk of breast cancer among premenopausal study subjects for anthropometric and bone health parameters
| Variables | Odds ratio (95% CI) | P-value* | 95% CI for odds ratio | |
|---|---|---|---|---|
| Lower | Upper | |||
| Weight [kg] | 1.01 | 0.26 | 0.99 | 1.02 |
| Height [cm] | 1.00 | 0.981 | 0.98 | 1.02 |
| BMI [kg/m2] | 1.01 | 0.458 | 0.98 | 1.04 |
| Obesity: | ||||
| No (BMI < 30 kg/m2) | 1 | 0.75 | ||
| Yes (BMI ≥ 30 kg/m2) | 1.08 | 0.69 | 1.69 | |
| Waist circumference [cm] | 1.02 | 0.03 | 1.00 | 1.03 |
| Hip circumference [cm] | 1.00 | 0.379 | 0.99 | 1.00 |
| Waist-hip ratio | 1.53 | 0.07 | 0.97 | 2.42 |
| Triceps skinfold thickness [mm] | 1.06 | 0.001 | 1.03 | 1.09 |
| Mid-upper arm circumference [cm] | 1.02 | 0.105 | 1.00 | 1.04 |
| Body protein (%) | 0.96 | 0.423 | 0.87 | 1.06 |
| Body fat (%) | 1.01 | 0.438 | 0.98 | 1.04 |
| Body water (%) | 0.99 | 0.431 | 0.95 | 1.02 |
| Body mineral (%) | 1.41 | 0.541 | 0.47 | 4.19 |
| BMD T-score (total right hip) | 1.22 | 0.08 | 0.98 | 1.52 |
| BMD T-score (lumbar spine) | 1.18 | 0.139 | 0.95 | 1.46 |
| Bone health status: | ||||
| Normal | 1 | 0.83 | ||
| Osteopenia | 0.88 | 0.54 | 1.43 | |
| Osteoporosis | 1.19 | 0.33 | 4.24 | |
Table V
Risk of breast cancer among postmenopausal study subjects for anthropometric and bone health parameters
| Variables | Odds ratio (95% CI) | P-value* | 95% CI for odds ratio | |
|---|---|---|---|---|
| Lower | Upper | |||
| Weight [kg] | 1.01 | 0.576 | 0.99 | 1.03 |
| Height [cm] | 1.02 | 0.210 | 0.99 | 1.06 |
| BMI [kg/m2] | 1.00 | 0.872 | 0.96 | 1.05 |
| Obesity: | ||||
| No (BMI < 30 kg/m2) | 1 | 0.636 | – | – |
| Yes (BMI ≥ 30 kg/m2) | 1.17 | – | 0.61 | 2.25 |
| Waist circumference [cm] | 0.98 | 0.145 | 0.96 | 1.01 |
| Hip circumference [cm] | 1.00 | 0.604 | 0.99 | 1.01 |
| Waist-hip ratio | 0.96 | 0.914 | 0.50 | 1.87 |
| Triceps skinfold thickness [mm] | 1.06 | 0.001 | 1.03 | 1.10 |
| Mid-upper arm circumference [cm] | 1.00 | 0.793 | 0.98 | 1.03 |
| Body protein (%) | 0.98 | 0.774 | 0.84 | 1.14 |
| Body fat (%) | 1.01 | 0.762 | 0.97 | 1.05 |
| Body water (%) | 0.99 | 0.749 | 0.94 | 1.04 |
| Body mineral (%) | 1.05 | 0.924 | 0.36 | 3.06 |
| BMD T-score (total right hip) | 1.12 | 0.497 | 0.81 | 1.55 |
| BMD T-score (lumbar spine) | 0.94 | 0.651 | 0.73 | 1.22 |
| Bone health status: | ||||
| Normal | 1 | 0.294 | – | – |
| Osteopenia | 1.81 | – | 0.86 | 3.80 |
| Osteoporosis | 1.58 | – | 0.57 | 4.35 |
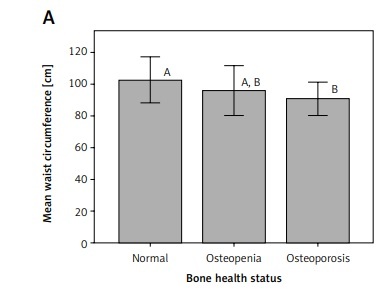
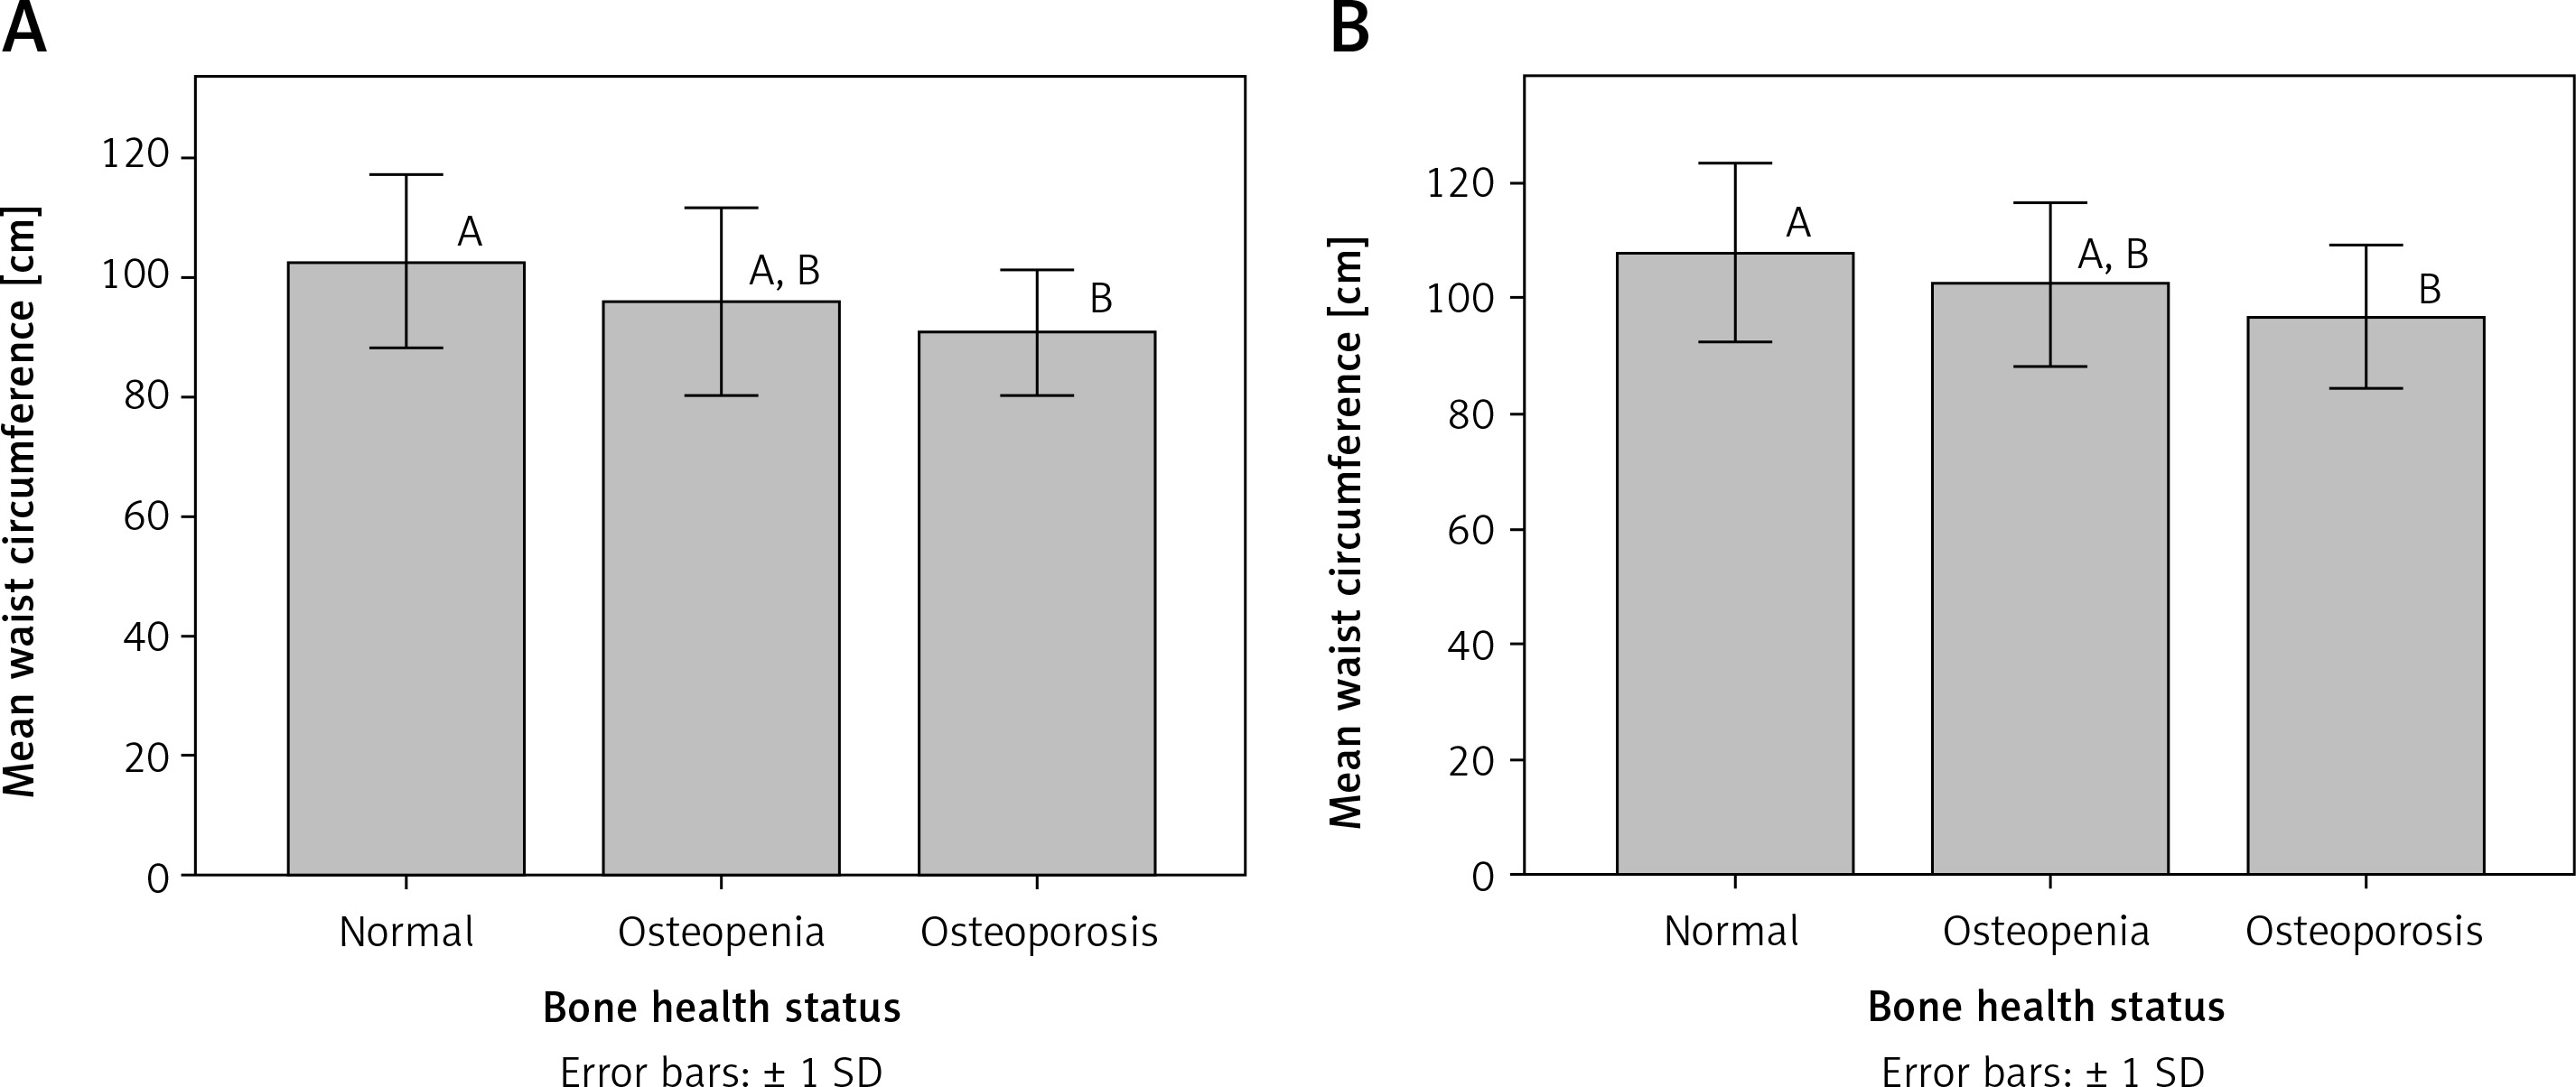
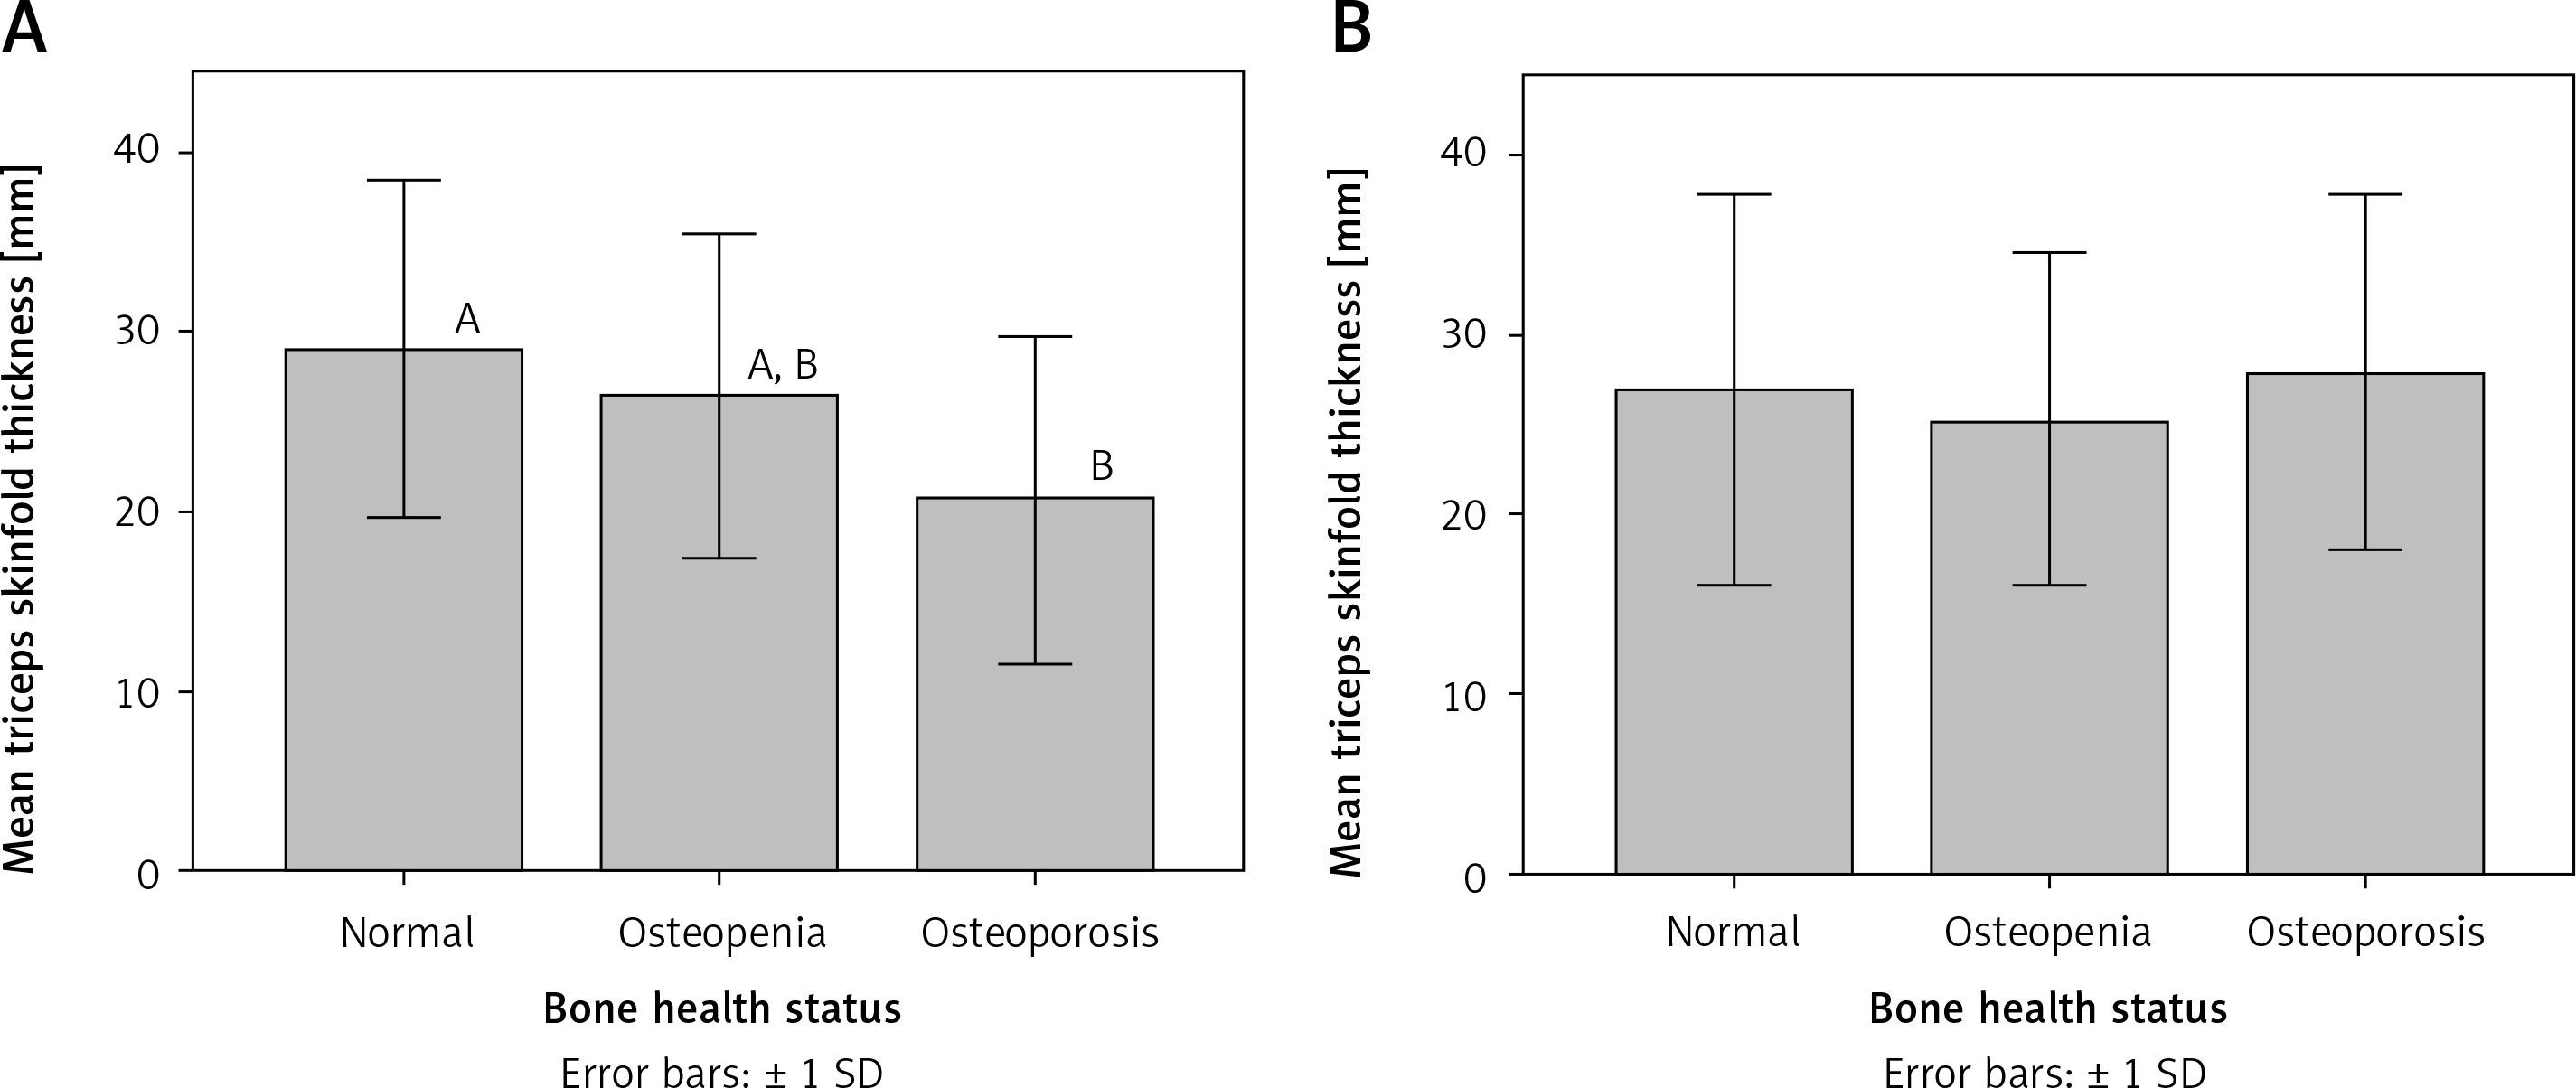
Interestingly, mean waist circumference for osteoporotic patients was significantly different (p < 0.05) from that for participants with normal bone health status in both premenopausal and postmenopausal women (Figure 1). Similarly, mean triceps skinfold thickness for osteoporotic patients was significantly different (p < 0.05) from that for participants with normal bone health status in premenopausal women (Figure 2).
Discussion
There is substantial inconsistency among different studies in results regarding the connection between anthropometry and BMD and breast cancer risk. Furthermore, this association tends to vary depending on certain population characteristics such as ethnicity and menopausal status [9, 10]. Thus, to capture the most sensitive estimation of risk factor association, research effort needs to stratify analyses based on these characteristics. The current study is the first study investigating the possible relationship between anthropometry and BMD and breast cancer risk in Saudi women.
Anthropometry is among the few modifiable breast cancer risk factors. It is considered crucial in breast cancer etiology [9]. However, a connection between anthropometry and breast cancer risk is still debatable in the literature and is influenced by numerous aspects including ethnicity, reproduction, lifestyle, and menopausal status [24]. Obesity generally influences breast cancer incidence by generating metabolic and hormonal abnormalities, especially in persons with abdominal obesity. Abdominal obesity is linked to insulin resistance. Elevation of insulin level inhibits hepatic production of sex hormone-binding globulin, raises levels of leptin, and reduces adiponectin levels. Additionally, insulin modulates vascular endothelial growth factor expression. The combined effect of these substances accelerates cell divisions and induces synthesis of transcriptional factors which lead to promotion of mammary carcinogenesis [25]. Our data did not reveal any correlation between BMI or obesity and the risk of breast cancer among both groups of subjects, conversely to several previous studies [9, 24]. However, the current study revealed a significant correlation between waist circumference and the risk of breast cancer in premenopausal women. A similar finding was reported previously [9]. Contrarily, the impact of waist circumference on breast cancer risk is not observed in our results for postmenopausal subjects, in contrast to several previous studies. This finding might be related to a general tendency in elderly women toward central obesity caused by a disturbance in the level of estrogen, unhealthy dietary habits and sedentary lifestyle [26].
Interestingly, our data revealed that triceps skinfold thickness was significantly linked with breast cancer risk in premenopausal and postmenopausal subjects. Another study reported the same result only in premenopausal women [26]. Skinfold thickness is a measure of subcutaneous fat that is assessed as a prediction of the total amount of body fat. Since adipose tissues have a crucial effect on production of female sex steroid hormones, general obesity caused an elevation in the level of estrogen and androgen. Thus, they act in the breast cells as mitogenic agents which contribute to higher breast cancer risk [27].
Bone mineral density is considered as a crucial parameter used to evaluate the bone quality and to identify people with osteoporosis, a disease that commonly strikes women, particularly after menopause due to greater bone loss caused by lower levels of estrogen [10, 28]. Notably, high BMD is a lifetime marker of continued exposure to estrogen, which controls the turnover of bones through suppressing bone resorption and activating specific hormones that stimulate the formation of bones [29]. Furthermore, elevated BMD values have been reported to be related to a higher breast cancer risk. Nonetheless, this relationship is still uncertain [30]. However, no significant correlation was detected in this study between used BMD parameters and risk of breast cancer in premenopausal and postmenopausal subjects. Similar null findings were also observed in a recent long-term follow-up study on postmenopausal women, and a recent dose-response meta-analysis [31, 32].
Interestingly, BMD may be linked with certain factors such as obesity [33]. During the menopausal transition, estrogen levels drop gradually. This causes a loss of bone mass. The situation might be different among obese women due to higher estrogen exposure, which contributes to down-regulating the resorption of bones by restraint of osteoclasts [29]. Furthermore, in obese women who had breast cancer, the outcome is improved due to a high androgen level, which has positive effects on bone tissue. Androgens’ action takes place through alteration to estrogen by an enzymatic pathway or through direct binding to androgen receptors [34]. Nevertheless, abdominal obesity causes metabolic complications and low-grade inflammation that could lead to a harmful effect on bone health [33]. Overall, all of these connections are still debatable and open areas for further scientific research.
Finally, the present study is limited by the sampling bias given the study design. However, this study still provides valuable information about the relationships between selected anthropometric and BMD parameters and breast cancer risk among premenopausal and postmenopausal Saudi women.
In conclusion, our study revealed that the risk of breast cancer was significantly associated with waist circumference and triceps skinfold thickness in premenopausal women and with only triceps skinfold thickness in postmenopausal women. Moreover, our results do not support any link between BMD and risk of breast cancer. In light of the contradiction in the available data about the connection between body anthropometric and BMD parameters and risk of breast cancer, a large trial is required, which may allow further understanding of these associations and their mechanistic pathways.