Introduction
Hepatocellular carcinoma (HCC) is a kind of clinical common malignant tumour with an insidious onset, which is invasively fast-growing and has a poor prognosis [1]. Although surgical excision was demonstrated to be the first choice for HCC treatment, most HCC is not diagnosed until the advanced stage of the disease, when surgical treatments are not suitable for treating the disease [2]. Therefore, early detection and treatment are key to improving therapeutic outcomes, reducing mortality, and increasing the long-term survival rate in HCC patients.
Alpha-fetoprotein (AFP) was the only widely accepted and applied biomarker in clinical practice because of its practical value for the diagnosis and monitoring of the development of HCC. However, the AFP method experienced insufficient sensitivity and specificity in the early diagnosis of HCC. Meanwhile, the AFP level is also easily affected by other diseases, such as hepatitis during pregnancy and liver regeneration after damage, which increases the inaccuracy of clinical diagnoses [3–5]. There is, therefore, an urgent need to identify new biomarkers with high sensitivity and high specificity for the early diagnosis of HCC.
Proteomics technology platforms are an extremely useful tool for the discovery of new cancer biomarkers. A highly desirable biomarker for cancer screening and monitoring would be a biomarker that can be measured in body fluid samples [6]. Accordingly, blood samples such as serum and plasma have been the ideal targets of proteomics studies aimed at identifying cancer diagnostic and prognostic biomarkers [7, 8]. However, several challenges have hindered the progress of these studies. The main 2 reasons include the complex nature of serum and plasma samples and the large dynamic range between the concentrations of different proteins.
Secreted proteins play important roles in signal transduction, cellular growth, proliferation, differentiation, and apoptosis. They are also important in tumourigenesis, development, invasion, and metastasis of HCC [9]. Therefore, the secretomes of cell lines are also performed during screening. Many researchers have reported the application of secretomes in the screening of diagnostic and prognostic protein biomarkers [10–12]. Essentially, it is well established that any potential biomarker candidates screened from HCC cell lines should be ultimately validated in clinical tissue samples that are closer to tumours than any of the model systems. As a result, it is more direct and convincing to utilise the primary culture of tumour tissues and the proteomic analysis of serum-free conditioned media to search the diagnostic or prognostic biomarkers [13, 14].
We, thus, conducted this study to investigate the molecular signatures of HCC by quantitative proteomics using isobaric tags for relative and absolute quantification (iTRAQ) coupling with liquid chromatography-tandem mass spectrometry (LC-MS/MS).
Material and methods
Sample collection and tissue culture in vitro
In our study, the HCC tissue group, the adjacent noncancerous tissue (AN) group, and the distal noncancerous tissue (DN) group were obtained from 2 primary HCC patients who were diagnosed with HCC by post-operative pathological examinations and subjected to standard radical resection. The fresh tissues were collected at the time of surgery from the HCC patients and immediately washed with phosphate-buffered saline in a sterile environment. Subsequently, the tissues were cut into 2 mm3 pieces, washed several times until the tissues became colourless, and then cultured in a Dulbecco’s modified eagle serum-free medium at 5% CO2 for 24 h. Thereafter, the supernatants were collected for protein extraction. This study was approved by the Ethics Committee of our hospital, and the 2 patients signed informed consent forms.
Protein extraction and digestion
The collected culture supernatant was centrifuged at a low speed (200 g) to remove the cells and tissue debris and then filtered with a 0.22 µm filter membrane to remove the residual cells. Thereafter, the filtrate was concentrated with 3K ultrafiltration until the phenolic red colour was completely removed. The proteins were precipitated by ice-cold acetone, and the protein concentration of the supernatant was determined by bicinchoninic acid assay following the manufacturer’s protocol. Subsequently, 4 µl of a reducing reagent was added to each sample tube and vortex to mix and incubate the tubes at 60°C for 1 h, and 2 µl of a cysteine blocking reagent was added to each tube and vortex to mix and incubate the tubes at room temperature for 10 min. Finally, the proteins were digested by sequence-grade modified trypsin through filter-aided sample preparation.
Isobaric tags for relative and absolute quantification labelling
The peptides from 100 µg proteins per group were labelled according to the Applied Biosystems iTRAQ™ reagent chemistry reference guide. The peptides were labelled as follows: 2 HCC groups were labelled 113 and 114, 2 AN groups were labelled 114 and 115, 2 DN groups were labelled 116 and 117, and the mixed DN group samples with an equal amount were labelled 119 and 121. The labeled peptides were mixed with an equal amount and dried in a vacuum centrifuge for further usage.
High pH reversed-phase separation
The dried peptide mixture was fractionated by high pH separation using ekspertTM ultraLC 100 pump. Mobile phase A: 20 mM ammonium formate in water, mobile phase B: 20 mM ammonium formate in 80% ACN, the pH was adjusted to 10.0 with ammonium hydroxide. High pH (pH = 10) separation was performed using a 65-min linear gradient as follows: 0–5 min, 0–5% B; 5–30 min, 5–15% B; 30–45 min, 15–38% B; 45–46 min, 38–90% B, 46–54.5 min, 90–90% B; 54.5–55 min, 90–5% B; 55–65 min, 5–5% B. Finally, 40 fractions were collected, and 4 fractions with the same time interval were pooled together to reduce the fraction numbers, such as 1, 2 and 21, 22 and 3, 4 and 23, 24, and so on [15]. Ten fractions at the end were dried in a vacuum concentrator for further usage.
The Nano-LC-MS/MS analysis
The fractions were re-suspended with 30 µl solution A (solution A: 0.1% FA and 2% ACN in water) and 8 µl was loaded on an exigent nano LC-UltraTM system nano-LC with a trap column (ChromXP C18-CL-3 µm, 120A, 350 µm × 0.5 µm) with a flow of 2 µl/min. The column flow rate was maintained at 300 nl/min with a 101 min linear gradient as follows: 0–0.1 min, 5–10% B; 0.1–60 min, 10–25% B; 60–85 min, 25–48% B; 85–86 min, 48–80% B, 86–90 min, 80–80% B; 90–91 min, 80–5% B; 91–101 min, 5–5% B (solution B: 0.1% FA and 2% ACN in water). The MS data were collected by the Triple TOF 5600 system. The electrospray voltage of 2.3 kV and 150°C heating at the inlet of the mass spectrometer was used. The resolution was set at 30,000 with the scan range of 300–1500 m/z. The cumulative scanning time was 250 ms in the high-resolution scanning mode, and up to 40 sub-ion scans could be performed each time. Each Fraction was repeated three times with instrumental analysis, and all parent ions were collision-induced dissociation using fluctuating collision energy.
Data analysis
The MS data were processed using ProteinPilot 4.5 (AB SCIX, Foster City, CA, USA) and then searched using Mascot (version 2.2; Matrix Science, London, United Kingdom) search algorithms against the UniProt human database. The enzyme specificity of trypsin was used and up to a maximum of 2 missed cleavages were allowed for protease digestion. Mascot was searched with a parent ion tolerance of 10 parts per million (ppm) and a fragment ion mass tolerance of 0.05 Da. Carbamidomethylation of cysteine, as well as iTRAQ modification of peptide N-terminus and lysine residues, were set as a fixed modification; oxidation of methionine and iTRAQ 8-plex labelling of tyrosine were specified as variable modifications. The proteins were accepted if the protein FDR was < 1%. To identify proteins whose expression was significantly altered in the 2 different groups, a threshold of the iTRAQ ratios were used to define differentially expressed proteins. The proteins were considered to be differentially expressed if the iTRAQ ratio was > 1.5 or < 0.67 in the 2 different groups with the p-value of < 0.05, which were statistically analysed by a paired T-test. The gene ontology (GO) annotation and pathway enrichment analysis of the differentially expressed proteins were carried out using the online tool DAVID (http://david.abcc.ncifcrf.gov/). The gene ontology annotation contains biological processes, cell components, and molecular functions. The pathway analysis was based on the Kyoto Encyclopaedia of Genes and Genomes (KEGG) database. The gene ontology annotations and signalling pathways were ranked in terms of the enrichment or number of the differentially expressed proteins. The protein and protein interaction was performed using the online String database (https://string-db.org/).
Results
The relative quantification of the secretome of the primary hepatocellular carcinoma patients
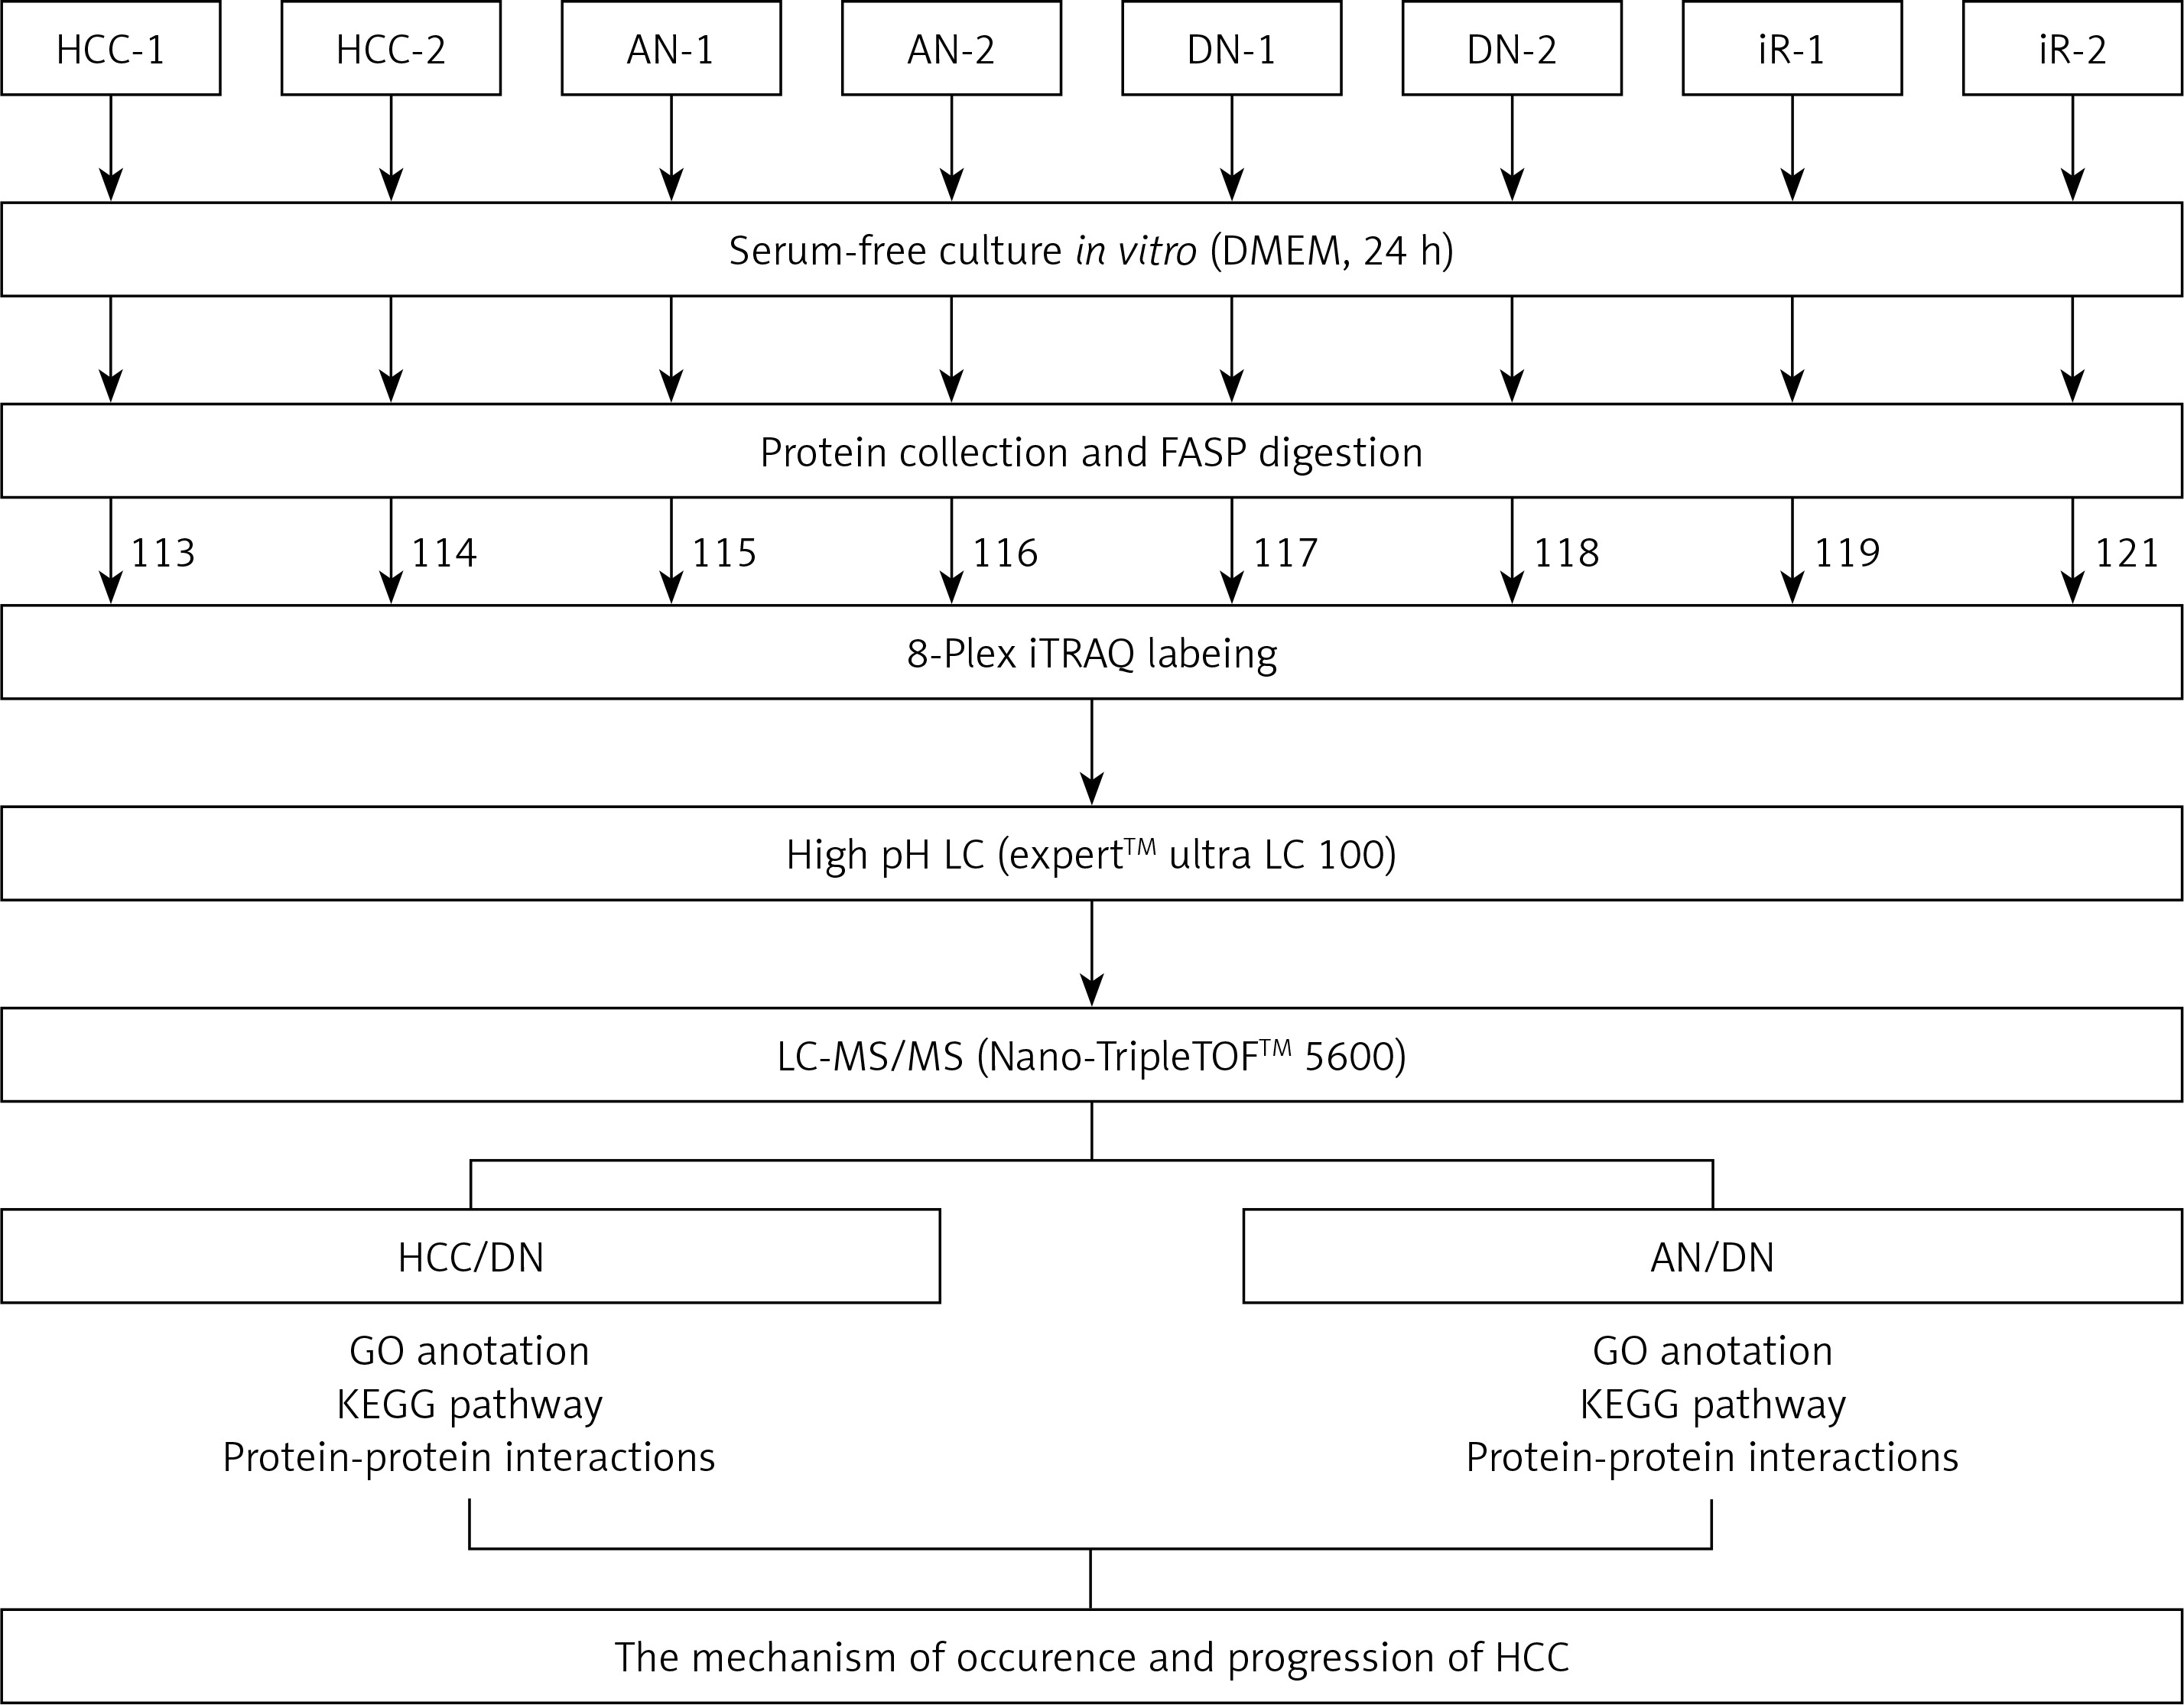
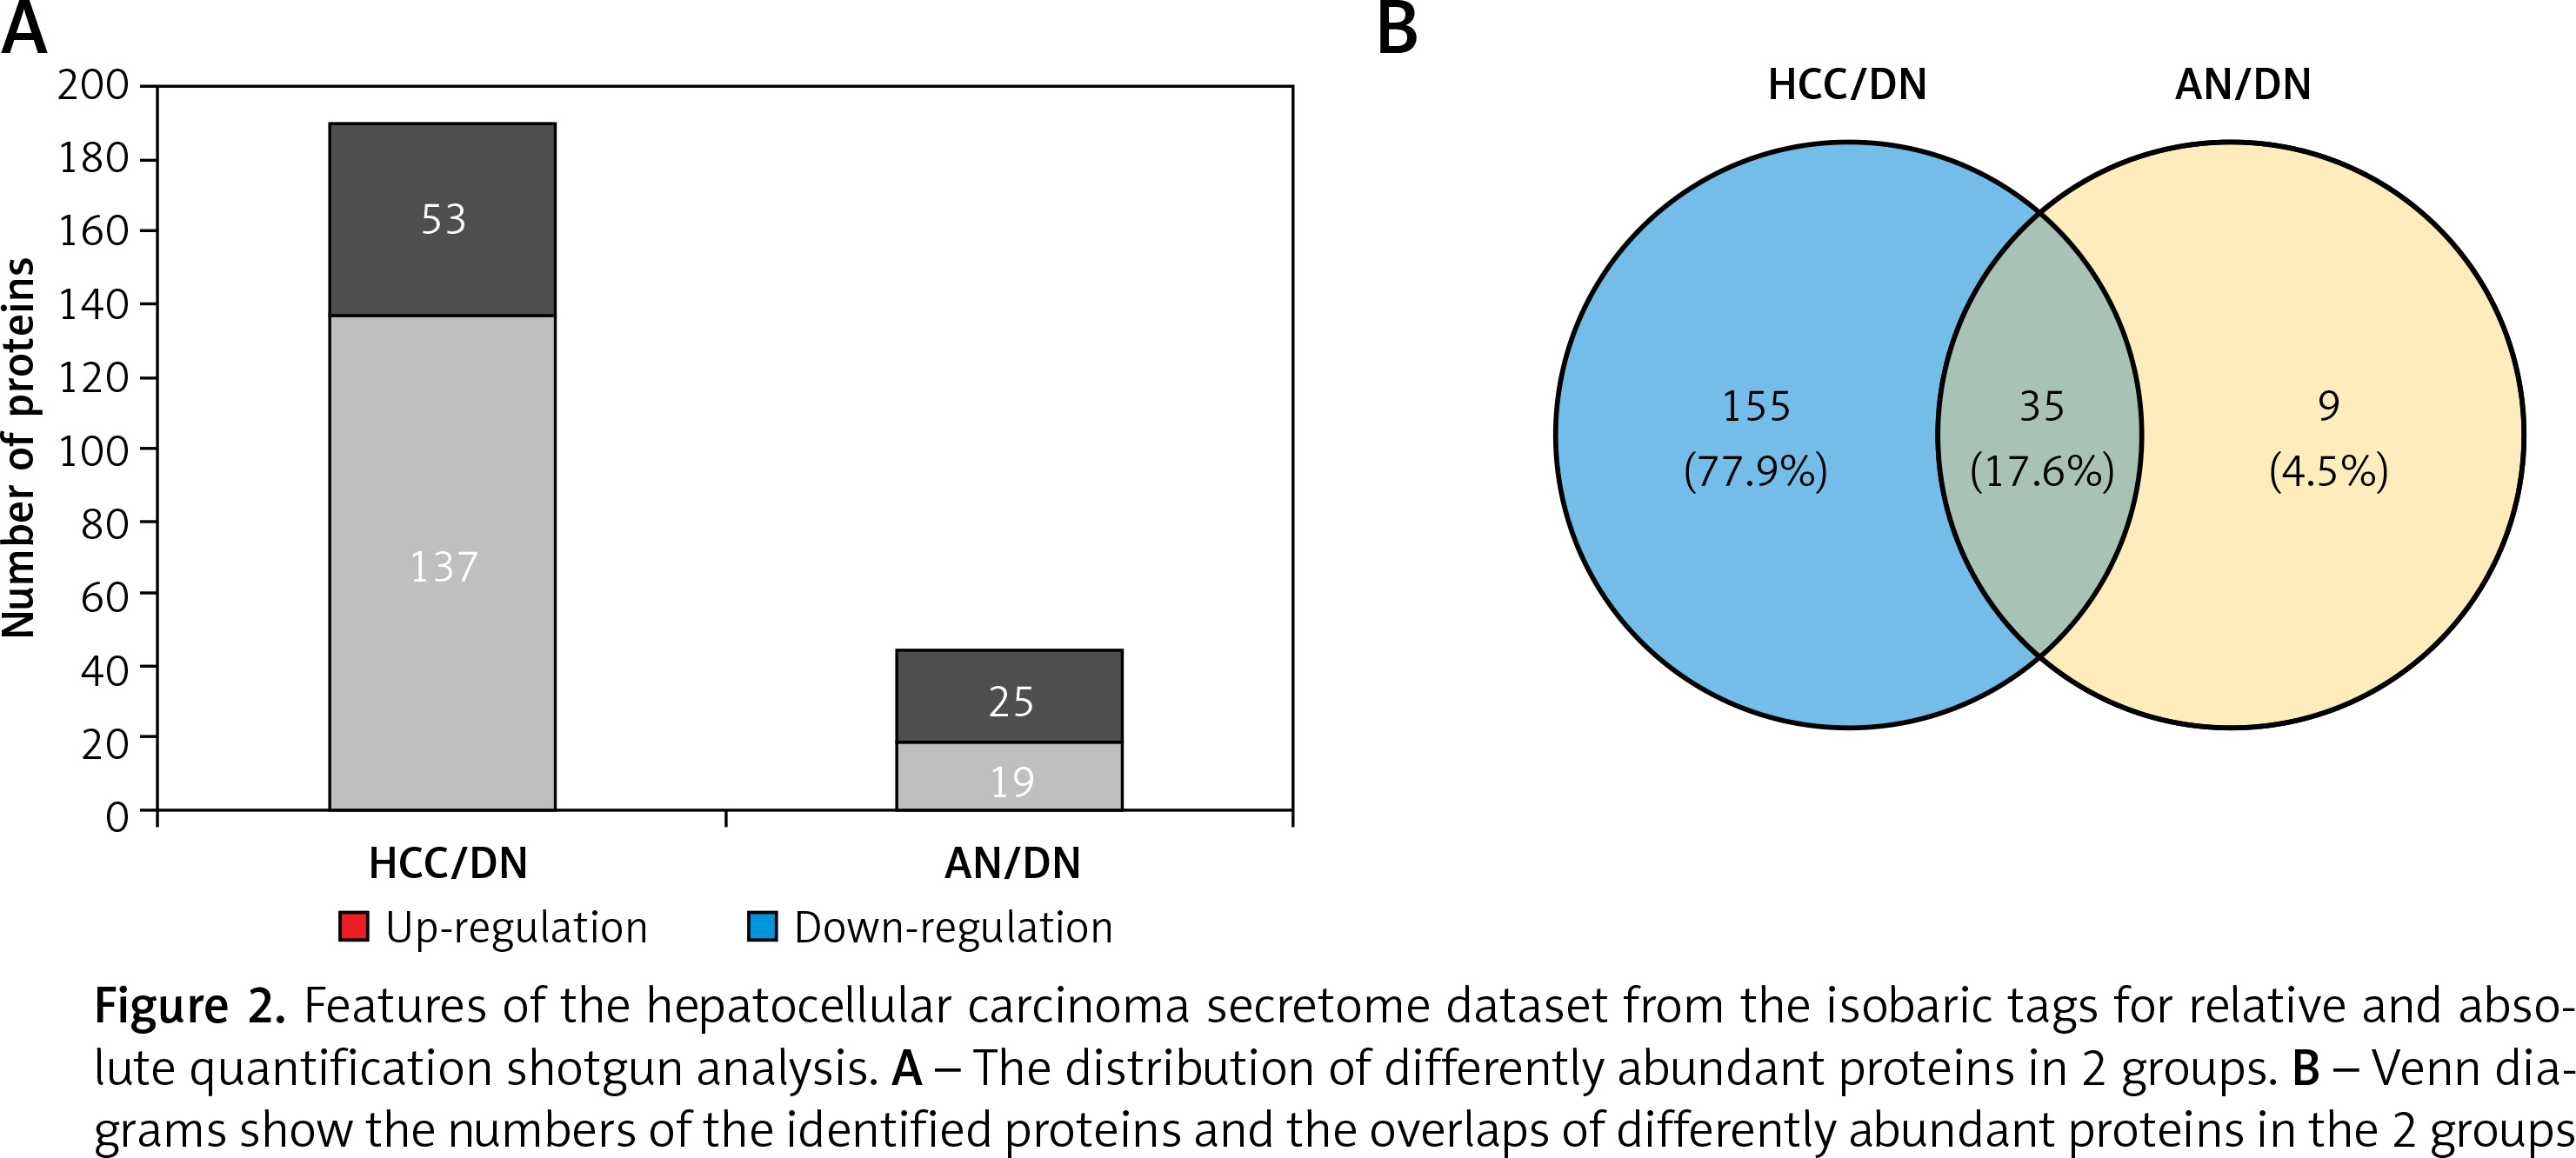
In this study, total proteins were extracted from the collected tumours, their adjacent noncancerous tissues and their distal noncancerous tissues were taken from patients and analysed using iTRAQ 2D LC-MS/MS, and the workflow as described in Figure 1. In total, we quantified 5214 proteins, of which 190 and 44 proteins were classified as differentially expressed in the HCC tissues/distal noncancerous tissues (HCC/DN) group and the adjacent noncancerous tissues/distal noncancerous tissues (AN/DN) group (Tables I and II). As is evident in Figure 2A, the number of differentially expressed proteins identified in the HCC/DN group was much higher than that in the AN/DN group.
Table I
Differentially expressed proteins identified between hepatocellular carcinoma tissues and distal noncancerous tissues
Table II
Differentially expressed proteins identified between adjacent noncancerous tissues and distal noncancerous tissues of hepatocellular carcinoma
Figure 1
A schematic view of the experimental design and the isobaric tags for relative and absolute quantification (iTRAQ) 8 plex-labelling. Sample preparation procedures for shotgun mass spectrometry (MS/MS) analysis and important steps in the proteomic strategies were included. The tissues from the primary hepatocellular carcinoma (HCC) patients were divided into 3 groups: HCC group, adjacent noncancerous group, and dendritic cell group. Different tissues were cultured in a serum-free medium and the proteins were extracted from the cultural supernatant and then digested by trypsin and labelled by different iTRAQ reagents. The digested peptides were separated by high pH reversed-phase liquid chromatography (LC) and analysed by LC-MS/MS
When we compared the differences between the 2 groups, we found that among these differentially expressed proteins, 35 proteins altered their expression in both HCC types, while 155 proteins were dysregulated in the HCC/DN group only and 9 proteins were dysregulated in the AN/DN group only (Figure 2 B). We then analysed the biological functions and signalling pathways of these proteins, including the proteins differentially expressed in both groups and the proteins differentially expressed individually in 1 group.
Figure 2
Features of the hepatocellular carcinoma secretome dataset from the isobaric tags for relative and absolute quantification shotgun analysis. A – The distribution of differently abundant proteins in 2 groups. B – Venn diagrams show the numbers of the identified proteins and the overlaps of differently abundant proteins in the 2 groups
The gene ontology analysis of the differentially expressed proteins in primary hepatocellular carcinomas
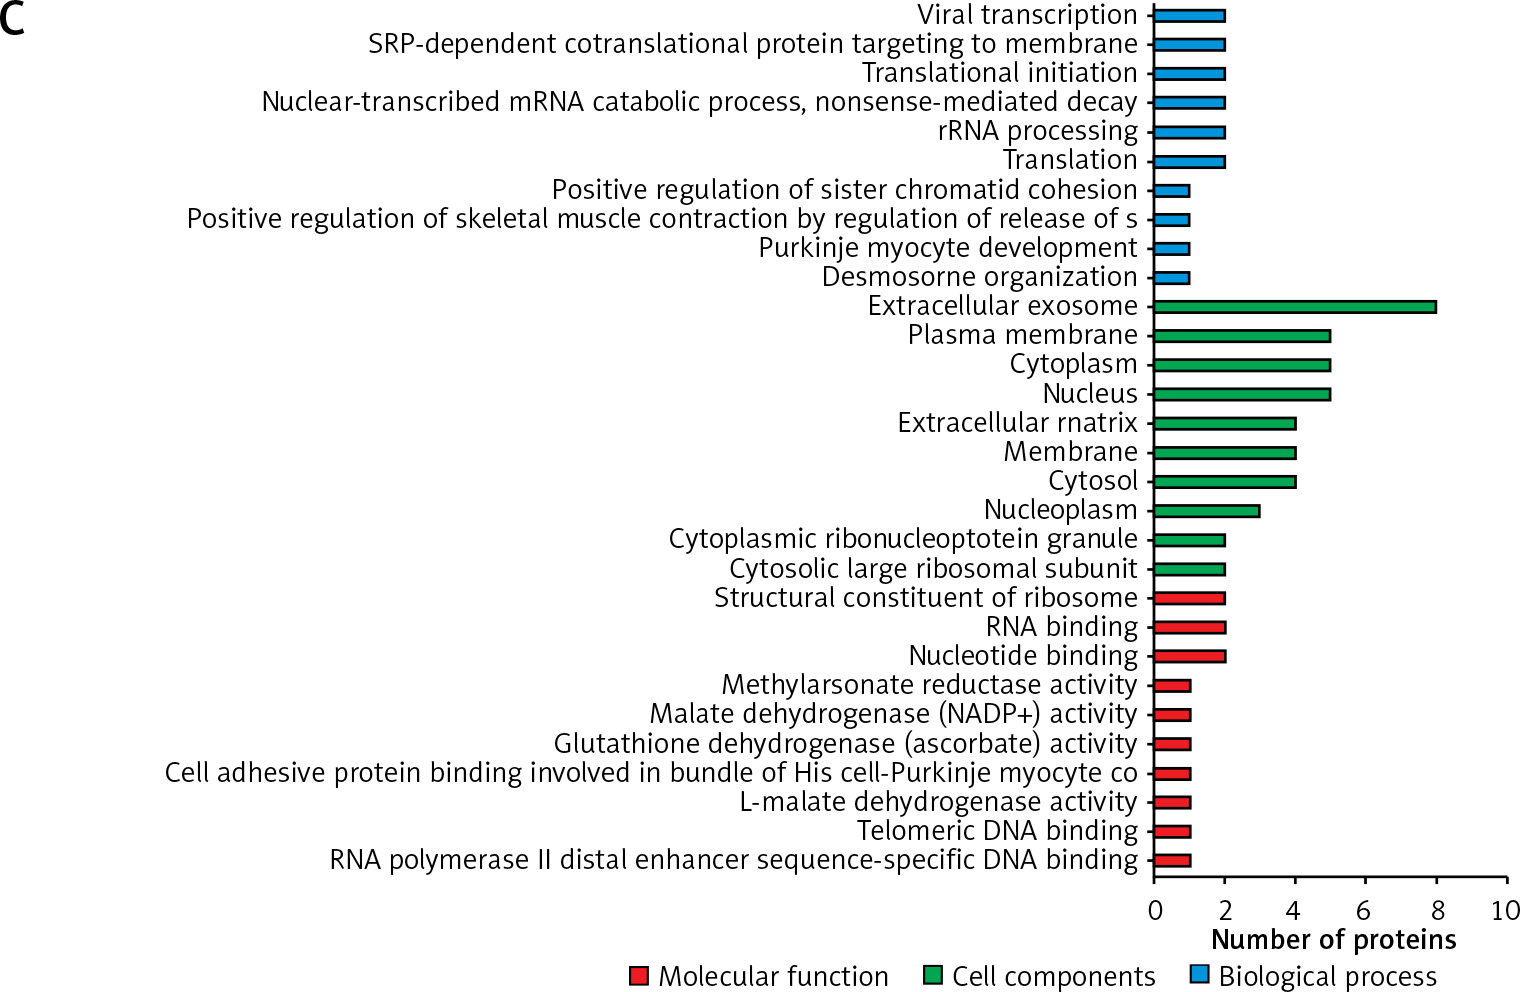
The gene ontology annotation analysis showed that the cell components of the differentially expressed proteins either overlapped in the 2 groups or were unique in 1 group and were mostly located in the extracellular exosome (Figure 3). For the biological process analysis, the GO annotation analysis showed that the proteins overlapped in both groups and were the major participants in the protein folding, lipid metabolic process, gluconeogenesis, nucleobase-containing compound metabolic process, and canonical glycolysis (Figure 3 A).
Figure 3
The gene ontology (GO) analysis of the differently abundant proteins. A – The GO analysis of differently abundant proteins overlapped in the 2 groups. B – The GO analysis of differently abundant proteins only involved in the hepatocellular carcinoma tissues/distal noncancerous tissues group. C – The GO analysis of differently abundant proteins only involved in the adjacent noncancerous tissues/distal noncancerous tissues group
There were 155 dysregulated proteins in the HCC group compared to the distal noncancerous tissues (DN) group, but these proteins were not dysregulated in the adjacent noncancerous (AN) tissues group compared to the DN group. These dysregulated proteins were mainly involved in signal transduction, cell proliferation, protein stabilisation, and negative regulation of the apoptotic process (Figure 3 B).
Interestingly, there were 9 dysregulated proteins in the AN group compared to the DN group, but they were not dysregulated in the HCC group compared to the DN group. The gene ontology results also showed that these dysregulated proteins were mainly involved in desmosome organisation, positive regulation of sister chromatid cohesion, translation, rRNA processing, nuclear-transcribed mRNA catabolic process, translational initiation, and SRP-dependent co-translational protein targeting to the membrane (Figure 3 C).
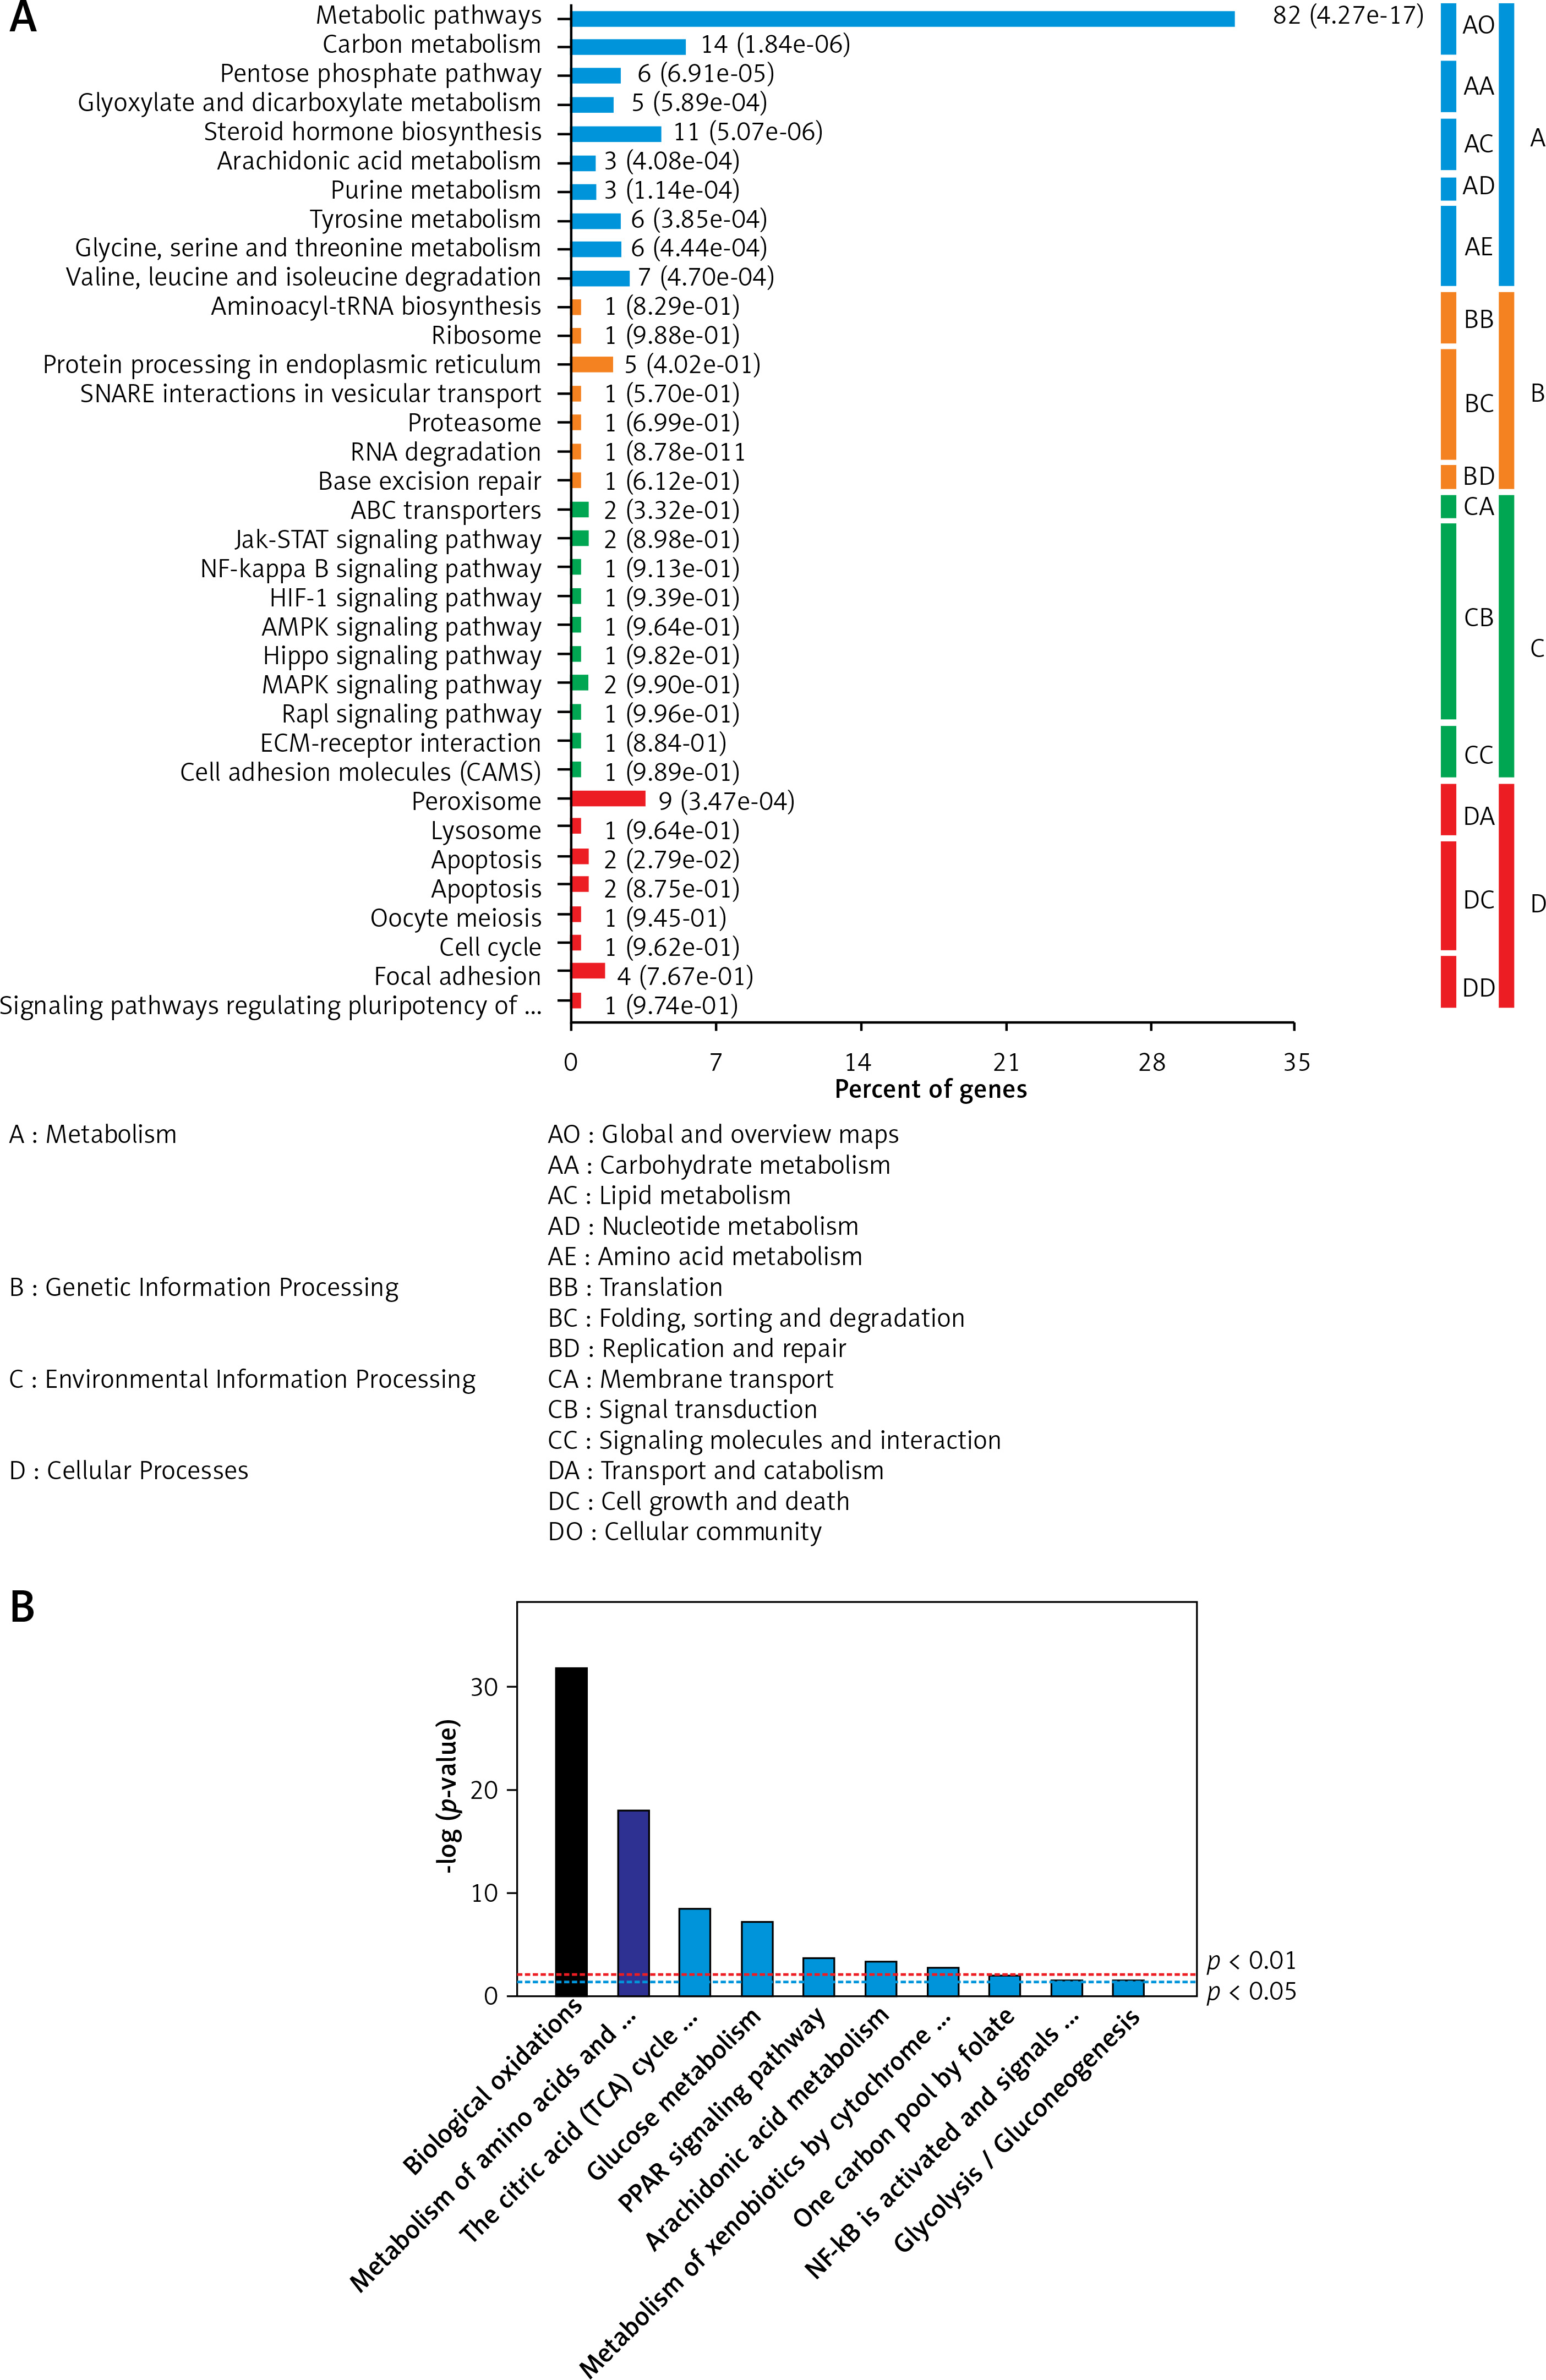
The Kyoto Encyclopaedia of Genes and Genomes pathway analysis of the differentially expressed proteins
As shown in Figure 4, the pathway of metabolism, genetic information processing, environmental information processing, and cellular was analysed. According to the results of the analysis, the dysregulated proteins in HCC are mostly involved in the Janus kinase-signal transducer and activator of the transcription (JAK-STAT) pathway and mitogen-activated protein kinase (MAPK) pathway. However, the signalling pathway that was only enriched in the AN group comprised mainly basic metabolisms, such as biological oxidations, amino acids metabolism, trichloroacetic acid (TCA) cycle, glucose metabolism, etc.
Figure 4
The key signalling pathways involved in the 2 groups. A – The key signalling pathways involved in the hepatocellular carcinoma tissues/distal noncancerous tissues group. B – The key signalling pathways involved in the adjacent noncancerous tissues/distal noncancerous tissues group. The top 10 enriched signalling pathways were displayed in the figures
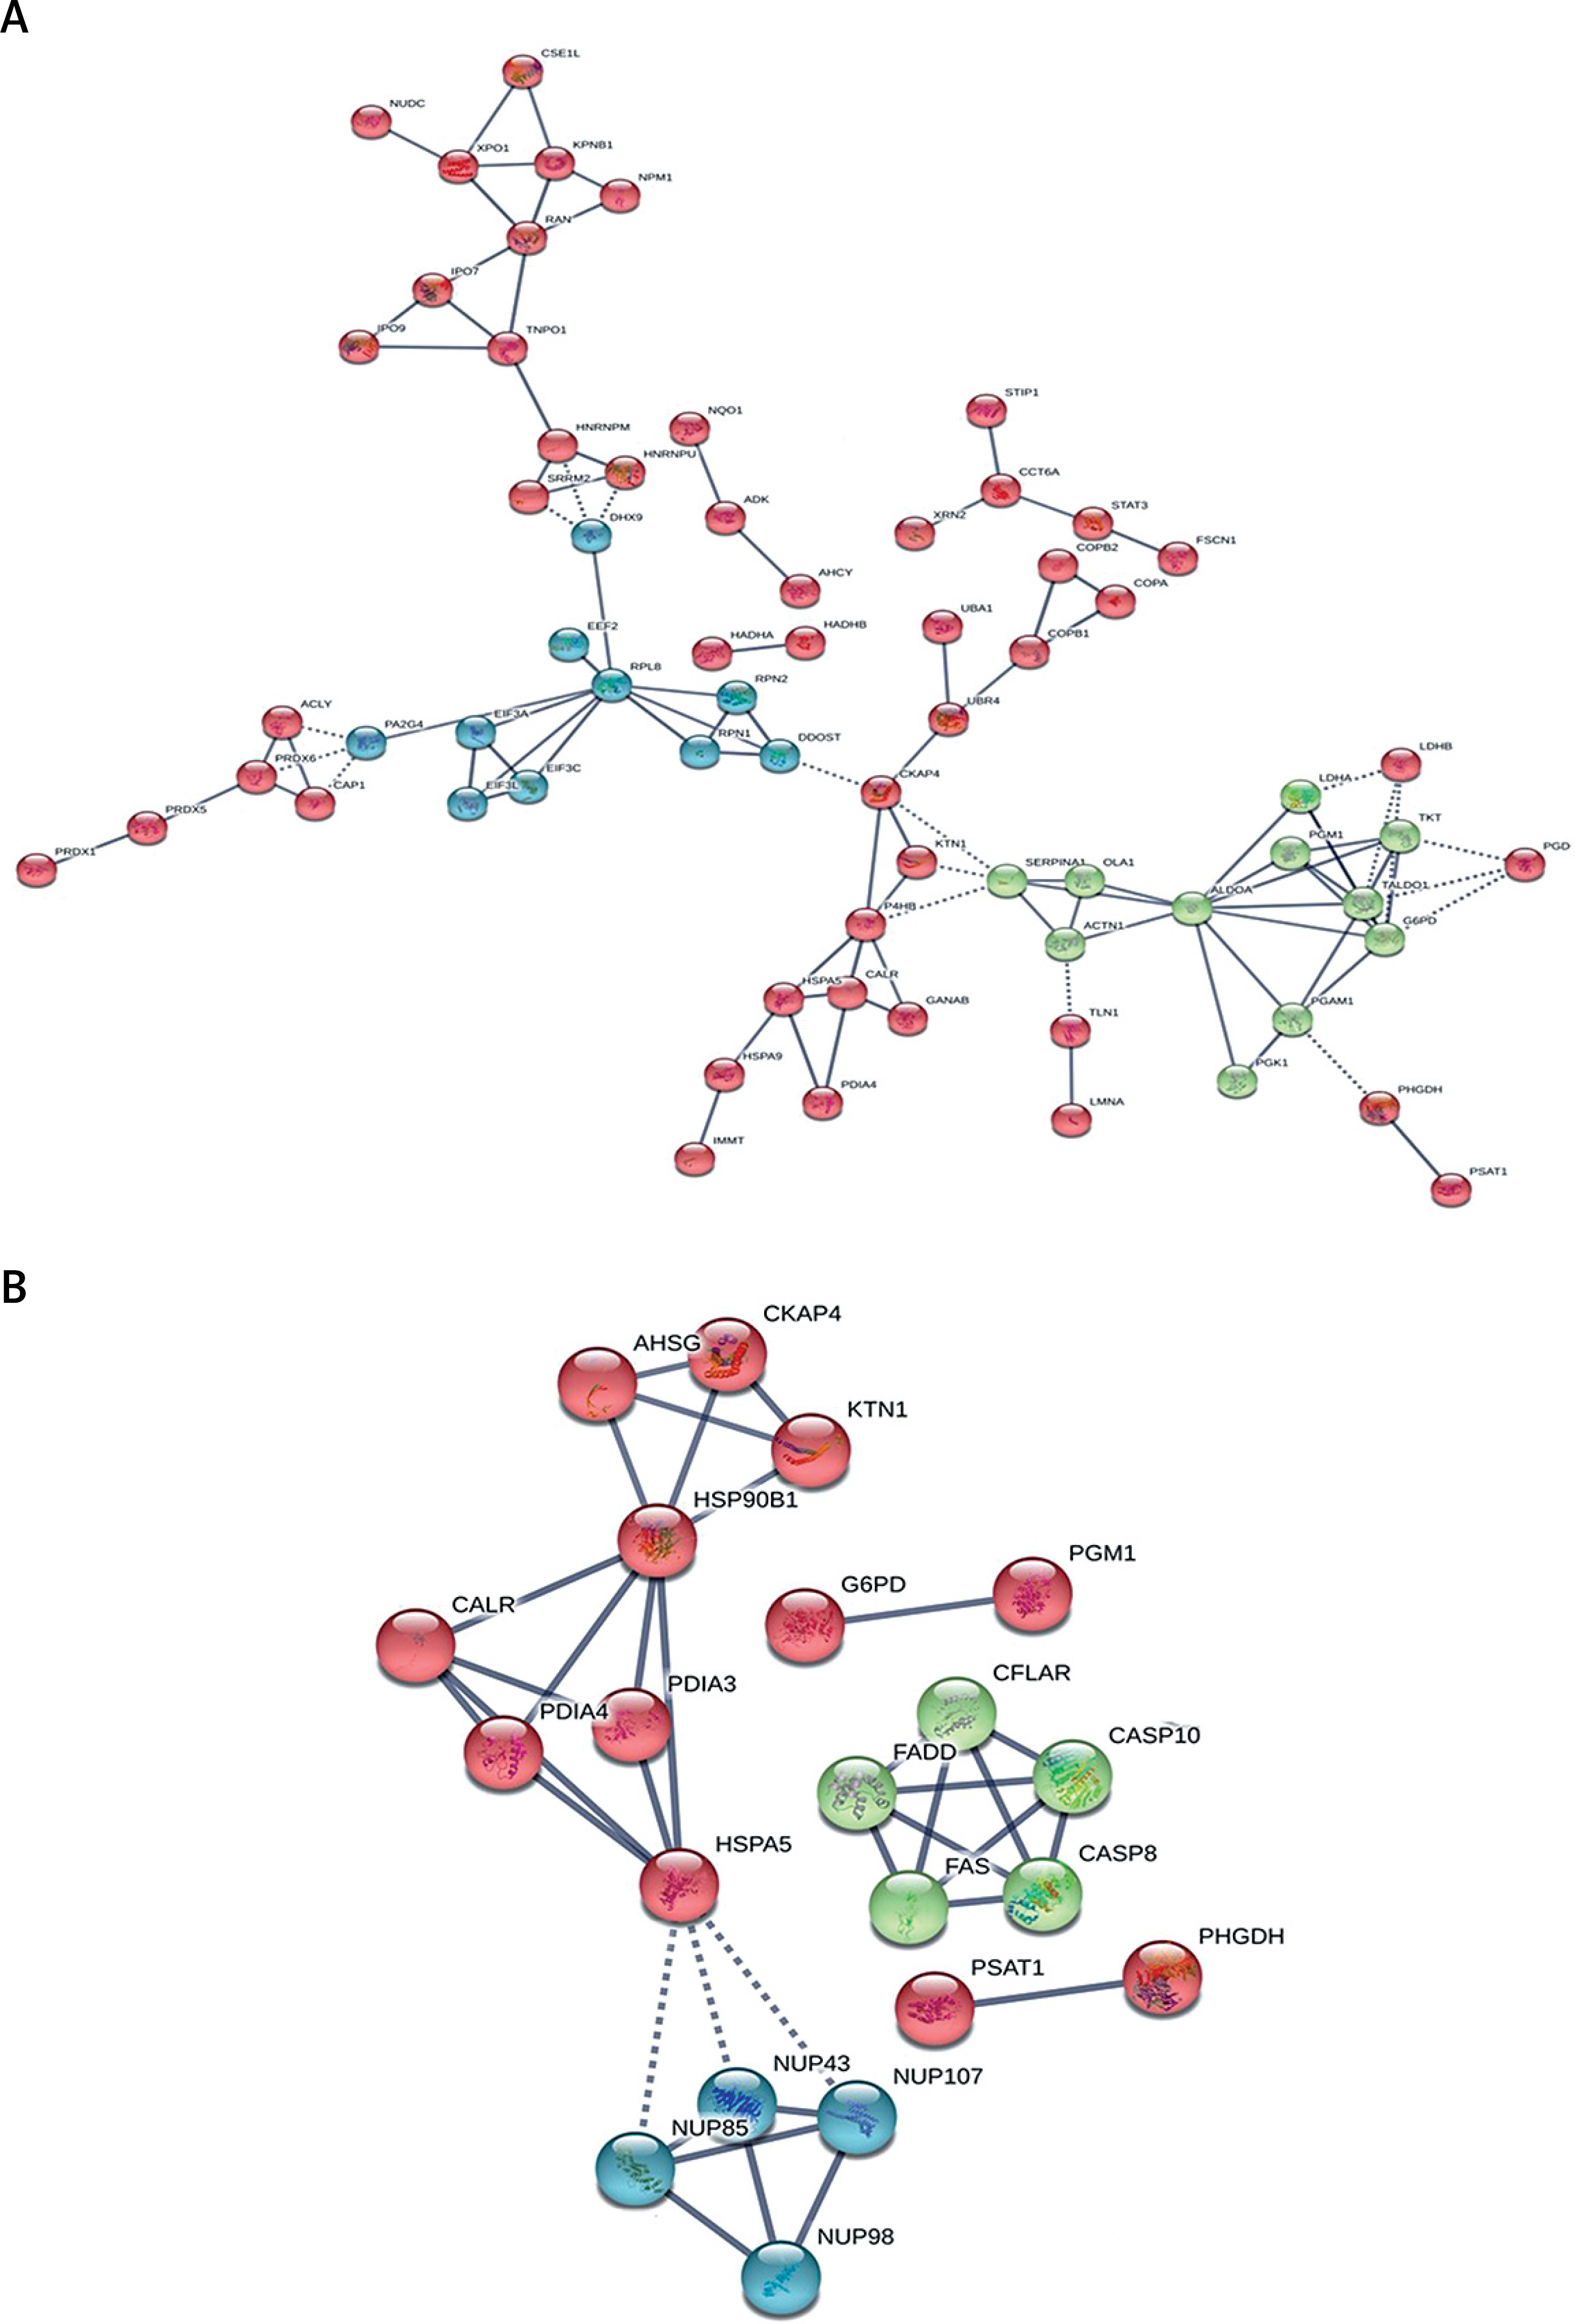
The String analysis of the differentially expressed proteins
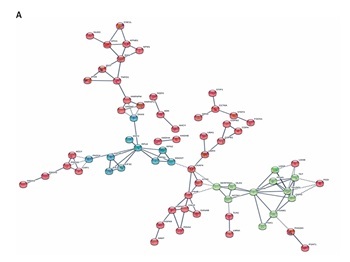
As shown in Figure 5 A, in the HCC/DN group, the proteins could be classified into 3 major clusters: proteins in the red region were related to protein translation and post-translation processing, proteins in the blue region were related to protein glycosylation modification, and proteins in the green region were related to biological metabolic functions dominated by glucose metabolism. While in the AN/DN group, the proteins could also be classified into 3 clusters: the red region represented proteins related to immune and metabolic functions, the green region represented proteins related to apoptosis functions, and the blue region represented proteins related to protein binding functions (Figure 5 B).
Figure 5
The interaction networks of differently abundant proteins in the 2 groups. A – The interaction networks of differently abundant proteins involved in the hepatocellular carcinoma tissues/distal noncancerous tissues group. B – The interaction networks of differently abundant proteins involved in the adjacent noncancerous tissues/distal noncancerous tissues group
Discussion
Hepatocellular carcinoma has become the third-most-common cause of cancer-related death worldwide. Most cases of HCC were developed in patients who had already had liver cirrhosis [15]. Therefore, surveillance for the early onset of HCC was recommended. The biomarkers with high sensitivity and specificity were essential for optimising the management of HCC [16]. Zhang et al. used the iTRAQ pipeline to distinguish the proteomic profiles of malignant ascites in HCC patients from those with non-malignant liver cirrhosis and found that Enolase-1 and fibrinogen are potential ascitic fluid-based biomarkers for diagnosis and prognosis of HCC [17]. Guo et al. reported that assaying CD14 levels may complement AFP measurement for the early detection of HCC [18]. Wang et al. suggested that different molecular alterations and specific signalling pathways were indeed involved in different HCC subtypes [19]. Our study aimed to investigate the molecular signatures of the HCC by quantitative proteomics using iTRAQ with LC-MS/MS.
In our study, the number of differentially expressed proteins identified in the HCC/DN group was much higher than in the AN/DN group. These findings indicate that the features between the adjacent noncancerous tissues and distant noncancerous tissues were more similar than those between the HCC tissues and the distant noncancerous tissues, which were accorded with objective existence.
The gene ontology annotation analysis showed that the cell components of the differentially expressed proteins that either overlapped in 2 groups or uniquely in 1 group were mostly located in the extracellular exosome, which indicated that the proteins extracted in this experiment were mainly secreted proteins. For the biological process analysis, the GO annotation analysis showed that the proteins overlapped in both the groups and were the major participants in the protein folding, lipid metabolic process, gluconeogenesis, nucleobase-containing compound metabolic process, and canonical glycolysis. Most of these processes focused on metabolic changes, which suggested that the changes in the material metabolism were universal, regardless of the transformation from distant cancer to adjacent cancer or the approach of adjacent cancer to HCC. The molecular function of these proteins also focuses on energy metabolism, which also supported the hypothesis [15, 20–23].
There were 155 dysregulated proteins in the HCC group compared to the DN group, but these proteins were not dysregulated in the AN group compared to the DN group. We further analysed that these proteins involved the biological process by GO analysis; the results showed that these dysregulated proteins were mainly involved in signal transduction, cell proliferation, protein stabilisation, and the negative regulation of the apoptotic process. These processes might be involved in the formation or development of HCC, and it has been reported that these processes are involved in the disturbing of the signal transduction and protein degradation [24–27], apoptotic process [27, 28], and cell proliferation [28, 29] in tumours. The molecular function of these proteins, such as the cadherin binding involved in cell-cell adhesion, protein homodimerisation activity, ubiquitin-protein ligase binding, calcium ion binding, GTP binding, etc., also supported this conclusion.
Interestingly, there were 9 dysregulated proteins in the AN group compared to the DN group but no dysregulation in the HCC group compared to the DN group, and the GO results showed that these dysregulated proteins were mainly involved in desmosome organisation, positive regulation of sister chromatid cohesion, translation, rRNA processing, nuclear-transcribed mRNA catabolic process, translational initiation, and SRP-dependent co-translational protein targeting the membrane. The results also showed that the dysregulated proteins may have affected the incidence and progress of HCC, such as the change of the combination of the protein and the RNA function presenting the disorder of the transcription and translation function, which suggested that the surrounding noncancerous cells might increase the expression of the nucleic acid and enzyme by tumour microenvironment to promote the HCC proliferation and growth [30], and that the changes of telomere and telomerase in the surrounding noncancerous cells revealed the dysregulation on the chromosome stability, repair, and proliferation, which were all closely related to the incidence of HCC development [31, 32]. Similarly, the molecular function of these proteins, such as cadherin binding-involved nucleotide binding, RNA binding, calcium ion binding, chromatin binding, transcription regulatory region DNA binding, identical protein binding, etc., also supported this conclusion.
To further reveal the possible molecular mechanisms of the tumourigenesis and the development of the primary HCC, we applied the KEGG database to analyse the signalling pathways in which the differentially expressed proteins were involved. Our study also analysed the pathway of metabolism, genetic information processing, environmental information processing, and cellular. According to the results of the analysis, the dysregulated proteins in HCC are mostly involved in the JAK-STAT pathway and MAPK pathway. All the above-mentioned signalling pathways are actively associated with cancers [33–36]. It has been reported that the MAPK signalling pathway played an essential role in the development and aggressive behaviour of tumours by enhancing tumour cell proliferation, differentiation, apoptosis, and cell cycle [37, 38]. Therefore, it is not surprising that the MAPK signalling pathway is involved in HCC tissues. Interestingly, the JAK-STAT pathway was only enriched in the HCC group but not in the AN group. JAK-STAT pathway has been regarded as one of the main molecular pathways in HCC progression [39].
However, the signalling pathway only enriched in the AN group comprised mainly basic metabolisms, such as biological oxidations, amino acids metabolism, TCA cycle, glucose metabolism, and so on. All of these processes belong to the material metabolism and illustrate that the primary material changes play an important role in the tumourigenesis and development of HCC. Also, the different pathways in the HCC and the AN group suggest that there might be different molecular mechanisms in the carcinogenesis and development of the primary HCC in the HCC tissue and the surrounding noncancerous tissues. The abovementioned results that were analysed demonstrate that our quantitative proteomics approach is suitable in studying the overall molecular profile changes of HCC and could give further insight into the possible molecular mechanisms.
In our study, the proteins in the HCC/DN group could be classified into 3 major clusters: proteins in the red region were related to protein translation and post-translation processing, proteins in the blue region were related to protein glycosylation modification, and proteins in the green region were related to biological metabolic functions dominated by glucose metabolism. As is already known, the malignant proliferation of tumour cells was a process of energy consumption, so the hyperactive glucose metabolism in the HCC group might provide the necessary conditions for the progression of HCC [40, 41]. Glycosylation was involved in the folding, aggregation, maturation, and transportation of protein-peptide chains and was a terminal signal on the surface of the cancer cells in carcinogenesis [42, 43]. The incidence, development, and invasion of HCC were accompanied by glycosylation changes of relevant glycoproteins, so the change of the carbohydrate structure on the surface of the HCC cells played an important role in the occurrence and development progress of HCC [44, 45].
The proteins in the AN/DN group could also be classified into 3 clusters: the red region represented proteins related to immune and metabolic functions, the green region represented proteins related to apoptosis functions, and the blue region represented proteins related to protein binding functions. This indicated that immune and metabolic changes were relatively active in the para cancer tissues, which might be related to changes in the tumour microenvironment [46–49]. All these results suggest that the evolution of the tissues adjacent to HCC promoted the incidence of HCC.
In summary, this study applied the iTRAQ-based quantitative proteomic approach to analyse the secretome of the primary cultures of HCC tumour tissues. The results visibly showed that the secretome profile alternations and signalling pathways were associated with HCC occurrence and development. The dysregulated proteins in the HCC/DN group were concentrated in the MAPK signalling and JAK-STAT signalling, but the dysregulated proteins in the AN/DN group were more concentrated in the basal material metabolism. The different protein expression profiles in the primary HCC tissues, the surrounding non-cancerous tissues, and the distal noncancerous tissues might also reveal different underlying molecular mechanisms. This study provides a valuable resource of the HCC tissue secretome to investigate the molecular mechanism of HCC incidence and development.
In conclusion, the secretome profile alternations and signalling pathways were associated with HCC incidence and development. The dysregulated proteins in the HCC/DN group were concentrated in the MAPK signalling and JAK-STAT signalling, but the dysregulated proteins in the AN/DN group were more concentrated in the basal material metabolism.