Introduction
Liver cancer is a typical tumor with significant malignancy, fast growth, and a dismal prognosis [1]. According to the histological criteria, hepatocellular carcinoma (HCC) is usually divided into three types: cholangiocarcinoma, HCC, and mixed liver cancer [2]. Among them, HCC originates from liver parenchymal cells, accounting for about 90% of primary liver cancer, while the latter two types are relatively rare [3]. Generally speaking, in the early stage of the tumor, HCC patients have no obvious clinical signs. However, with the further development of the tumor, there will often be pain in the liver area, decreased appetite, indigestion, nausea, vomiting, weight loss, general weakness, fever, etc., also accompanied by spontaneous hypoglycemia and polycythemia [4]. Currently, medical treatments such as radiotherapy and resection surgery can only relieve pain and extend the survival time of patients [5]. Thus, elucidating the mechanism and finding reliable diagnostic, therapeutic and prognostic biomarkers are indeed critical for HCC patients.
The trace element iron is essential in organismal vitality through its intricate metabolism. This includes systemic processes [6] such as ingested iron absorption by duodenal epithelial cell, peripheral iron circulation via membrane ferroportin, and coupling with transferrin for erythropoiesis, as well as cellular activity such as iron uptake, use, and egress. Notably, dysregulated iron metabolism, manifesting as deficiency [7] or overload [8], disrupts mitochondrial function and cellular integrity. Central to this is ferroptosis [9, 10], the peroxidation of polyunsaturated fatty acid lipids on cell membranes that results in iron-dependent controlled cell death, catalyzed by divalent iron or lipoxygenases. Glutathione (GSH), a crucial antioxidant tripeptide composed of glutamate, cysteine, and glycine, plays a defensive role [11]. It mitigates iron-induced oxidative stress by sequestering free iron, thereby averting ferroptosis. The synthesis of GSH, orchestrated by glutathione synthetase (GSS), is pivotal in converting its constituent amino acids into GSH [12]. Perturbations in iron metabolism and glutathione synthesis are pivotal factors in the complex relationship between iron-mediated cell death and oxidative stress, which may significantly affect cellular functions in HCC.
In the context of HCC, the ribosomal protein L8 gene (RPL8), encoding the L8 protein, emerges as a pivotal player with implications for ferroptosis. Recognized as a marker for iron-induced cell death, RPL8 holds significance in HCC research. Previous investigations identified RPL8 as one of seven genes associated with ferroptosis, demonstrating its close correlation with survival and treatment responses in gliomas [13]. Moreover, recent findings underscore the impact of RPL8 on liver cancer progression by modulating the mTORC1 signaling pathway [14]. This emphasizes the integral role of RPL8 in the intricate process of liver cancer development. Furthermore, elevated RPL8 expression in liver cancer correlates significantly with adverse prognosis and multiple clinical-pathological parameters [15]. Associations extend to pivotal biological processes such as immune response, liver regeneration, and ferroptosis. These revelations position RPL8 as a possible target for therapy for HCC management and a prognostic indicator. In summary, RPL8 has various roles in ferroptosis, survival, and progression in multiple cancers, emphasizing its critical significance in HCC and its potential for further exploration for effective therapeutic interventions.
This study attempted to elucidate the functional significance of RPL8 in HCC and its role in the regulation of ferroptosis. First, using public databases, we performed a prognostic evaluation of 22 ferroptosis-related genes (FRGs) in HCC samples. The effects of RPL8 differential expression on HCC cell growth were subsequently studied through in vivo and in vitro experiments. Then we further elucidated the relationship between RPL8 and the ferroptosis mechanism, emphasizing the regulatory effect of RPL8 on GSH levels and lipid peroxidation. The outcomes of this analysis highlight the relevance of RPL8 in HCC progression and provide insights into the complex interplay between RPL8, GSH metabolism and ferroptosis, with broader implications for cancer treatment and management.
Material and methods
Identification and functional analysis of FRGs in liver hepatocellular carcinoma (LIHC)
Utilizing the Assistant for Clinical Transformation website (https://www.aclbi.com/static/index.html#/), we analyzed differential expression of 22 FRGs in 371 LIHC samples from The Cancer Genome Atlas (TCGA; https://tcga-data.nci.nih.gov/tcga) database, alongside 226 normal samples from the Genotype-Tissue Expression (GTEx; https://www.gtexportal.org/home/) database. Subsequent enrichment analysis for these genes was carried out utilizing the Enrichr website (https://maayanlab.cloud/Enrichr/), employing both Gene Ontology (GO) terms and Kyoto Encyclopedia of Genes and Genomes (KEGG) pathways. Additionally, the Search Tool for the Retrieval of Interacting Genes (STRING; https://string-db.org/) database was used to conduct protein-protein interaction (PPI) network analysis in order to better understand the interplay of proteins encoded by these genes.
Progression-free survival (PFS) probability analysis of FRGs
In light of the expression of FRGs, high expression and low expression groups were created out of LIHC patients (both 185 cases) applying the median expression of a gene as the grouping method. The log-rank test was used in the Kaplan-Meier (KM) analysis to compare discrepancies in PFS rates between the two groups. When p < 0.05, the prognostic result of FRGs was considered to be statistically significant.
Construction of risk scores and prognostic model
The glmnet package of R software was used to determine candidate FRGs through the least absolute shrinkage and selection operator (LASSO), and the optimal adjustment parameters (lambda) were determined through ten-fold cross-validation. The patients were categorized into high- and low-risk categories based on their calculated risk ratings. Next, we examined the risk ratings of these groups and analyzed the distribution of survival rates. KM survival curves were plotted to discern differential PFS probabilities between the cohorts, utilizing the log-rank test to determine statistical significance with a p-value of less than 0.05. For temporal prognostic model validation, the timeROC package was employed at 1-year, 3-year, and 5-year gaps to generate receiver operating characteristic (ROC) curves. Area under the curve (AUC) values were used to evaluate model performance in forecasting the course of survival.
Prognostic assessment of RPL8 in LIHC
Within our risk prognostic model, RPL8 was established as a hub gene. Univariate and multivariate Cox regression were used in further studies to evaluate the prognostic significance of genes as well as clinical variables such as pT stage, age, and pTNM stage, selecting for variables with significant p-values. The clinical diagnostic value of RPL8 was then evaluated by ROC curve analysis in the TCGA-LIHC cohort. Furthermore, nomograms for RPL8 in LIHC samples were constructed to forecast the prognosis of the patient at intervals of 1, 3, and 5 years (C-index = 0.59, p = 0.001). Calibration plots were generated to represent ideal predictions, providing a visual tool for assessing the accuracy of the prognostic model.
Expression verification of RPL8
UALCAN (http://uaHCCan.path.uab.edu/index.html) is a cancer website for biomarker identification, expression profiling and survival analysis. Here, we examined the RPL8 expression levels across 33 different pan-cancers. Then, correlations between RPL8 expression in LIHC and clinical factors were analyzed, including sample type, individual cancer stage, race, gender, age, and weight.
Human Protein Atlas (HPA) analysis
The HPA database (https://www.proteinatlas.org/) is used to map all human proteins in tissues, organs, and cells. HPA online tools have helped thousands of researchers in the fields of biomedicine and disease. This study used the HPA database to measure RPL8 protein levels in normal tissues and liver cancer tumor tissues.
Cell culture
Normal hepatocytes THL-2 and human hepatocellular carcinoma cell lines MHCC-97L, MHCC-97H and SNU387 were provided by the Type Culture Collection Cell Bank (CBTCC, China). High-sugar Dulbecco’s Modified Eagle’s Medium (DMEM, Gibco, USA) was prepared as the basal medium. 10% fetal bovine serum (FBS) was added to DMEM to provide nutrients required for cell growth. The cell suspension was inoculated into a culture vessel containing the above medium and placed in an incubator at 37°C with 5% CO2 to maintain the temperature and gaseous environment required for cell growth. When the cells grew to approximately 70–90% density, cell passaging was performed. Cells were detached from the culture vessel using trypsin or non-enzymatic digestion, followed by cell counting and dilution. Depending on the growth of the cells, the medium was changed periodically to remove metabolic waste and provide fresh nutrients. For cells that need to be stored for a long period of time, cryopreservation can be performed. The cell suspension is mixed with the cryopreservation solution and then gradually cooled down to liquid nitrogen for preservation.
Quantitative real-time polymerase chain reaction (qRT-PCR)
Total RNA was extracted using TRIzol reagent (Ambion, Carlsbad, CA, USA) following the manufacturer’s instructions. cDNA synthesis was performed using the PrimeScript RT kit (TaKaRa, Dalian, China). SYBR Green PCR Master Mix (Applied Biosystems, USA) was used on a StepOnePlus real-time PCR system (Applied Biosystems, USA). The total volume of each reaction was 20 µl, containing 2 µl of cDNA template. Primer sequences are shown below (Table I). Cycling conditions: 5 min of pre-denaturation at 95°C, followed by 40 cycles of 10 s at 95°C, 30 s at 60°C and 30 s at 72°C each. Relative gene expression was subsequently analyzed using the 2-ΔΔCT method with GAPDH as an internal reference. To ensure the stability and reliability of the experimental results and to enhance the statistical validity, we performed more than 3 replications of the biological experiments.
Table I
Sequences of PCR primers used in research to amplify genes
Cell transfection
We cultivated cells to approximately 70–80% density in preparation for transfection experiments. We calculated the number of cells required and ensured that each well of the 6-well plate ended up with 1 × 10⁵ cells/well. We spread the cells into 6-well plates at a density of 1 × 10⁵ cells/well using aseptic manipulation. The cells were cultured overnight until the cells adhered. We purchased siRNA transfection reagents targeting the RPL8 gene from Polyplus. We diluted the siRNA transfection reagent with serum-free medium according to the reagent instructions to avoid the effect of serum on transfection efficiency. On the day of transfection, we mixed the siRNA transfection reagent with cell culture medium to ensure that the siRNA was fully bound to the transfection reagent. The mixed siRNA transfection complex was added to each well, usually with a volume of 2–3 ml per well. Plasmids containing the RPL8 gene were purchased from Obio. We diluted the RPL8 plasmid with serum-free medium according to the experimental design. We added the mixture of RPL8 plasmid and transfection reagents to the target wells and set up a control with an empty vector (empty vector). We ensured that the volume of transfection complex in each well was 2–3 ml. We returned the 6-well plate to the incubator and continued incubation for 24-48 h to ensure siRNA and plasmid expression.
Cell viability assay
1 × 10⁵ cells/well were grown in 6-well plates containing culture medium, and the cells were placed in an incubator for 24 h. Subsequently, the cells were treated with trypsin (trypsin) to detach them from the 6-well plate. The cells were suspended and counted, the cell concentration was adjusted, and the cells were dispensed into 96-well plates, with the same number of cells added to each well, and double spreading was performed to ensure the reproducibility of the experiment. 10 µl of CCK-8 solution (Cell Counting Kit-8, SAB Biotech, USA) was added to each well of the 96-well plate for 4 consecutive days to ensure even distribution of CCK-8 solution in each well. The 96-well plate was incubated in an incubator to allow CCK-8 to react with metabolically active substances in the cells. The absorbance (OD) of each well was measured at different time points using an enzyme marker (microplate reader), with the wavelength usually set at 450 nm. The OD value of each measurement was recorded.
Transwell assays
We prepared the Transwell chambers by ensuring that they were clean and suitable for experimental use by pre-coating the filter membrane of the Transwell chambers with an appropriate amount of Matrigel Matrix Gel. Tumor cells were counted and adjusted to a concentration of 1 × 10⁶ cells/ml and added to the upper chamber of the Transwell. Culture medium containing 20% FBS was added to the lower vessel of the Transwell chambers, and the Transwell chambers were incubated in an incubator for 24 h. Subsequently, the medium was removed from the lower container of the Transwell chambers. The lower vessel of the Transwell chambers was washed twice using PBS to remove non-migrating or non-invasive cells. Cells on the filter membrane were fixed using methanol at room temperature for 5 min. The fixed filter membrane was allowed to dry at room temperature for approximately 30 min. The cells were stained using DAPI staining solution for 20 min. The stained filter membrane was placed on a microscope slide, and a fluorescence microscope was used to observe the cells at 200× magnification and take pictures of the migrated and invaded areas of the cells on the filter membrane. The pictures taken were analyzed using ImageJ software to calculate the gray scale values of the migrated and invaded cells and to assess the migratory and invasive abilities of the cells.
In vivo tumorigenesis assay
The Animal Center of the Chinese Academy of Medical Sciences (Beijing, China) supplied eight BALB/c nude mice (5 weeks old, male) for xenotransplantation experiments. Subcutaneous injections of MHCC-97 cells into the armpits of nude mice were performed, with non-targeted siRNA-treated (si-NC) cells serving as the negative control group and those transfected with si-RPL8 as the experimental group, each consisting of four mice. A vernier caliper was used every 5 days to measure the volume of the tumor in mice. Mice were sacrificed 6 weeks after injection to observe tumors. The Medical Ethics Committee of the Third Affiliated Hospital of the Naval Medical University gave its approval before this study could begin, guaranteeing that ethical standards for the humane treatment of research animals were followed. Ethical approval number: EHBHKY2021-K-011; ethical approval date: 06/04/2021.
Enzyme-linked immunosorbent assay (ELISA) and metabolite measurements
Lichen Biotech Ltd. provided ELISA kits to detect RPL8, glutamate, glycine, cystathionine, cysteine, glucose, and serine (Shanghai, China). The relation between RPL8 and labile iron was measured using Abcam kits (Cambridge, UK), while GSH and membrane phospholipid levels were detected by Sigma kits (St. Louis, MO, USA). The ELISA was performed strictly according to instructions provided by the manufacturer.
Western blotting (WB)
Cellular proteins were extracted using RIPA lysis buffer (Thermo Fisher Scientific) and protein concentration was determined using BCA assay (Thermo Fisher Scientific). Aliquots of protein samples were electrophoresed on 10% SDS-PAGE gels. Wet transfer was performed using a PVDF membrane (MilliporeSigma) with a membrane transfer time of 60 min at a constant flow of 0.3 A. Membranes were closed using 5% skimmed milk powder in TBST for 2 h, followed by overnight incubation at 4°C with primary antibodies (RPL8, Bax, Bcl-2, cleaved caspase-3, GPX4, CBS, CTH, SHMT2, GSS etc.). In the experiments, Bcl-2 and SHMT2 were diluted at 1 : 2000 and the rest at 1 : 1000. GAPDH (1 : 5000) was used as an internal control. This was followed by incubation for 1 h at room temperature using HRP-labelled secondary antibodies. The bands were visualized using an electrochemiluminescence (ECL) detection system (Thermo Fisher Scientific) and densitometry was performed for quantification. To ensure the stability and reliability of the experimental results, each biological experiment was repeated more than three times.
Flow cytometry apoptosis assay
Flow cytometry was used to quantify apoptotic cells after labeling with Annexin V-FITC and propidium iodide (PI) with the FITC Annexin V Apoptosis Detection Kit I (BD Biosciences). Following cell collection, two cold PBS washes and a resuspension in 1X binding buffer were performed. Following that, cells were treated in the dark for 15 min with Annexin V-FITC and PI. After incubation, samples were analyzed using a BD Biosciences FACSCalibur flow cytometer to determine the proportion of apoptotic cells. Data were then processed using CellQuest software.
Statistical analysis
All experiments had at least three biological replicates. Each biological replicate was performed and analyzed independently to ensure reproducibility and accuracy. For in vitro experiments (cell proliferation, migration, invasion), there were three technical replicates for each biological replicate in each condition. For in vivo studies, a minimum of four mice per group was used to ensure adequate statistical power.
All analyses involving statistics were performed using SPSS 18.0 software (SPSS Inc.), data are expressed as mean ± standard deviation (SD), comparisons between two groups were performed using Student’s t-test, and statistical significance was set at p < 0.05, with p-values expressed as follows: p < 0.05 (*), p < 0.01 (**).
Results
Functional enrichment and prognostic evaluation of FRGs in LIHC
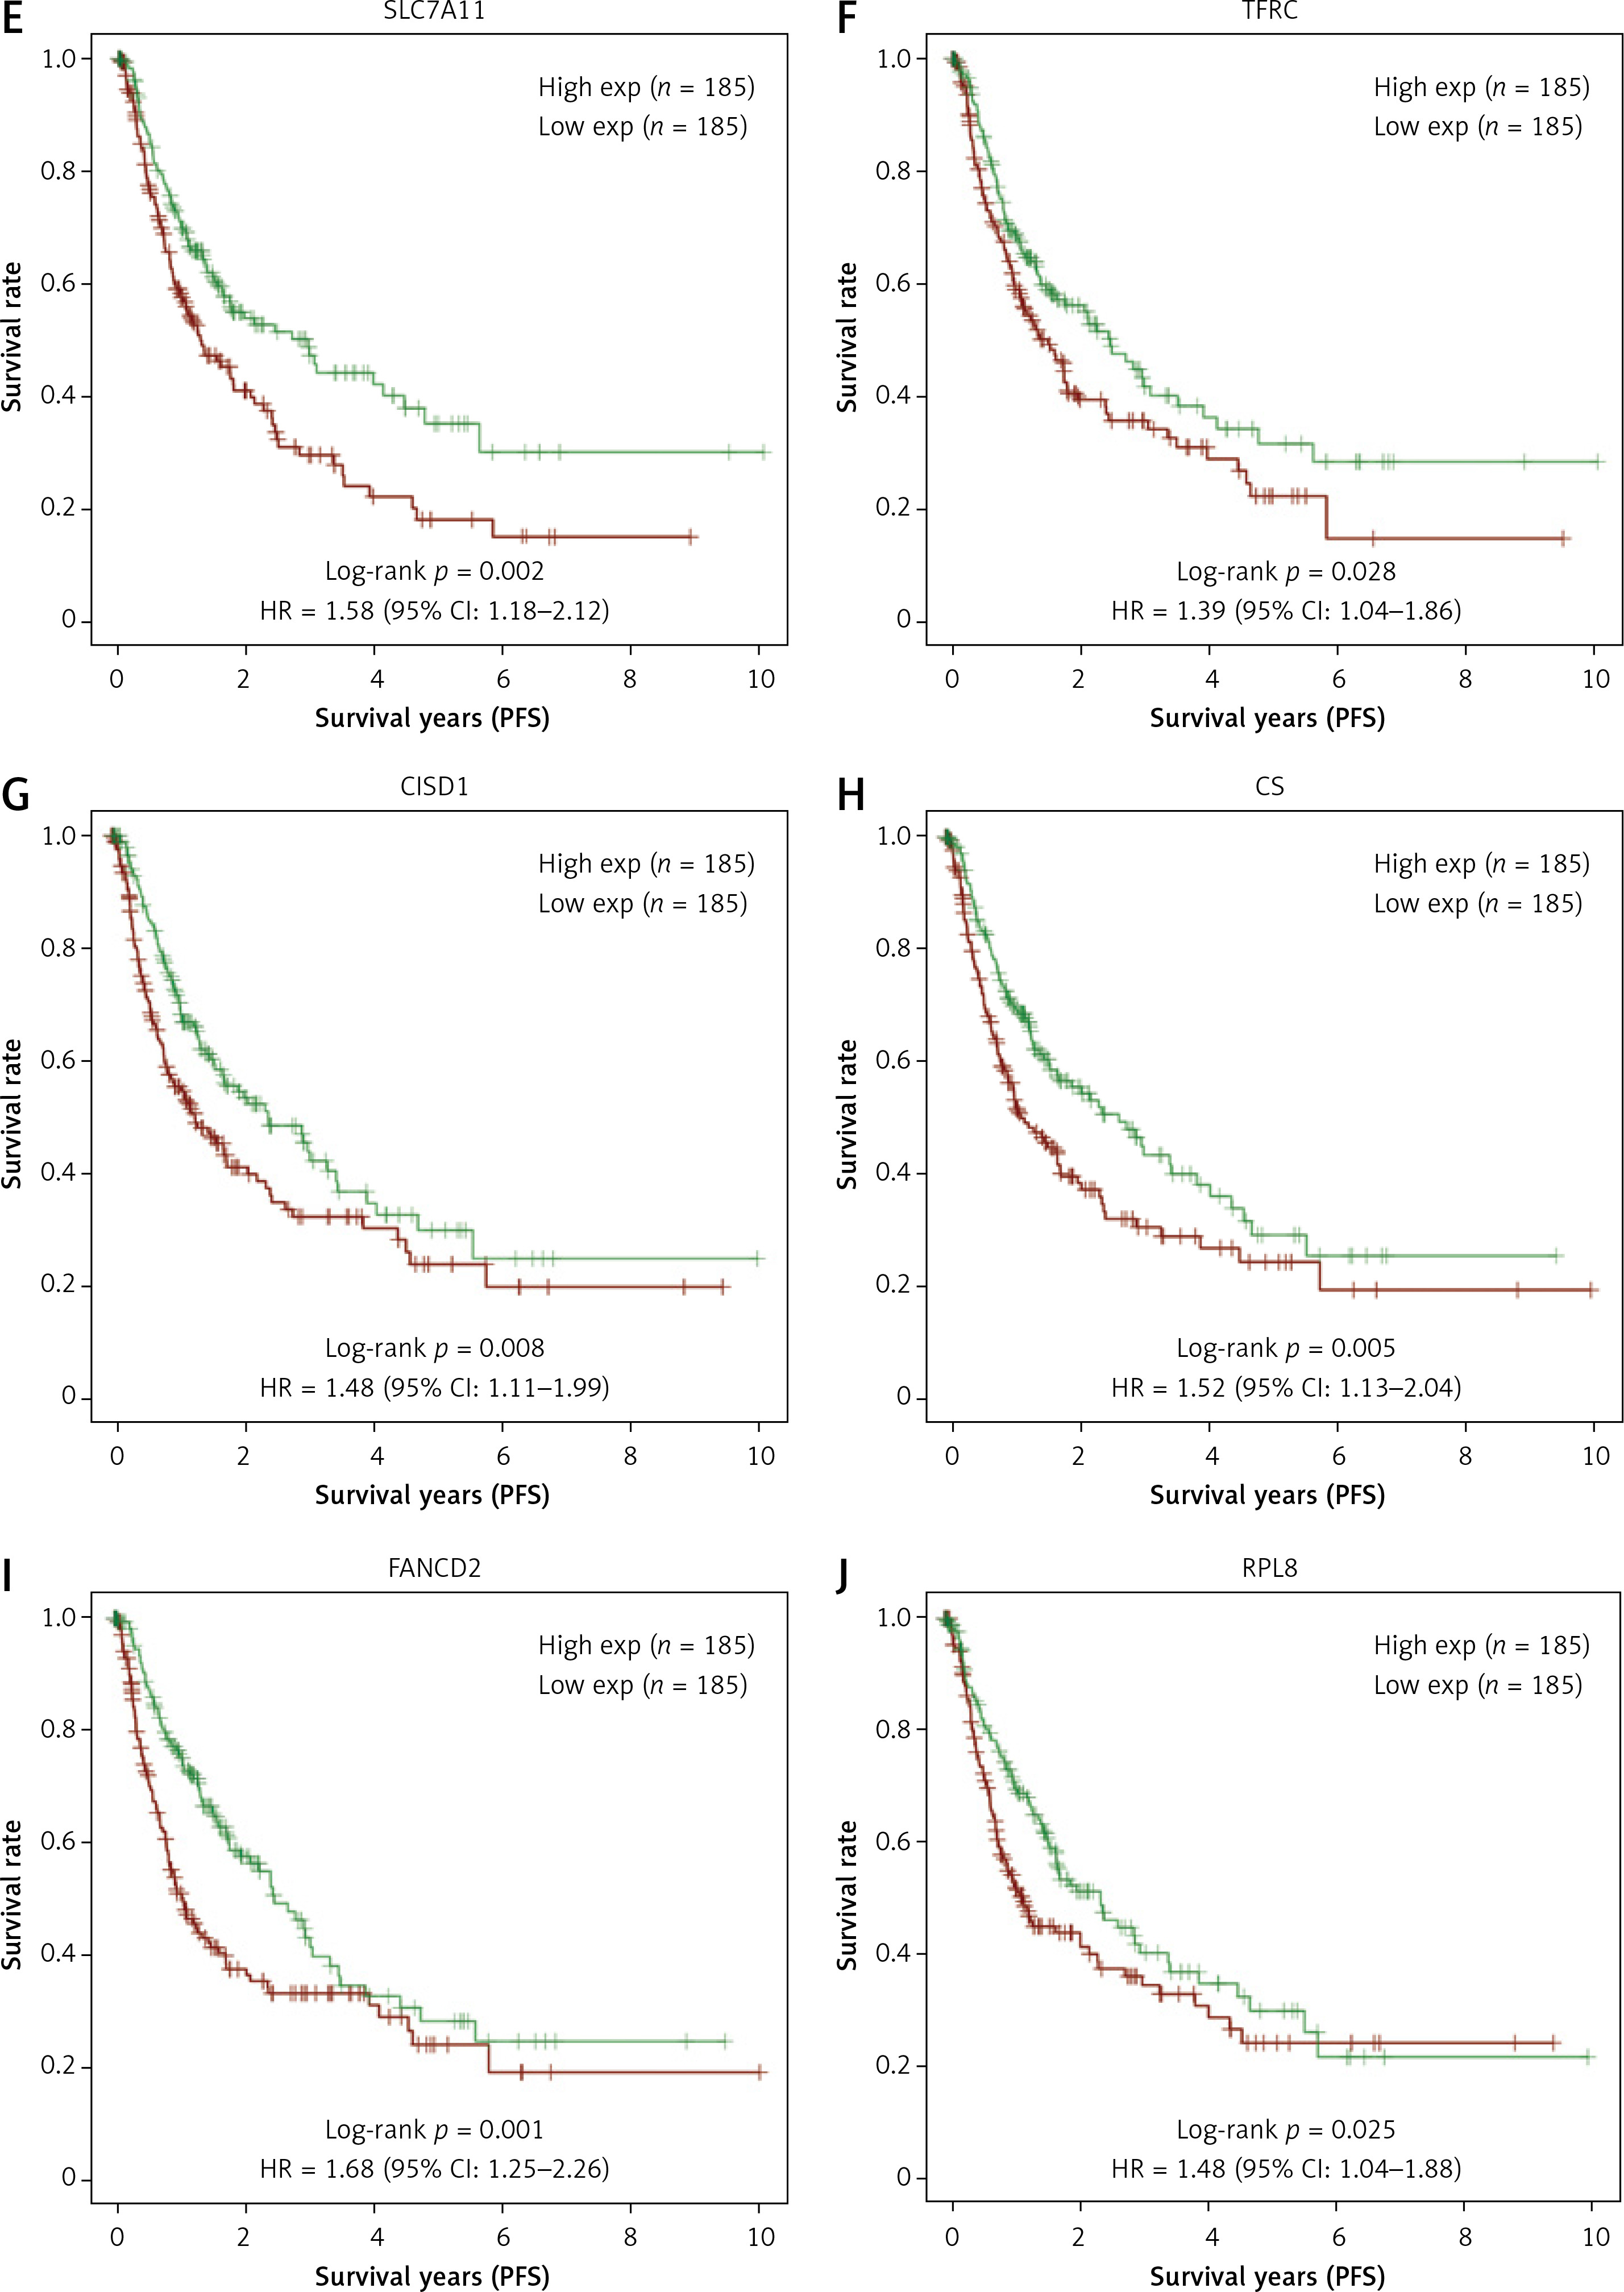
Twenty-two FRGs were differentially expressed in TCGA-LIHC samples, as shown in Figure 1 A. Subsequent KEGG analysis showed the enrichment of these genes, including ferroptosis, thyroid cancer, central carbon metabolism in cancer, etc. (Figure 1 B). Within the GO terms, the FRGs were predominantly enriched in processes such as long-chain fatty acid metabolic process, PERK-mediated unfolded protein response, etc. (Figure 1 C). Further PPI analysis was conducted on the 22 differentially expressed FRGs, revealing potential interplay among these genes (Figure 1 D). Finally, survival analysis identified 6 FRGs (SLC7A11, TFRC, CISD1, CS, FANCD2, RPL8) that were significantly correlated with the outcome of HCC patients, and elevated expression of these 6 genes was associated with a lower chance of PFS in patients (Figures 1 E–J).
Figure 1
Differential expression, functional enrichment and survival analysis of FRGs in LIHC. A – The heatmap illustrates the manifestation patterns of 22 FRGs in both normal and tumor tissues. The color scale, located in the upper right corner, indicates expression levels, with red representing high expression and blue representing low expression. B, C – Scatter plots depict the findings of KEGG pathway (B) and GO term enrichment analysis for FRGs. The y-axis displays the enriched KEGG pathways or GO terms, and the x-axis shows the gene ratio. The size of each data point corresponds to the number of FRGs within each KEGG pathway or GO term. The size of each dot represents the number of genes associated with each term, with colors indicating the significance level (p-value). D – The PPI network analysis represents interactions among FRG-encoded proteins or protein domains. E–J – Batch PFS survival analysis of SLC7A11, TFRC, CISD1, CS, FANCD2 and RPL8, respectively
Analysis of the prognostic ability of 4 FRGs in the risk model in LIHC
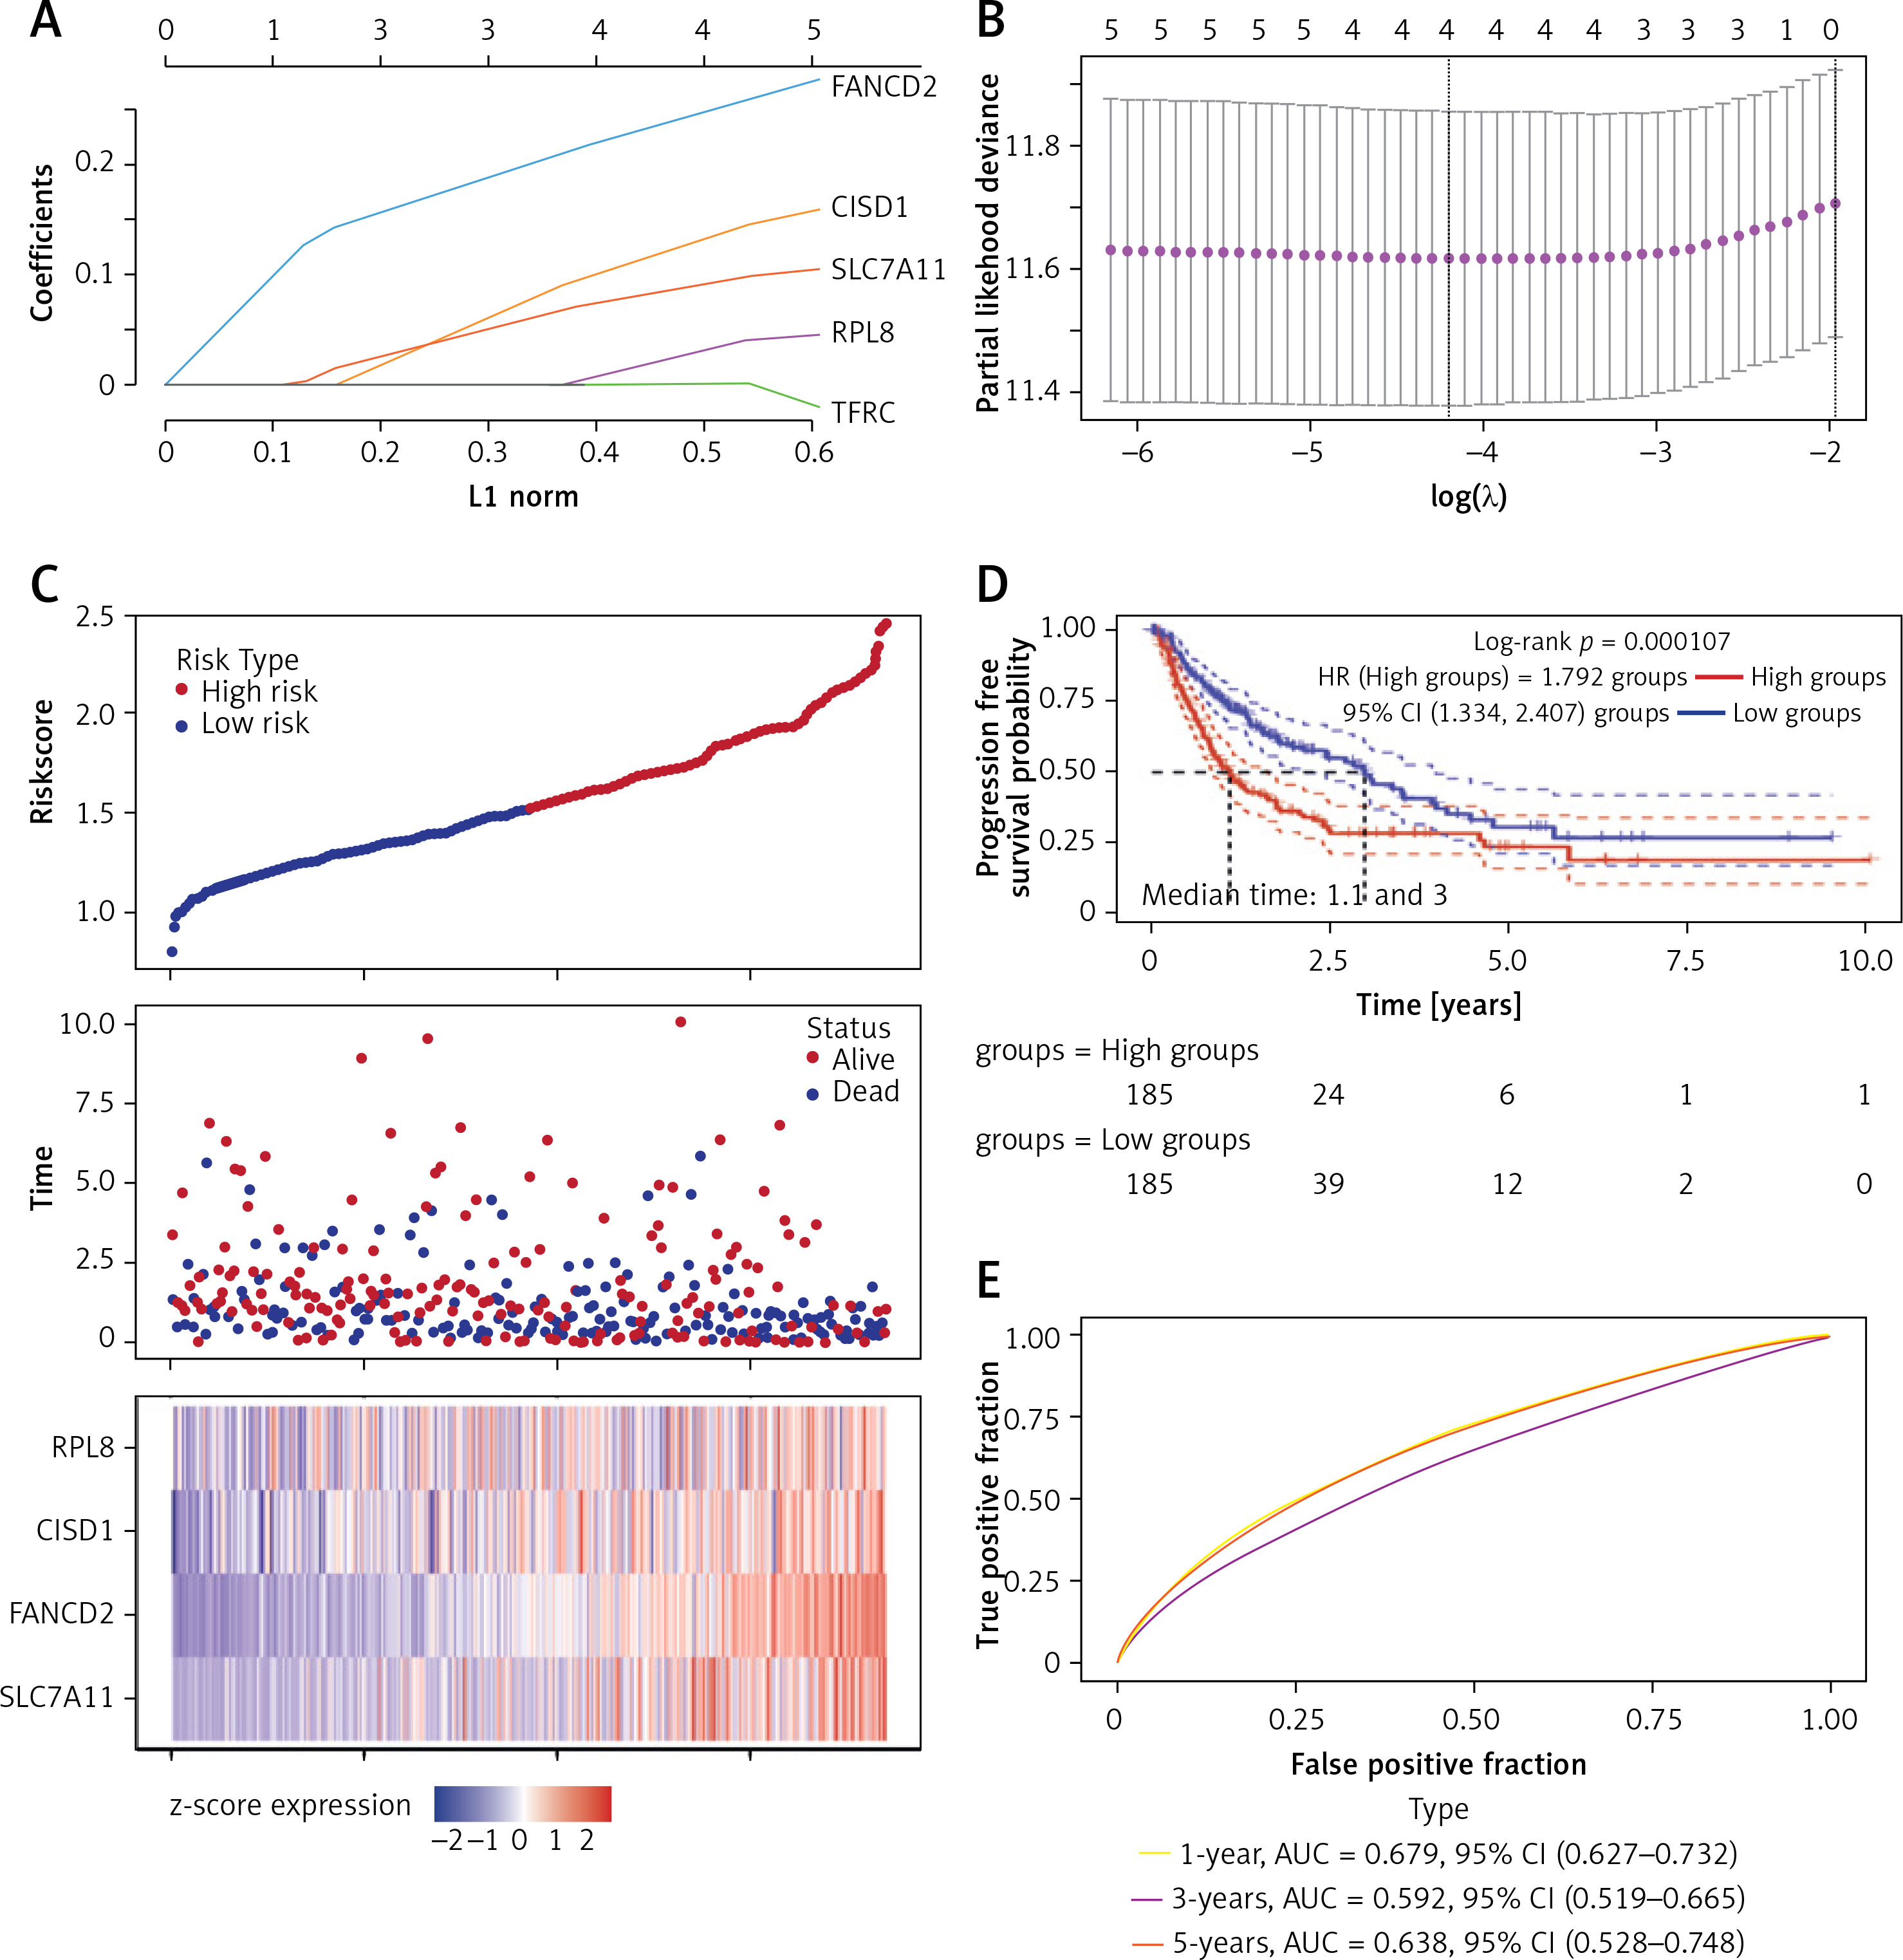
LASSO Cox regression analysis was employed to construct an ideal gene signature from 6 FRGs, with the gene CS not showing significant results (Figures 2 A, B). The 10-fold cross-validation method identified four genes (SLC7A11, FANCD2, CISD1, and RPL8) in the risk score model construction. In the risk model, higher risk scores were associated with shorter survival and increased mortality in high-risk patient groups. Notably, the expression of these four genes also showed significant differences (Figure 2 C). Individuals in the high-risk category had significantly shorter PFS than those in the low-risk category, according to subsequent KM survival curves (p = 0.000107) (Figure 2 D). Additionally, the ROC curve study demonstrated the precision of the risk model in forecasting PFS over 1, 3, and 5 years, emphasizing its potential clinical application (Figure 2 E).
Figure 2
LASSO and risk score analyses of FRGs. A – The coefficient spectrum obtained through LASSO regression analysis for FRGs. Each line represents a gene. B – Tenfold cross-validation for LASSO regression to determine the optimal lambda (λ) value. Red dots represent the partial likelihood deviance for different values of log(λ), while the gray lines denote the standard error. The vertical dotted lines indicate the lambda values with minimum error and one standard error from the minimum. C – Risk score analysis and patient survival status. The upper panel shows the distribution of risk scores for patients classified into high-risk and low-risk groups. The middle panel depicts the survival status of patients, with red dots indicating deceased patients and blue dots indicating alive patients. The lower panel presents a heatmap of the expression profiles for the four prognostic genes (RPL8, CISD1, FANCD2, SLC7A11), with color gradients representing the z-score of expression levels. D – The survival curves represent Kaplan-Meier analysis for the four prognostic genes. The x-axis denotes time in years, and the y-axis indicates PFS probability. E – ROC curves of the risk model in 1 year, 3 years and 5 years. The curves in different colors represent the AUC values in different time periods
Construction of predictive nomogram of RPL8 in HCC prognosis
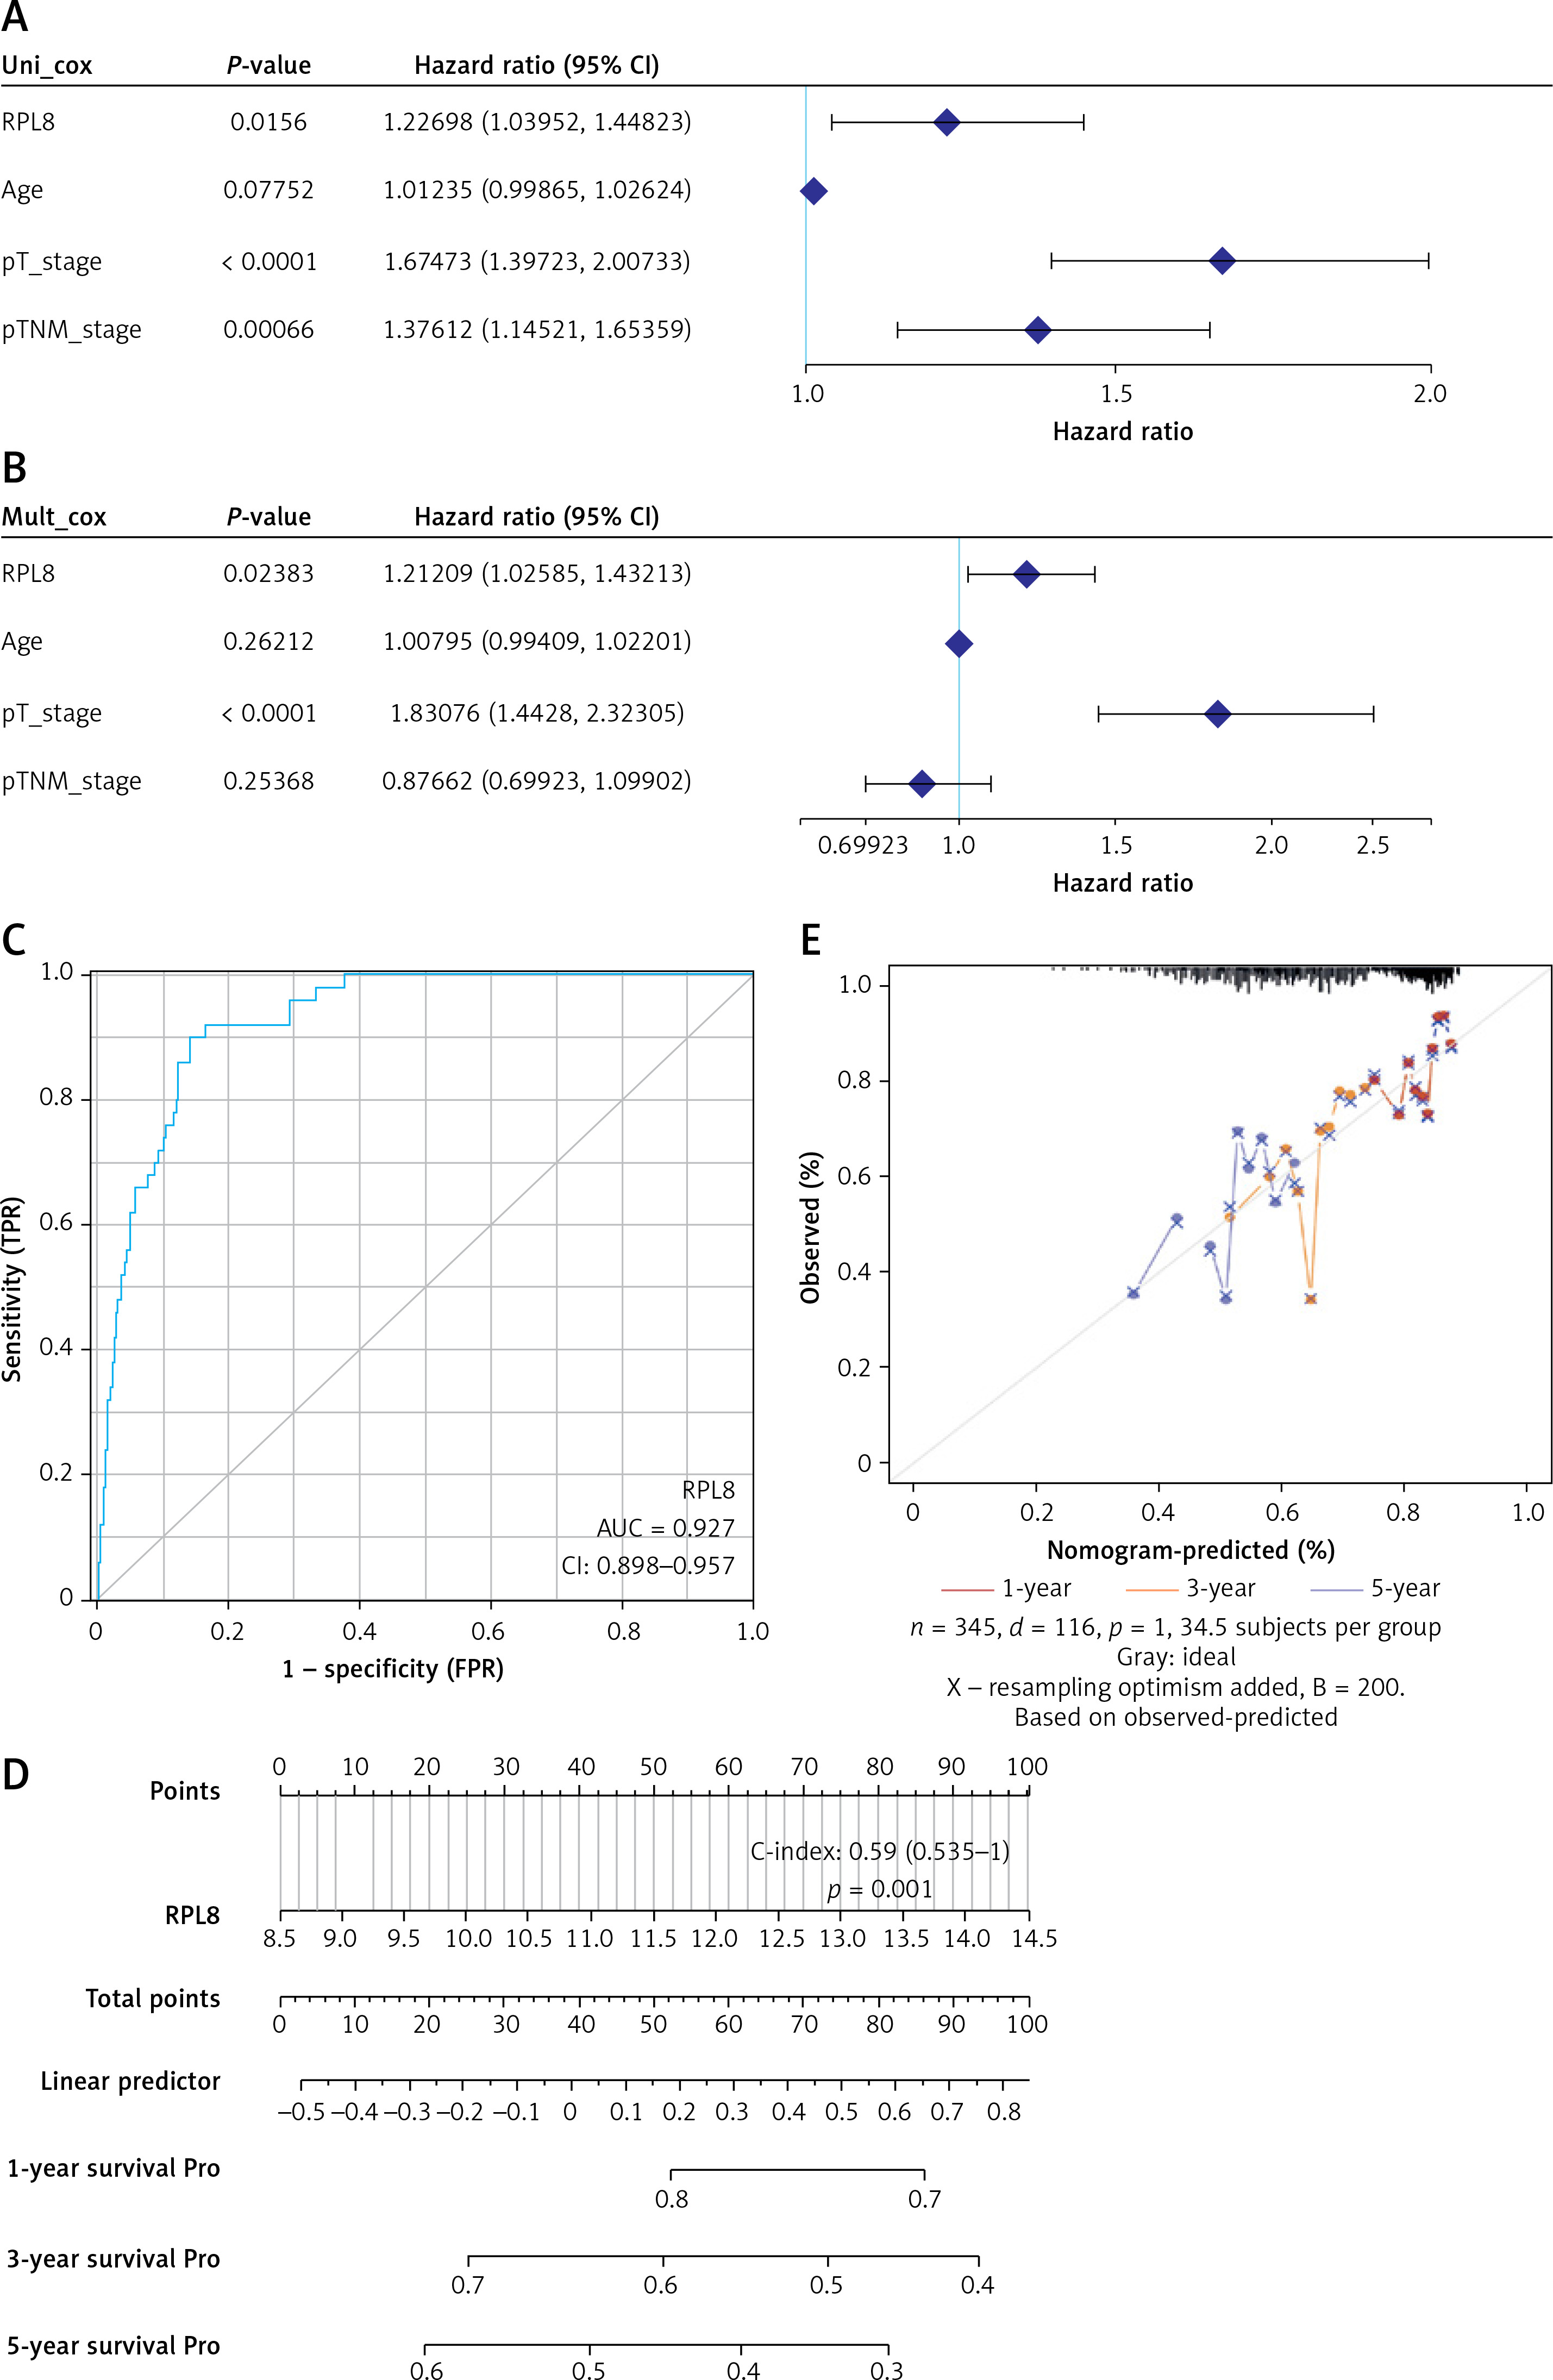
After analysis by univariate and multivariate Cox regression, RPL8 was determined as a separate predictor of the prognosis of HCC (Figures 3 A, B). The ROC curve indicated that RPL8 had a better prognosis prediction effect in HCC (Figure 3 C). As shown in Figure 3 D, the 1-, 3-, and 5-year survival possibilities of HCC individuals were anticipated by the nomogram. Next, utilizing the calibration curve, the generated nomogram’s prediction accuracy was confirmed, as shown in Figure 3 E.
Figure 3
Prognostic nomogram analysis of RPL8 in HCC. A, B – Results of univariate and multivariate Cox regression analyses, respectively, assessing the prognostic significance of RPL8 in HCC. C – The ROC curve illustrates the analysis of RPL8 predictive power for HCC prognosis. D – The nomogram generates predictive calibration plots for 1-year, 3-year, and 5-year OS rates in HCC patients. E – Calibration curves compare predicted and actual survival outcomes, highlighting the robust predictive performance of the model for 1-year, 3-year, and 5-year OS in HCC patients
Correlation analysis between RPL8 levels and different clinical parameters of LIHC
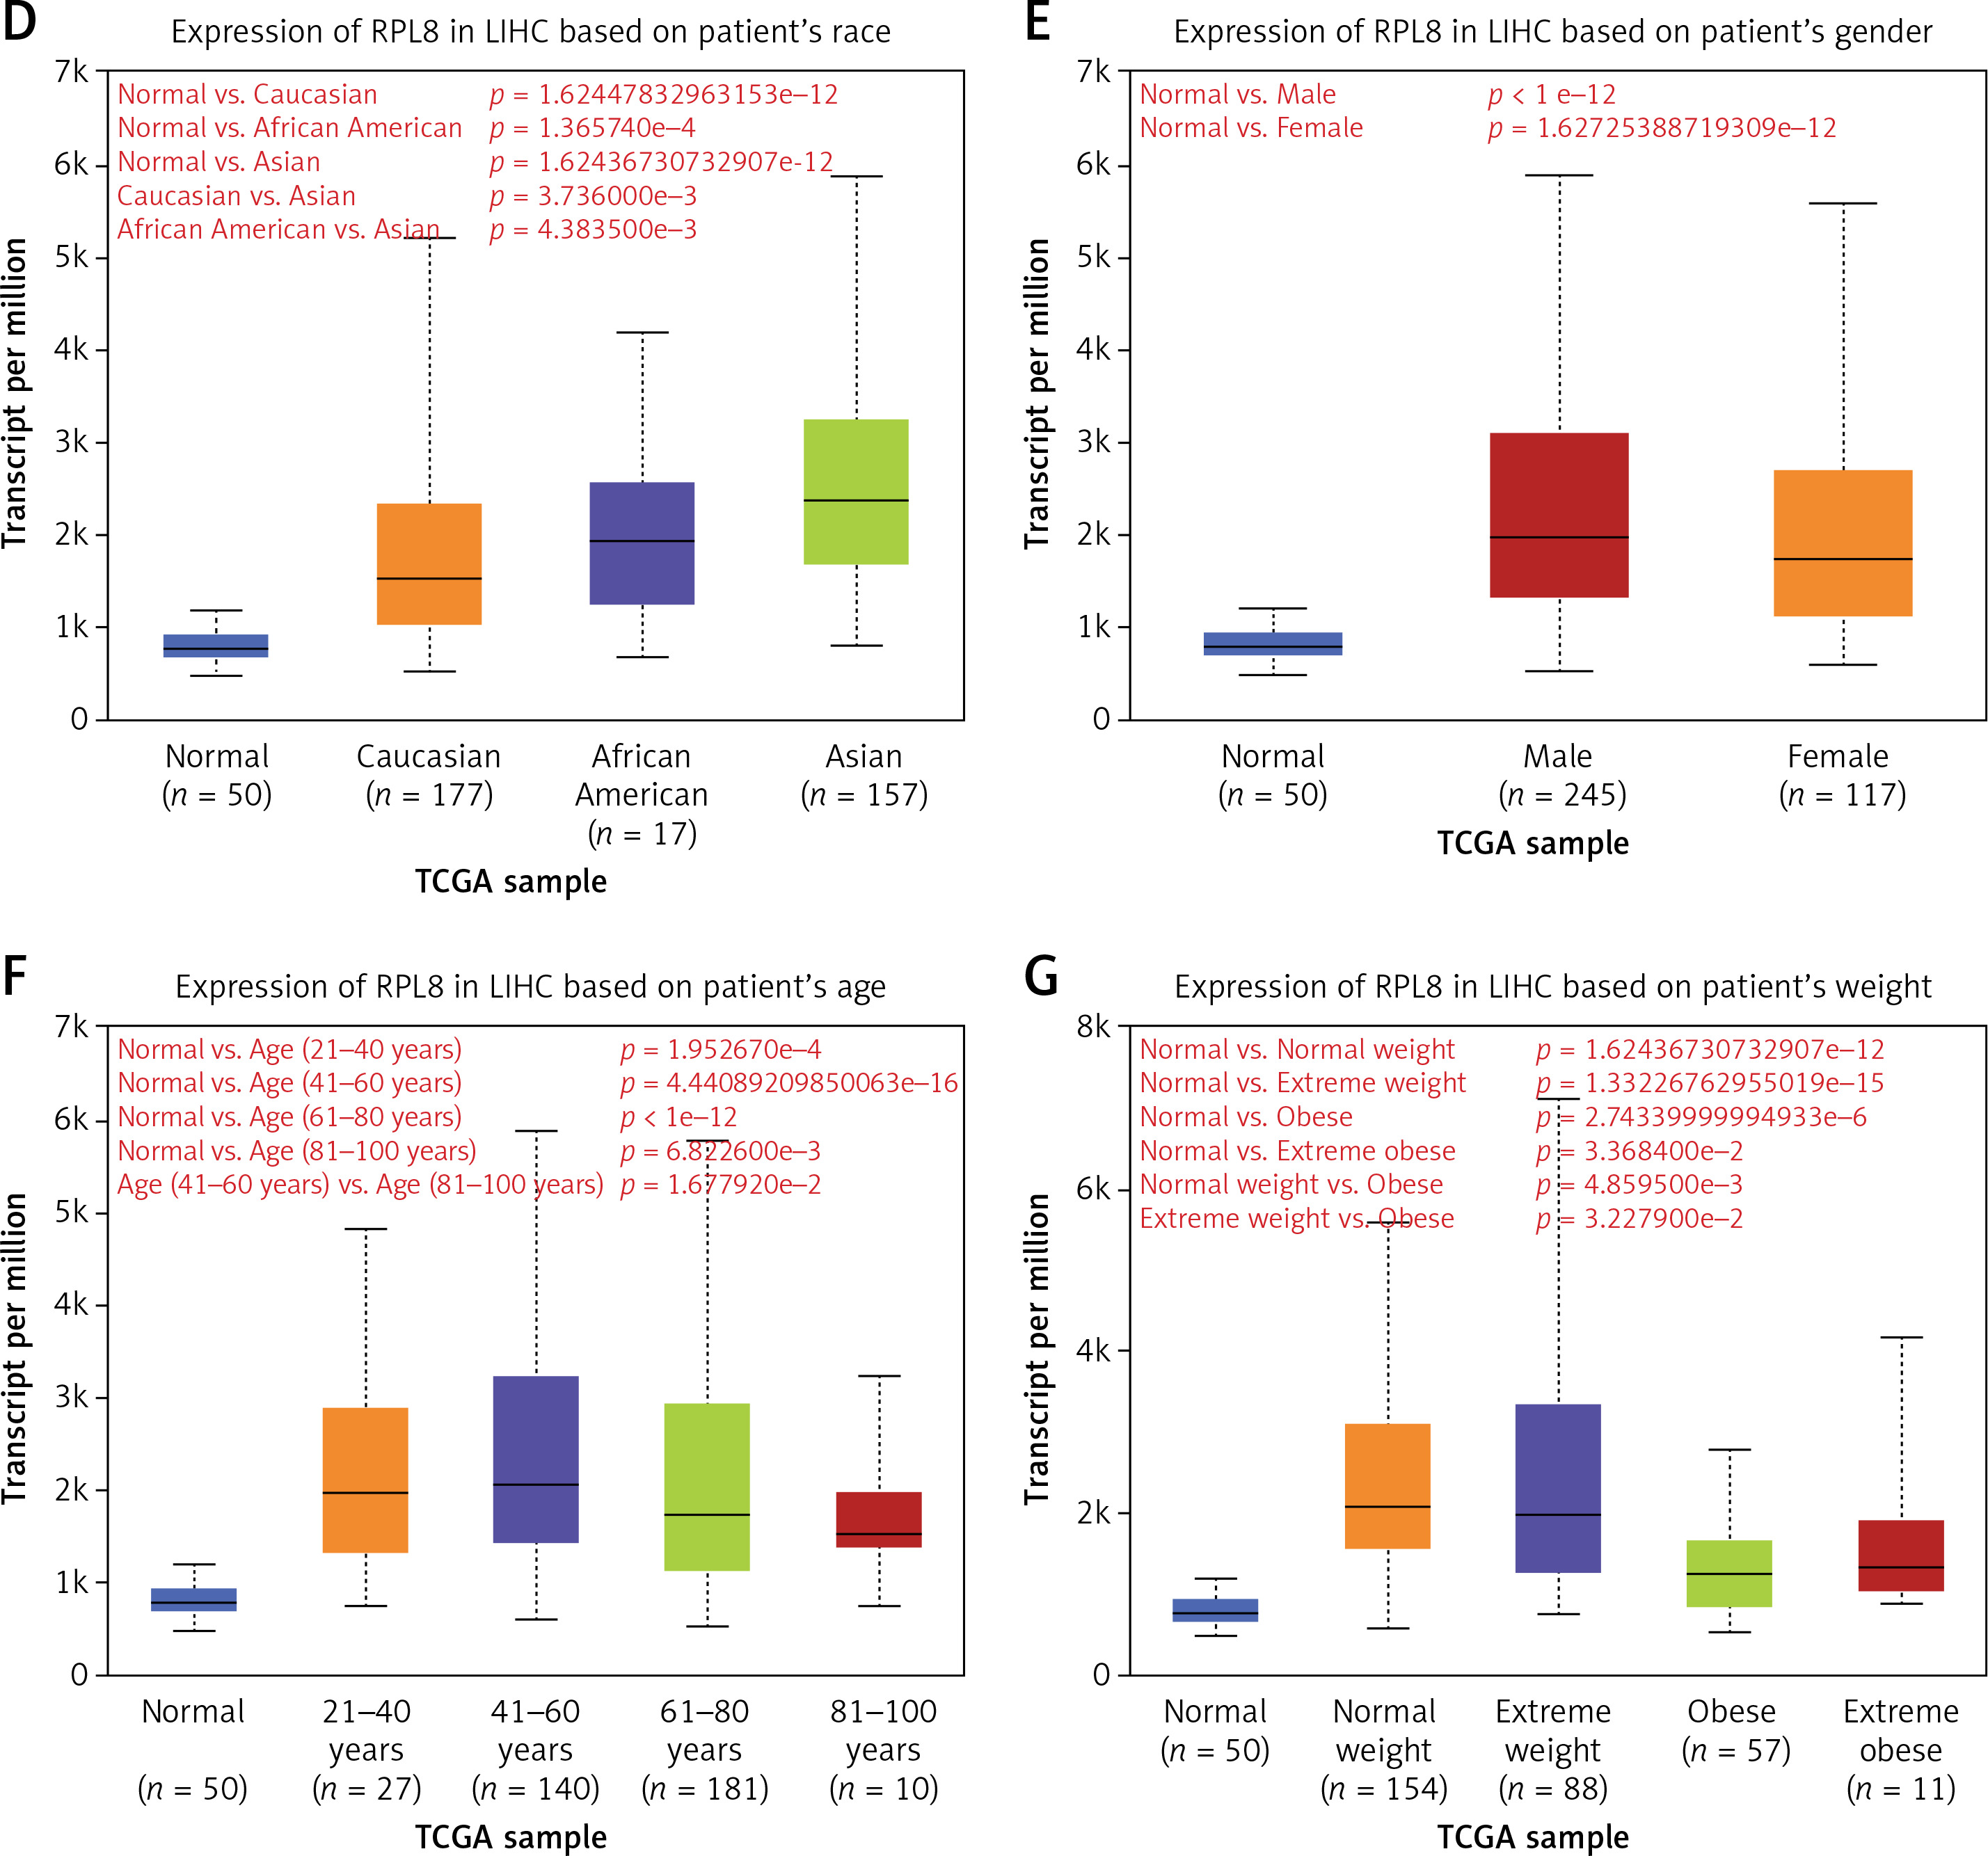
We examined RPL8 expression patterns across 33 cancer types to learn more about RPL8 in other malignancies. When compared to normal tissues from the same organs, RPL8 was found to be higher in most tumor tissues (Figure 4 A), suggesting its potential involvement in tumorigenesis. Subsequently, we investigated the association between RPL8 expression and the clinicopathological traits of LIHC. In primary tumors, RPL8 expression was higher than adjacent non-tumorous tissues (Figure 4 B). Significant variations in RPL8 expression were evident across different demographic and physiological groups: Caucasian versus Asian, African American versus Asian, and patients aged 41–60 years versus those 81–100 years, as well as between extreme weight and obese (Figures 4 D, F, G). However, no significant differences were observed in RPL8 expression according to individual cancer stages or patient’s gender (Figures 4 C, E).
Figure 4
Expression analysis of RPL8 in UALCAN database. A – The boxplot illustrates the comparison of RPL8 expression levels in pan-cancers. The x-axis represents 33 cancer types. Gene expression levels are displayed on the y-axis, with red indicating tumor tissues and green representing normal tissues. B–C – Boxplots depict RPL8 expression in TCGA-LIHC specimens based on different sample types (B), individual cancer stages (C). ***P < 0.01, ns means not significant. D–G – race (D), gender (E), age (F), and weight groups (G), respectively. ***P < 0.01, ns means not Significant
RPL8 regulates malignant growth of HCC cells in vivo and in vitro
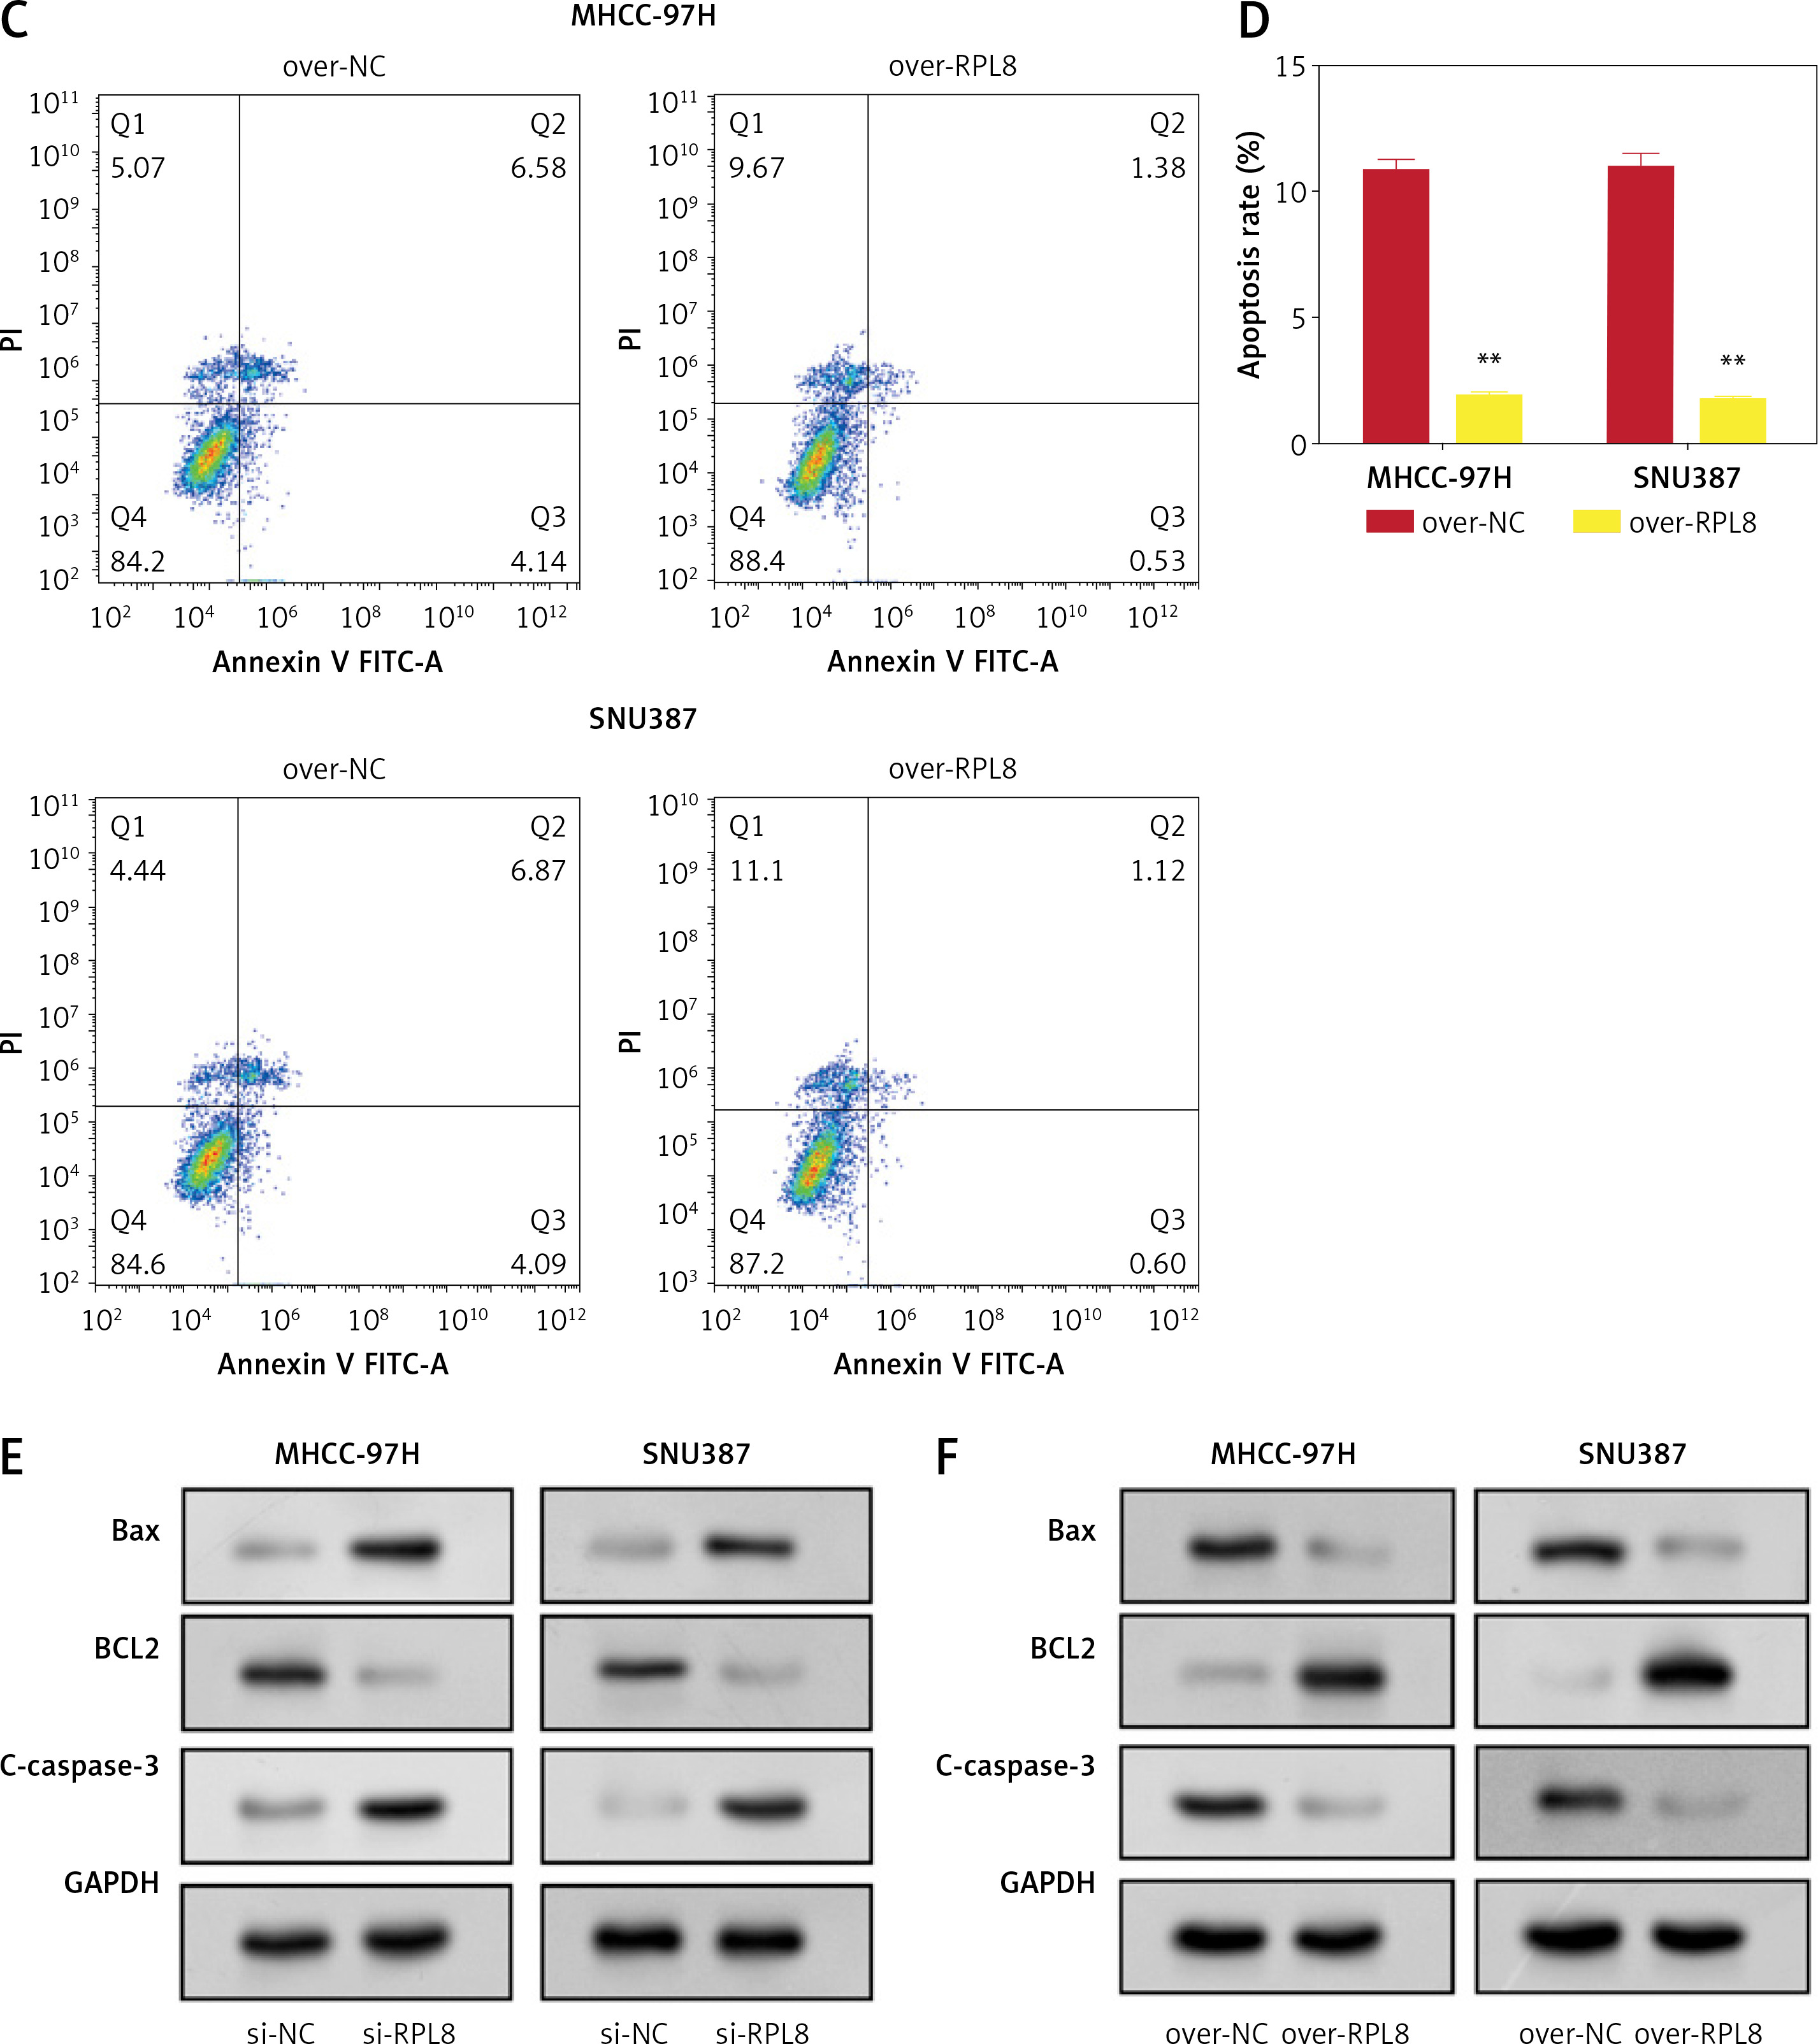
Analysis of the HPA database revealed elevated levels of RPL8 protein in HCC tissues in contrast to normal liver tissues (Figure 5 A). Furthermore, RPL8 was found to have elevated mRNA and protein levels in HCC cell lines, especially in MHCC-97H and SNU387 cells (Figure 5 B). Therefore, these two cell lines were used for subsequent experimental analyses. RPL8 expression was successfully knocked down and overexpressed in MHCC-97H and SNU387 cells, respectively, with significant efficiency (Figures 5 C and 5 F). In vitro experiments showed that RPL8 knockdown can dramatically reduce the migration, invasion, and proliferation of cells (Figures 5 D, E, 6 A–D). In contrast, RPL8 overexpression promoted these processes (Figures 5 G, H, 6 E–H). Importantly, overexpression of RPL8 in knockout models partially or completely rescued the observed phenotype in knockout models, highlighting the potential therapeutic importance of RPL8 in HCC treatment strategies (Figure 7). Mouse xenograft experiments showed that tumor size and volume were reduced after RPL8 knockdown (Figures 6 I, J). In addition, through flow cytometry and WB experiments (Figures 8 A–F), silencing RPL8 was noted to enhance apoptosis in HCC cells, indicated by reduced Bcl-2 expression and elevated levels of the pro-apoptotic proteins cleaved caspase-3 and Bax. Overexpression of RPL8 produced the opposite effect. Our results validated that RPL8 can serve as a key regulator of HCC progression and participate in the regulation of cell behaviors related to tumor development in vivo and in vitro.
Figure 5
Knockdown and over-expression effect of RPL8 on proliferation of HCC cells. A – Detection of RPL8 protein expression in HCC samples of normal and malignant tissue using the HPA dataset. B – qPCR and WB analyses are presented to measure RPL8 mRNA and protein levels in liver cancer cell lines. C – qPCR and WB to assess the effect of RPL8 knockdown in hepatocellular carcinoma cell lines MHCC-97H and SNU387. Si-NC as controls. D, E – The CCK-8 assay is employed to assess the effect of RPL8 knockdown on the proliferation potential of MHCC-97H and SNU387 cells. *P < 0.05, **p < 0.01. F – The overexpression efficiency of RPL8 in MHCC-97H and SNU387 was assessed by qPCR and WB. Cells transfected with a non-targeted overexpression construct (over-NC) were used as controls. G, H – Proliferation capacity of MHCC- 97H and SNU387 cells transfected with RPL8 overexpression plasmids assessed by CCK-8 assay. *P < 0.05, **p < 0.01
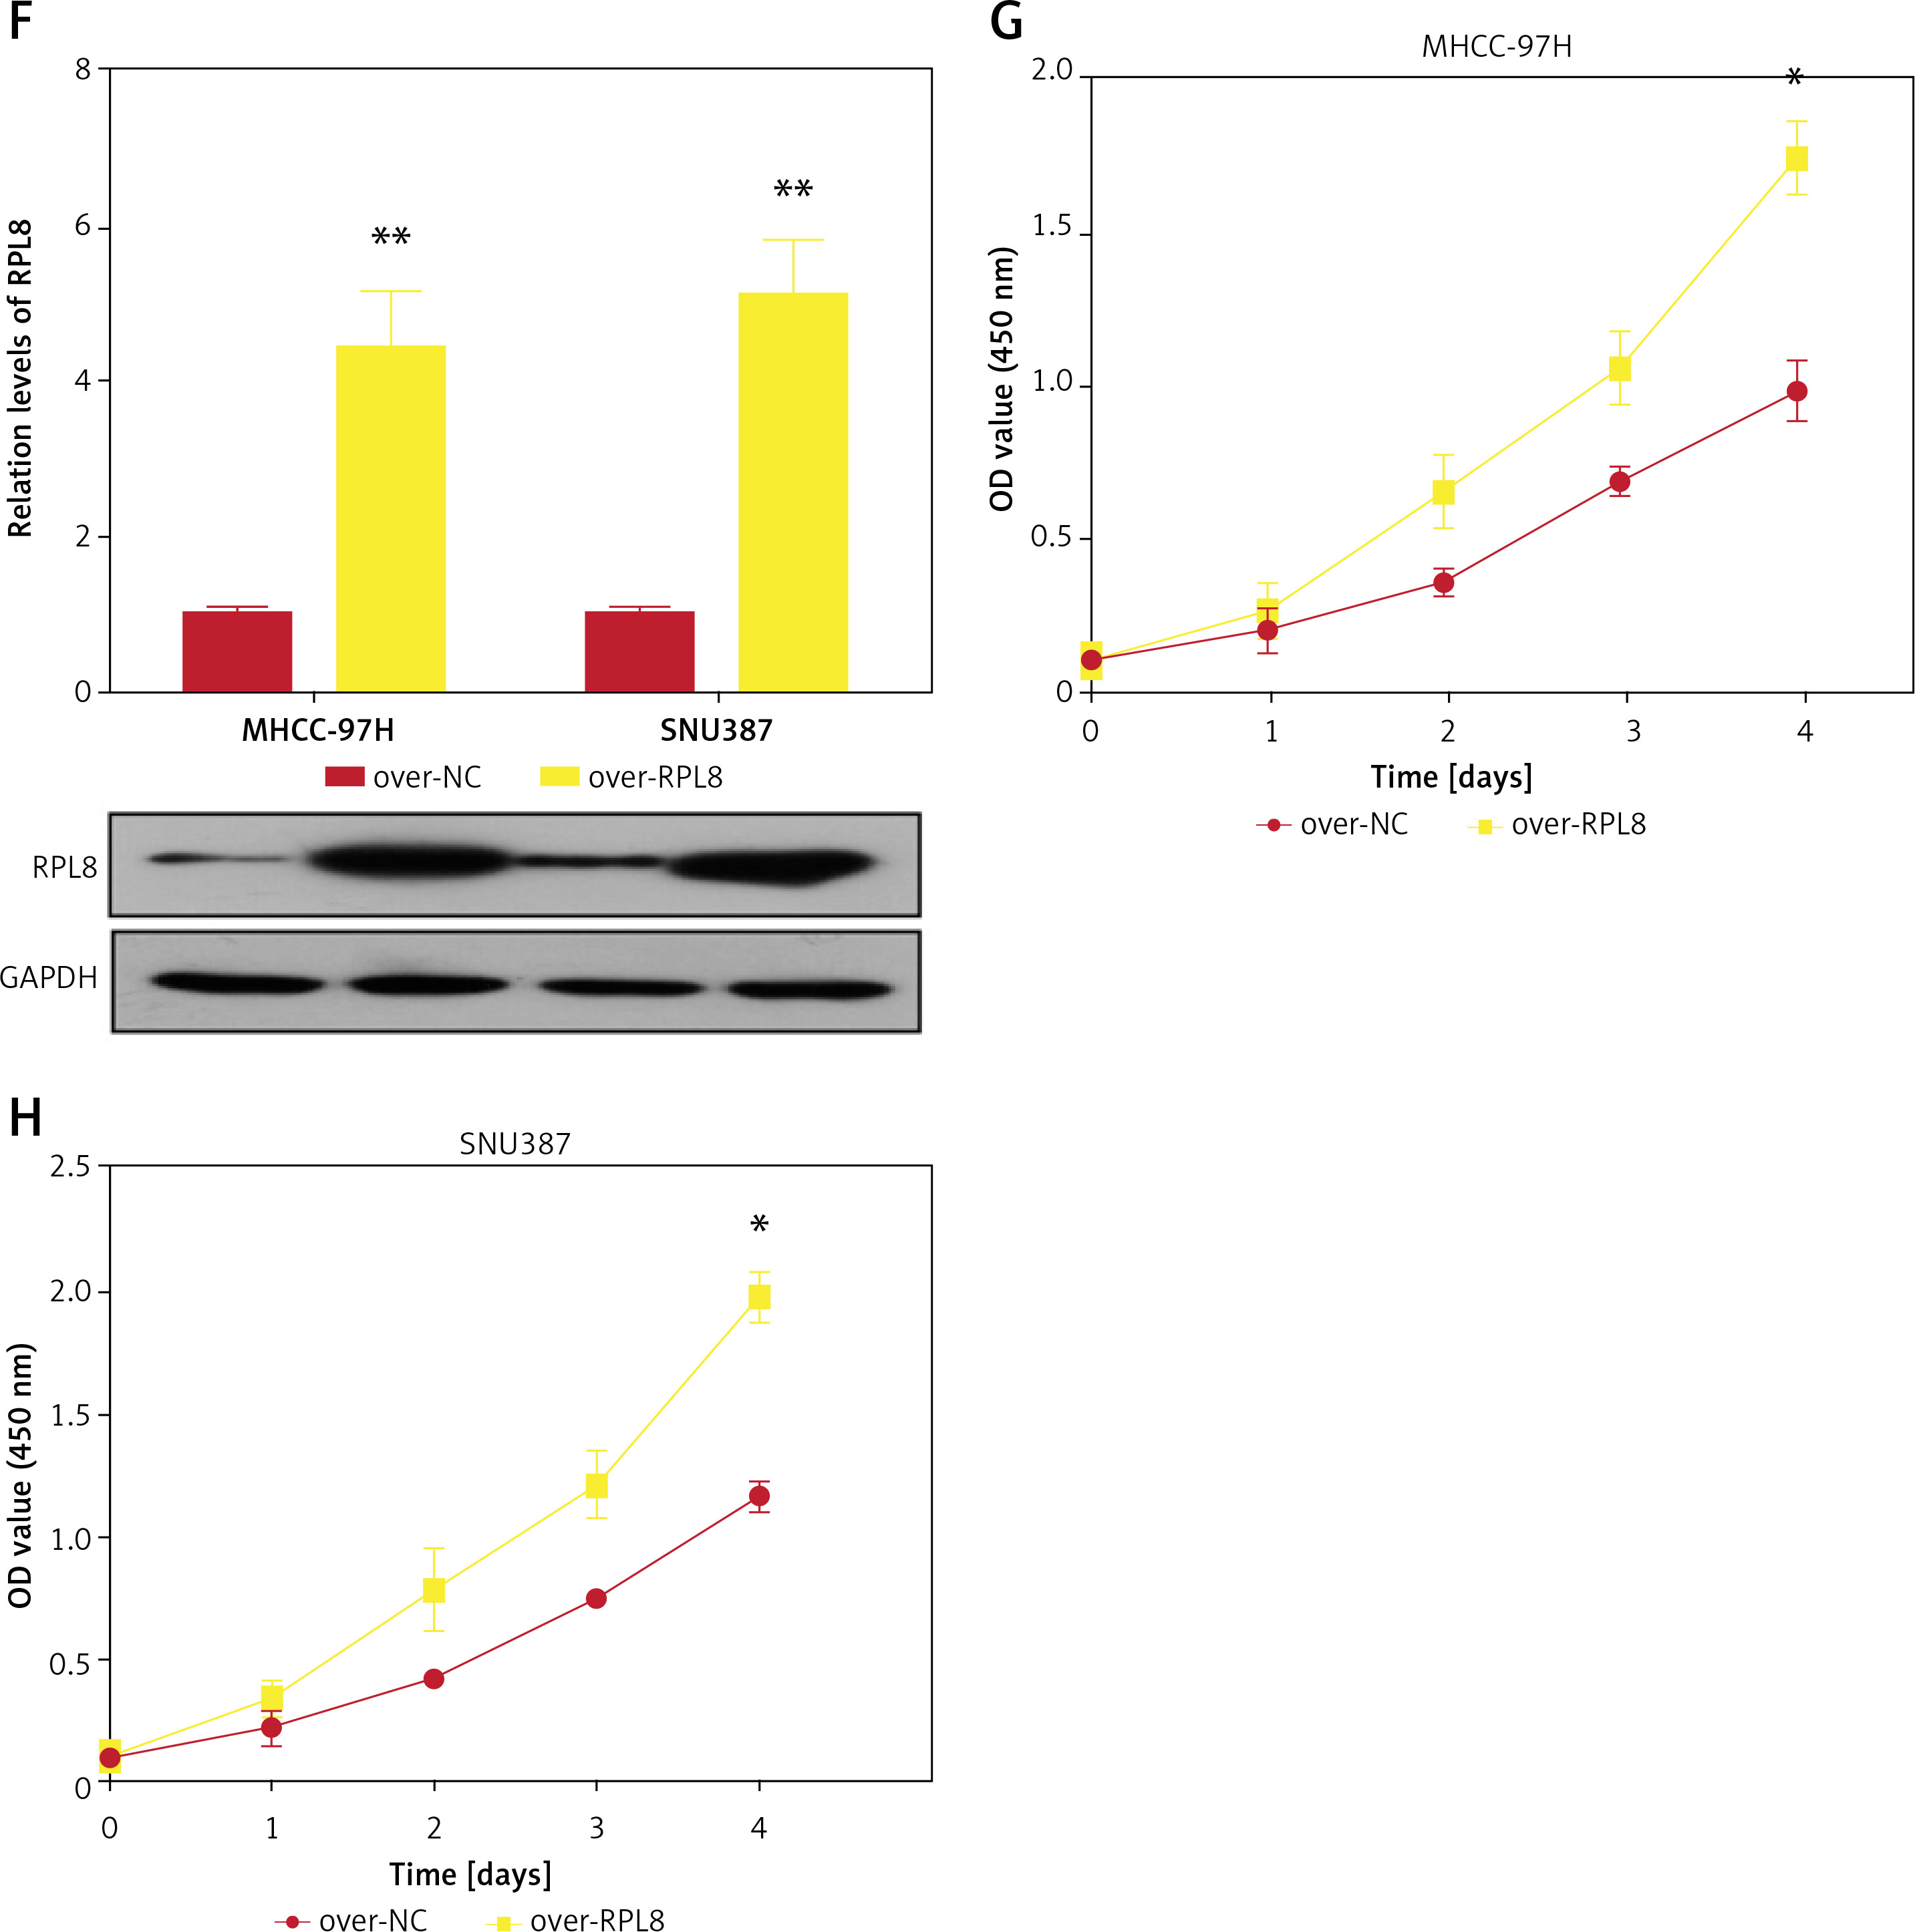
Figure 6
Impacts of RPL8 modulation on invasion, migration, and in vivo tumor growth in HCC cells. A–D – Transwell assays evaluating the impact of RPL8 knockdown on invasion (A, B) and migration (C, D) in MHCC-97H and SNU387 cells. Si-NC as controls. E–F – Transwell assays assessing the impact of RPL8 overexpression on invasion (E, F). Scale bars: 50 μm, *p < 0.05, **p < 0.01. G–H – Transwell assays assessing the impact of RPL8 overexpression on migration (G, H) in MHCC-97H and SNU387 cells. Over-NC were used as controls. I, J – Evaluation of the regulatory effect of RPL8 knockdown on tumor size and volume in vivo in a mouse model. Scale bars: 50 μm, *p < 0.05, **p < 0.01
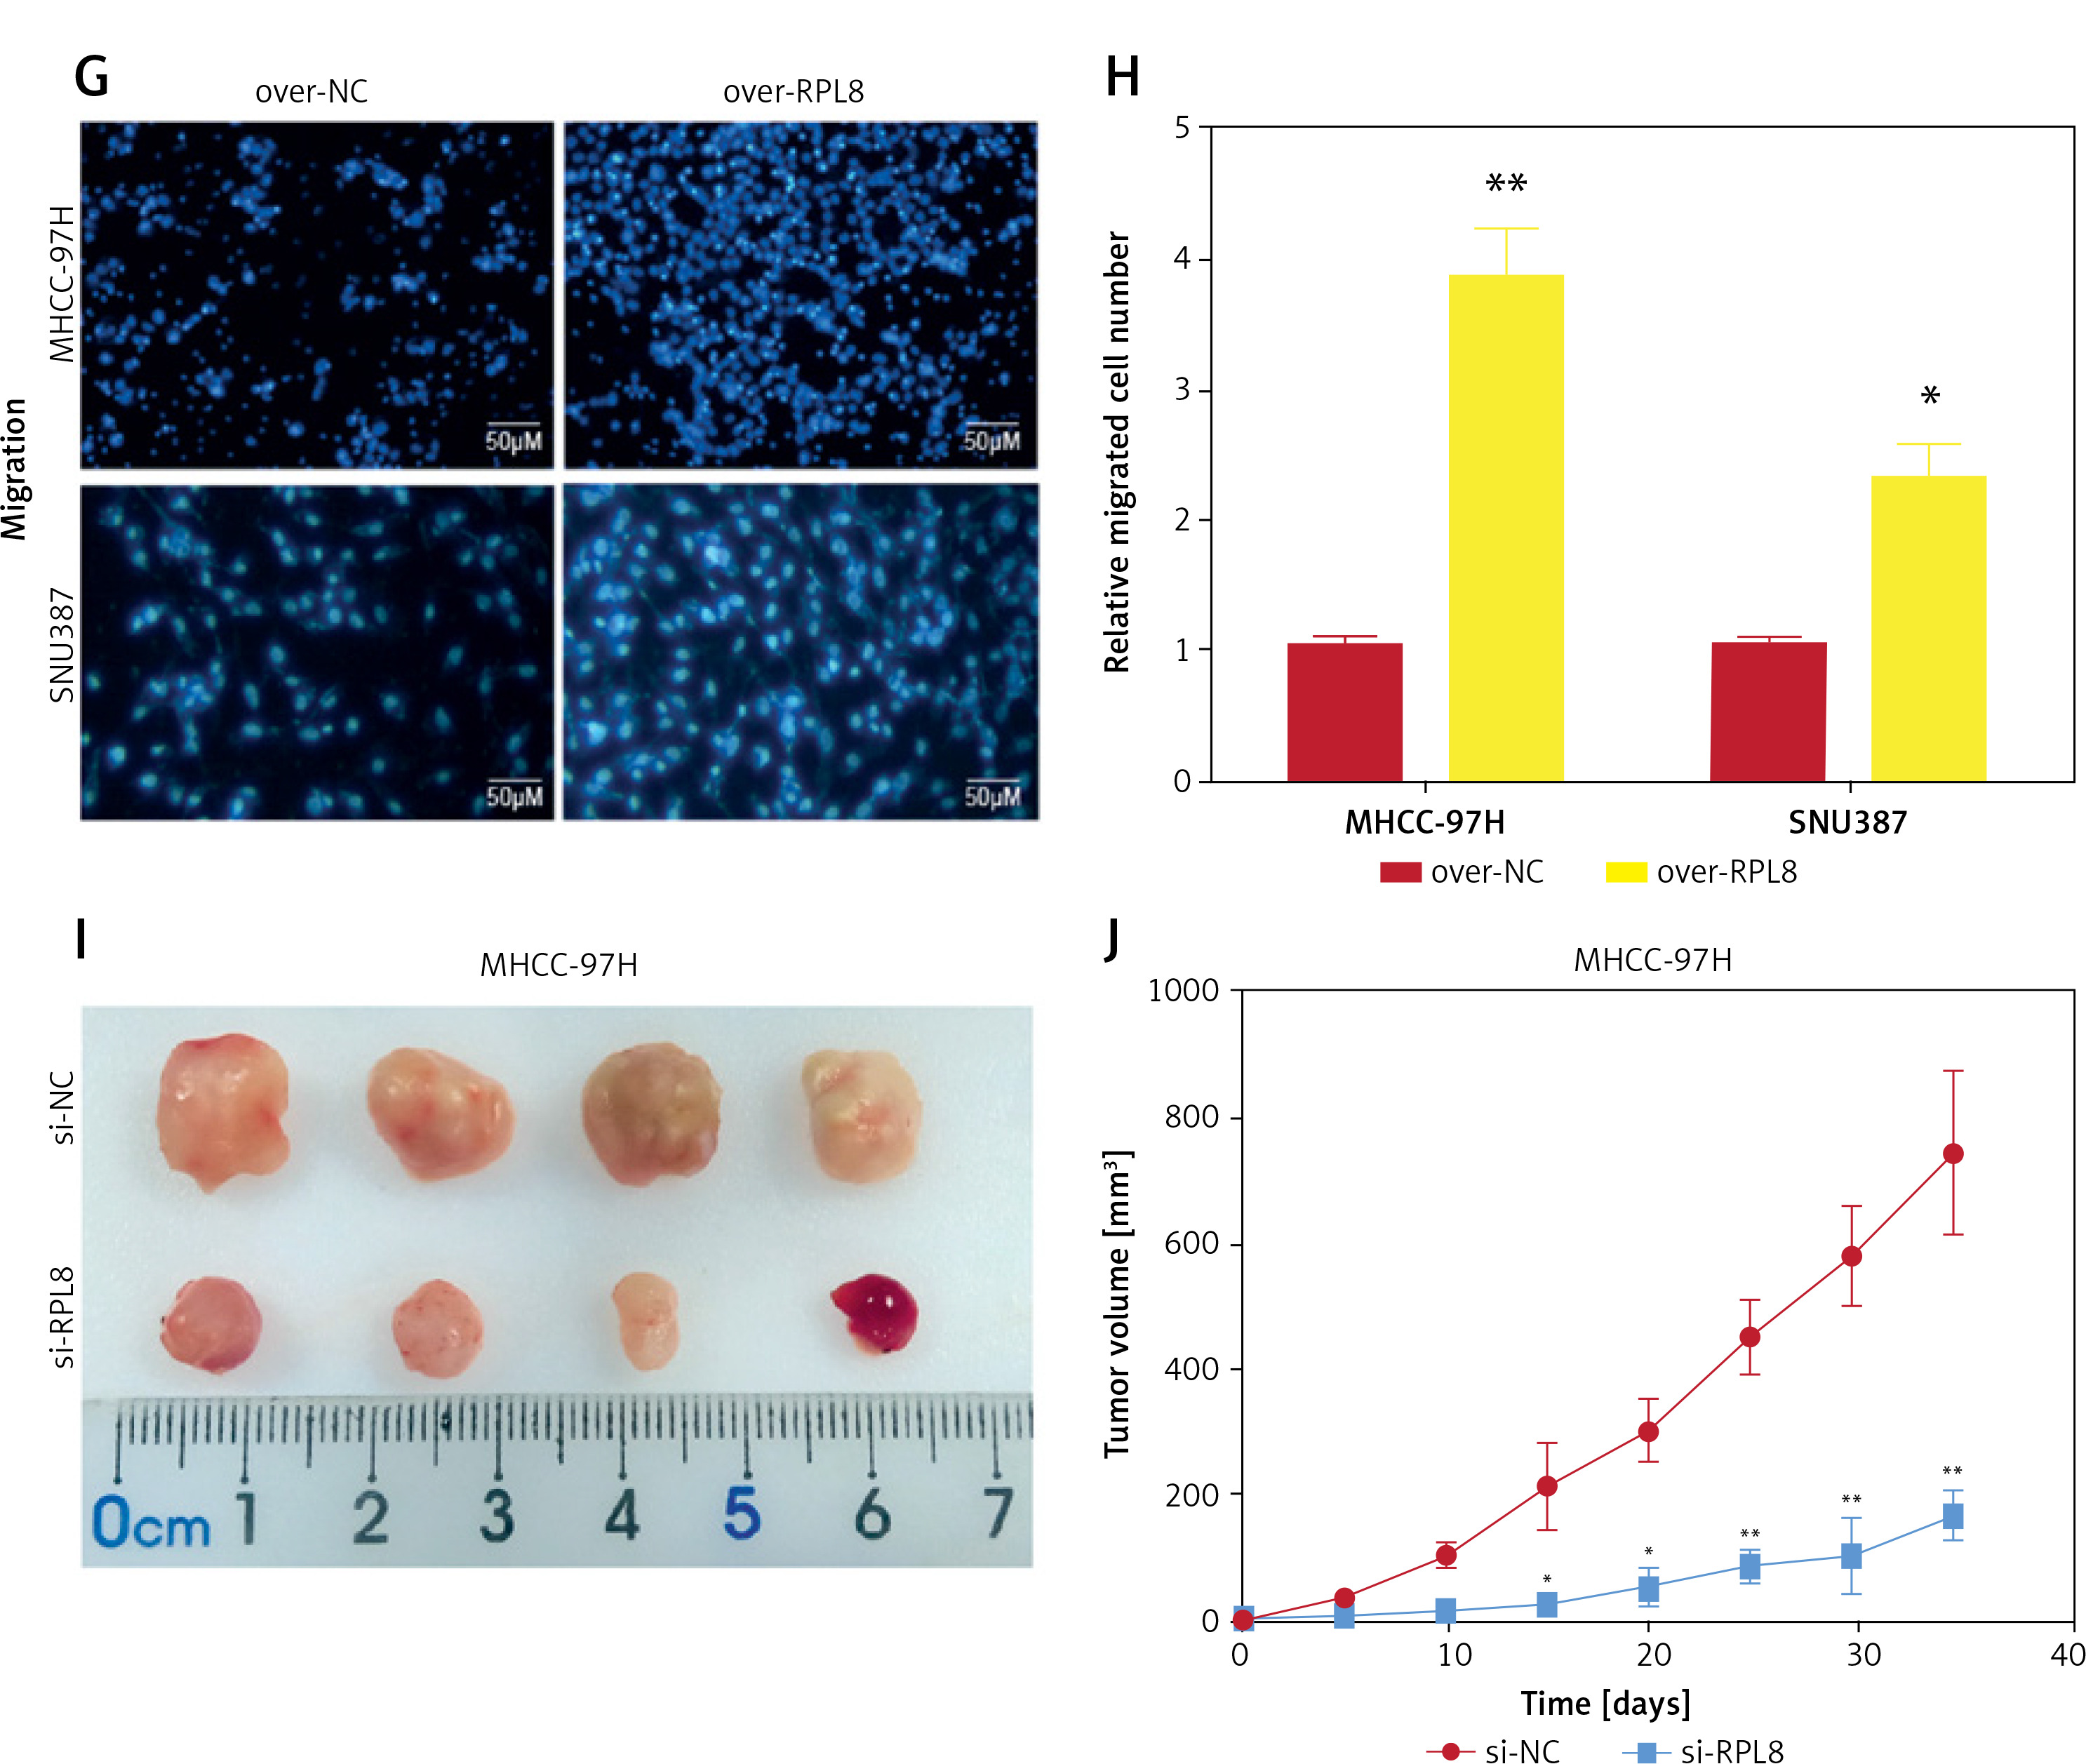
Figure 7
Rescue experiments on the role of RPL8 in regulating the phenotype of hepatocellular carcinoma cells. A, B – Proliferation curves of MHCC-97H and SNU-387 cells subjected to RPL8 knockdown (si-RPL8) and subsequent overexpression (over- RPL8), alongside non-targeting controls (si-NC and over-NC). C, D – Invasion capacity assessment in MHCC-97H and SNU-387 cells following the indicated RPL8 manipulations. Statistical significance is indicated by asterisks: *p < 0.05, **p < 0.01. E, F – Migration assays for MHCC-97H and SNU-387 cells under the same treatment conditions as the invasion assays. Statistical significance is indicated by asterisks: *p < 0.05, **p < 0.01
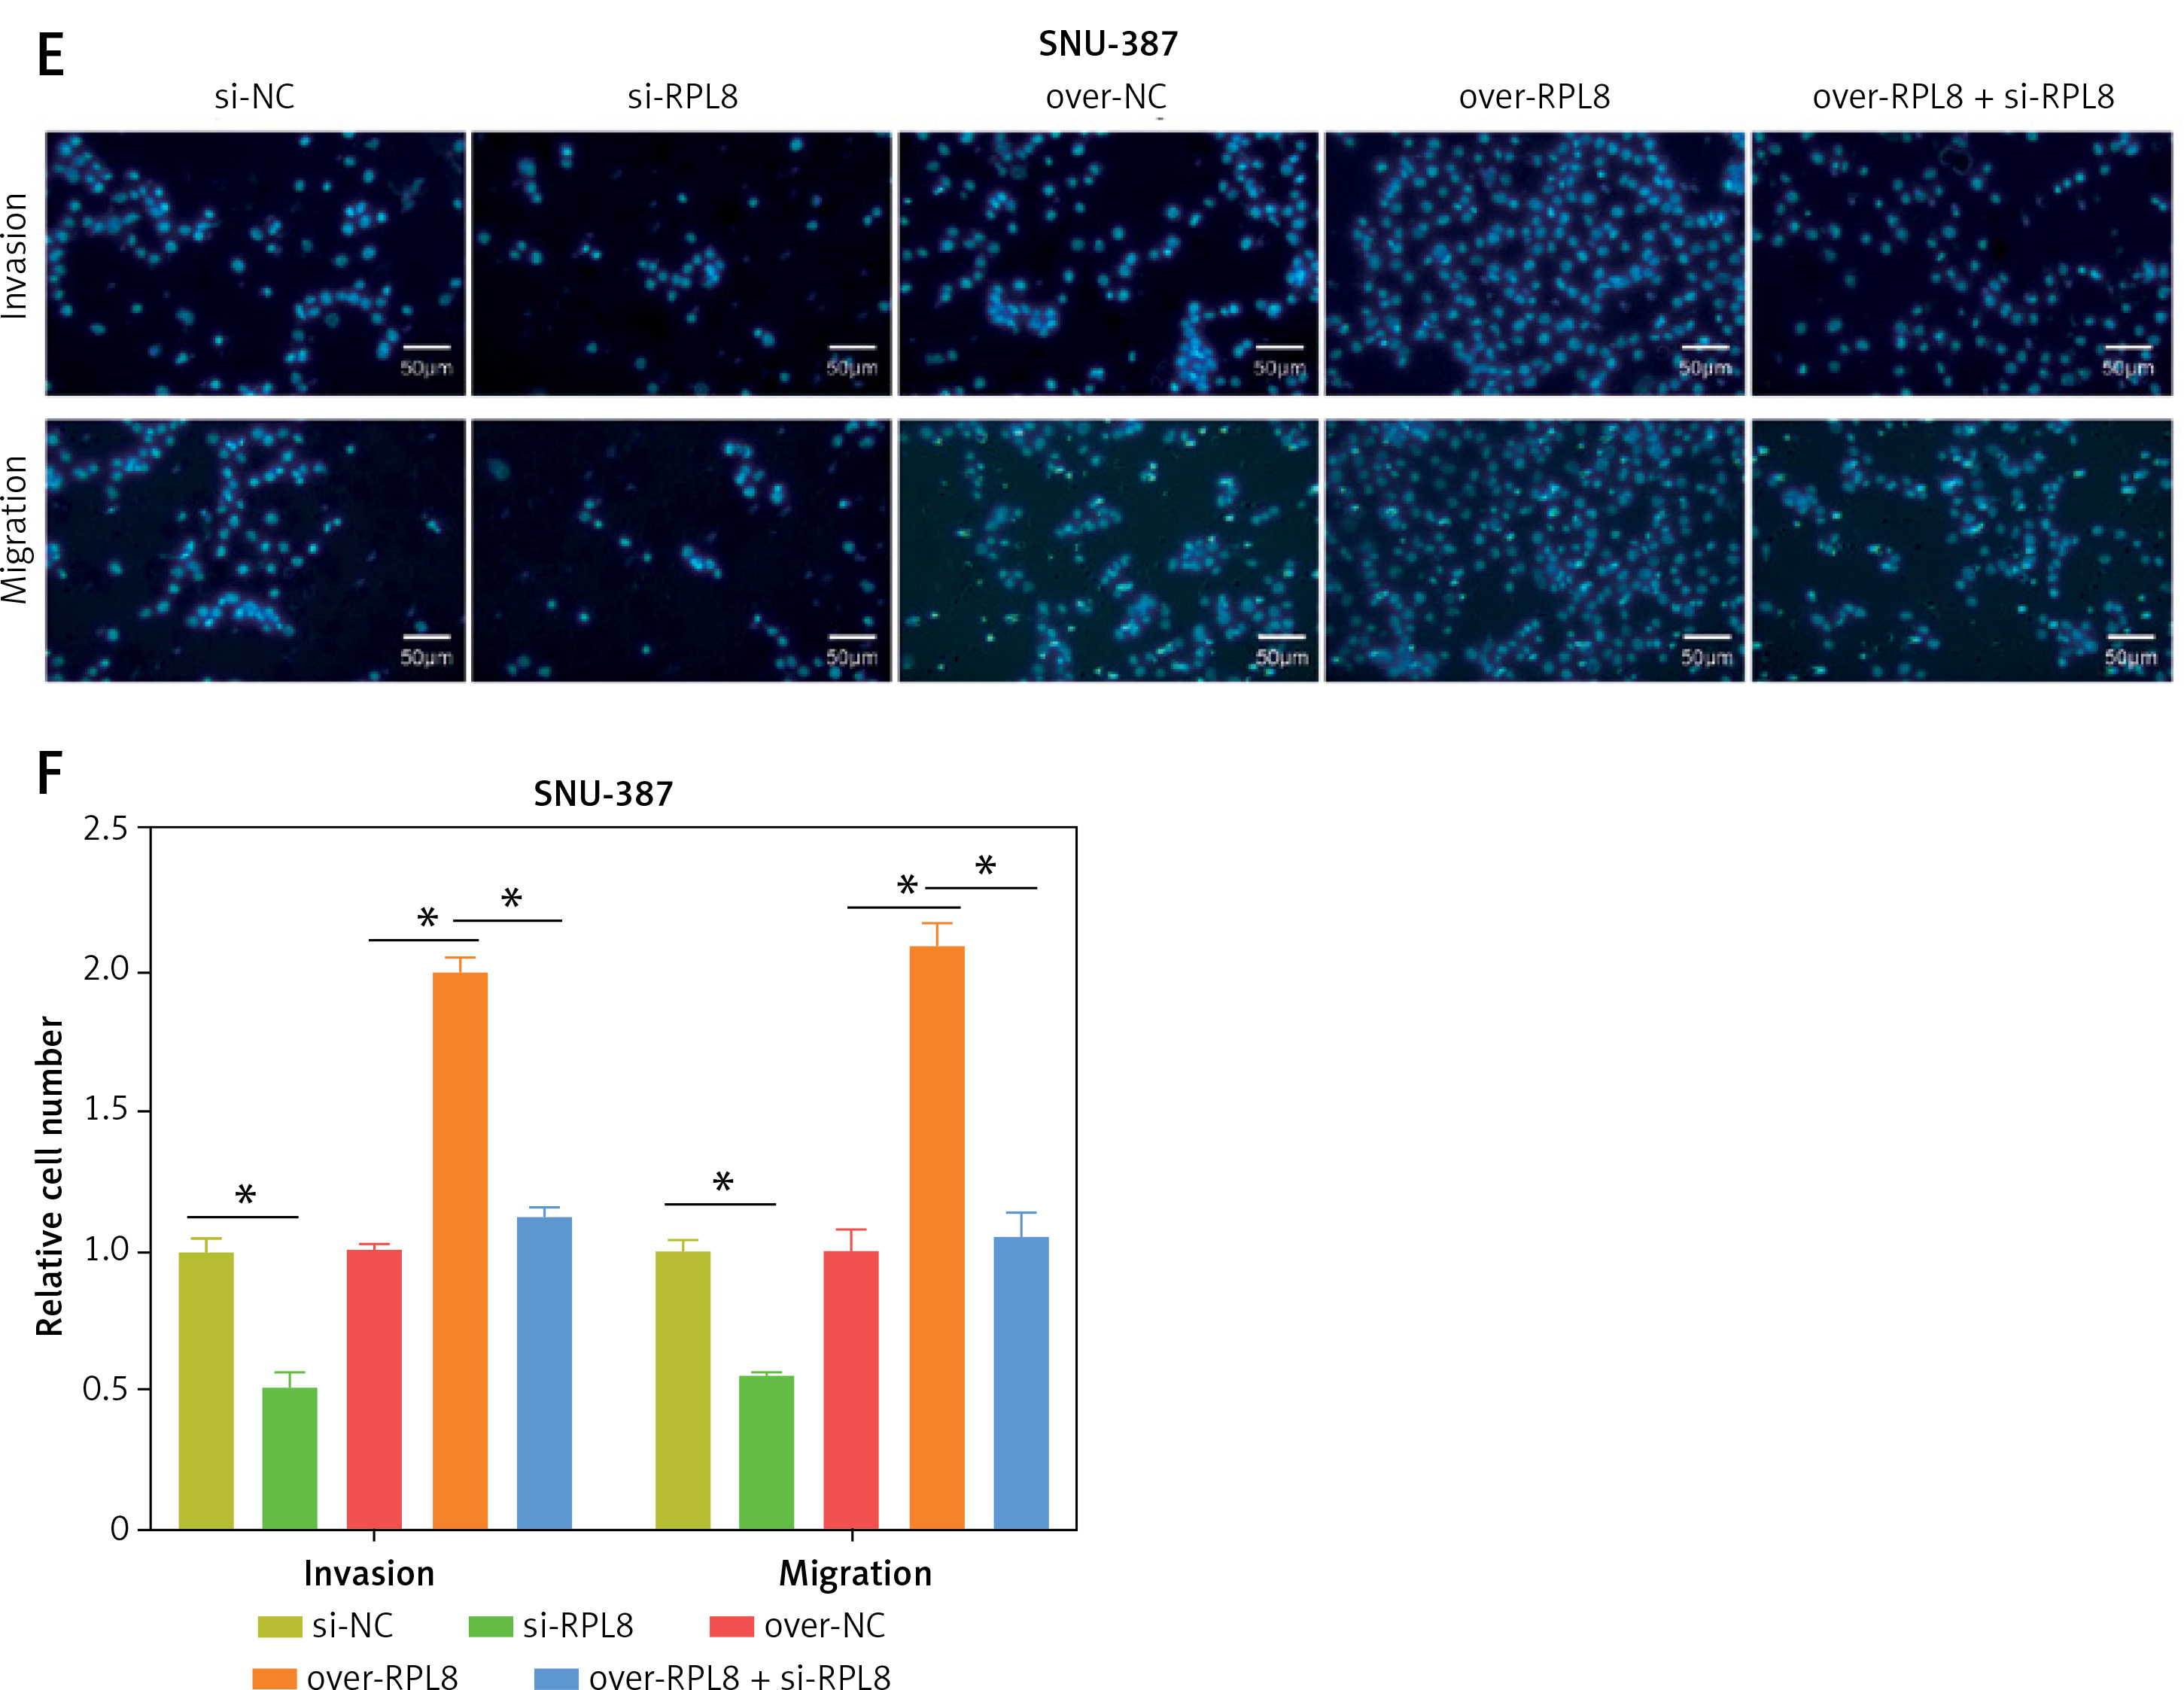
Figure 8
RPL8 overexpression and knockdown control apoptosis in HCC cells. A–D – Flow cytometry analysis assessing the impact of RPL8 knockdown (A, B) and overexpression (C, D) on apoptosis in MHCC-97H and SNU387 cells. Si-NC as controls. *P < 0.05, **p < 0.01. RPL8 overexpression and knockdown control apoptosis in HCC cells. A–D – Flow cytometry analysis assessing the impact of RPL8 knockdown (A, B) and overexpression (C, D) on apoptosis in MHCC-97H and SNU387 cells. Si-NC as controls.E, F – WB examination of the expression levels of the proteins Bax, Bcl-2, and cleaved caspase-3 in MHCC-97H and SNU387 cells following RPL8 knockdown (E) and overexpression (F). Si-NC cells and over-NC cells were used as experimental controls. *P < 0.05, **p < 0.01
RPL8 influences ferroptosis by regulating GSH in HCC
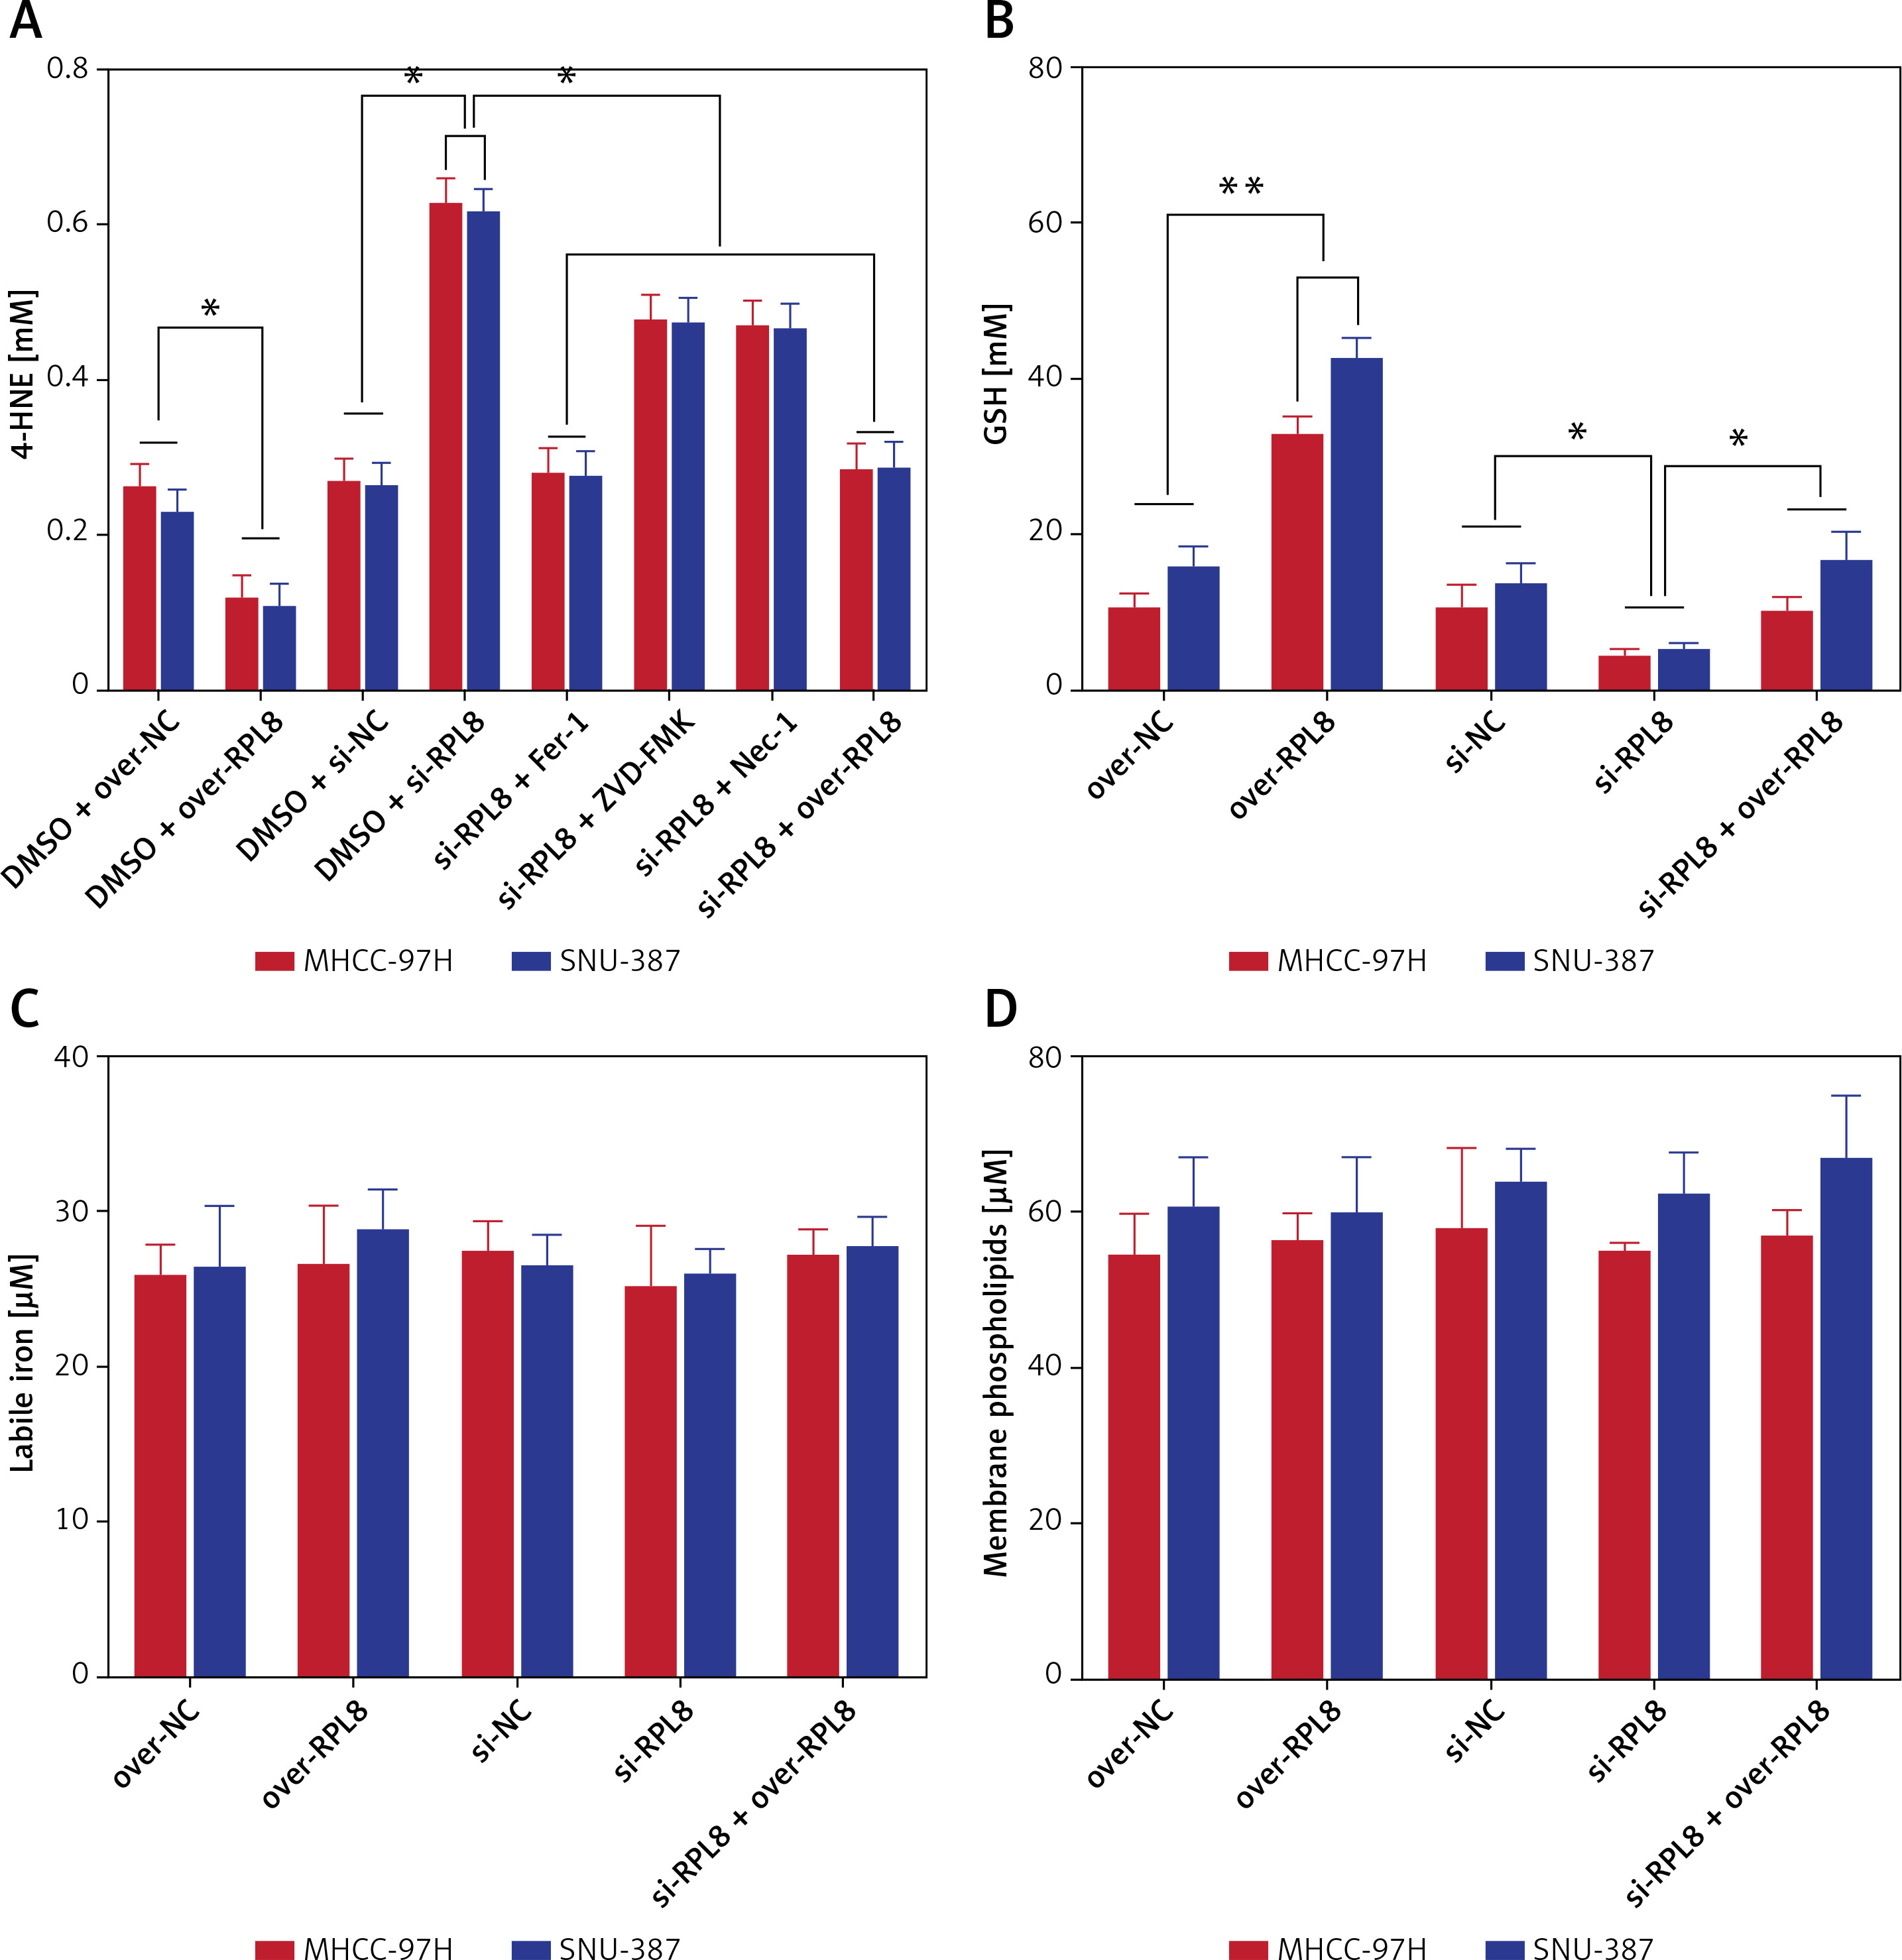
The levels of 4-hydroxynonenal (4-HNE) increased after RPL8 knockdown compared with overexpression. The increase in 4-HNE induced by RPL8 silencing could be partially reversed by the necrosis inhibitor necrostatin-1 (Nec-1), the ferroptosis inhibitor ferrostatin-1 (Fer-1), and the apoptosis inhibitor Z-VAD-FMK (Figure 9 A). These results indicate that RPL8 regulates 4-HNE production and that its knockdown leads to enhanced lipid peroxidation that can be alleviated by specific pathway inhibitors. Previous studies have suggested that the accumulation of lipid reactive oxygen species (ROS) is the last stage of the ferroptosis induction process, and that its production is at least controlled by phospholipids, labile iron, and glutathione [16]. Furthermore, our study revealed that GSH levels are positively regulated by RPL8, while labile iron and membrane phospholipid levels remain unchanged (Figures 9 B–D), indicating that RPL8 may inhibit ferroptosis by elevating GSH levels, thus providing a protective mechanism against lipid peroxidation and cell death.
Figure 9
Modulation of RPL8 affects ferroptosis markers and GSH levels in HCC cells. A–D – Levels of 4-HNE (A), GSH (B), labile iron (C), membrane phospholipids (D) in HCC cells after RPL8 overexpression or knockdown and after intervention with Fer-1, Nec-1 and Z-VAD-FMK. DMSO serves as the vehicle control for the treatments. *P < 0.05, **p < 0.01
RPL8 regulates the ferroptosis-related metabolic axis in HCC
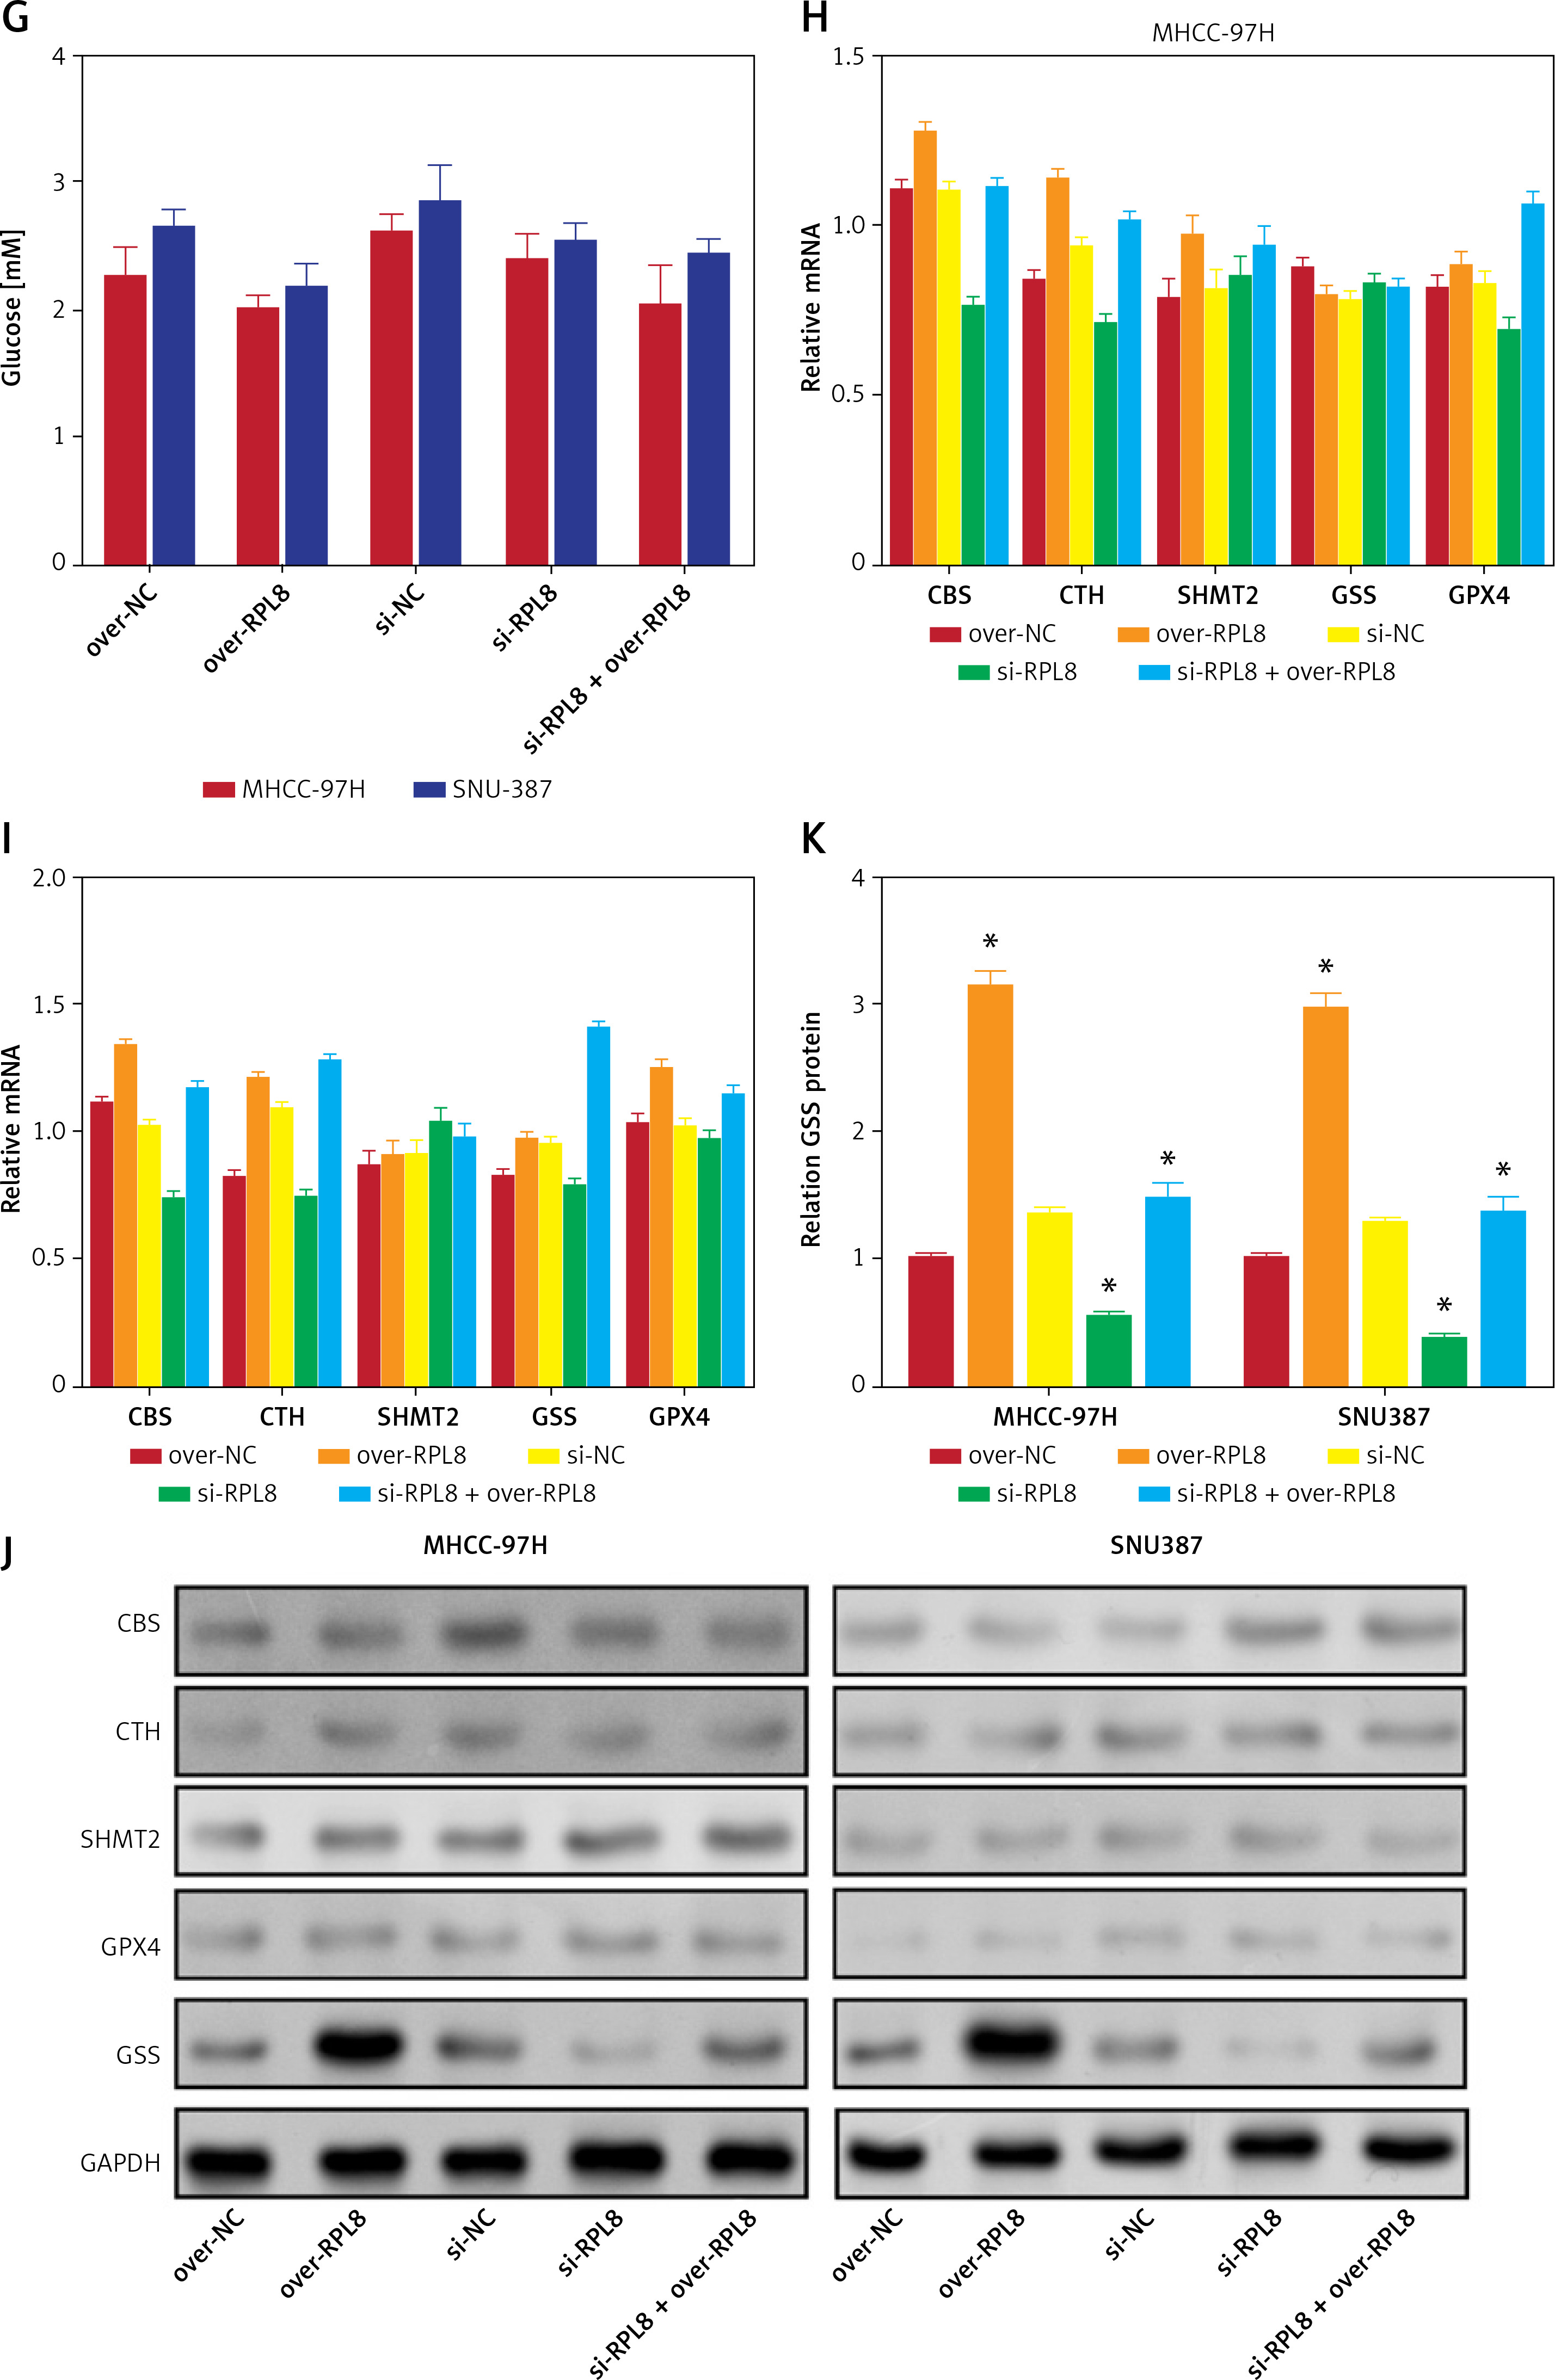
Figure 10 A shows the metabolic pathway of glucose into serine, which is further processed into glycine and cystathionine, both precursors for GSH synthesis [17]. This process is critical for the regulation of ferroptosis, in which GSH and GPX4 enzymes play key protective roles [18]. An ELISA assay was used to evaluate the levels of key biochemical molecules involved in GSH synthesis and metabolism before and after regulation of RPL8 expression in HCC. As demonstrated in Figures 10 B–G, overexpression of RPL8 remarkably reduced the levels of glycine, glutamate, and cysteine, while knockdown of RPL8 resulted in an increase in these factors, indicating that RPL8 enhances GSH synthesis to stimulate GSH synthesis. In contrast, the production of cystathionine, serine, and glucose was not affected by RPL8. Subsequent research focused on enzymes involved in GSH metabolism, including cystathionine-β-synthase (CBS), serine hydroxymethyltransferase 2 (SHMT2), cystathionine-γ-lyase (CTH), GSS and GPX4. According to the results, RPL8 did not show significant regulatory effects on CBS, SHMT2, CTH and GPX4. However, it positively regulated the protein levels of GSS (Figures 10 H–K). This highlights the specific regulatory role of RPL8 in enhancing GSH synthesis by upregulating GSS, which may contribute to the mechanisms of cellular defense against oxidative stress and ferroptosis.
Figure 10
RPL8 modulates the metabolic axis from glucose to glutathione. A – Metabolic pathway linked to ferroptosis from glucose to GSH. B–G ELISA detection of glycine (B), glutamate (C), cysteine (D), cystathionine (E), serine (F) after knockdown or overexpression of RPL8 in HCC cell. Over-NC and Si-NC were used as controls for overexpression and knockdown experiments, respectively. *P < 0.05. Glucose (G) after knockdown or overexpression of RPL8 in HCC cell. H–I – qRT-PCR analysis of CBS, CTH, SHMT2, GSS, and GPX4 mRNA levels after RPL8 knockdown or overexpression in MHCC-97H and SNU387 cells. J, K – WB analysis of CBS, CTH, SHMT2, GSS and GPX40 protein expression levels after RPL8 knockdown or overexpression in MHCC-97H and SNU387 cells (J), and quantitative analysis of GSS protein levels (K). Over-NC and Si-NC were used as controls for overexpression and knockdown experiments, respectively. *P < 0.05
Discussion
HCC is an aggressive tumor that poses a significant threat to human life. The early symptoms of HCC are not apparent, which makes it more difficult to diagnose. When symptoms such as liver pain, weight loss, and abdominal mass occur, HCC has often progressed to the middle and late stages. Advanced HCC is often accompanied by a series of complications, such as hepatic encephalopathy, upper gastrointestinal bleeding, and abundant ascites [19, 20]. The current methods of diagnosing HCC include CT examination, X-ray examination, magnetic resonance imaging, and ultrasound imaging [20, 21]. However, the majority of patients are still diagnosed at advanced stages, which makes therapy difficult [22]. Recent findings have highlighted the impact of RPL8 on hepatocellular carcinoma progression by regulating the mTORC1 signaling pathway [14]. Although the role of RPL8 in LIHC has been demonstrated, its role in the regulation of ferroptosis in HCC remains to be further explored. The regulatory mechanism of RPL8 involves a variety of signaling pathways and biological processes, such as GSH synthesis, as mentioned in the study. Therefore, the specific roles of RPL8 in different cellular environments may not be well defined. The role of RPL8 in HCC remains an active area of research, and more studies are needed to validate its mechanisms and roles to determine its potential as a therapeutic target. Ferroptosis, emerging as a crucial mechanism in HCC progression, warrants in-depth exploration. A new study suggests that NRF2 serves as a central protective element against ferroptosis in HCC cells, opening avenues for targeted therapies [23]. Additionally, research highlights the loss of leukemia inhibitory factor receptor (LIFR) in HCC, activating the NF-κB signaling pathway and elevating the iron-chelating factor LCN2, contributing to ferroptosis resistance [24]. Prior investigations have implicated the transcription factors YAP/TAZ in conferring resistance to sorafenib in HCC by inhibiting sorafenib-induced ferroptosis [25]. These findings collectively underscore the complexity of HCC pathogenesis and the potential of targeting ferroptosis pathways for therapeutic advancements.
In this investigation, we investigated the expression distribution of 22 FRGs in TCGA-LIHC samples and control samples, and performed functional enrichment analysis on them. In KEGG analyses, these FRGs were strongly associated with endoplasmic reticulum protein processing, hepatocellular carcinoma, HIF-1 signaling pathway, D-glutamine and D-glutamate metabolism, thyroid cancer, central carbon metabolism in cancer, and cancer pathways. It can be seen that these enriched pathways are mostly associated with cancer. Studies on epidemiology have indicated that excessive iron has been linked to a higher risk and incidence of cancer [26], while experimental studies have linked iron to cancer formation, tumor growth, and metastasis. The relationship between iron and tumor development and progression is strengthened by iron’s function in proliferation, metabolism, and metastasis. Dysregulation of iron-metabolizing proteins causes cancer cells to take on an organophilic phenotype [26–28]. Oncogenes and tumor suppressor genes have a role in these modifications, at least in part. Many cell death mechanisms, including ferroptosis, are influenced by cancer cells’ iron reliance. Iron excess and deficiency may both be employed in anticancer treatments [29, 30]. In addition, FRGs enriched in the GO terms Protein export, Arginine biosynthesis, Protein processing in the endoplasmic reticulum, Protein digestion and absorption, Amino acid transmembrane transporter activity, Membrane transporter activity, Protein serine/threonine kinase inhibitor activity and PERK-mediated unfolded protein responses were significantly enriched. We can see that these are mostly related to protein synthesis and metabolism. Thus, we detected the protein expression of key FRGs in HCC through the HPA database.
Among the 22 FRGs, high expression of 6 FRGs can lead to poor prognosis in LIHC patients, namely SLC7A11, TFRC, CISD1, CS, FANCD2, and RPL8. Afterwards, through the prognostic model, nomogram and other verifications confirmed that RPL8 can be used as a key prognostic marker in HCC. Previous studies have shown that RPL8, part of the L2P family of ribosomal proteins, plays diverse roles in various cancers [31]. Among them, one study reported a significant correlation between RPL8 expression in osteosarcoma and good response to chemotherapy, indicating its potential importance in osteosarcoma treatment [32]. Du et al. confirmed that RPL8 is part of the four-gene ferroptosis-related stemness gene (FRSG) risk model and has prognostic significance for HCC [33]. Research by Zhang et al. showed that RPL8 may be involved in the PIGR-stimulated ribosome signaling pathway and may contribute to HCC progression and recurrence [34]. The results of our analysis confirmed that RPL8 is significantly overexpressed in HCC and is linked to a dismal prognosis. In vivo and in vitro experiments have verified that RPL8 can affect tumor progression by regulating cell proliferation, migration, invasion and apoptosis, as well as tumor growth. This positions RPL8 as a promising prognostic indicator and a potential target for therapeutic intervention in HCC.
A key signaling molecule in the complex network of ferroptosis, 4-HNE functions as a mediator of the ferroptosis cascade as well as a biomarker of lipid peroxidation [35, 36]. As a consequence of polyunsaturated fatty acid oxidation during lipid peroxidation, 4-HNE is formed, which aids in the destruction of cellular integrity and the start of ferroptosis processes. Its production is indicative of a harmful interaction between ROS and cellular lipids, indicating a crucial point at which cellular homeostasis is lost and ferroptosis takes place. In our study, the silencing of RPL8 resulted in an increase in 4-HNE, indicating elevated lipid peroxidation. Treatment with inhibitors such as Fer-1, which impedes ferroptosis, the necrosis inhibitor Nec-1, and the apoptosis inhibitor Z-VAD-FMK, partly reversed the effects of RPL8 knockdown. This suggests that while RPL8 silencing exacerbates lipid peroxidation, its expression might regulate 4-HNE levels and lipid peroxidation, potentially through modulation of GPX4 activity. Moreover, the aggregation of lipid ROS is considered the last stage of ferroptosis initiation, regulated in part by the interplay between phospholipids [37], labile iron [38], and GSH [39]. Our data indicate that RPL8 upregulates GSH levels without affecting labile iron and membrane phospholipids. This finding suggests that RPL8 may serve as a defense mechanism against lipid peroxidation and ferroptosis, ultimately affecting the pathogenesis and progression of HCC.
The metabolic circuitry underpinning ferroptosis orchestrates the transformation of glucose into serine, which in turn generates glycine and cystathionine, the precursors essential for GSH biosynthesis [40–42]. This cascade of reactions underscores the metabolic adaptability required to modulate ferroptosis, with GSH serving as a critical component of the cellular antioxidant defense system. The pathway engages a variety of enzymes and intermediates that coalesce to uphold cellular redox equilibrium, thus thwarting the progression of ferroptosis. Glycine, glutamate, and cysteine, as the constituent amino acids of GSH, are integral in forestalling lipid peroxidation and ferroptosis cell death. The enzyme GSS facilitates the ATP-dependent synthesis of GSH [43]. The bioavailability of these amino acids is directly proportional to the synthesis of GSH, suggesting their synergistic effect in enhancing cellular defense against ferroptosis damage [44, 45]. Our results reveal that RPL8 regulates the production of GSH synthesis by modulating the amounts of its constituent amino acids in HCC cells. RPL8 overexpression inversely correlates with the concentrations of glycine, glutamate, and cysteine, whereas RPL8 suppression enhances their presence. Moreover, RPL8 exerts a regulatory effect on GSS, augmenting its expression and consequentially the synthesis of GSH. This regulatory axis posited by RPL8 may endow HCC cells with a fortified barrier against oxidative stress and ferroptosis, positioning RPL8 as a possible molecular target for medicinal treatment in HCC management.
Comprehensive bioinformatics analysis has identified RPL8 as a key prognostic gene in HCC, confirmed by its differential expression and its significant correlation with patient survival. In vivo and in vitro experiments emphasized the impact of RPL8 on HCC cell behavior. Knockdown experiments showed that its malignant properties were inhibited, while overexpression of RPL8 enhanced cell proliferation and inhibited apoptosis. In addition, RPL8 regulates the ferroptosis process by regulating the activity of GSS, thereby affecting GSH levels. This regulatory mechanism proposes a strategy to prevent ferroptosis by maintaining cellular redox balance, potentially positioning it as a therapeutic target for HCC.