Introduction
Renal cell carcinoma (RCC) is the most common type of neoplasm of the kidney, and despite numerous studies, predictive and prognostic markers of survival are still unknown [1]. RCC can be divided into three histological subtypes, i.e., clear cell (ccRCC), papillary (pRCC), and chromophobe tumors (chRCC), which account for 85–90% of all RCC cases [1].
Extracted from rhizomes of Curcuma plants [2], curcumin (CUR) has anti-cancer, anti-inflammatory, and anti-oxidant properties [3]. In a recent study, CUR was confirmed as a potent suppressor of tumor angiogenesis, metastasis, proliferation and initiation, in renal, liver, pancreatic, lung, and breast cancers [4]. In addition, as a pigment extracted from rhizoma curcumae longae, CUR plays several biological roles such as anti-oxidative, stomach-protecting, liver-protecting, anti-coagulation, anti-inflammatory, lipid-lowering, anti-tumor, anti-atherosclerotic, anti-rheumatic, and cholagogic roles [5]. It was suggested that HOTAIR is implicated in CUR-induced suppression of RCC metastasis, thus providing a basis for using CUR in the treatment of metastatic RCC [2]. In addition, H19 is upregulated in gastric cancers and promotes cancer cell proliferation by inactivating p53 [6, 7]. Interestingly, CUR was found to downregulate H19 in human gastric cancer cells [8].
Many noncoding RNAs (ncRNAs) can regulate gene expression during pathogenesis and human development. Among these ncRNAs, miRNAs (~22 nt) are deemed as key gene regulators through their complementary binding with target mRNAs, while lncRNAs (> 200 nt) exhibit multiple functions in abnormal and normal tissues [9]. Previous work has demonstrated the regulatory control of miRNA processing based on RNA-RNA interactions, highlighting the increasing complexity of ncRNA mediated regulatory networks [10]. For example, lncRNA UCA1 has been reported to be involved in the development and progression of many types of tumors including breast cancer, gastric cancer, and bladder cancer [11]. Also, lncRNA-H19 acts as an oncogene in a wide range of pathological processes during tumor metastasis and growth, such as during clear cell renal cell carcinomas (ccRCC) [12]. It was shown that lncRNA-H19 is negatively regulated by miR-29a-3p in ccRCC [13].
Histone deacetylases (HDACs) are enzymes regulating gene expression and chromatin status. There are type I, type II, type III and type IV HDAC [14]. In particular, type I HDACs are over-expressed in ccRCC [15], while type II HDACs stabilized HIF-1α in prostate and renal tumors [7]. Therefore, class II HDACs can be potentially used in identifying ccRCC patients suitable for treatment with HDAC suppressors [16]. In humans, CCCTC-binding factor (CTCF) was reported to be involved in CTCF-dependent regulation of the imprinted genes Igf2 and H19 [17]. Although unmethylated ICR is crucial for CTCF binding, CTGF binding can neither suppress IGF2 transcription nor enhance H19 expression [18, 19]. In addition to the methylation of ICR, other factors may affect H19 and IGF2 expression.
The administration of CUR could up-regulate the expression of H19 [16]. In addition, HDAC can be targeted by miR-675, which is hosted in H19 [20]. Furthermore, HDAC could activate and work with CTCF jointly to negatively regulate the transcription efficiency of the H19 promoter, and to maintain the homeostasis in the cells [20]. In this study, we treated the rats in a RCC rodent model with CUR and investigated the role of relevant signaling pathways implicated in the CUR functions.
Material and methods
Animals and treatment
The protocol of this study was approved by our Animal Care and Use Committee. A rat RCC model was established according to the procedure described by Hammers et al. [21]. In brief, 4–8-week-old male SPF nude mice were obtained from Charles River Laboratories (Wilmington, MA) and bred under pathogen-free conditions. Subsequently, primary xenografts derived from a cell line (IH23.1) of renal tumor were implanted into the nude rats. When the size of the tumorous growth in the rats reached 1,000 mm3, the tumors were removed from the rats and dissected into 3 × 3 × 3 mm3 sections, which were transplanted into new groups of untreated rats for amplification and drug treatment. The rat model groups were set up as: RCC group (n = 12) in which the control rats were treated with empty particles, the RCC-MNP-CUR group (25 mg/kg, n = 12) in which the rats were treated with particles carrying 25 mg/kg CUR and the RCC-MNP-CUR group (50 mg/kg, n = 12) in which the rats were treated with particles carrying 50 mg/kg CUR. The growth of tumors in different groups was evaluated biweekly using a caliper.
Real-time PCR
Cells were treated by a miRNeasy kit (Qiagen, Hilden, Germany) to obtain total RNA, which was converted into cDNA using an RT kit (TransGen Biotech, Beijing, China). Then, real-time PCR was carried out using a SuperScript One-Step Kit (Thermo Fisher, Waltham, MA) as per the kit instructions to measure H19 (F: 5′-TGCTGCACTTTA CAACCACTG-3’; R: 5’-ATGGTGTCTTTGATGTT GGGC-3’), miR-675 (F: 5’-TGGTGCGGAGAGGGC-3’; R: 5’-GAACATGTCTGCGTATCTC-3’), HDAC1 mRNA (F: 5’-GGTCCAAATGCAGGCGATTCCT-3’; R: 5’-TCGGAGAACTCTTCCTCACAGG-3’), HDAC6 mRNA (F: 5’-GCCTCAATCACTGAGACCATCC-3’; R: 5’-GGTGCCTTCTTGGTGACCAACT-3’), and CTCF mRNA (F: 5’-GACCACACAAGTGCCATCTCTG-3’; R: 5’-ATGTCGCAGTCTGGGCACTTGT-3’) expression.
Cell culture
HEK293 and CAKI2 cells were maintained in DMEM medium (Invitrogen, Carlsbad, CA) and then transfected by 50 nmol/well of miR-675 or 2 µg/well of p-CTCF plasmid using Lipofectamine 2000 (Invitrogen, Carlsbad, CA) as per the manufacturer’s instructions. Transfected cells were collected 48 h later for subsequent experiments.
Vector construction and luciferase assay
A bioinformatic tool (at https://cm.jefferson.edu/rna22/Interactive/) was used to locate miR-675 binding sites of HDAC1 and HDAC6. PCR was then applied for the amplification of the 3’UTR region in HDAC1 and HDAC6 genes. The target fragment was then cloned into a pmirGLO (Promega, Madison, WI) vector. The obtained plasmids (pHDAC1-wt and pHDAC6-wt) were then amplified using bacteria culture, and site-specific mutagenesis was performed on the miR-675 binding site of pHDAC1-wt and pHDAC6-wt to construct pHDAC1-mut and pHDAC6-mut plasmids. Similarly, to investigate the effect of CTCF and miR-675 on the promoter of H19, the promoter of H19 was inserted into the pmirGLO vector to generate a pH19-wt plasmid. In addition, site-specific mutagenesis was performed on the miR-675 binding site of pH19-wt to construct a pH19-mut plasmid. Then, luciferase assays were carried out by co-transfecting HEK293 and CAKI2 cells with miR-675 and different plasmids. Following 48 h transfection, the luciferase activity in the cells was detected using a luciferase assay kit (Promega, Madison, WI) as per the kit instructions.
Western blot
Protein was isolated from HEK293 and CAKI2 cells, resolved by 10% SDS-PAGE, and blotted onto PVDF membranes, which were blocked using 5% FBS, incubated with anti-HDAC1, anti-HDAC6 and anti-CTCF primary antibodies overnight at 4oC, rinsed, incubated for 1 h at room temperature with HRP-tagged secondary antibody (Abcam, Cambridge, MA), developed with ECL reagents (Thermo Fisher Scientific, Waltham, MA) and analyzed with an imaging system (Bio-Rad, Hercules, CA) using GAPDH as an internal control to determine the relative protein expression of HDAC1, HDAC6 and CTCF.
Immunohistochemistry
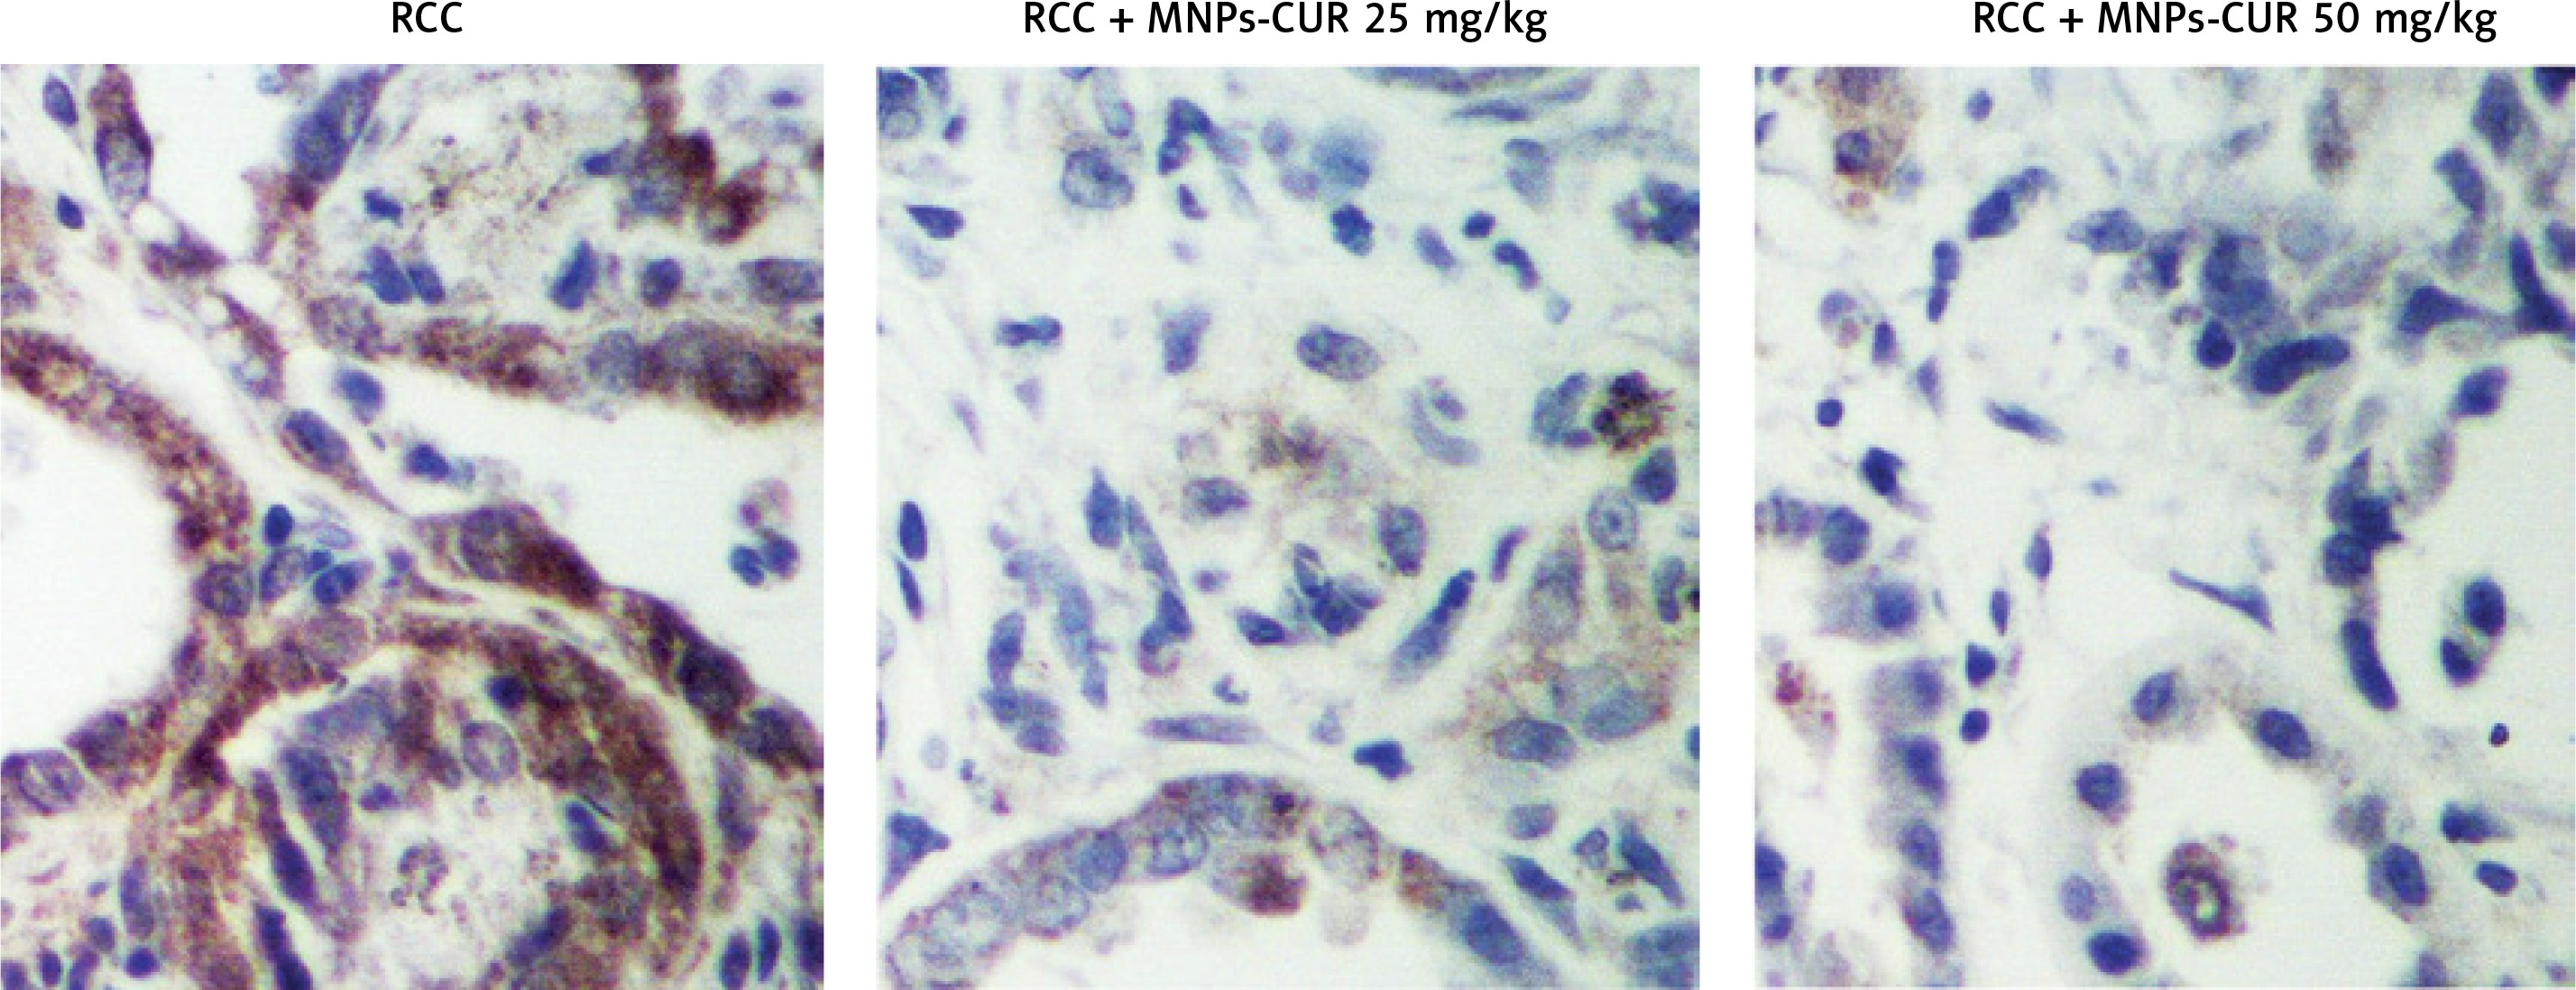
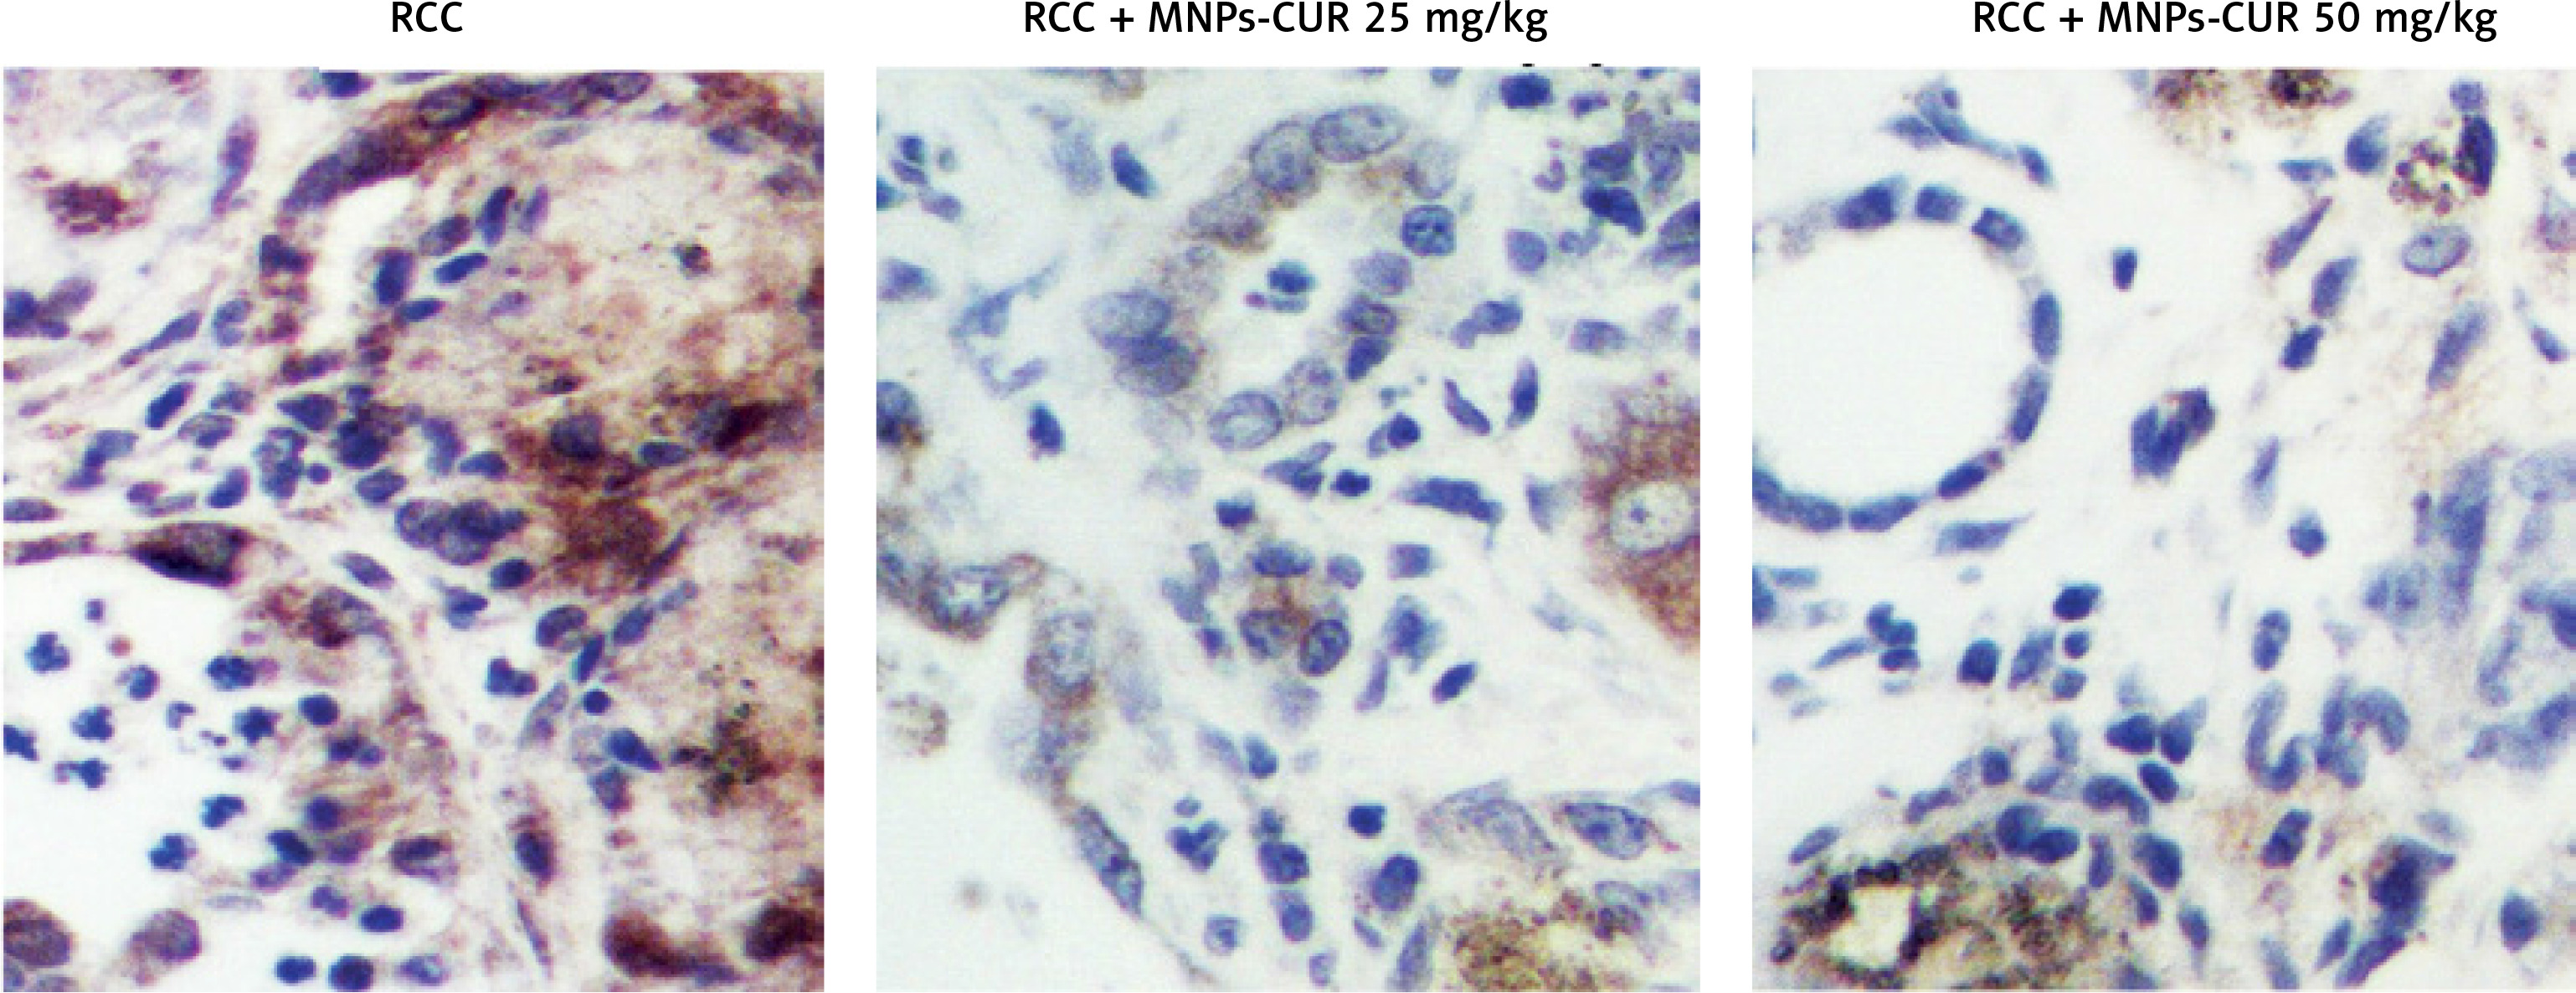
Tissue samples were de-waxed with xylene, treated with gradient ethanol for dehydration, blocked with 5% H2O2 and 10% normal goat serum in sequence, incubated at 4°C overnight with monoclonal anti-HDAC1 and anti-HDAC6 antibodies (Abcam, Cambridge, MA), washed, further incubated with appropriate secondary antibodies at 37°C for 1 h, counter-stained with diaminobenzidine, mounted, and assessed using microscopy (IX73, Olympus, Tokyo, Japan).
Hematoxylin-eosin (HE) staining
Freshly collected tissue samples were fixed using 10% formalin, embedded, cut into sections of 3 µm in thickness, dewaxed using xylene, treated with gradient ethanol for dehydration, stained with hematoxylin for 7 min, washed, counter-stained with eosin for 1 min, dried, mounted in neutral balsam, photographed, and assessed for malignancy score.
Results
Selectivity of particles in the kidney based on different doses
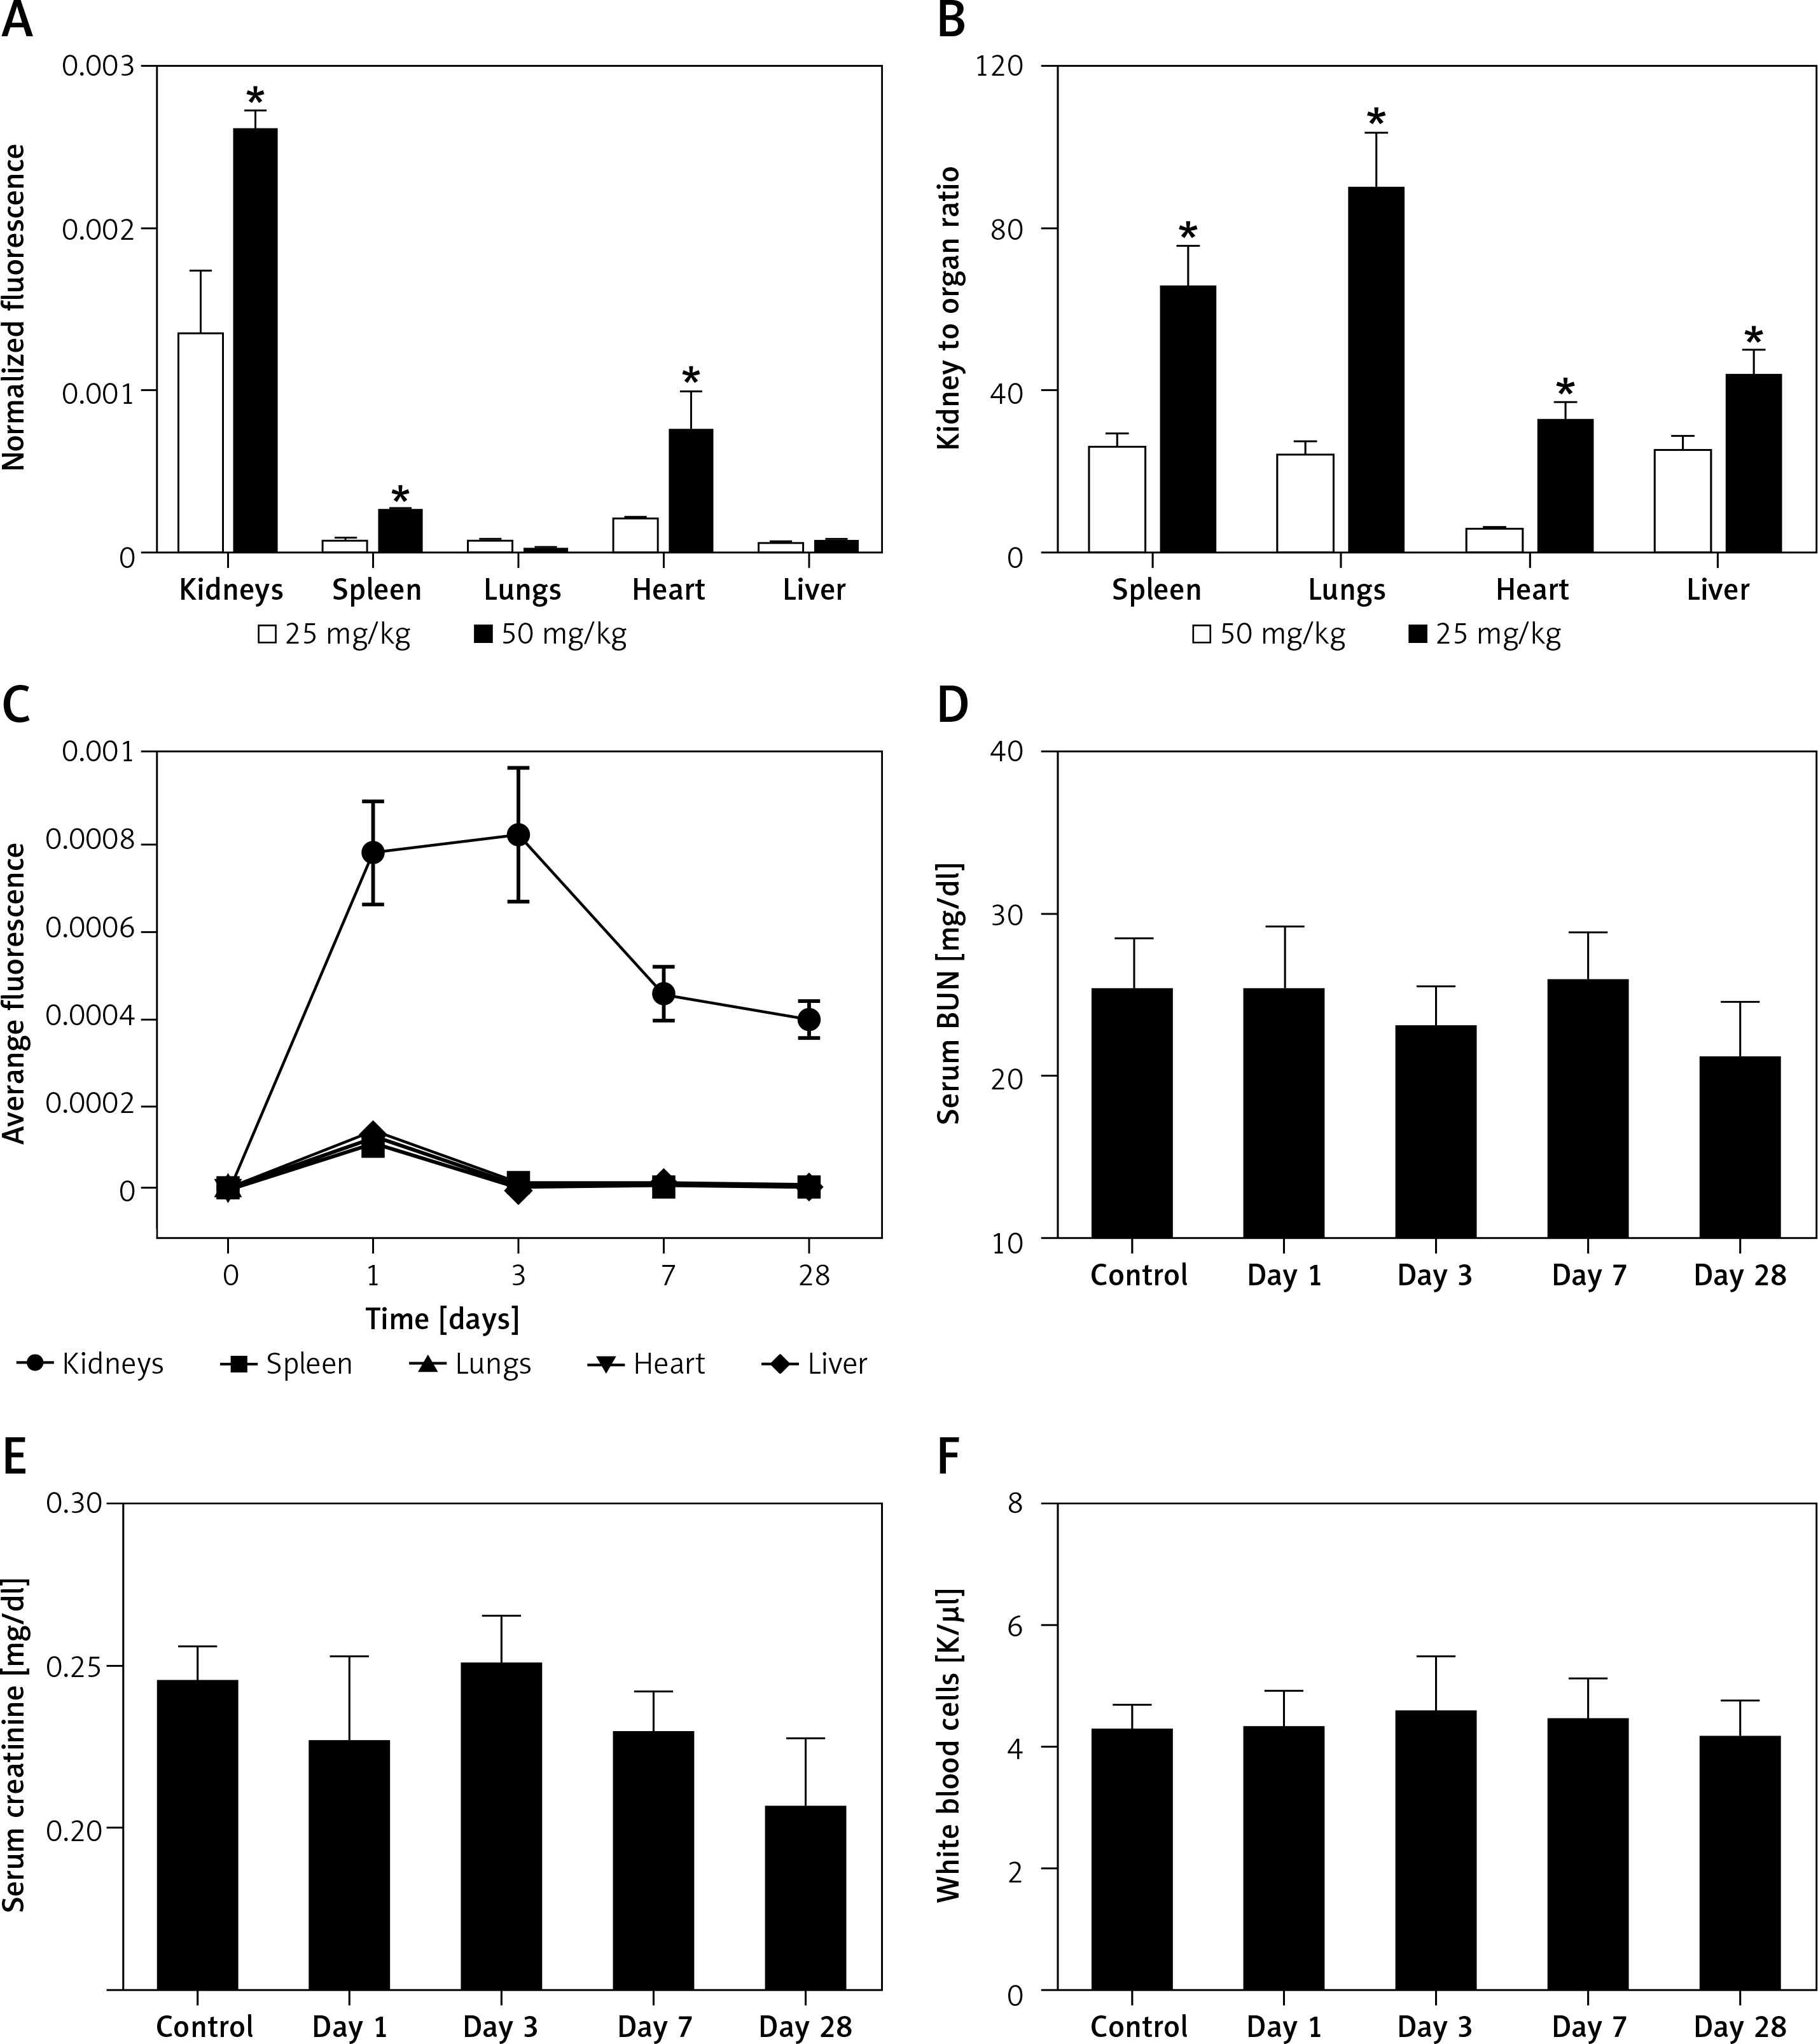
To determine the optimal dose of MNP treatment in the kidney, 25 mg/kg and 50 mg/kg of fluorescence-labeled particles were injected into the rats and the localization of particles in the kidney was examined at different time points after injection. As shown in Figure 1 A, particles could be specifically accumulated in the kidney but not other organs in a dose-dependent manner. As shown in Figure 1 B, the retention of particles in the kidney was maximized at a dose of 25 mg/kg. As shown in Figure 1 C, the particles remained in the kidney for up to 28 days. As shown in Figures 1 D, E, and F, no significant changes in serum BUN, serum creatinine and white blood cell count were observed after the injection with particles, indicating that these particles were safe in the kidney.
Figure 1
Selectivity of particles in the kidney based on different doses (*p < 0.05, vs. 25 mg/kg). A – particles could be specifically accumulated in the kidney in a dose-dependent manner. B – Specific localization of particles in the kidney was maximized at a dose of 25 mg/kg. C – Particles could remain in the kidneys for up to 28 days. D – There was no obvious difference in serum BUN after the injection with particles. E – There was no obvious difference in serum creatinine after the injection with particles. F – There was no obvious difference in white blood cell counts after the injection with particles
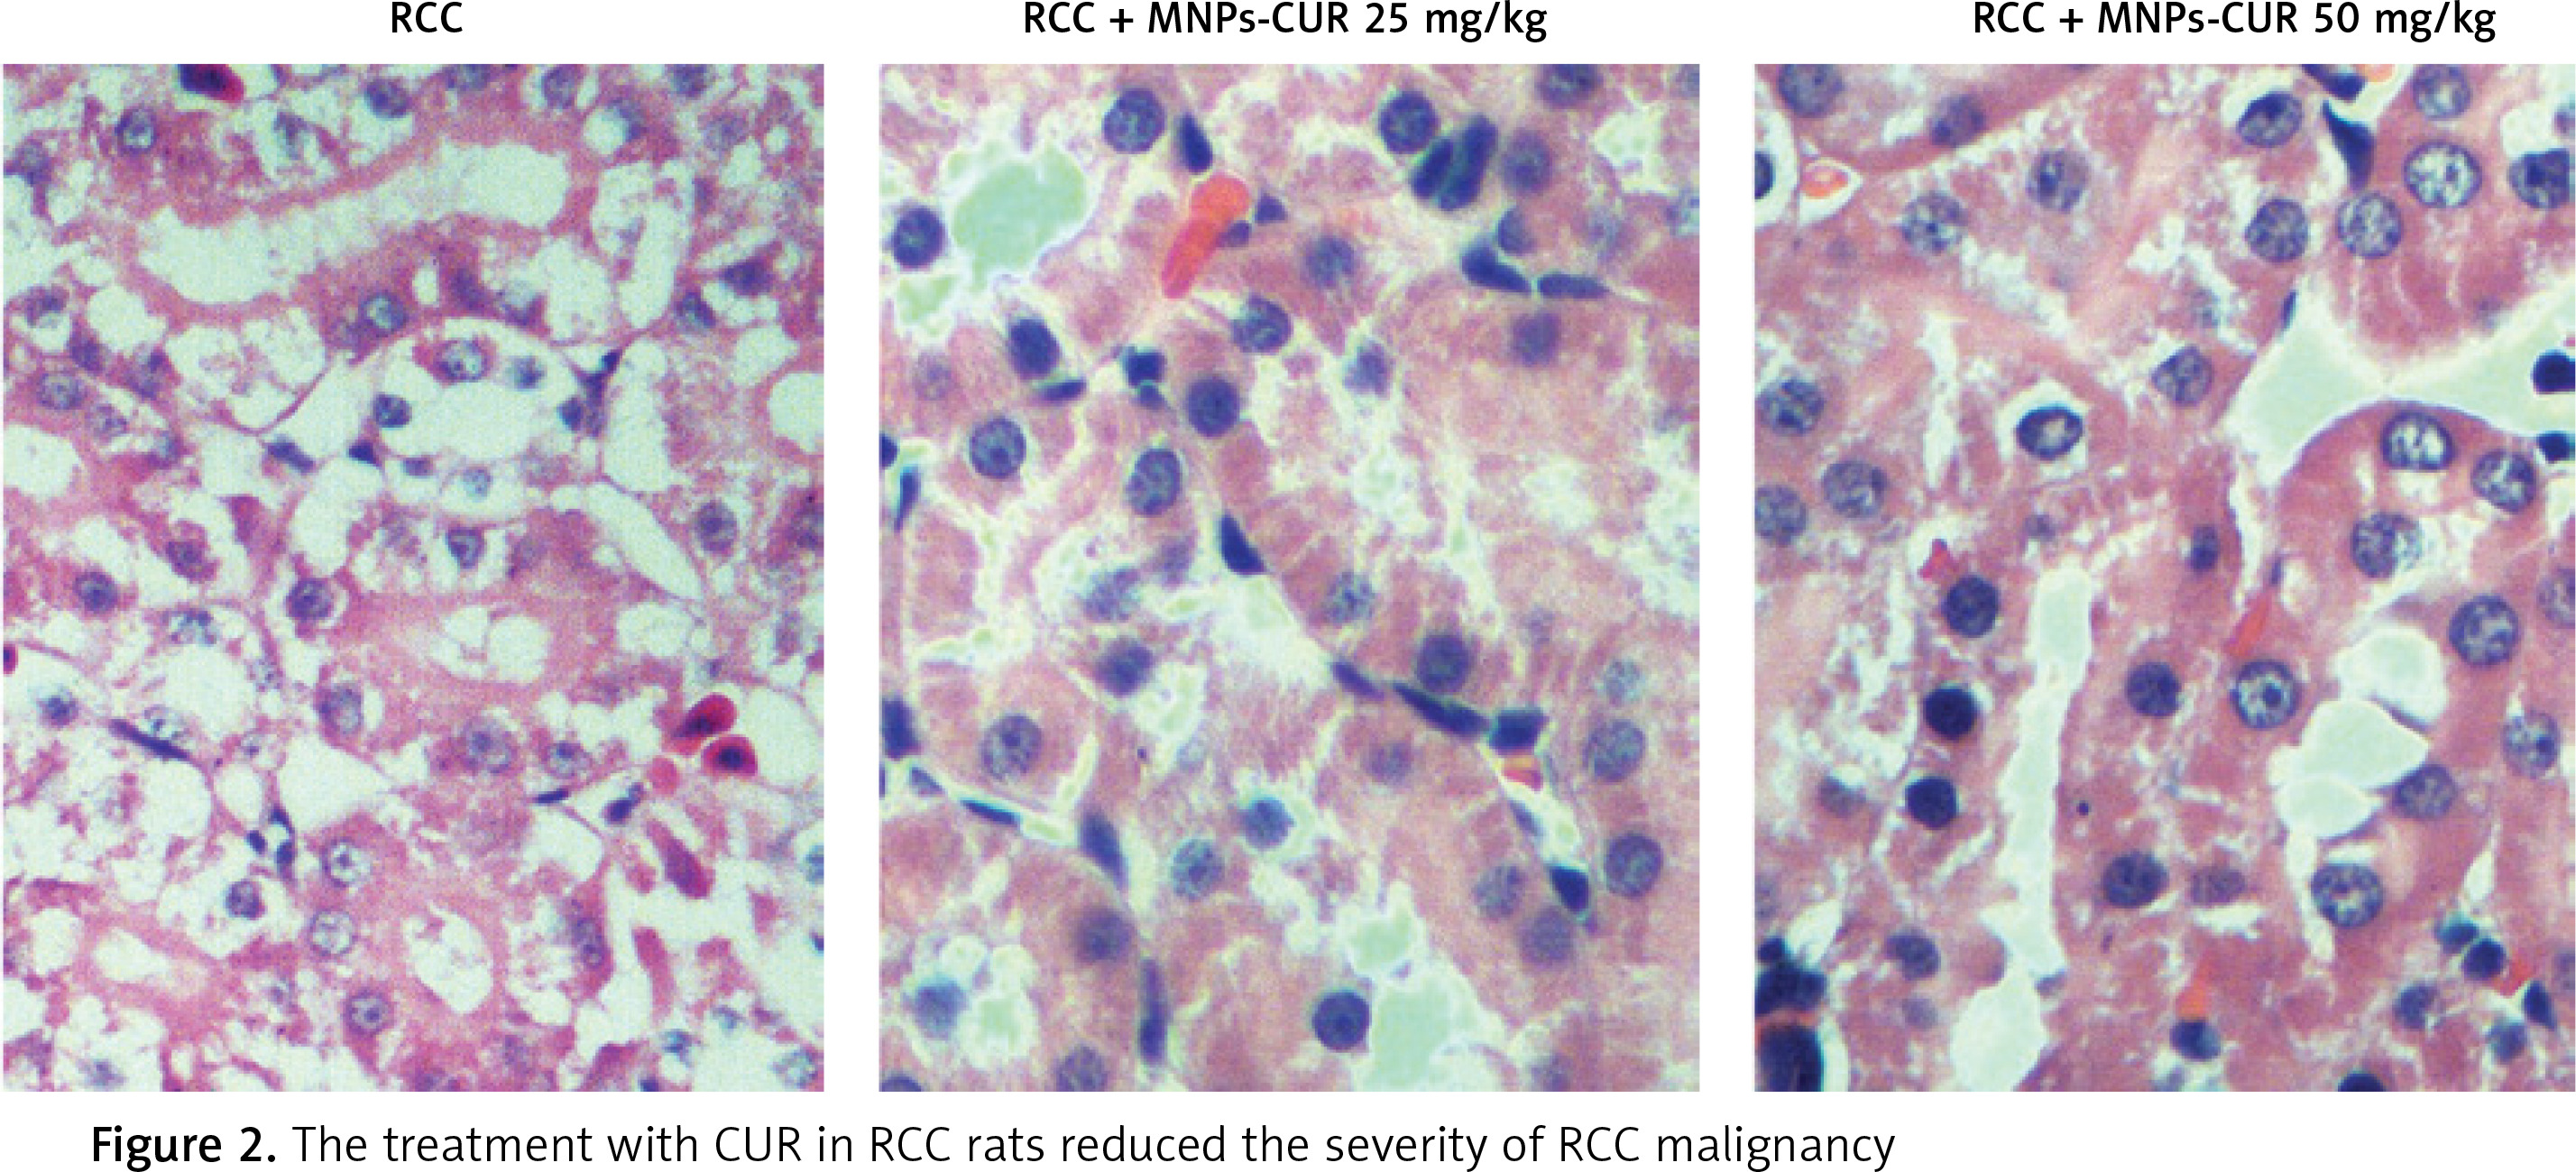
Effect of CUR on RCC
HE staining was performed to study the effect of CUR on RCC after different doses of CUR (25 mg/kg and 50 mg/kg) were delivered into RCC rats using particles. As shown in Figure 2, a higher level of malignancy was observed in the RCC group than the RCC-MNP-CUR (25 mg/kg) and RCC-MNP-CUR (50 mg/kg) groups, while the level of malignancy in the RCC-MNP-CUR (25 mg/kg) group showed no significant difference compared the RCC-MNP-CUR (50 mg/kg) group.
Effect of CUR on expression of H19, miR-675 and HDAC
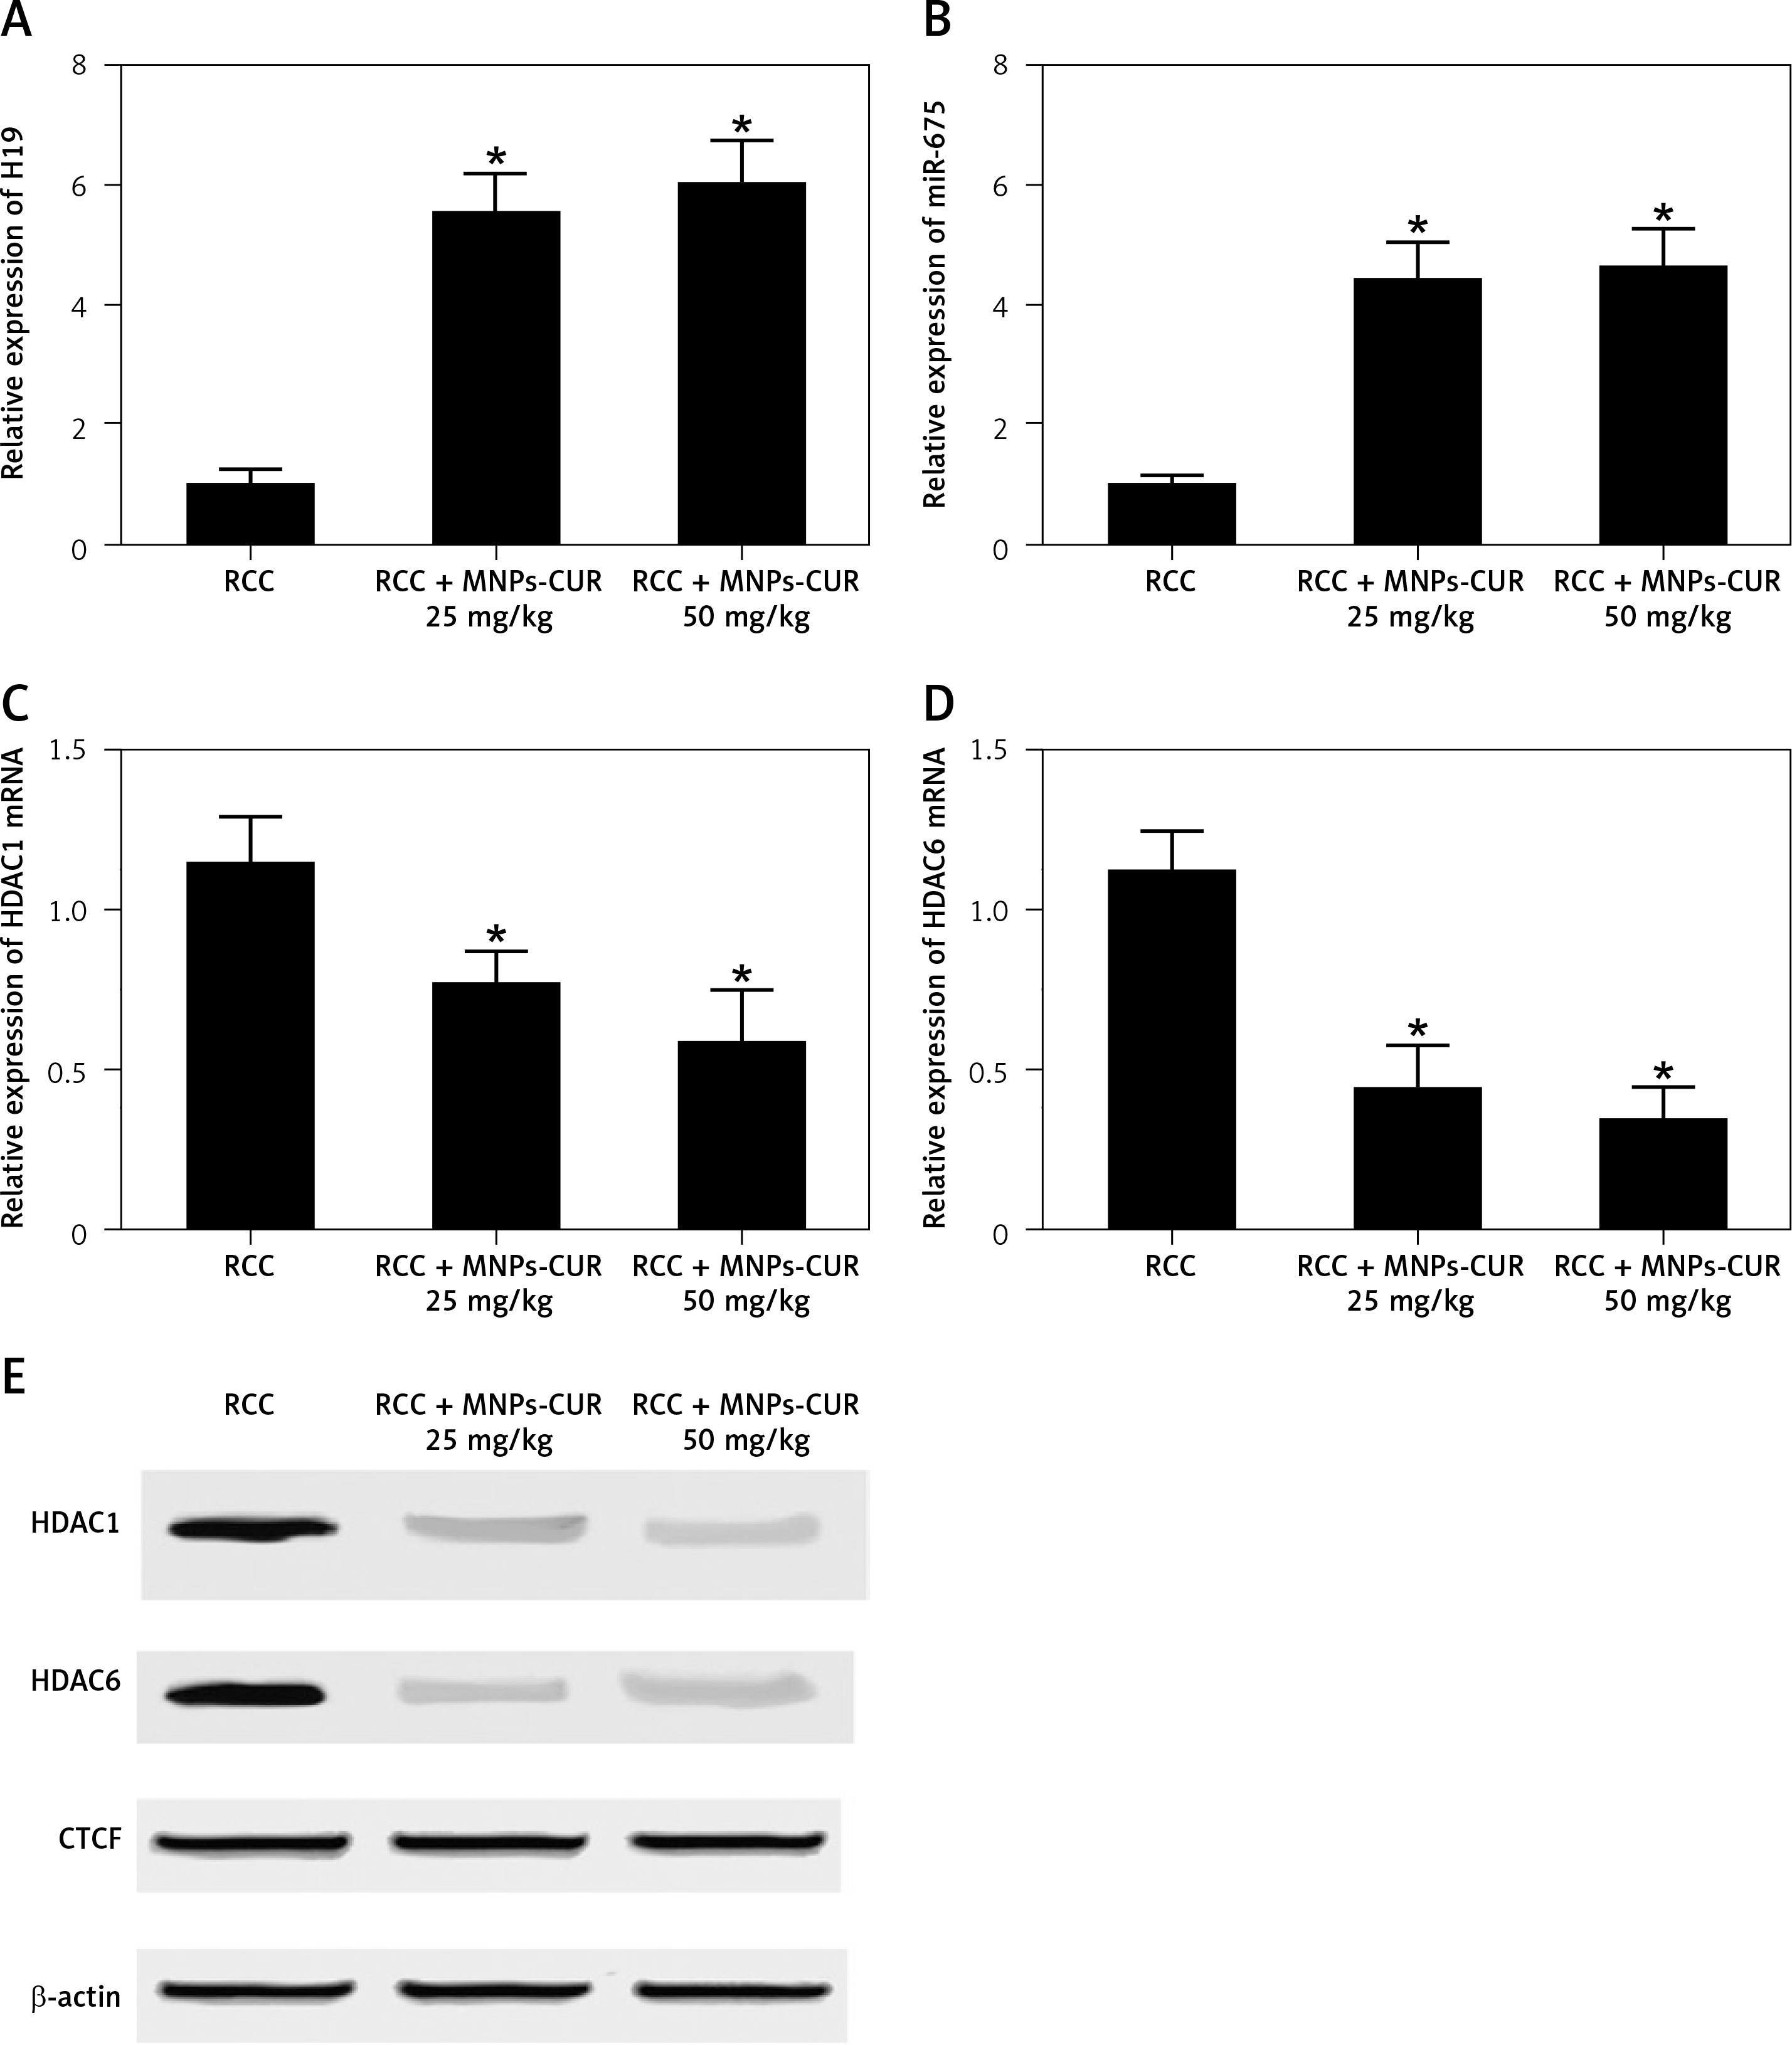
The effect of CUR on the expression of H19, miR-675 and HDAC was detected using real-time PCR, Western blot analysis and IHC assay. As shown in Figure 3, the administration of CUR apparently up-regulated the expression of H19 (Figure 3 A) and miR-675 (Figure 3 B), while the treatment with CUR remarkably down-regulated the mRNA (Figures 3 C, D) and protein (Figure 3 E) levels of HDAC1 (Figure 3 C) and HDAC6 (Figure 3 D). According to the IHC results, the levels of HDAC1 (Figure 4) and HDAC6 (Figure 5) proteins in the RCC-MNP-CUR (25 mg/kg) and RCC-MNP-CUR (50 mg/kg) groups were much lower than those in the RCC group.
Figure 3
Real-time PCR and Western blot analysis were performed to determine the effect of CUR on the expression of H19, miR-675 and HDAC (*p < 0.05, vs. RCC rats). A – Administration of CUR (25 mg/kg or 50 mg/kg) increased the expression of H19 mRNA in RCC rats. B – Administration of CUR (25 mg/kg or 50 mg/kg) increased the expression of miR-675 mRNA in RCC rats. C – Treatment with CUR (25 mg/kg or 50 mg/kg) decreased the expression of HDAC1 mRNA in RCC rats. D – Treatment with CUR (25 mg/kg or 50 mg/kg) decreased the expression of HDAC6 mRNA in RCC rats. E – CUR (25 mg/kg or 50 mg/kg) decreased the protein levels of HDAC1 and HDAC6 in RCC rats
Curcumin increased H19 expression by increasing the translational efficiency of H19 promoter
Real-time PCR, Western blot analysis and luciferase assay were carried out to clarify the effect of CUR on the expression of H19, miR-675 and HDAC. As shown in Figure 6, the luciferase activity in HEK293 cells (Figure 6 A) showed a stepwise increase with the increasing dose of CUR.
Figure 6
Curcumin increased H19 expression by increasing the translational efficiency of the H19 promoter (*p < 0.5, vs. NC group). A – Luciferase activity of the H19 promoter was dose-dependently increased after treating HEK293 cells with CUR. B – Luciferase activity of the H19 promoter was dose-dependently increased after treating CAKI2 cells with CUR. C – CUR up-regulated H19 expression in a dose-dependent manner in HEK293 cells. D – CUR up-regulated H19 expression in a dose-dependent manner in CAKI2 cells. E – The level of miR-675 was dose-dependently increased in HEK293 cells treated with CUR. F – The level of miR-675 was dose-dependently increased in CAKI2 cells treated with CUR. G – CUR dose-dependently down-regulated the protein expression of HDAC1 and HDAC6 in HEK293 cells. H – CUR dose-dependently down-regulated the protein expression of HDAC1 and HDAC6 in CAKI2 cells
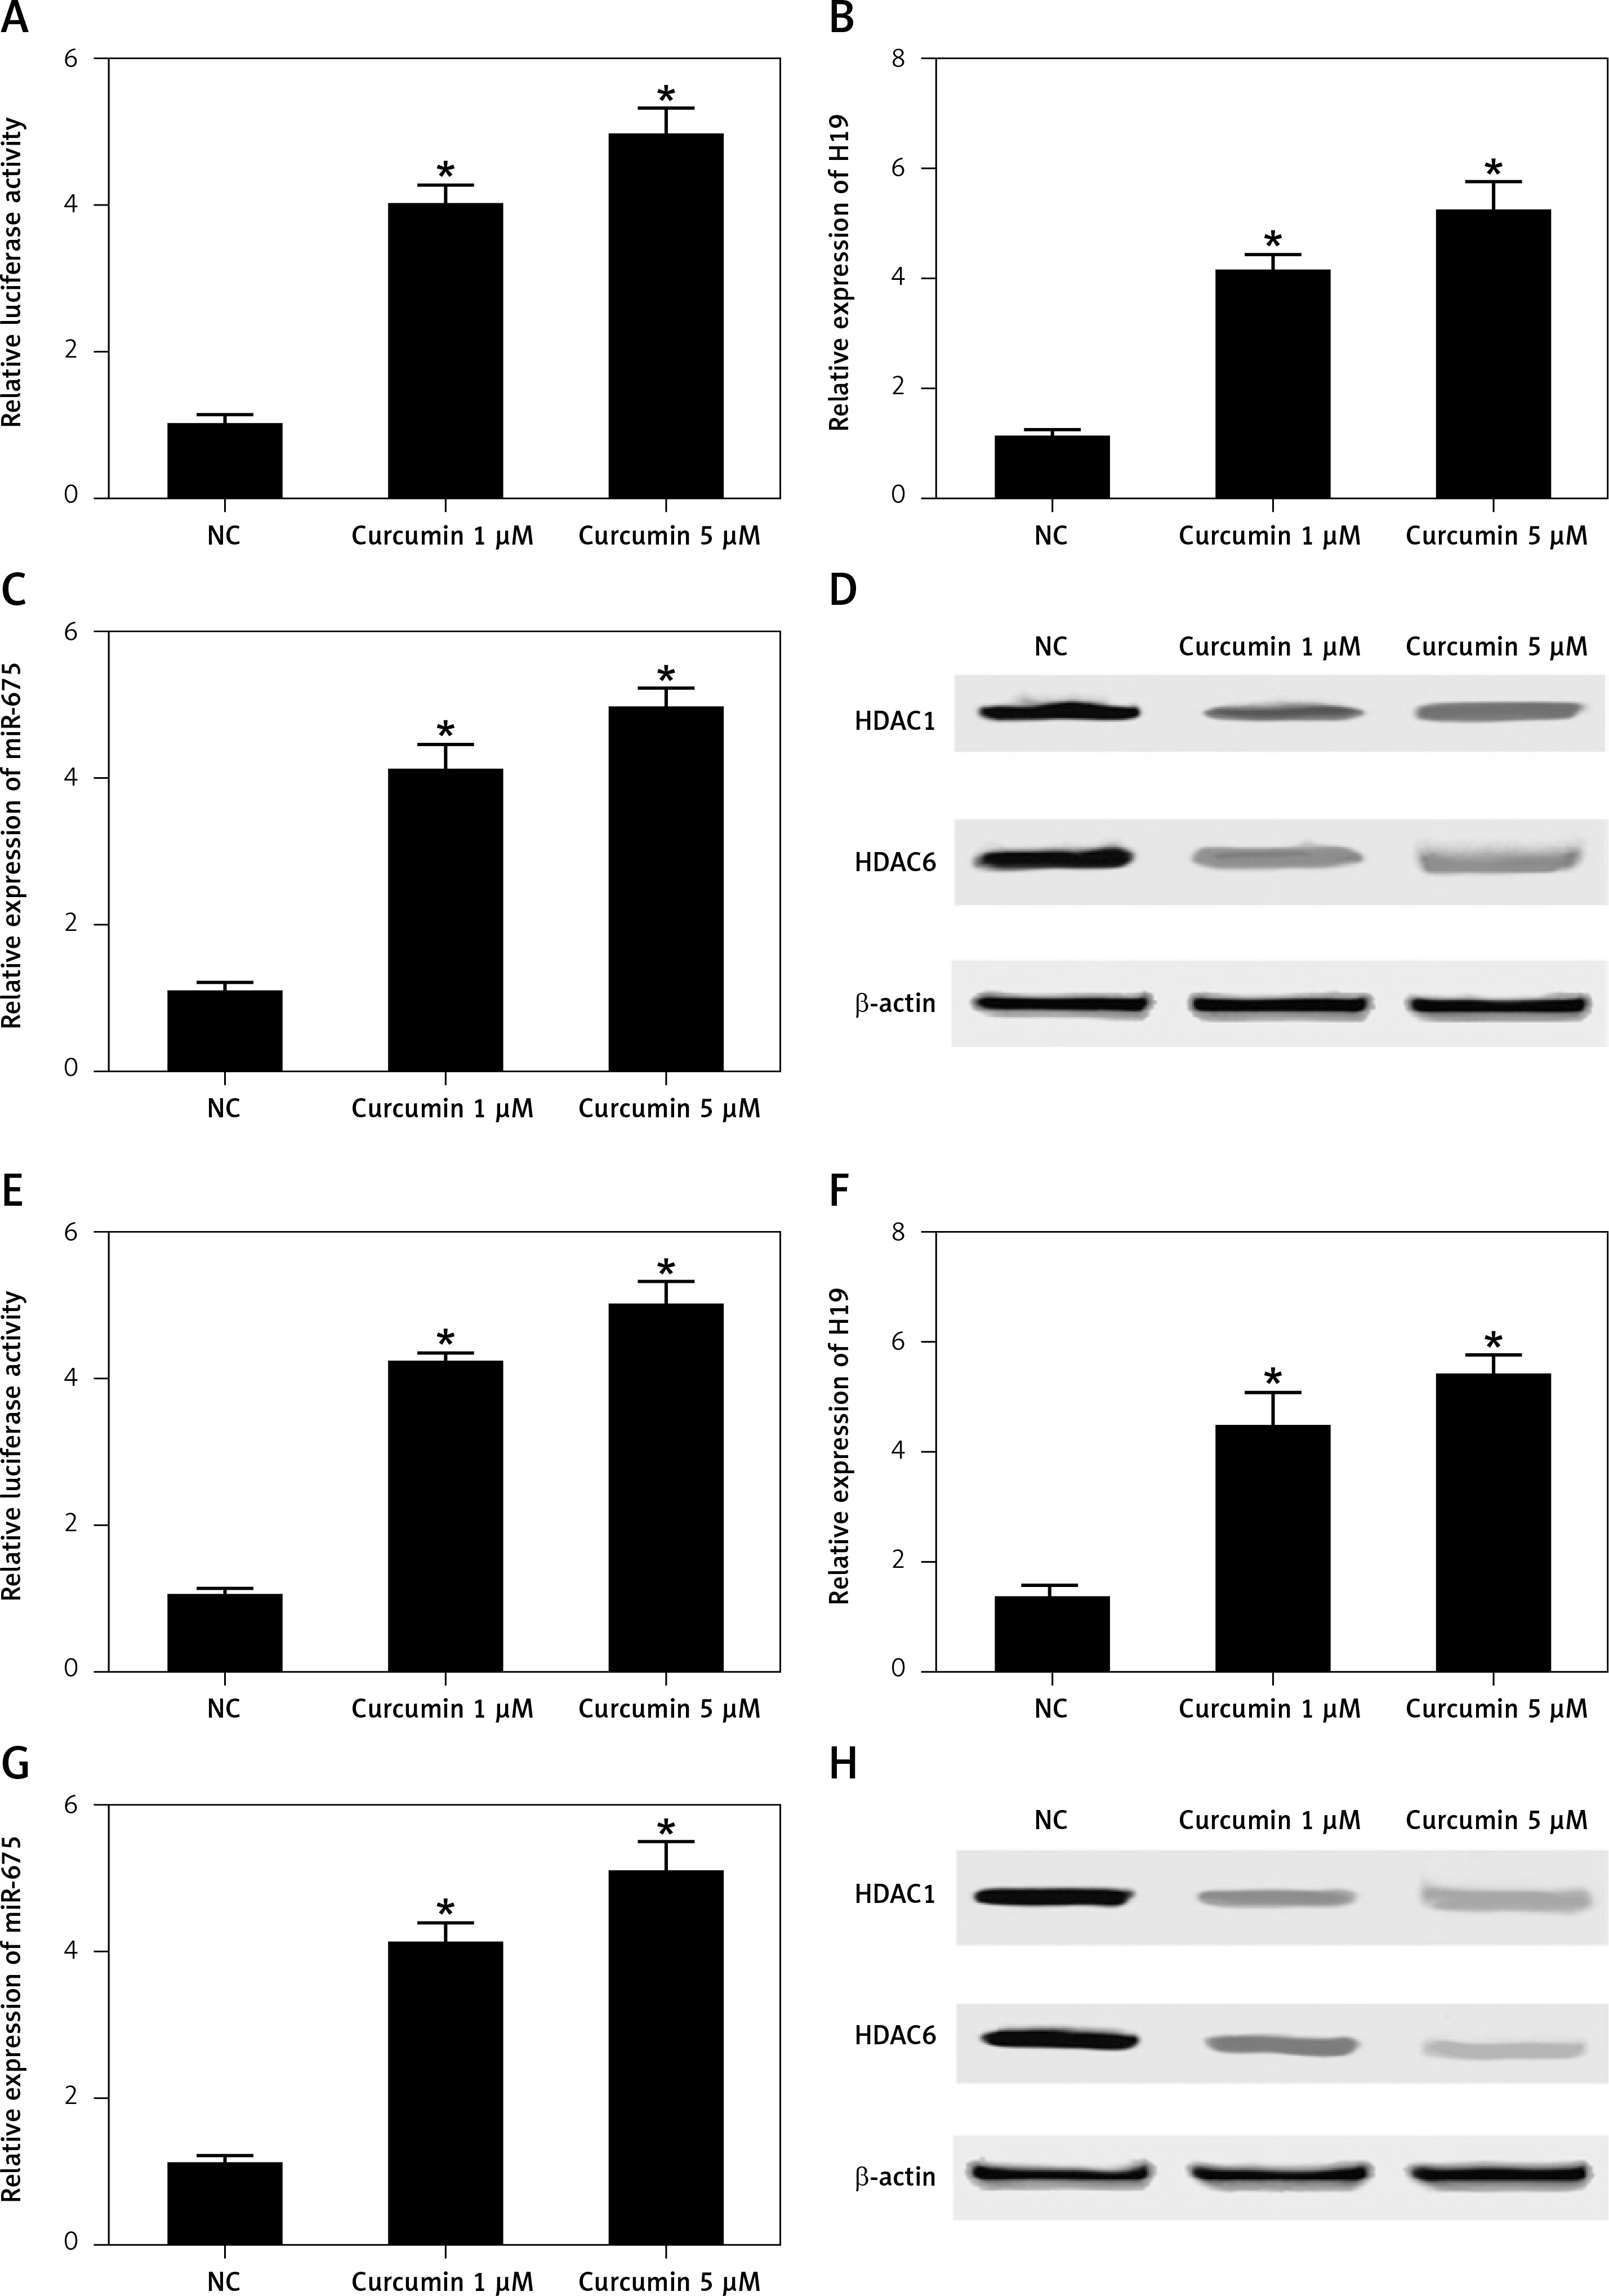
Meanwhile, the treatment with CUR dose-dependently increased the levels of H19 (Figure 6 B) and miR-675 (Figure 6 C) in HEK293 cells. In contrast, the treatment with CUR dose-dependently decreased the levels of HDAC1 and HDAC6 proteins in HEK293 cells (Figure 6 D).
Similar results were observed in CAKI2 cells (Figures 6 E–H).
MiR-675 directly targeted the 3’UTR of HDAC1 and HDAC6
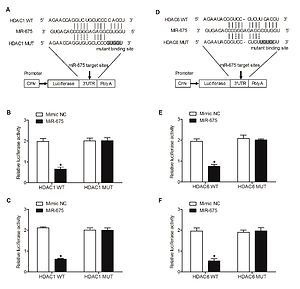
Computational analysis was performed to identify HDAC1 (Figure 7 A) and HDAC6 (Figure 7 D) as candidate genes of miR-675. In addition, a complementary binding site of miR-675 was located in the 3’UTRs of HDAC1 or HDAC6. Furthermore, the luciferase activity of HEK293 (Figures 7 B, E) and CAKI2 (Figures 7 C, F) cells co-transfected with miR-675 mimics and wild-type 3’UTR of HDAC1 or HDAC6 was significantly reduced compared with that in the negative control (NC) cells.
Figure 7
MiR-675 directly targeted the 3’UTRs of HDAC1 and HDAC6 (* P value < 0.5, vs. mimic NC group). A – The 3′UTR of HDAC1 was targeted by miR-675 with potential “hits” in the 3’UTR of HDAC1. B – Luciferase activity of wild-type HDAC1 3’UTR was reduced in HEK293 cells over-expressing miR-675. C – Luciferase activity of wild-type HDAC1 3’UTR was reduced in CAKI2 cells over-expressing miR-675. D – Schematic comparison of the “seed sequences” in miR-675 and the 3’UTR of HDAC6. E – Luciferase activity of HEK293 cells co-transfected with miR-675 mimics and wild-type 3’UTR of HDAC6 showed reduced luciferase activity. F – Luciferase activity of CAKI2 cells co-transfected with miR-675 mimics and wild-type 3’UTR of HDAC6 showed reduced luciferase activity
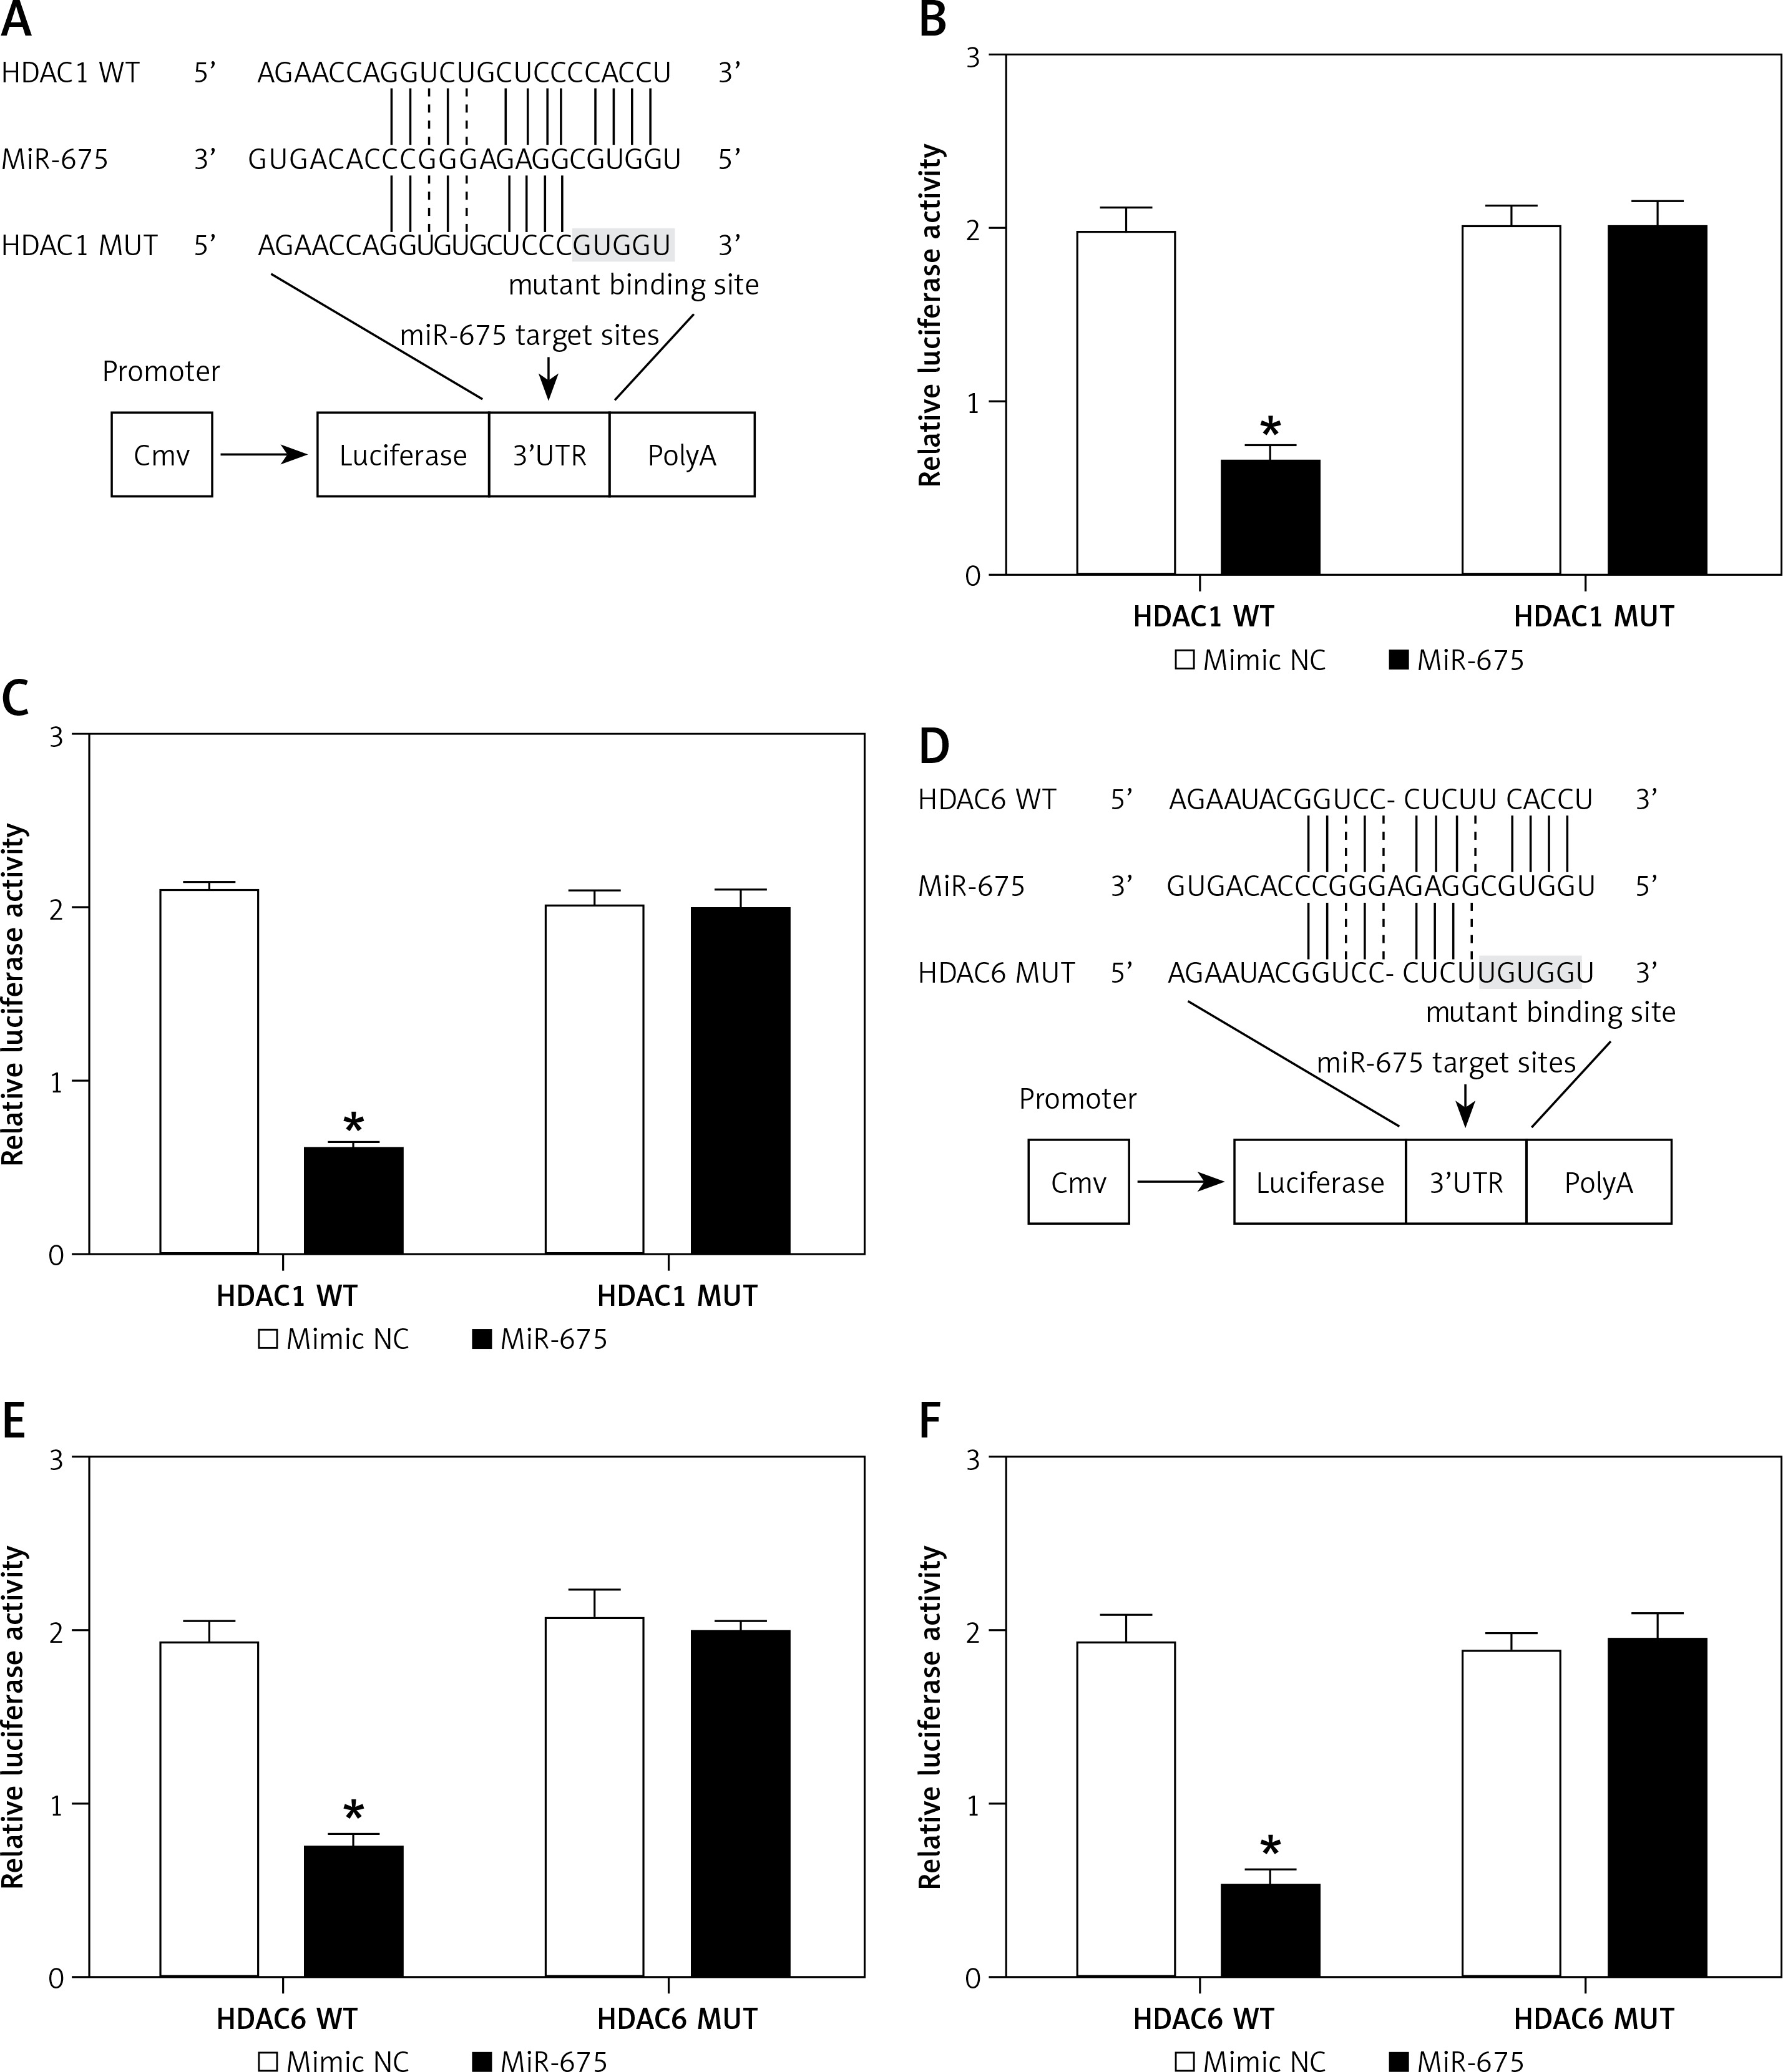
All these results collectively suggested that miR-675 directly bonds to the 3’UTRs of HDAC1 and HDAC6.
Effect of CTCF on HDAC expression and translational efficiency of H19 promoter
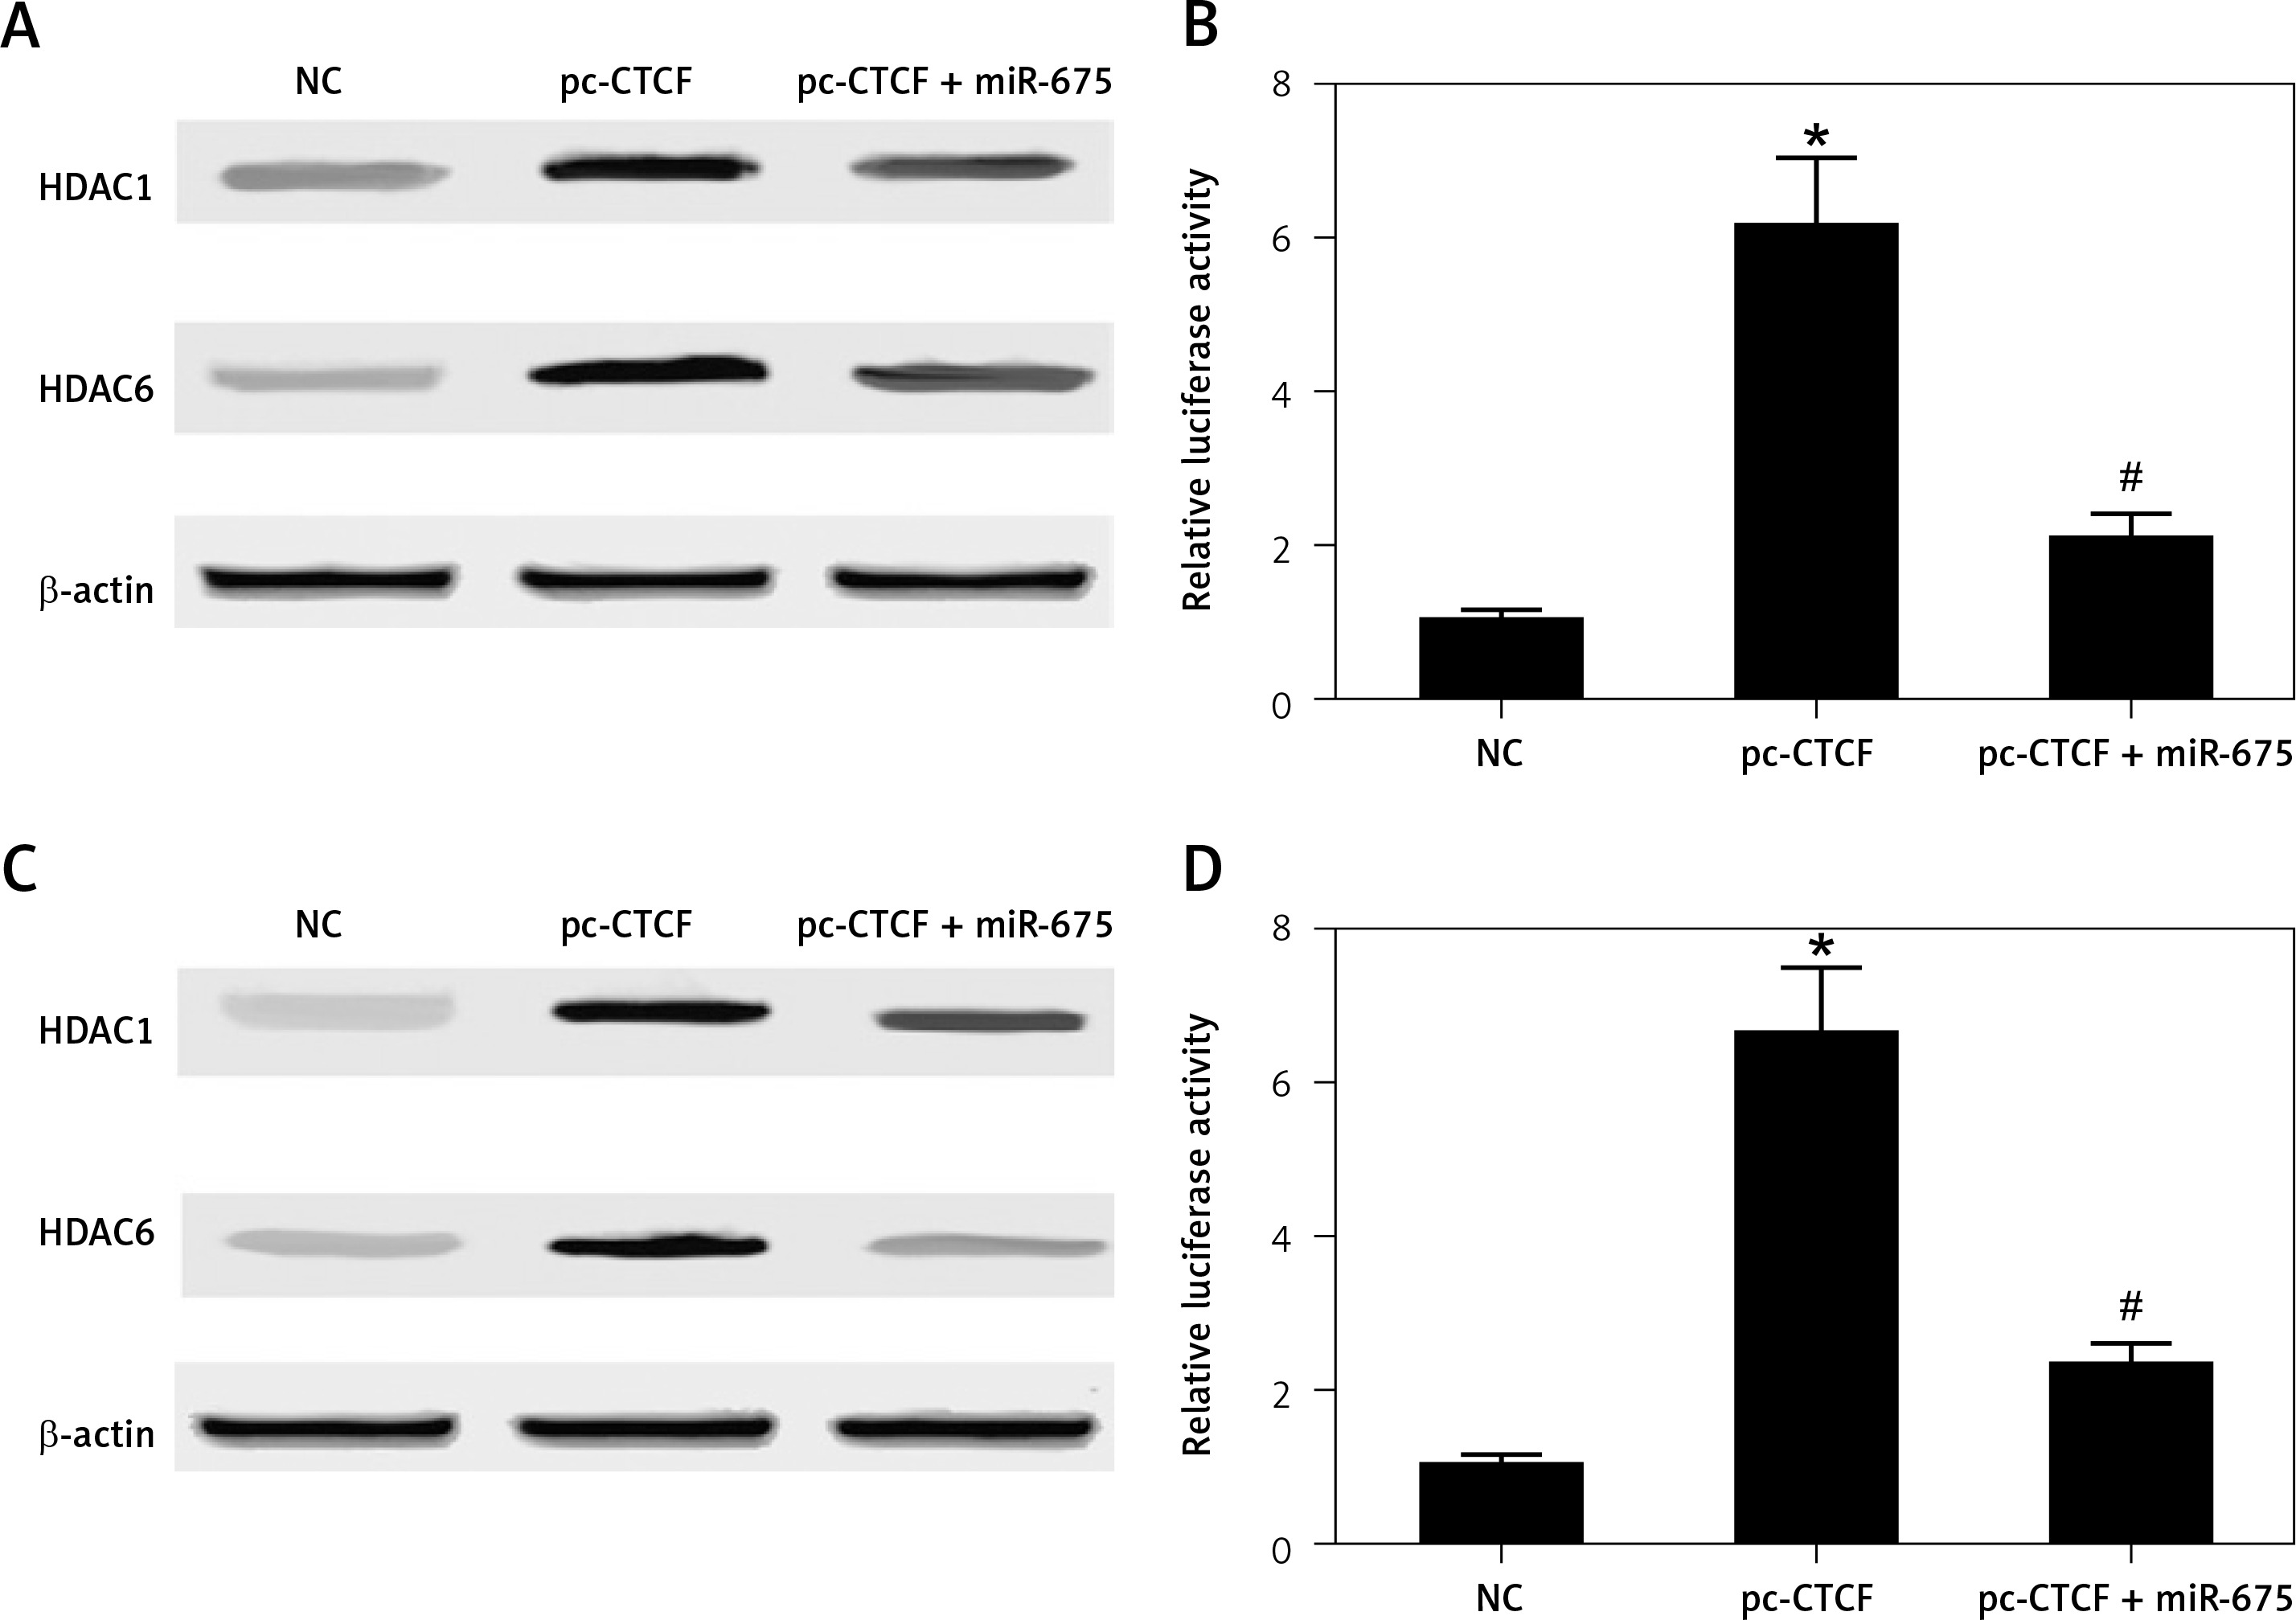
HEK293 and HEK293 cells were co-transfected with miR-675 mimics and constructs of CTCF, and then the levels of HDAC1 and HDAC6 as well as the luciferase activity of H19 promoter in transfected cells were measured. As shown in Figure 8, CTCF showed no effect on the protein levels of HDAC1 and HDAC6 while miR-675 mimics reduced the protein levels of HDAC1 and HDAC6 in HEK293 cells (Figure 8 A). Furthermore, CTCF up-regulated the luciferase activity of the H19 promoter in HEK293 cells (Figure 8 B), while the transfection with miR-675 mimics reduced the luciferase activity of the H19 promoter to a certain extent. Similar results were observed in CAKI2 cells (Figures 8 C, D).
Figure 8
Effect of CTCF on HDAC expression and the translational efficiency of the H19 promoter (*p < 0.5, vs. NC group; #p < 0.5, vs. pc-CTCF group). A – CTCF showed no effect on the protein levels of HDAC1 and HDAC6 in HEK293 cells, while miR-675 reduced the protein levels of HDAC1 and HDAC6 in these cells. B – CTCF showed no effect on the protein levels of HDAC1 and HDAC6 in CAKI2 cells, while miR-675 reduced the protein levels of HDAC1 and HDAC6 in these cells. C – CTCF increased the luciferase activity of the H19 promoter in HEK293 cells, while miR-675 mimics reduced the luciferase activity of the H19 promoter to a certain extent. D – CTCF increased the luciferase activity of the H19 promoter in CAKI2 cells, while miR-675 mimics reduced the luciferase activity of the H19 promoter to a certain extent
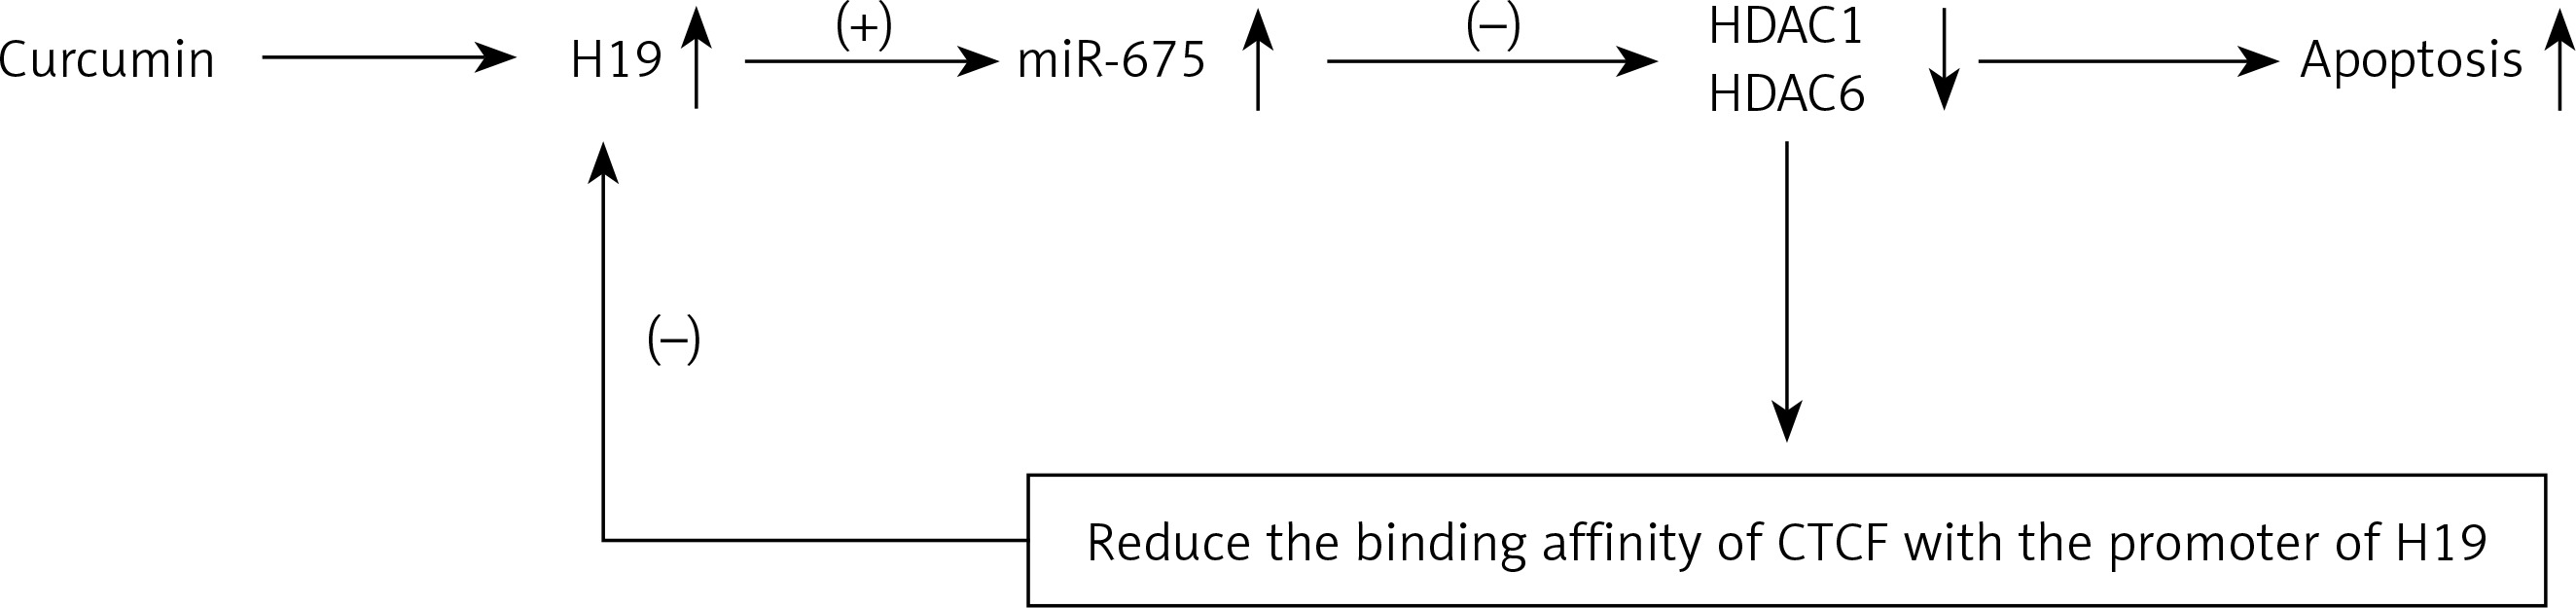
Schematic description of the effect of CUR on the negative feedback loop of H19/miR-675/HDAC/CTCF
As shown in Figure 9, the administration of CUR could down-regulate the expression of H19. In addition, we found that, since miR-675 was located within the chromosome segment of H19, the increase in H19 expression could promote the expression of miR-675. Furthermore, HDAC was found in this study as a target gene of miR-675 in HEK293 and HEK293 cells. Finally, HDAC could reduce the binding affinity of CTCF, which would result in the suppressed transcription efficiency of the H19 promoter, thus leading to the formation of a negative feedback loop of H19/miR-675/HDAC/CTCF.
Discussion
In this study, we found that particles could be specifically and safely accumulated in the kidney dose-dependently, and the localization of particles in the kidney reached its maximum level at a dose of 25 mg/kg. Furthermore, we conjugated CUR with particles and used the conjugated particles to treat RCC rats. The results showed that the administration of CUR could attenuate the severity of RCC malignancy.
As a material derived from Curcuma longa, CUR plays extensive therapeutic roles in preventing tumor progression, inhibiting angiogenesis, inducing tumor apoptosis and increasing tumor susceptibility to radiotherapy and chemotherapy [22]. In addition, CUR has been utilized in the treatment of pancreatic and colorectal cancers [23]. Accumulating data suggest that CUR can target c-Myc, p53, nuclear factor-κB, Notch1 and cyclooxygenase-2 [8]. Curcumin also plays an essential role in enhancing the radiosensitivity of several cancers, such as prostate cancer, hepatocellular carcinoma, and colorectal, cancer [24]. It was observed previously that CUR could significantly elevate the radiosensitivity of ACHN tumor cells by damaging their ultrastructure and by effectively suppressing ACHN cell growth [25]. Also, other regulatory actions of CUR on RCC have been reported. For example, Zhang et al. observed that CUR exerts its anti-cancer effect via modulating the PI3K/AKT signaling pathway in the treatment of RCC [26], and Seo et al. further reported that combined treatment with mTOR inhibitor NVP-BEZ235 and CUR could induce apoptosis of human renal carcinoma Caki cells via modulating the level of p53-dependent Bcl-2 mRNA and Mcl-1 protein [27]. Moreover, the study by Xu et al. demonstrated that CUR enhanced human renal carcinoma cell apoptosis via the up-regulation of YAP/p53 [28]; and Pei et al. reported that the level of HOTAIR not only was closely associated with the migration of RCC cells, but also was involved in the CUR-induced inhibition of RCC metastasis [2].
Curcumin inhibits cancer cell proliferation by indirectly or directly binding to multiple targets such as growth factors and transcription factors [29]. In particular, c-Myc is a key oncogene suppressed by CUR [30]. Furthermore, c-Myc can activate H19 by binding to its promoter and subsequently induce tumor development [30], such as the progression of gastric cancers [31]. It was demonstrated that exogenously administered CUR decreased H19 expression [16]. Also, H19 mainly exerts its cancer-promoting effect through miR-675, a small noncoding RNA transcribed from H19 [32]. In this research, we measured the effect of CUR on H19, miR-675 and HDAC expression, and found that CUR up-regulated H19 and miR-675 expression while down-regulating HDAC1 and HDAC6 expression. In addition, we investigated whether CUR increased the expression of H19 by increasing translation of the H19 promoter, and found that CUR indeed increased the luciferase activity of the H19 promoter in HEK293 cells.
Histone deacetylases (HDACs) could respond to signals regulating a wide and complicated array of biological processes, such as metabolism and adipocyte differentiation [33]. To date, 18 HDACs have been found in mammalian species [34]. It was observed that miR-675 and H19 could reduce the level of HDAC 4 and 5 [35]. Furthermore, miR-675 binds to the 3′UTRs of HDAC 4–6 to reduce their expression, while HDACs 1, 2, and 3 undergo minimal changes in the presence of miR-675 [20]. Epigenetic changes were detected as the result of induction by abnormal levels of HDACs and subsequent tumor progression and development. Immunohistologic evaluation of 44 RCC patients showed reduced histone acetylation [36]. Therefore, it was hypothesized that the increase in acetylated histone can benefit RCC treatment. Indeed, HDAC inhibitors were shown to block the invasion and growth of RCC [37].
H19 was found to be regulated by epigenetic mechanisms and chromatin structures, such as CTCF insulator and DNA methylation [17]. HDACs obtained from cell extracts could bind to the zinc-finger domain of CTCF [20], while the suppression of HDAC could reduce H19 expression by blocking CTCF occupancy on the imprinting control region (ICR) of H19 [20]. Furthermore, H19 was found to be controlled by epigenetic mechanisms and chromatin structures, such as CTCF insulator and DNA methylation [17]. Therefore, a proper ICR was necessary to achieve a stable binding between CTCF and the H19 promoter [17]. Here, we confirmed HDAC1 and HDAC6 as miR-675 targets. In fact, miR-675 mimics in HEK cells reduced the luciferase activity of wild-type 3’UTRs of HDAC1 and HDAC6. Moreover, we found that CTCF exerted no effect on HDAC1 and HDAC6 expression but increased the luciferase activity of the H19 promoter.
However, there were limitations of this study. The conclusion reached in our study needs further confirmation in a clinical trial to test the effect of CUR on the prognosis of RCC. Also, it is possible that CUR could affect RCC via different signaling pathways, which requires more comprehensive investigations in our future study.
In conclusion, we suggest that CUR could affect the prognosis of RCC by establishing a negative feedback loop of H19/miR-675/HDAC/CTCF, while the presence of CUR down-regulated H19 expression. In addition, we found that, since miR-675 was located within the chromosome segment of H19, the increase in H19 expression could promote the expression of miR-675. Furthermore, HDAC was found to be a miR-675 target in human cells and to play a very important role in RCC. Finally, HDAC could reduce the binding affinity of CTCF to the H19 promoter, which inhibited the transcription efficiency of the H19 promoter, establishing a negative feedback loop of H19/miR-675/HDAC/CTCF.