Introduction
Extracellular matrix (ECM) fibrosis is one of the key mechanisms that leads to heart failure (HF) [1]. Despite contemporary treatments in dilated cardiomyopathy (DCM) and HF, there is little beneficial effect on ECM fibrosis, which, in fact, frequently progresses [2]. Extracellular matrix fibrosis involves numerous parallel and intertwined mechanisms resulting in amplification or inhibition of fibrosis at various levels. In addition to well-characterized mechanisms, such as TGF-β-dependent pathways, cytokines, growth hormones, and regulatory proteins, there is increasing interest in fibrosis regulation via non-coding RNAs [3, 4]. MicroRNAs are short, non-coding RNA sequences that regulate gene expression at the post-transcriptional level by targeting the 3’-untranslated region of mRNA sequences. Recent studies indicate that microRNAs control a variety of cellular processes essential to the heart, including fibrosis [5, 6]. Circulating microRNAs are present in all blood components, including plasma, platelets, erythrocytes, and nucleated blood cells. They are remarkably stable in plasma and are resistant to harsh external conditions, such as boiling, low or high pH, long-term storage as well as internal conditions, e.g. they are protected from endogenous RNase activity [7]. The selection of microRNAs for the current study was based on research, performed predominantly in animal models, that established a link between miR-21, miR-29, miR-30, and miR-133 and cardiac fibrosis [8].
The biomarker-based approach in chronic diseases, such as HF, is slowly gaining momentum. Studies have revealed that certain biomarkers, including B-type natriuretic peptide, C-reactive protein or troponins, may help to predict clinical outcomes, distinguish high-risk subgroups or even guide therapy [9]. However, the majority of studies utilized only a single (one time point) measurement of the biomarker and, as such, our understanding of the kinetic patterns of biomarkers is rudimentary [10]. The relationships between either circulating or myocardial microRNAs and ECM fibrosis in various cardiac conditions, including DCM and HF, has been previously explored [11, 12]. However, only a few studies have investigated the dynamic nature of circulating microRNAs in cardiac diseases, and none have specifically addressed the relationship between ECM fibrosis and the kinetics of microRNAs.
Therefore, we aim to investigate the long-term kinetics of fibrosis-linked microRNAs in DCM patients stratified according to the duration of the disease and fibrosis status.
Material and methods
Study population
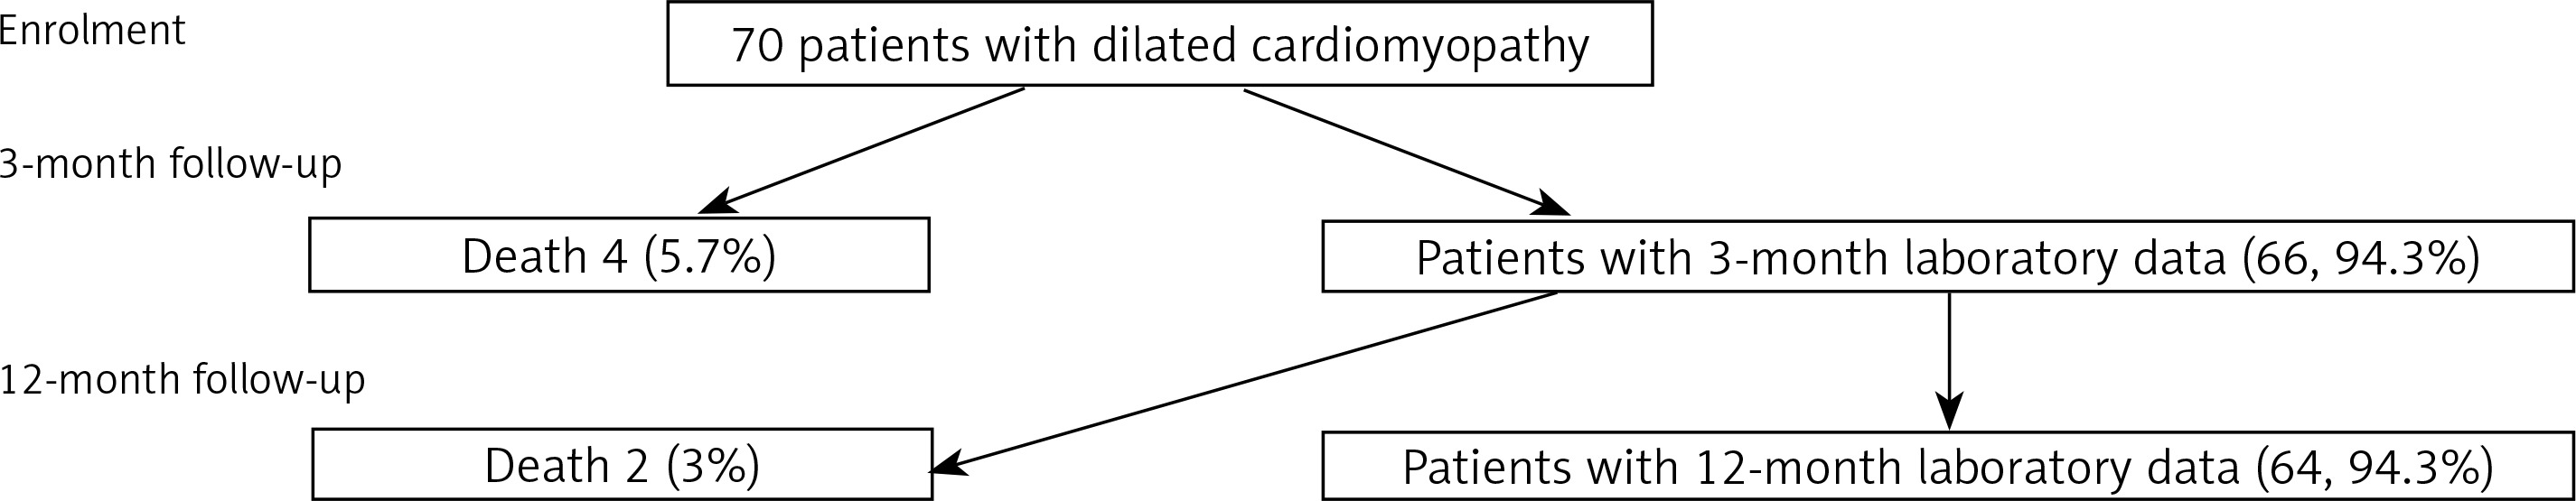
The study was approved by the institutional review board and the ethics committee, and all patients provided written informed consent prior to enrollment. Dilated cardiomyopathy was diagnosed according to the guidelines of the European Society of Cardiology [13], and HF status was defined according to New York Heart Association (NYHA) criteria. In order to be enrolled, patients with class I–III NYHA HF had to remain clinically stable for at least 2 weeks prior to beginning the study. Our hospital is a tertiary referral center for advanced HF and cardiomyopathies. All DCM patients who were recruited for this study were evaluated either in the outpatient or inpatient setting including transfers from referring hospitals. As one of the main aims of this study was to explore whether fibrosis-related biomarkers are related to the duration of disease, our goal was to include an equal number of patients with new-onset and chronic DCM (35 subjects per each group). The recruitment of patients with chronic DCM (duration > 6 months) took less time than for those with recent DCM (duration ≤ 6 months). Therefore, the chronic DCM subgroup was recruited in less than 10 months and an additional 5 months was required to complete the recruitment of the remaining new-onset DCM patients for a total of 35. Two hundred patients were screened in total. New-onset HF was defined as a duration of symptoms less than or equal to 6 months (group 1), and chronic DCM (group 2) was defined as a duration of symptoms greater than 6 months. The duration of HF symptoms was measured based on the time which had elapsed from the beginning of typical HF symptoms (such as dyspnea on exertion or at rest, paroxysmal nocturnal dyspnea, orthopnea, palpitations, and/or edemas) to the index hospitalization or ambulatory visit to the cardiology clinic. Assessment of the patients’ clinical status, transthoracic echocardiograms, and blood sampling were performed at baseline, 3, and 12 months. A study flow diagram is presented in Figure 1. The control group was composed of 20 healthy volunteers [age 35.8 ±7.9 years; male sex – 16 (80%), LV end-diastolic diameter – 49.3 ±3.4 mm, left ventricular ejection fraction – 63.8 ±4.7%]. Those subjects were recruited from a pool of healthy hospital workers, families of hospital personnel or those subjects who responded to the call. The baseline characteristics of the control group have already been presented in the previous paper [11].
Echocardiography
Echocardiography was performed according to the recommendations of the American and European Associations of Cardiovascular Imaging [14]. Transthoracic echocardiograms were obtained on commercially available equipment (Vivid 7 GE Medical System, Horten, Norway) with a phased array 1.5–4 MHz transducer. Conventional M-mode, 2-dimensional and Doppler parameters were calculated. All measurements were obtained from the mean of 3 beats for patients in sinus rhythm, and 5 beats for those in atrial fibrillation. Chamber diameters, areas, and volumes were normalized for body surface area.
Endomyocardial biopsy
Endomyocardial biopsy (EMB) procedures were performed via a femoral or jugular vein approach [15]. Long (104 cm), flexible, 7 French disposable biopsy forceps with small jaws (Cordis, Johnson & Johnson Co, Miami Lakes, FL, USA) were used. Relying on years of experience, both in the biopsy technique and state-of-the-art pathology assessment, we have found that five good quality myocardial samples are adequate for numerous laboratory analyses. Consequently, we acquired five samples in the majority of cases. However, in 5 patients due to reasons including technical difficulties and length of the procedure, we sampled 3–4 cardiac samples. The presence or absence of fibrosis as well as the degree of fibrosis was determined qualitatively by an experienced pathologist who had been blinded to the clinical data. Specimens for fibrosis assessment were stained with Masson’s trichrome; fibrotic areas stained blue and normal muscle fibers stained red. We defined ECM fibrosis as the disproportionate accumulation of fibrillar collagen between intermuscular spaces previously devoid of collagen. Patients were diagnosed as either fibrosis-positive or negative. Collagen volume fraction (CVF) was assessed by quantitative morphometry in biopsy sections stained with collagen specific picro-sirius red. For each cardiac sample, a total of 10 fields were analyzed with a × 40 objective lens. CVF was expressed as the percentage of the red-stained area per total myocardial tissue area and expressed as a percentage (%) [11].
Circulating microRNAs
Levels of microRNA were measured by qPCR. The technique was previously described [16]. RNA was extracted from 100 µl of plasma using a Mir-Vana kit (Life Technologies) following the manufacturer’s protocol. Two microliters of extracted RNA was used to perform reverse transcription with a TaqMan Advanced MicroRNA cDNA Synthesis Kit (Life Technologies). Samples of cDNA were 10× diluted before the qPCR reaction. qPCR was conducted on 384-well plates with TaqMan Advanced MasterMix and TaqMan Advanced Assays targeting: hsa-miR-21-5p, hsa-miR-29b-3p, hsa-miR-30c-5p, hsa-miR-133a-3p, hsa-miR-26a-5p. Fifteen microliter reactions were prepared with a Bravo pipetting station (Agilent Technologies), and the real-time reaction was run and read on the CFX384 Real Time PCR Detection System (Bio-Rad). Three microRNAs (miR-15b, miR-16 and miR-423) were selected based on our previous experience with qPCR in plasma samples. A coefficient of variation and M-value were calculated for these microRNAs. The best combination of micro-RNAs was miR-15b and miR-16 (CV = 0.23 and 0.2; respectively). Mean Cq values were normalized to the geometric mean of hsa-miR-15b-5p and hsa-miR-16-5p, which were selected as relatively stable controls in pilot experiments. Normalized data were expressed for each sample as [2–ΔCq]. ΔCq is defined as the difference between the Cq value of the microRNA of interest and the geometric mean of miR-15b and miR-16 for a particular sample.
Statistical analysis
The normality of the distribution of variables was assessed with the Shapiro-Wilk test. Levels of biomarkers at different time-points were compared using the Wilcoxon test for paired samples. A nonparametric test was used since differences between time-points were not normally distributed (according to the Shapiro-Wilk test). Differences between the two groups in terms of levels of miR-21, miR-29 etc. at a single time-point as well as differences in changes between time-points were assessed with the Mann-Whitney-Wilcoxon two-sample test. A nonparametric procedure was chosen due to the lack of normality in the groups compared. All results were considered statistically significant when p was < 0.05. All the analyses were conducted in R software, version 3.3.2 (R Foundation for Statistical Computing, Vienna, Austria).
Results
Baseline characteristics
Table I shows the baseline characteristics of the study population. The majority of patients were male with HF (NYHA class 2.49 ±0.7). All of the patients had a severely remodeled LV with significantly depressed LV ejection fraction (LVEF 24.4 ±7.4%). Approximately one-third of patients had ECM fibrosis diagnosed with EMB (n = 24; 34.3%). Patients had a significantly increased serum NT-proBNP level (3373 ±5428 pg/ml). All patients were on optimal medical therapy.
Table I
Baseline characteristics of the study population (n = 70)
[i] Data are presented as mean ± SD or n (%). BMI – body mass index, NYHA – New York Heart Association class, LBBB – left bundle branch block, LVESd/BSA – indexed to body surface area left ventricular end-systolic diameter, LVEDd/BSA – indexed LV end-diastolic diameter, LVESvol/BSA – indexed LV end-systolic volume, LVEDvol/BSA – indexed LV end-diastolic volume, LVEF – left ventricular ejection fraction, E/E’ (average sep + lat) – ratio of early mitral inflow E-wave and early myocardial E’ velocity (E’ – average of septal and lateral myocardial velocity), ECM fibrosis – extracellular matrix fibrosis, PA mean – mean pulmonary artery pressure, PH – pulmonary hypertension, VO2peak – peak oxygen uptake, Hb – hemoglobin, hs-troponin T – high-sensitivity troponin T, hs-CRP – high-sensitivity C-reactive protein, NT-proBNP – amino-terminal pro B-type natriuretic peptide, ACE-I – angiotensin converting enzyme inhibitor, ARB – angiotensin receptor type 1 blocker, MRA – mineralocorticoid receptor antagonist, CRT-D – cardiac resynchronization therapy with cardioverter-defibrillator.
Comparison of 3- and 12-month microRNAs between dilated cardiomyopathy patients and the control group
A comparison of baseline values of circulating microRNAs between DCM patients and the control group was presented in a previous paper [11]. Three- and 12-month microRNA comparisons between those two groups are presented in Table II. All microRNAs, both at 3 and 12 months, significantly differed between DCM patients and the controls.
Table II
Comparison of serum extracellular matrix fibrosis parameters between dilated cardiomyopathy patients and the control group at 3- and 12-month follow-up
Kinetics of circulating microRNAs in new-onset dilated cardiomyopathy
MiR-21 was similar at baseline and 3 months (0.04 ±0.63 and –0.18 ±0.45 ΔCq); however, miR-21 significantly decreased between baseline and 12 months (0.04 ±0.63 vs. –0.45 ±0.49 ΔCq). All three microRNAs – miR-29, miR-30 and miR-133 – had exactly the same pattern: a significant increase from baseline via 3 months to 12 months (miR-29: 2.94 ±0.54 vs. 6.40 ±0.76 and 2.94 ±0.54 vs. 7.10 ±1.34 ΔCq; miR-30: 4.34 ±1.24 vs. 6.34 ±2.35 and 4.34 ±1.24 vs. 7.76 ±1.58 ΔCq; miR-133: 8.07 ±1.85 vs. 10.33 ±1.40 and 8.07 ±1.85 vs. 10.11 ±1.28 ΔCq; all p < 0.05). Individual microRNA values over time are depicted in Figure 2.
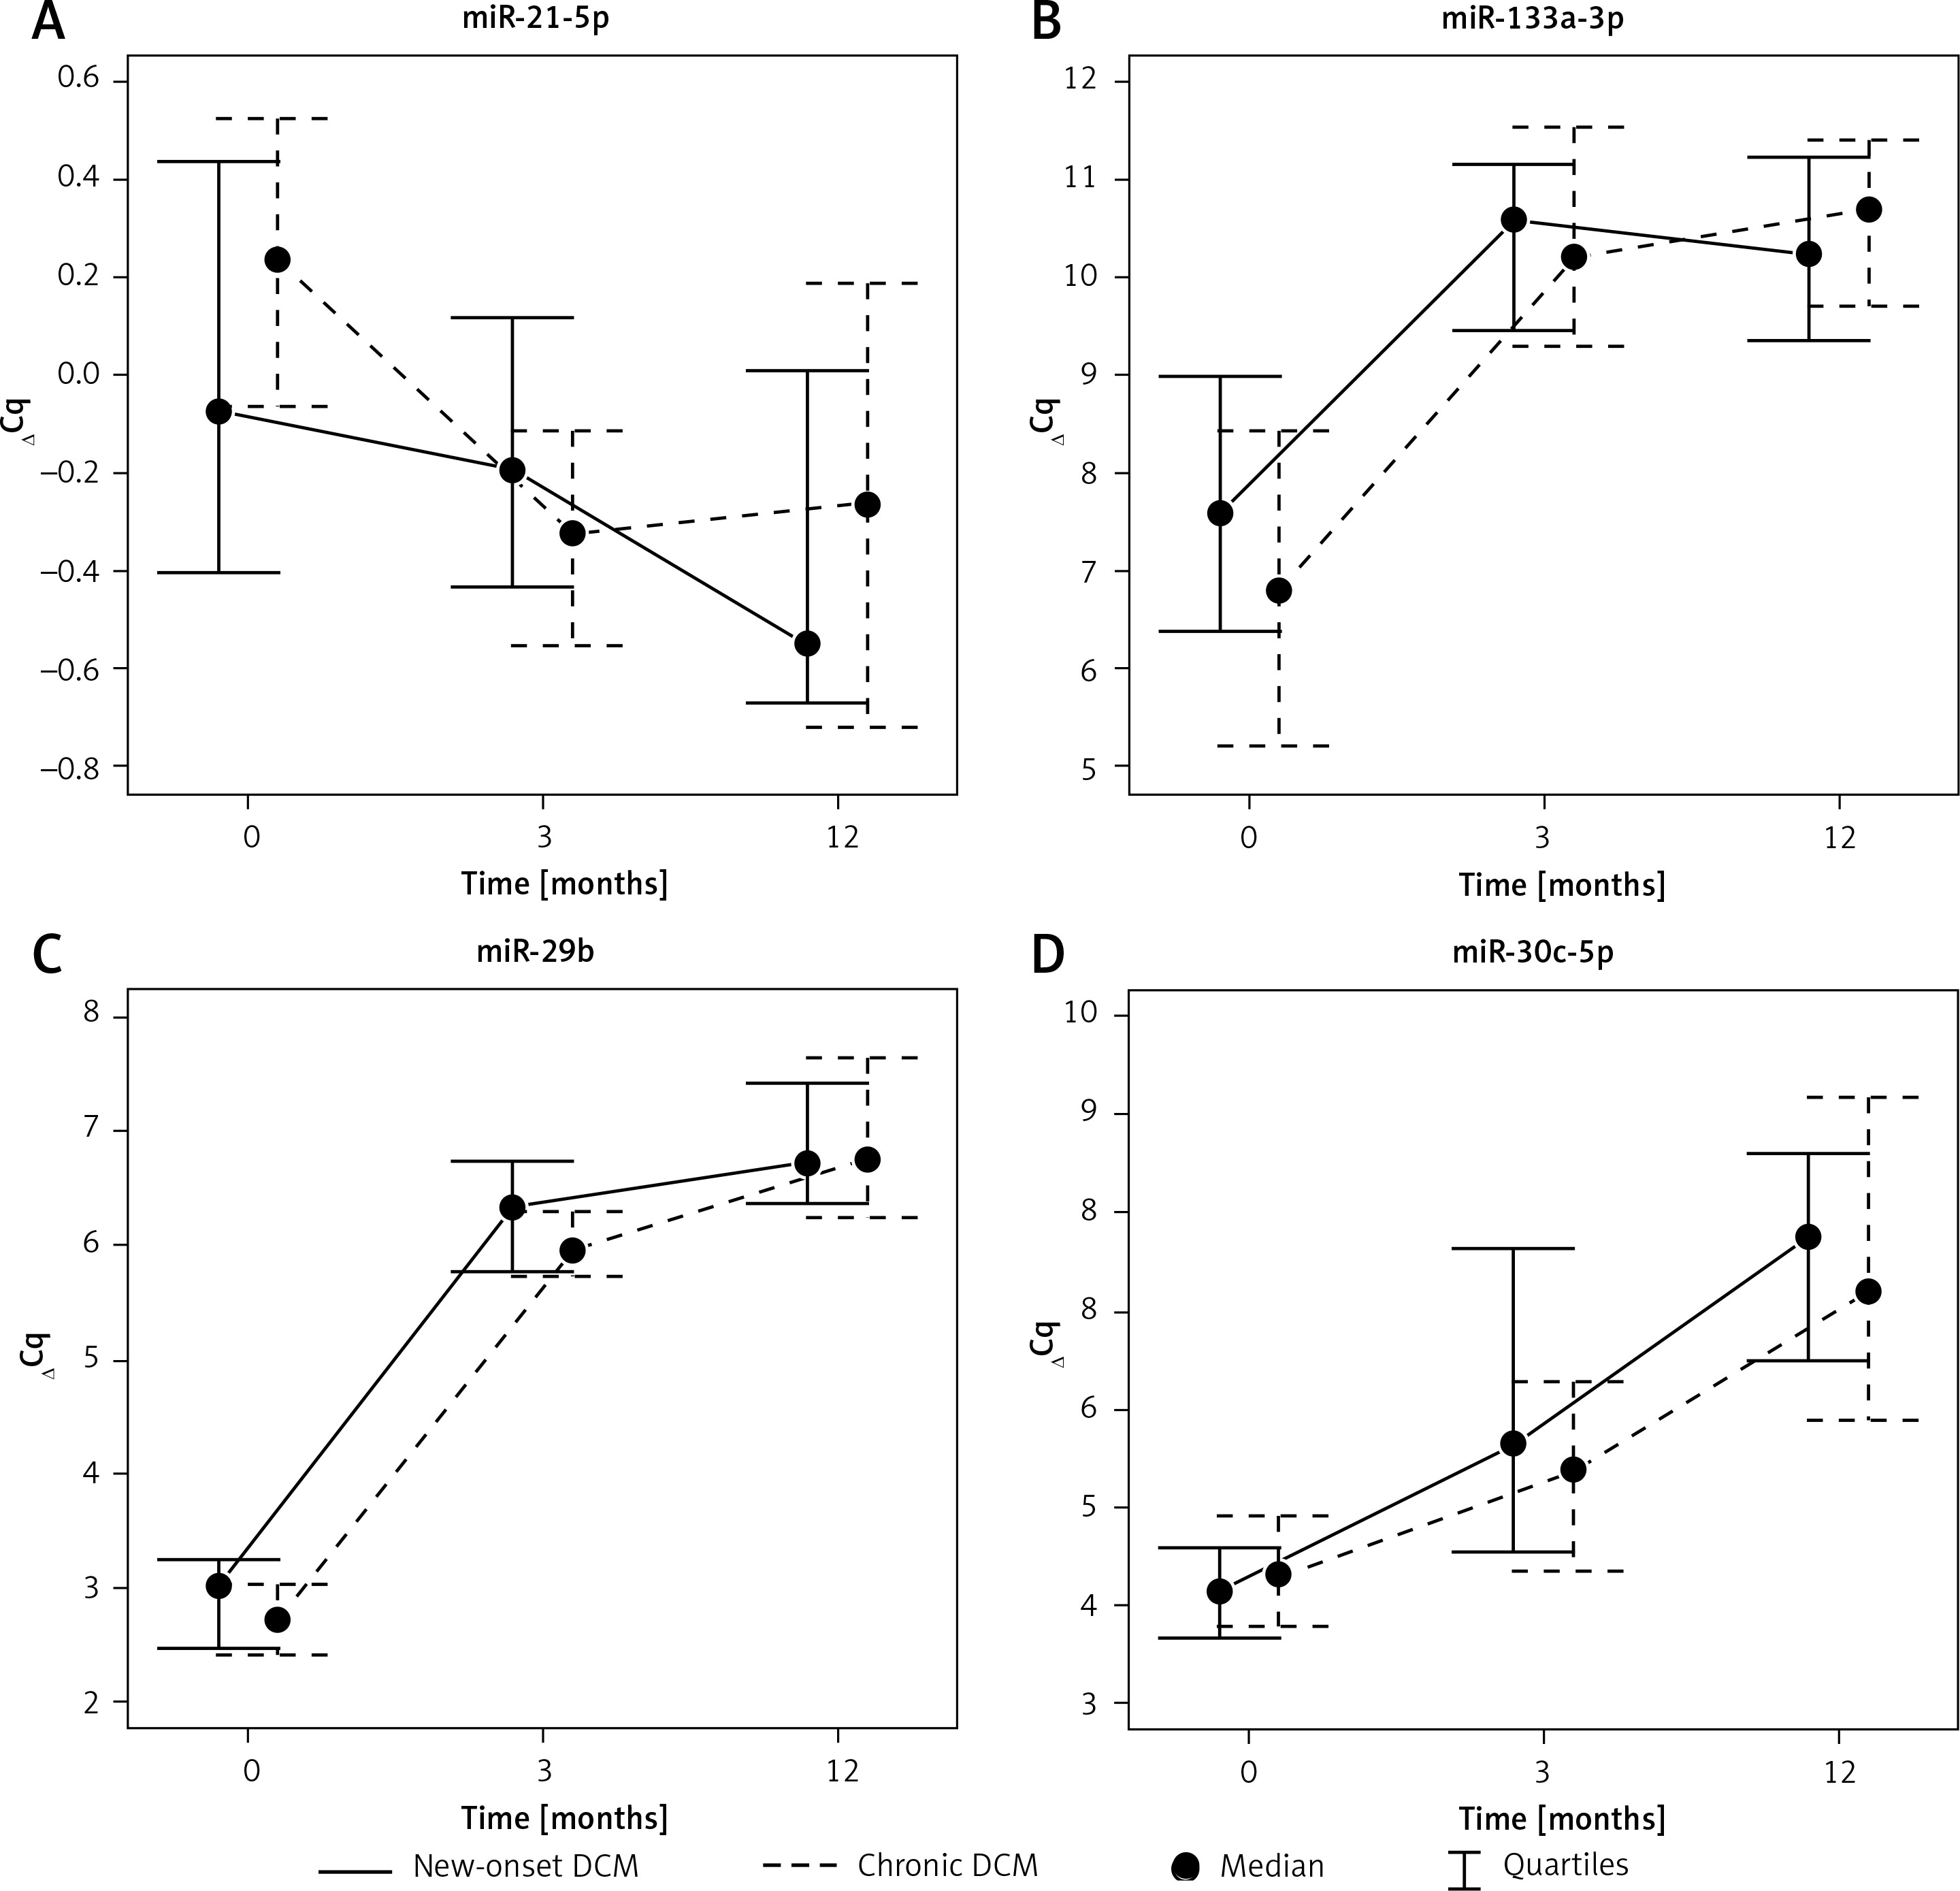
Kinetics of circulating microRNAs in chronic dilated cardiomyopathy
Only miR-21 levels decreased from baseline via interim measures at 3 months to 12 months (0.41 ±0.54 vs. –0.36 ±0.38 vs. –0.28 ±0.77 ΔCq; p < 0.05). At the same time, the remaining microRNAs levels increased: both miR-29 and miR-30 values differed between baseline and 3- and 12-month (miR-29: 2.80 ±1.02 vs. 6.07 ±0.86 and 2.80 ±1.02 vs. 6.89 ±1.19 ΔCq; miR-30: 4.16 ±0.82 vs. 5.41 ±1.61 and 4.16 ±0.82 vs.7.9 ±2.85 ΔCq; p < 0.05), and also between 3- and 12-month measurements (miR-29: 6.07 ±0.86 vs. 6.89 ±1.19 ΔCq; miR-30: 5.41 ±1.61 vs. 7.9 ±2.85 ΔCq; p < 0.05). The value of miR-133 increased from baseline to 3 and 12 months (7.20 ±2.93 vs. 10.19 ±1.36 vs. 10.75 ± 1.04 ΔCq; p < 0.05). However, it was similar between 3- and 12-month controls (Figure 2).
Kinetics of circulating microRNAs in dilated cardiomyopathy with fibrosis
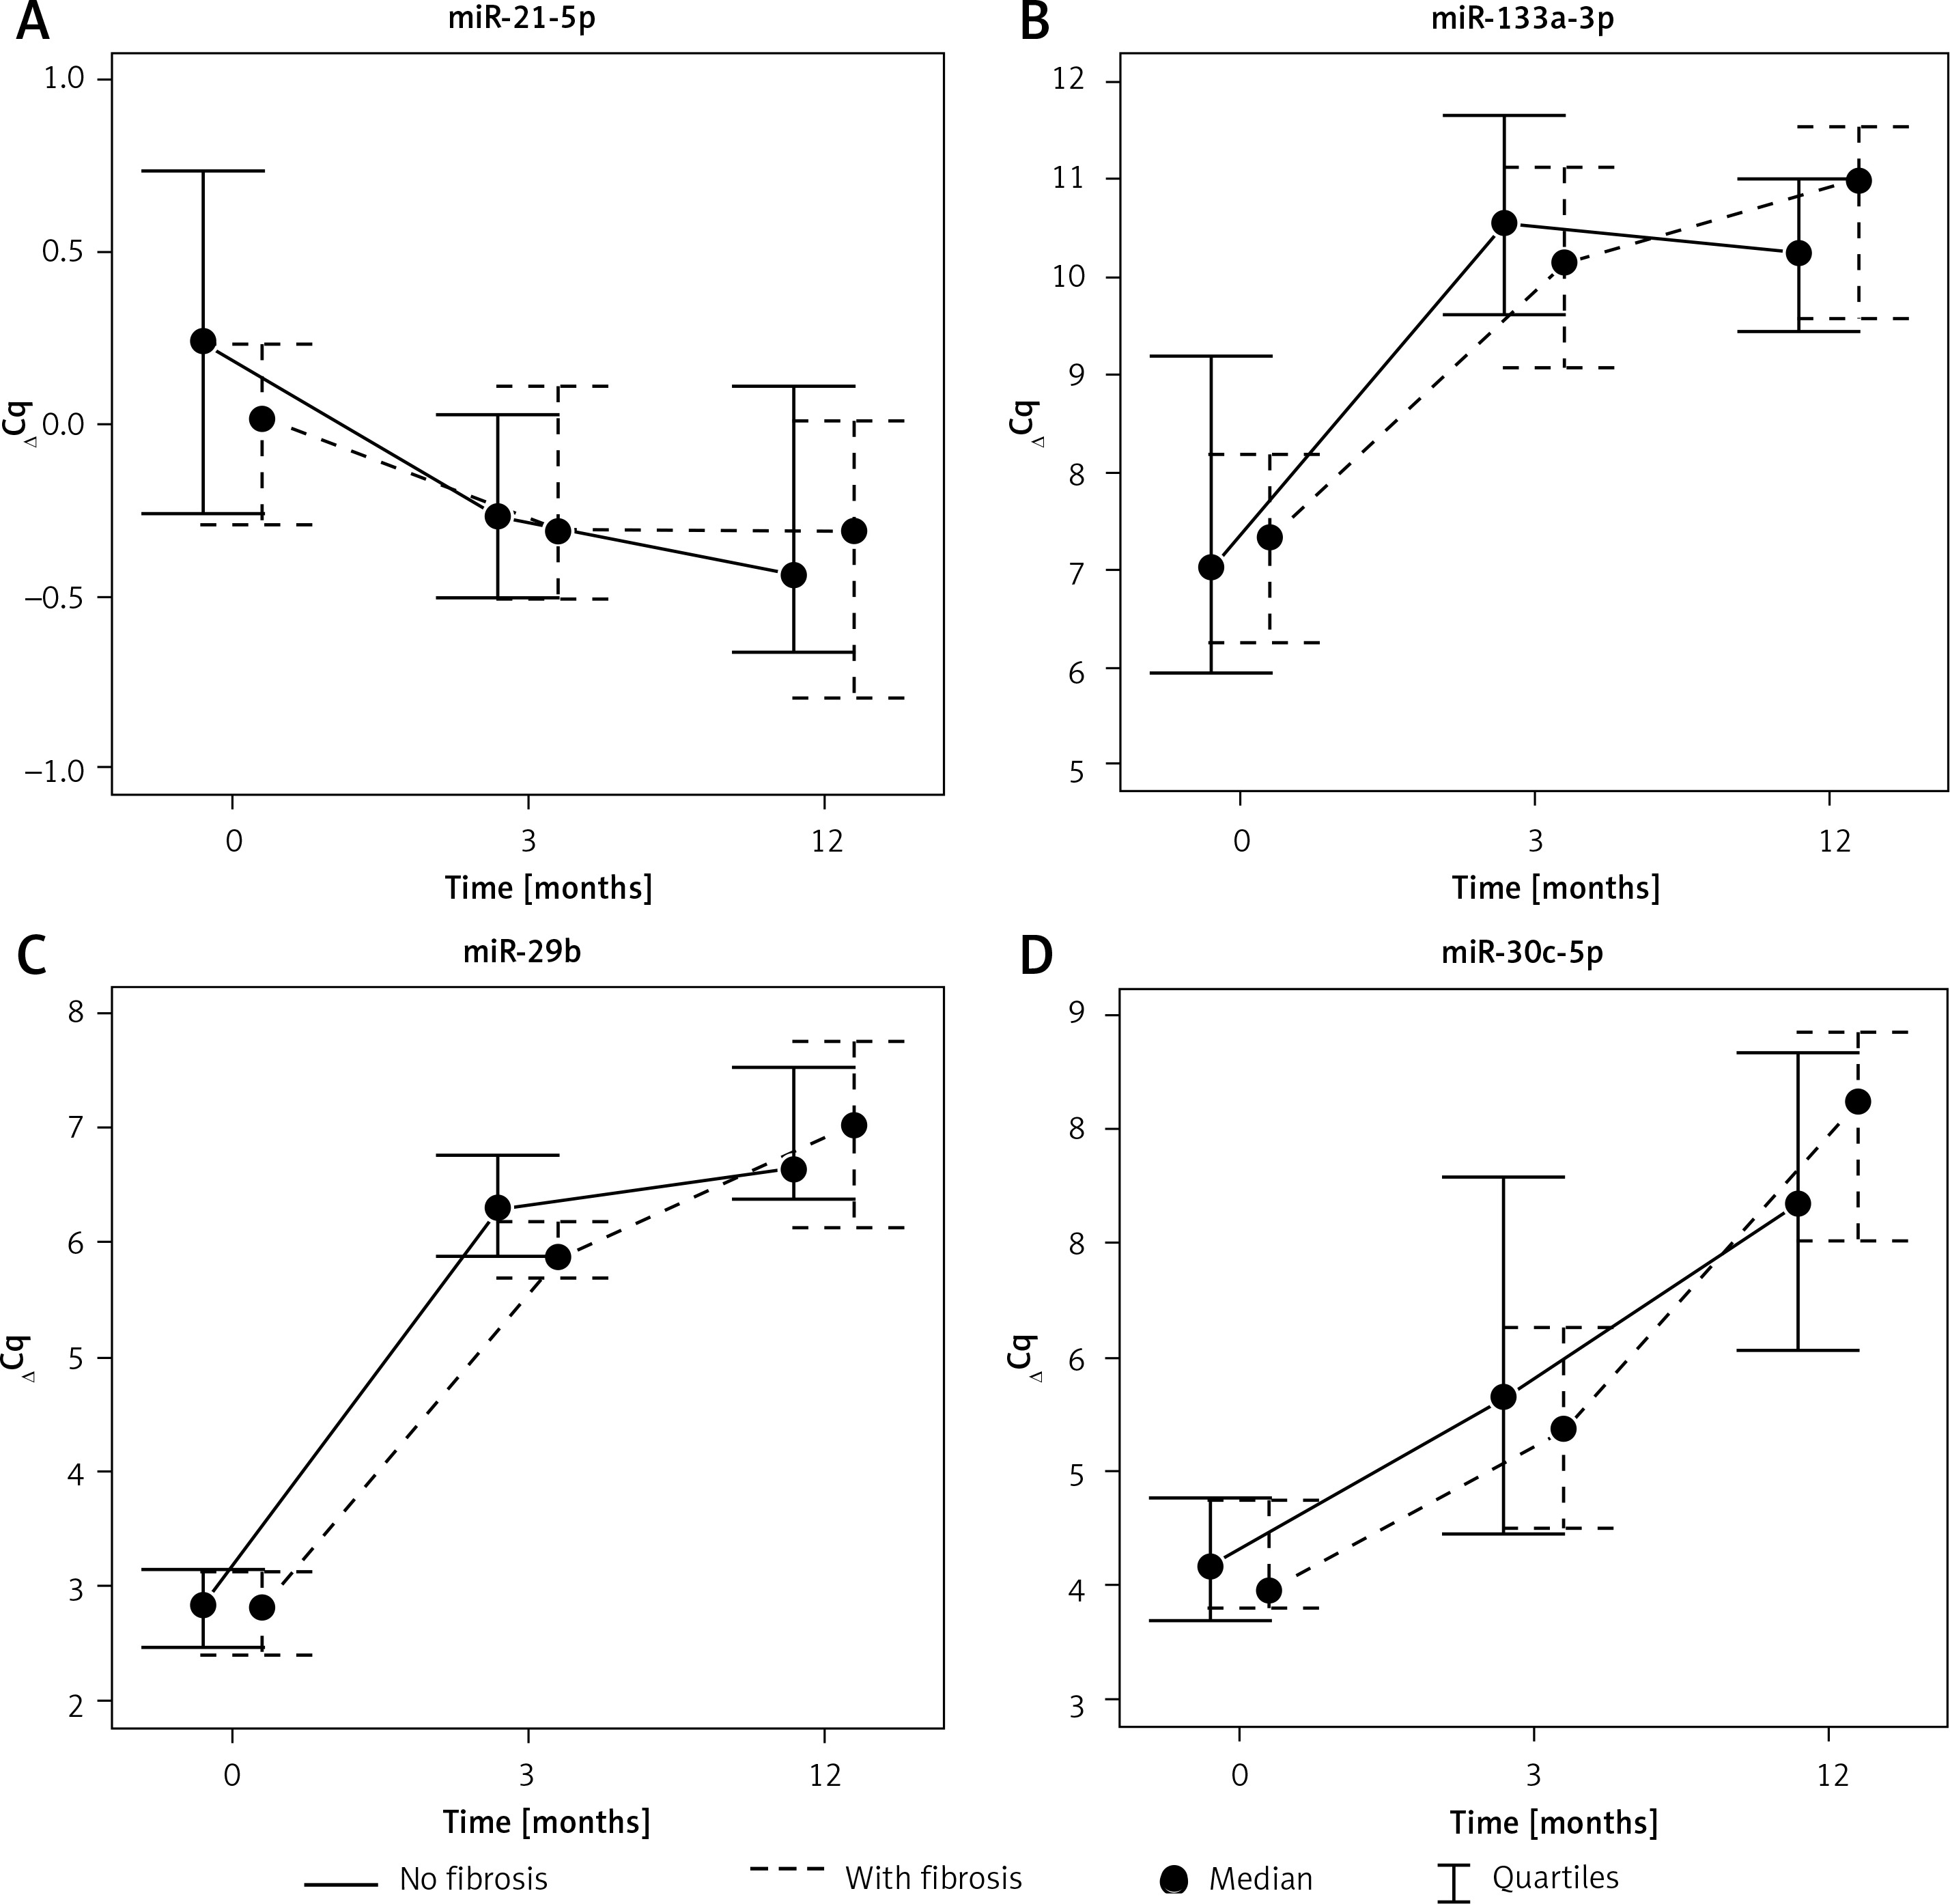
There was no statistically significant difference in miR-21 values at baseline, 3- and 12-month measurements (0.01 ±0.47 vs. –0.25 ±0.47 vs. –0.39 ±0.51 ΔCq; NS). The data are depicted in Figure 3. Both miR-29 and miR-30 differed between baseline and 3 months (miR-29: 2.95 ±1.04 vs. 5.95 ±0.76 ΔCq; miR-30: 3.98 ±0.75 vs. 5.42 ±1.4 ΔCq; p < 0.05), baseline and 12 months (miR-29: 2.95 ±1.04 vs. 7.16 ±1.35 ΔCq; miR-30: 3.98 ±0.75 vs. 8.15 ±2.71 ΔCq; p < 0.05), and 3 and 12 months (miR-29: 5.95 ±0.76 vs. 7.16 ±1.35 ΔCq; miR-30: 5.42 ±1.4 vs. 8.15 ±2.71 ΔCq; p < 0.05). The value of miR-133 increased from baseline to 3 months and 12 months (6.9 ±1.71 vs. 9.98 ±1.33 vs. 10.51 ±1.3ΔCq; p < 0.05) but it was similar between 3 and 12 months.
Kinetics of circulating microRNAs in dilated cardiomyopathy without fibrosis
The comparisons of circulating microRNAs measured at baseline and at 3 and 12 months in DCM patients without fibrosis are presented in Figure 3. The value of miR-21 significantly decreased from baseline to 3 and 12 months (0.32 ±0.71 vs. –0.27 ±0.40 vs. –0.37 ±0.70 ΔCq; p < 0.05). The opposite pattern was observed with miR-29 and miR-133 (miR-29: 2.83 ±0.61 vs. 6.42 ±0.81 vs. 6.90 ±1.22 ΔCq; miR-133: 8.19 ±2.67 vs. 10.45 ±1.39 vs. 10.32 ±1.16 ΔCq; p < 0.05) without differences between 3- and 12-month measurements. MiR-30 significantly increased from baseline to 3 months (4.42 ±1.19 vs. 6.22 ±2.37 ΔCq; p < 0.05), between baseline and 12 months (4.42 ±1.19 vs. 7.63 ±1.90 ΔCq; p < 0.05), and between 3 and 12 months (6.22 ±2.37 vs. 7.63 ±1.90 ΔCq; p < 0.05).
Comparison of the kinetics of circulating microRNAs between new-onset and chronic dilated cardiomyopathy
MicroRNA values are provided above, and the p-values are shown in Table III. Twelve-month kinetics are depicted in Figure 2. Analyses revealed that there was no statistical difference between microRNA levels either at 3 months or 12 months between new-onset and chronic DCM patients.
Comparison of the kinetics of circulating microRNAs between dilated cardiomyopathy with and without fibrosis
MicroRNA values are presented above, and the p-values are included in Table IV. The illustration of the kinetics of microRNAs in patients with and without fibrosis is further depicted in Figure 3. Only miR-21 differed between the groups at 3 months; however, miR-21 was similar at 12 months. MiR-29, miR-30 and miR-133 did not differ between patients with and without fibrosis at any time point.
Correlations between circulating microRNAs at 3 and 12 months with collagen volume fraction
Out of four microRNAs only miR-29 at 3 months inversely correlated with CVF (r = –0.31; p < 0.01). There was no relationship with any other microRNA at any time point to fibrosis (Table V).
Table V
Correlations between 3- and 12-month microRNAs and extracellular matrix fibrosis expressed as collagen volume fraction
Discussion
The main findings of the study can be summarized as follows. First, 12-month kinetics of miR-21, miR-29, miR-30 and miR-133 are similar in DCM patients stratified according to disease duration and fibrosis status. Second, except for one significant difference of miR-29 at 3 months between DCM patients with and without fibrosis, the 12-month patterns of the remaining microRNAs do not differ in patients with new-onset and chronic DCM and patients with and without fibrosis. Thus, no distinct microRNA pattern, regardless of the duration of disease and fibrosis status, has been identified. Finally, correlations between 4 microRNAs, measured at 3 and 12 months, and ECM fibrosis are lower than expected.
The majority of studies on the biological role of microRNAs, either in humans or laboratory animals, relied only on a single (one time point) measurement. As such, there is a dearth of knowledge regarding the pattern of microRNAs in cardiac diseases. The few studies that have explored this subject concentrated on either short-term (hours and days) or longer-term (months) kinetics. Most of those studies focused on the kinetic release of microRNAs in urgent cardiac conditions, such as acute myocardial infarction (AMI) or HF exacerbation requiring urgent hospitalization. Although more than a dozen microRNAs have been associated with cardiac fibrosis, it is unknown whether these associations are maintained over a longer period and whether fibrosis determines any specific pattern of microRNAs.
The investigators of the Bio-SHIFT project performed repeated measurements of multiple microRNAs, specifically, miR-1254, miR-22-3p, miR-423-5p, miR-486-5p, miR-320a, miR-345-5p, miR-378a-3p, in 263 outpatients with HF [17]. The authors explored the associations of the temporal patterns of these microRNAs with adverse events. The authors discovered that the temporal pattern of miR-22-3p was inversely and independently associated with the primary endpoint, a combination of HF hospitalization, cardiovascular mortality, cardiac transplantation and LVAD implantation [17]. Our studies have previously reported the absence of associations between baseline circulating microRNAs, specifically, miR-21, miR-26, miR-29, miR-30 and miR-133a with CV outcomes. However, myocardial miR-133a was found to be an independent predictor of the combined endpoint of CV death and urgent HF hospitalization [12]. In another study, Koyama et al. investigated short-term kinetics (from admission to hospital day 7) of a panel consisting of 125 microRNAs in 42 patients who were urgently admitted due to HF exacerbation [18]. The authors detected several fluctuations of circulating microRNAs, including miR-122-5p, miR-143-3p, miR-196-5p, and miR-200c-5p. Out of this large panel of microRNAs, miR-122-5p was found to be most abundant and correlated with changes in serum liver function markers (aspartate aminotransferase and alanine aminotransferase) that reflect liver damage [18]. Although Leistner et al. did not study longitudinal changes of microRNAs, they explored the trans-coronary (measured in the aorta and coronary sinus) gradient of microRNAs in 52 patients with stable coronary artery disease (CAD) [19]. The authors observed correlations between plaque burden (assessed with optical coherence tomography) and the trans-coronary gradient of miR-126-3p, miR-145-5p, miR-155-5p, and miR-29b-3p. Of note, the trans-coronary gradient of miR-29b-3p correlated significantly with plaque fibrosis [19]. The correlation of miR-29b with fibrosis (plaque fibrosis and ECM fibrosis) strengthens our knowledge on the pro-fibrotic role of miR-29.
Studies from our group as well as others have shown much stronger correlations between microRNAs and ECM fibrosis, e.g. baseline miR-26 and miR-30 correlated with collagen volume fraction (r = 0.48 and r = –0.58; p < 0.01, respectively) [11, 20]. Although we applied exactly the same methodology of microRNA analysis, we did not observe similar correlations between ECM fibrosis and the aforementioned or other microRNAs under study, albeit measured at 3 and 12 months. There is no clear explanation for this profound discrepancy other than that the kinetics of “pro-fibrotic” microRNAs fluctuate for yet undetermined reasons. This possibility should be taken into account in order to properly interpret the value of any microRNAs as a biomarker.
Unfortunately, no distinct pattern of any microRNA under study was observed regardless of the duration of disease and, more importantly, regardless of fibrosis status. It should be noted that we applied invasive techniques for the assessment of ECM fibrosis. If we had used non-invasive methods of fibrosis evaluation such as cardiac magnetic resonance imaging, we might have observed somewhat different results [21]. Although repeat cardiac biopsies are rarely performed, Mlejnek et al. have recently provided data that such an approach may be safe and justified [22].
Despite initial enthusiasm regarding the potential utility of circulating microRNAs as biomarkers, including markers of fibrosis, the absence of any strong relationship between the microRNAs under study and cardiac fibrosis calls into question their relevance as markers of fibrosis [23]. Furthermore, patients with and without fibrosis had almost identical microRNA kinetics. This observation can be viewed as another argument against their utility as biomarkers.
There are several potential limitations to the present study. One limitation may be the size of the cohort. The larger the cohort, the greater is the validity of the study. However, this study was conducted at a single center with a dedicated cardiomyopathy clinic and a recruitment period of over 12 months. All patients underwent RV endomyocardial biopsy and were prospectively followed. As such, our single-center study size may be viewed as robust. The number of microRNAs which were assessed is relatively small, as all measures were performed by quantitative PCR. Novel capabilities of new generation sequencing offer much larger panels of microRNAs. As with any study with endomyocardial biopsy, sampling error and patchy distribution of fibrosis should always be taken into account.
In conclusion, regardless of ECM fibrosis status and duration of disease, 12-month patterns of circulating microRNAs, specifically miR-21, miR-29, miR-30 and miR-133, are similar in DCM. Thus, the presence or absence of fibrosis and new-onset versus chronic DCM are not characterized by distinct microRNA patterns. Correlations between microRNAs, measured at 3 and 12 months, are lower than expected and do not reflect findings previously observed at baseline measurements. The study sheds new light on the biology of microRNAs in the context of ECM fibrosis in DCM that calls into question the potential application of microRNAs as fibrosis-specific biomarkers.