Introduction
An increased incidence of type 2 diabetes mellitus has become a big public health problem worldwide. Diabetes is one of the most important risk factors for cardiovascular disease. Increasing research has revealed the correlation between diabetes and the increased risk of cardiovascular disease.
MicroRNAs are a group of small non-coding RNAs that bind to target genes, leading to the inhibition of gene expression in both healthy and sick hosts. Recent studies have shown that the disorder of miRNA expression leads to various metabolic diseases [1]. In the cardiovascular system, miRNAs play an important role in endothelial cell (EC) and vascular smooth muscle cell (VSMC) biology [2, 3]. miR-126 negatively regulates the vascular endothelial growth factor (VEGF) pathway in mouse EC [4, 5]. miR-92a is abundant in human EC. Overexpression of miR-92a blocked new blood vessel growth both in human umbilical vein endothelial cells (HUVECs) and zebrafish [6]. When limb ischemia and myocardial infarction in mice were treated with miR-92a antagomir to inhibit miR-92a expression, blood vessel growth and function were recovered [6]. miR-21 is also highly expressed in the arteries of arteriosclerosis obliterans [7]. Depletion of miR-21 prevents VSMC proliferation and activates cellular apoptosis [8].
Glucagon-like peptide 1 (GLP-1) is one of the most important incretin hormones and promotes insulin secretion after nutrient ingestion. However, GLP-1 is quickly digested by dipeptidyl peptidase-4 (DPP-4) in the circulation.
Dipeptidyl peptidase-4 inhibitors maintain glucose homeostasis by inhibiting the enzymatic activity of DPP-4 and increasing the concentration of GLP-1 in the circulation [9–11]. Dipeptidyl peptidase-4 is highly expressed in EC [12, 13]. DPP-4 can moderate vascular function through GLP-1 independent pathways [14]. Increasing evidence has shown the cardiovascular protection function of DPP-4 inhibitors [15]. Vildagliptin, a DPP-4 inhibitor, was approved to treat diabetes by the European Agency in 2008. In addition to glucose control, DPP-4 inhibitors also protect cardiovascular function. Sitagliptin attenuates infarct size in myocardial ischemia in rodents [16]. Vildagliptin attenuates the depressed heart rate variability (HRV), cardiac dysfunction, and cardiac mitochondrial dysfunction in rats fed a high-fat diet [17, 18]. Vildagliptin combined with metformin provides better cardiovascular outcomes than single therapy [19]. Because DPP-4 is found on endothelial cells, DPP-4 inhibitors may also have direct effects on the cardiovascular system, independent of the incretin system. Stromal cell-derived factor (SDF)-1α is known as a substrate for DPP-4, and DPP-4 inhibitors could increase SDF-1 concentrations. SDF-1α participates in healing of the injured myocardium [20]. Another proposed mechanism may be the reduction in inflammation by DPP-4 [21]. However, the exact mechanism of DPP-4 cardiovascular protection is still not clear.
Several studies have shown that some key miRNAs contributed to pancreatic β cells in GLP-1 agonist-treated diabetic rodents and patients, such as miR-7 [22], miR-9 [22], miR-375 [22–24], miR-27a [25], miR-139-5p [26], miR-132 [27], miR-212 [27]. However, the effect of GLP-1 agonists or DPP-4 inhibitors on the diabetic cardiovascular system is still unknown.
The purpose of this study was to find candidate miRNAs involved in the mechanism of vildagliptin in cardiovascular protection. We applied whole miRNA expression arrays and bioinformatics to seek the key miRNA and pathways in vildagliptin-treated diabetic rats.
Material and methods
Animal experiment
All animal experiments were approved by the Animal Care Committee of the Peking Union Medical Hospital Animal Ethics Committee (Project XHDW-2015-0051, 15 Feb 2015), and all efforts were made to minimize suffering. Five-week-old male Sprague-Dawley (SD) rats (163.3 ±18.8 g) were purchased from the Institute of Laboratory Animal Science, Chinese Academy of Medical Sciences and Peking Union Medical College (Beijing, China, SCXK-2014-0013). All rats were fed in a 12 : 12 h light-dark cycle (lights on between 7 AM to 7 PM) under controlled temperature (21 ±1°C) and humidity (50–60%). After adaptation, rats were divided into four groups: normal control (CON, n = 6), diabetic (DM, n = 6), Lvil (low dosage of vildagliptin, n = 6), and Hvil (high dosage of vildagliptin, n = 6). Normal control rats were fed a standard rodent diet (kcal %: 10% fat, 20% protein, and 70% carbohydrate; 3.85 kcal/gm). Meanwhile, the other three groups received a high-fat (HF) diet (kcal %: 45% fat, 20% protein, and 35% carbohydrate; 4.73 kcal/gm, Research Diet, New Brunswick, NJ, USA). Four weeks later, the diabetic, Lvil and Hvil groups were intraperitoneally injected with a low dosage of streptozotocin (STZ, 30 mg/kg of body weight). Rats with a fasting blood glucose > 11.1 mmol/l were considered diabetic. Then, the Lvil and Hvil groups were orally given 10 mg or 20 mg of vildagliptin/kg of body weight/day, respectively. The control and diabetic groups were administered normal saline. After 12 weeks of treatment, rats had food withdrawn overnight, and then they were anesthetized (ketamine 100 mg/kg i.p., Pharmacia and Upjohn Ltd., Crawley, UK). Blood samples were collected from the intraorbital retrobulbar plexus. Then, the rats were sacrificed by decapitation. The thoracic aortas were immediately collected. Parts of the aortas were placed in cold Krebs solution (120 mmol/l of NaCl, 4.7 mmol/l of KCl, 1.18 mmol/l of KH2PO4, 2.25 mmol/l of CaCl2, 24.5 mmol/l of NaHCO3, 1.2 mmol/l of MgSO4·7 H2O, 11.1 mmol/l of glucose, and 0.03 mmol/l of EDTA) aerated with 95% O2 and 5% CO2 and then were cut into 3 mm long rings for the vascular reactivity assay. The other aortas were frozen in liquid nitrogen and stored at –80°C for microarray and real-time PCR assays.
Body weight and fasting blood glucose measurements
The rats were weighed every 4 weeks. Fasting blood glucose (FBG) levels were measured using a Bayer Contour TS glucometer (Hamburg, Germany).
Oral glucose tolerance test
Glucose tolerance was determined using an oral glucose tolerance test (OGTT) at the end of 12 weeks of treatment. After 10 h of deprivation of food, rats were orally given 2 g glucose/kg of body weight. Blood glucose levels were measured before and 30, 60, and 120 min after glucose administration. The area under the curve (AUC) was obtained using the linear trapezoid method [28].
Serum insulin and lipid panel measurements
Fasting insulin levels were measured with an enzyme-linked immunosorbent assay kit (Millipore, Billerica, MA, USA). The homeostasis model assessment of insulin resistance (HOMA-IR) was calculated by the following formula: FBG (mmol/l) x fasting insulin (μIU/ml)/22.5. Serum total cholesterol (TC), triglyceride (TG), high-density lipoprotein-cholesterol (HDL-C) and low-density lipoprotein-cholesterol (LDL-C) were measured with the enzyme end-point method (Roche Diagnostics, GmbH, Mannheim, Germany).
Vascular reactivity measurement
The measurement of vascular reactivity was performed as described previously [29]. The aortic rings were placed in a tissue chamber filled with Krebs solution bubbled with 95% O2 and 5% CO2. The isometric contractile force of the rings was continuously measured by the BL-410 biological function system (Chengdu Tai Meng Science and Technology Co., Ltd., Chengdu, China). The basal passive tension was kept at 1.0 g. The relaxant responses of the endothelium-intact aortic rings precontracted with phenylephrine (Phe, 10–7 mmol/l) to acetylcholine (Ach, 10–10–10–4 mmol/l) were measured.
RNA extraction and miRNA expression analysis
Total RNA from the aorta was obtained using the mirVana RNA Isolation Kit (Ambion, San Paulo, SP, Brazil) and was quantified using the NanoDrop ND-2000 (Thermo Scientific). cDNA was synthesized using a TaqMan microRNA Reverse Transcription kit (Life Technologies, Rockville, MA, USA). miRNA profiles were obtained using an Affymetrix Multispecies miRNA 4.0 Array (Affymetrix Technologies, Santa Clara, CA, USA) in the Hvil group and DM group. Briefly, double-stranded cDNAs were synthesized from cRNAs. The second-cycle cDNAs were then biotin-labeled and hybridized onto a microarray. After washing and staining, the microarrays were scanned by an Affymetrix Scanner 3000 7G (Santa Clara, CA, USA). Raw data were obtained from array images by using Command Console Software (version 4.0, Affymetrix Technologies, Santa Clara, CA, USA). Raw data were normalized using an RMA algorithm in Expression Console software (version 1.4.1, Affymetrix Technologies, Santa Clara, CA, USA). After the significance (one-way ANOVA) analysis, differentially expressed miRNA were selected according to certain criteria (p < 0.05 and fold change > 1.5). A heat map was generated using TIGR MeV (MultiExperiment Viewer) software (http://www.tm4.org/mev.html) [30]. The microarray raw data have been submitted to the Gene Expression Omnibus (GEO) repository (GSE102195, http://www.ncbi.nlm.nih.gov/geo/query/acc.cgi?token=qhijqekubnupdmv&acc=GSE102195 for reviewers only). The validated gene targets for differentially expressed miRNAs were searched in MiRTarVase Database version 6.0 (http:// http://mirtarbase.mbc.nctu.edu.tw/, released Sep 2015) [31].
miRNA quantitative PCR analysis
Three differentially expressed miRNAs were validated by qPCR analysis using the TaqMan PCR kit (Applied Biosystems, Foster City, CA, USA) and ABI 7700 (Applied Biosystems, Foster City, CA, USA). The reactions were incubated in a 96-well plate at 95°C for 10 min, followed by 45 cycles of 95°C for 15 s and 60°C for 1 min. A comparative Ct method [32] was used to compare each group and the normal group. The relative levels of miRNAs were normalized to U6.
Target gene, inflammation gene, and apoptosis gene quantitative PCR analysis
Quantitative PCR analysis was performed using the SYBR Green method in ABI 7700 (Applied Biosystems, Foster City, CA, USA). The primers are listed in Table I. The reaction conditions were as follows: 48°C for 30 min, followed by 95°C for 15 min, and then 40 cycles of 95°C for 15 s and 55°C for 1 min. All signals were normalized to CypA (cytochrome P450 A). The comparative Ct method was used to assess the difference between treatment groups and the control group.
Table I
Oligonucleotide sequences for qPCR analysis
Target gene function and pathway analysis
To understand the biological function and pathways, target genes of miRNAs underwent gene ontology (GO) and Kyoto Encyclopedia of Genes and Genomes (KEGG) pathway enrichment analyses using DAVID (Data-base for annotation, visualization and integrated discovery) software (http://david.abcc.ncifcrf.gov/) [33]. The interaction of miRNA and genes was analyzed by Cytoscape software (http://www.cytoscape.org) [34].
Results
Effect of vildagliptin treatment on metabolic parameters in diabetic rats
Compared with the vehicle group, vildagliptin treatment reduced fasting blood glucose and AUC in OGTT (p < 0.01; Table II). Vildagliptin also reduced serum fasting insulin levels and the HOMA-IR index (p < 0.01; Table II). In blood lipids, vildagliptin suppressed TC and LDL-C levels (p < 0.01; Table II).
Table II
The effects of vildagliptin on metabolic parameters in DM rats after treatment for 12 weeks
| Parameter | Groups | |||
|---|---|---|---|---|
| CON | DM | Lvil | Hvil | |
| Body weight [g] | 554.96 ±20.36 | 479.04 ±10.24** | 508.97 ±14.61**## | 496.26 ±21.49** |
| Fasting blood glucose [mmol/l] | 5.14 ±0.36 | 21.04 ±2.15** | 14.27 ±1.36**## | 16.88 ±1.78**## |
| AUCgluose [mmol/l/h] | 15.92 ±1.78 | 53.25 ±2.22** | 39.96 ±3.50**## | 42.03 ±5.59**## |
| Insulin [mIU/l] | 38.89 ±1.97 | 54.7384 ±6.39** | 37.15 ±6.09## | 36.98 ±7.06## |
| HOMA index | 8.87 ±0.62 | 50.95 ±5.61** | 23.37 ±3.35**## | 27.88 ±6.47**## |
| TC [mmol/l] | 1.39 ±0.05 | 2.40 ±0.36** | 1.66 ±0.27*## | 1.55 ±0.21## |
| TG [mmol/l] | 0.60 ±0.14 | 1.44 ±0.30** | 1.48 ±0.32** | 1.31 ±0.28** |
| HDL-C [mmol/l] | 0.59 ±0.08 | 0.42 ±0.08** | 0.59 ±0.10## | 0.50 ±0.08 |
| LDL-C [mmol/l] | 0.2 ±0.07 | 0.53 ±0.10** | 0.25 ±0.05## | 0.22 ±0.05## |
Effect of vildagliptin treatment on vascular dysfunction in diabetic rats
Vascular function was impaired by HF/STZ treatment (p < 0.01; Table III) and normalized by vildagliptin therapy (p < 0.01; Table III).
Table III
Vasorelaxation responses (%) to Ach of thoracic aortic rings after treatment
| Group | Ach [mol/l] | ||||||
|---|---|---|---|---|---|---|---|
| 1 × 10⁻¹⁰ | 1 × 10⁻⁹ | 1 × 10⁻⁸ | 1 × 10⁻⁷ | 1 × 10⁻⁶ | 1 × 10⁻⁵ | 1 × 10⁻⁴ | |
| CON | 94.3 ±5.1 | 90.7 ±5.7 | 70.4 ±6.8 | 46.3 ±5.1 | 30.2 ±3.1 | 21.4 ±1.9 | 9.3 ±1.0 |
| DM | 97.4 ±2.1 | 95.7 ±4.9 | 80.4 ±5.3 | 56.4 ±5.7 | 41.7 ±4.3** | 35.3 ±3.2** | 25.4 ±2.7** |
| Lvil | 95.8 ±4.3 | 91.8 ±4.9 | 72.1 ±5.3 | 48.3 ±5.1 | 32.4 ±3.7 | 24.5 ±2.8 | 11.3 ±1.0## |
| Hvil | 95.8 ±4.1 | 92.3 ±5.3 | 78.4 ±4.3 | 51.3 ±4.9 | 37.4 ±4.1 | 31.3 ±3.1 | 15.3 ±1.6## |
miRNA array result
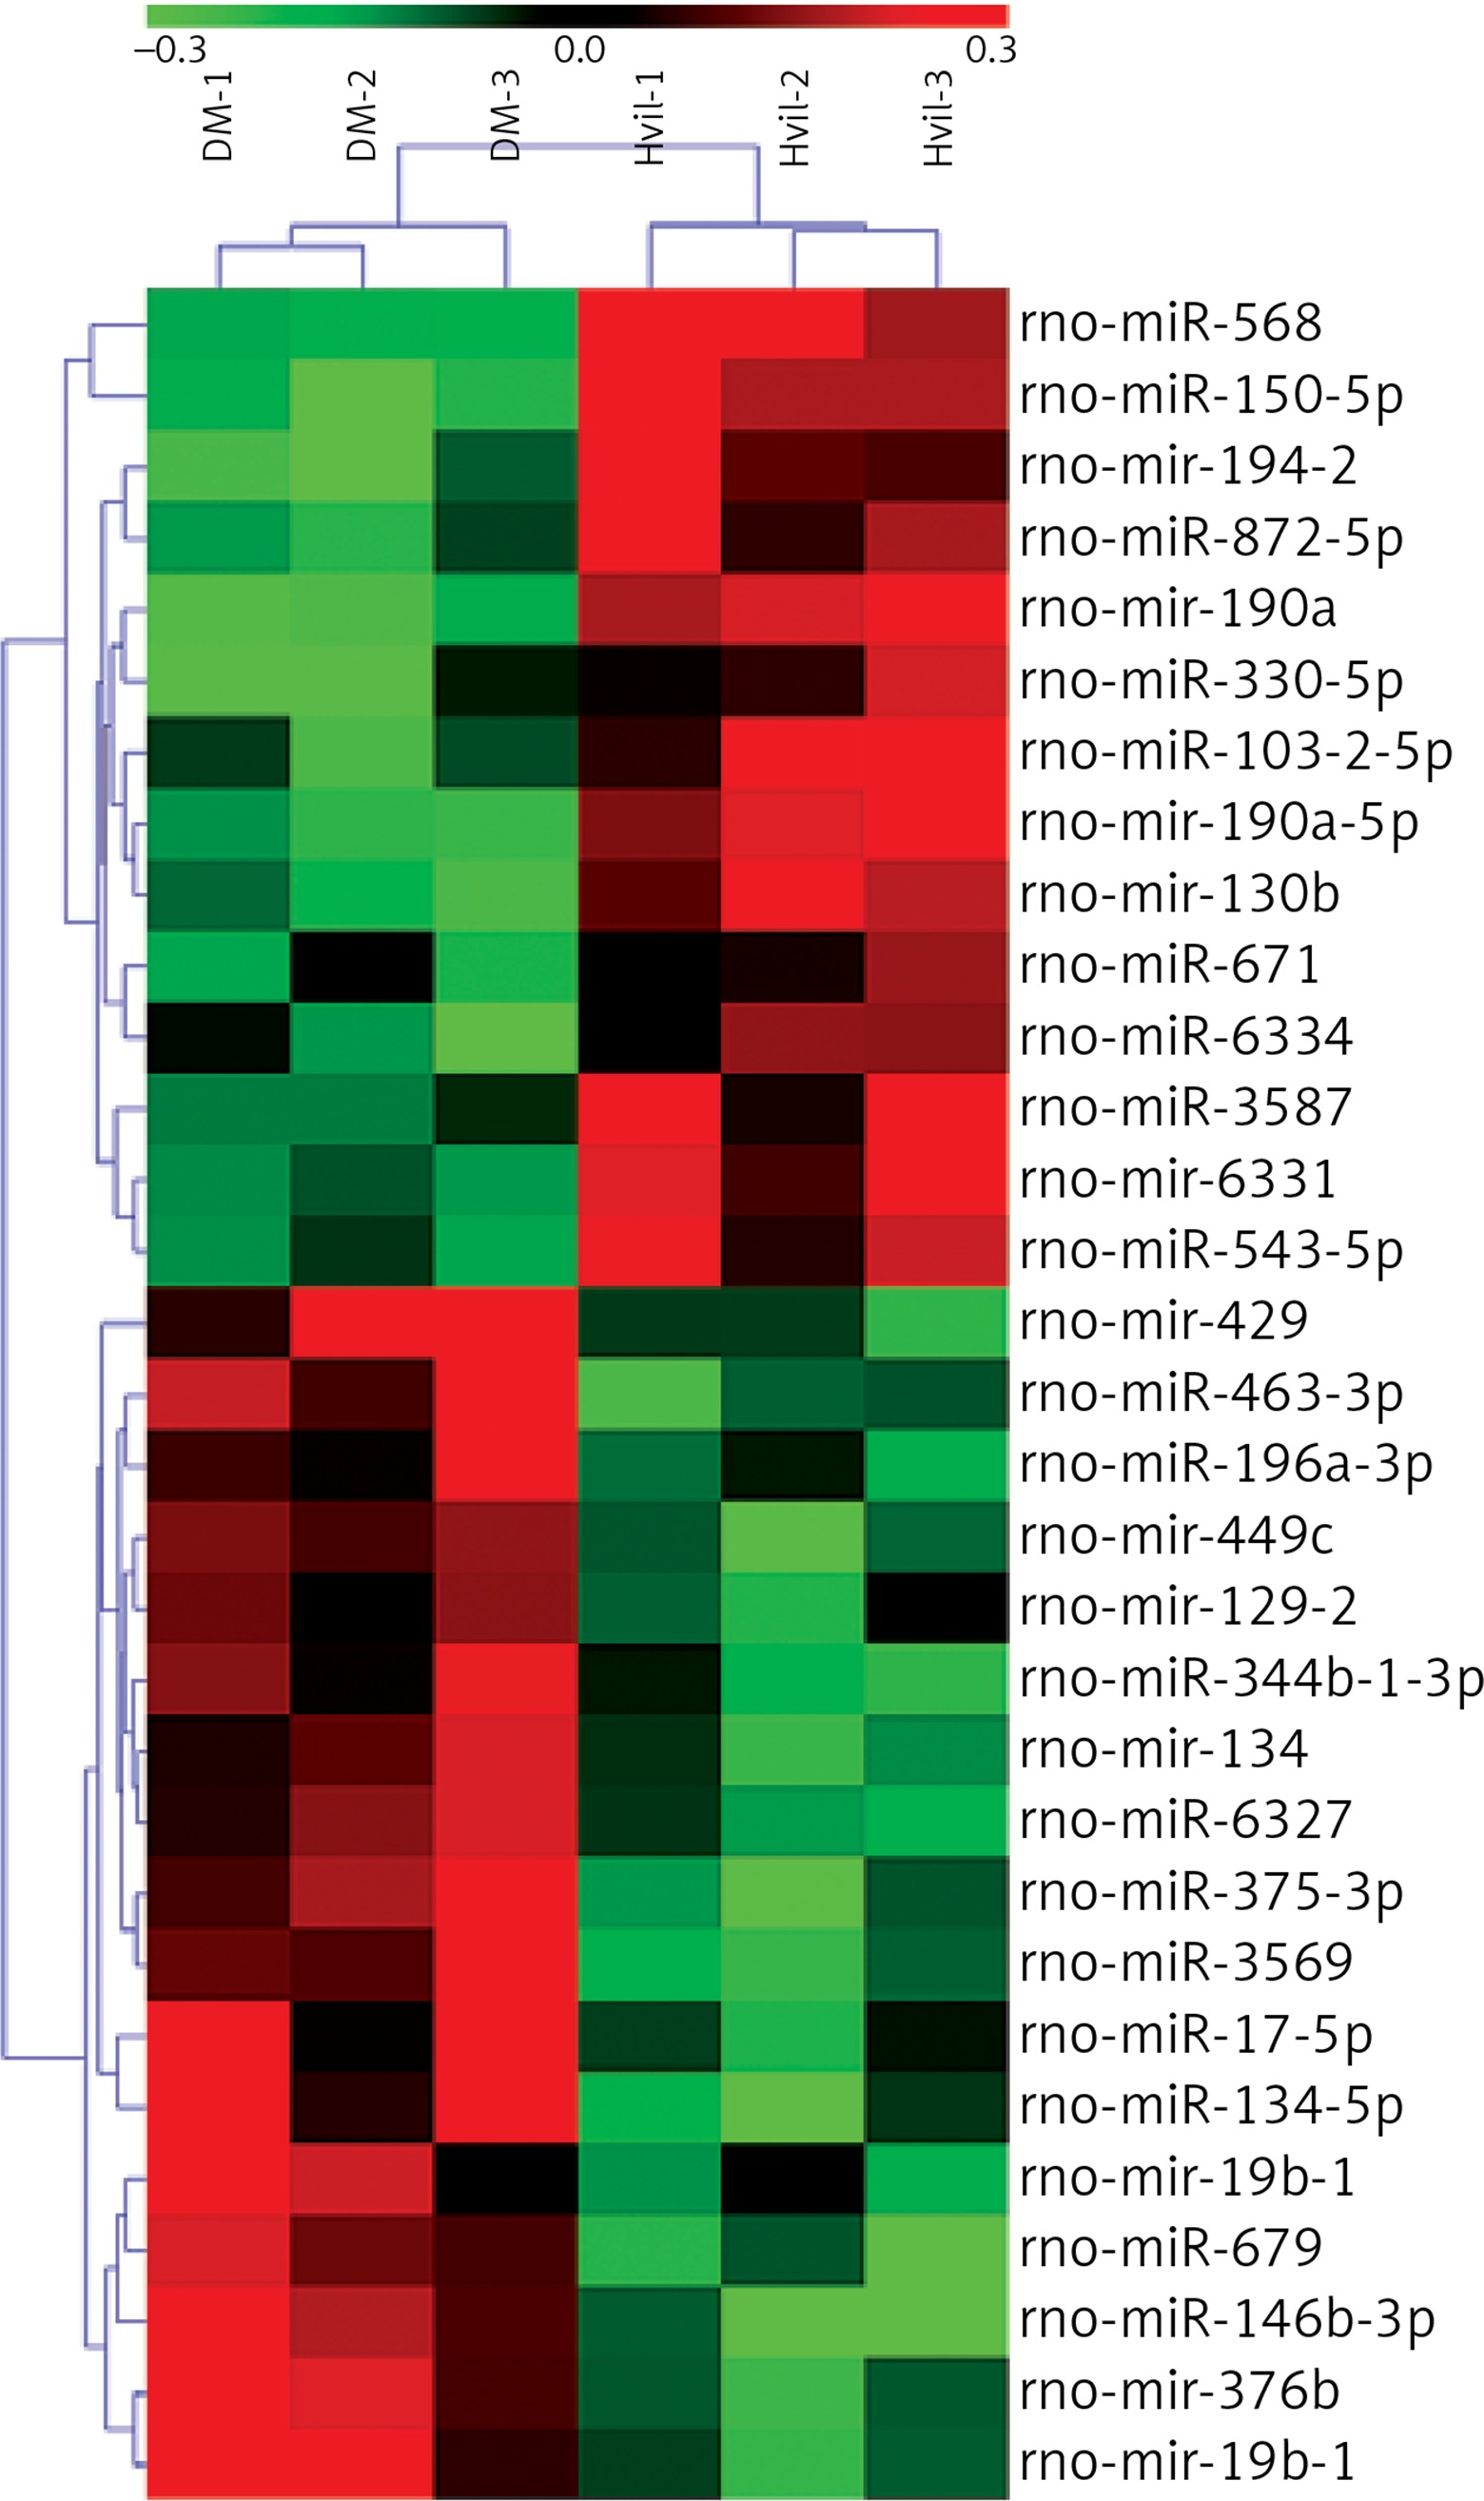
We identified 31 miRNAs that were differentially expressed in the Hvil group compared with the diabetic group (fold change > 1.5, p < 0.05; Table IV). In these 31 differentially expressed miRNAs, miR-568, miR-190a-5p, mir-190a, mir-194-2, miR-330-5p, miR-3587, miR-671, miR-103-2-5p, mir-130b, miR-872-5p, miR-6334, mir-6331, miR-150-5p and miR-543-5p were up-regulated; however, mir-449c, miR-463-3p, miR-344b-1-3p, miR-196a-3p, mir-129-2, mir-134, mir-376b, miR-375-3p, miR-17-5p, mir-19b-1, miR-6327, miR-679, mir-429, miR-3569, miR-134-5p, miR-146b-3p, and mir-19b-1 were down-regulated in the Hvil group compared with the diabetic group. The hierarchical clustering of these differentially expressed miRNAs showed that miRNA expression between the Hvil group and diabetic group was distinct (Figure 1).
Table IV
Differential expression miRNAs identified in Hvil group (fold change < 1.5, p < 0.05)
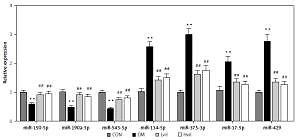
Validation of miRNAs by qPCR
For the validation of the miRNA array results, we chose 7 miRNAs to perform miRNA qPCR. These 7 miRNAs have experimental validated target genes in the miRTarBase Database. The results showed that seven differentially expressed miRNAs tested by miRNA array were changed significantly in the Hvil group compared with the diabetic group (Figure 2). The results of the qPCR assay agreed with the miRNA array.
miRNA target biological function and pathway analysis
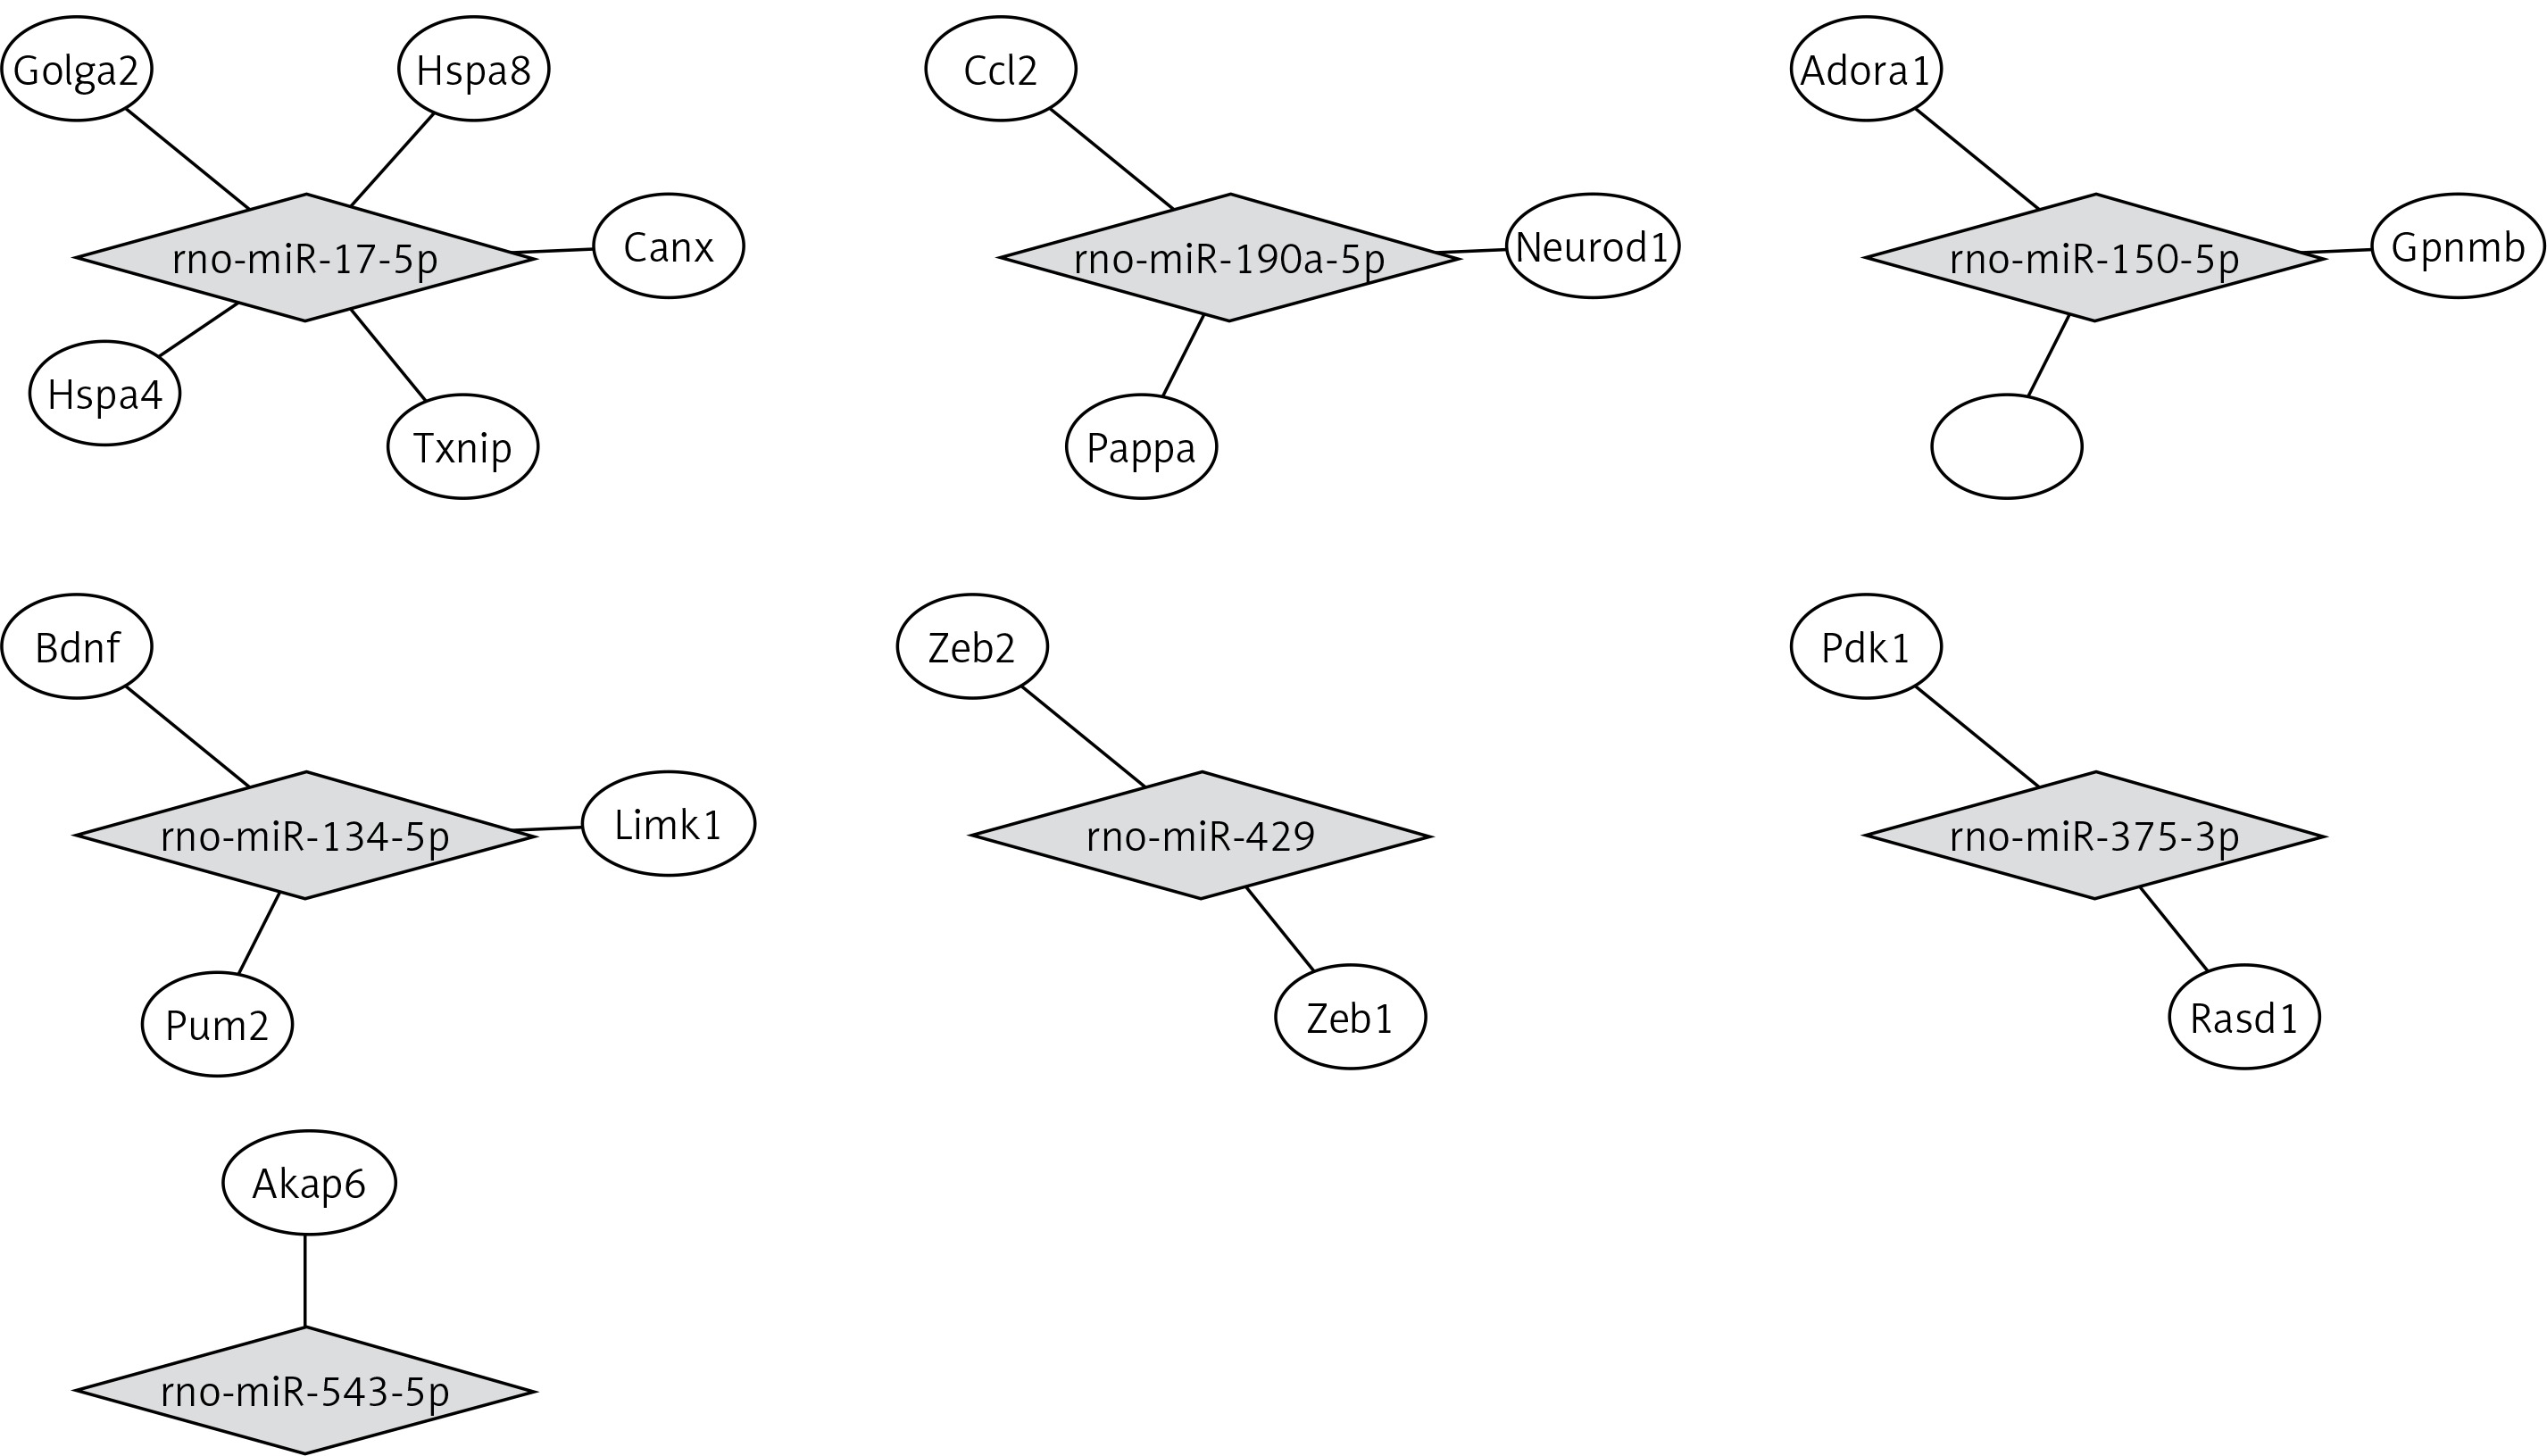
By using the miRTarBase Database, we found 19 validated target genes from 7 miRNAs (Table V). Figure 3 shows a miRNA-mRNA interaction network using Cytoscape. To understand the function of the target genes of differentially expressed miRNAs, we performed biological function and pathway analysis using DAVID software. We found that the sarcoplasmic reticulum, focal adhesion in the cellular component category and the antigen processing and presentation pathway were involved in the target gene function (Table VI).
Table V
Validated miRNA target for differentially expressed miRNAs
Table VI
The miRNA target gene-associated biological function category and pathway (p < 0.05)
Target gene qPCR
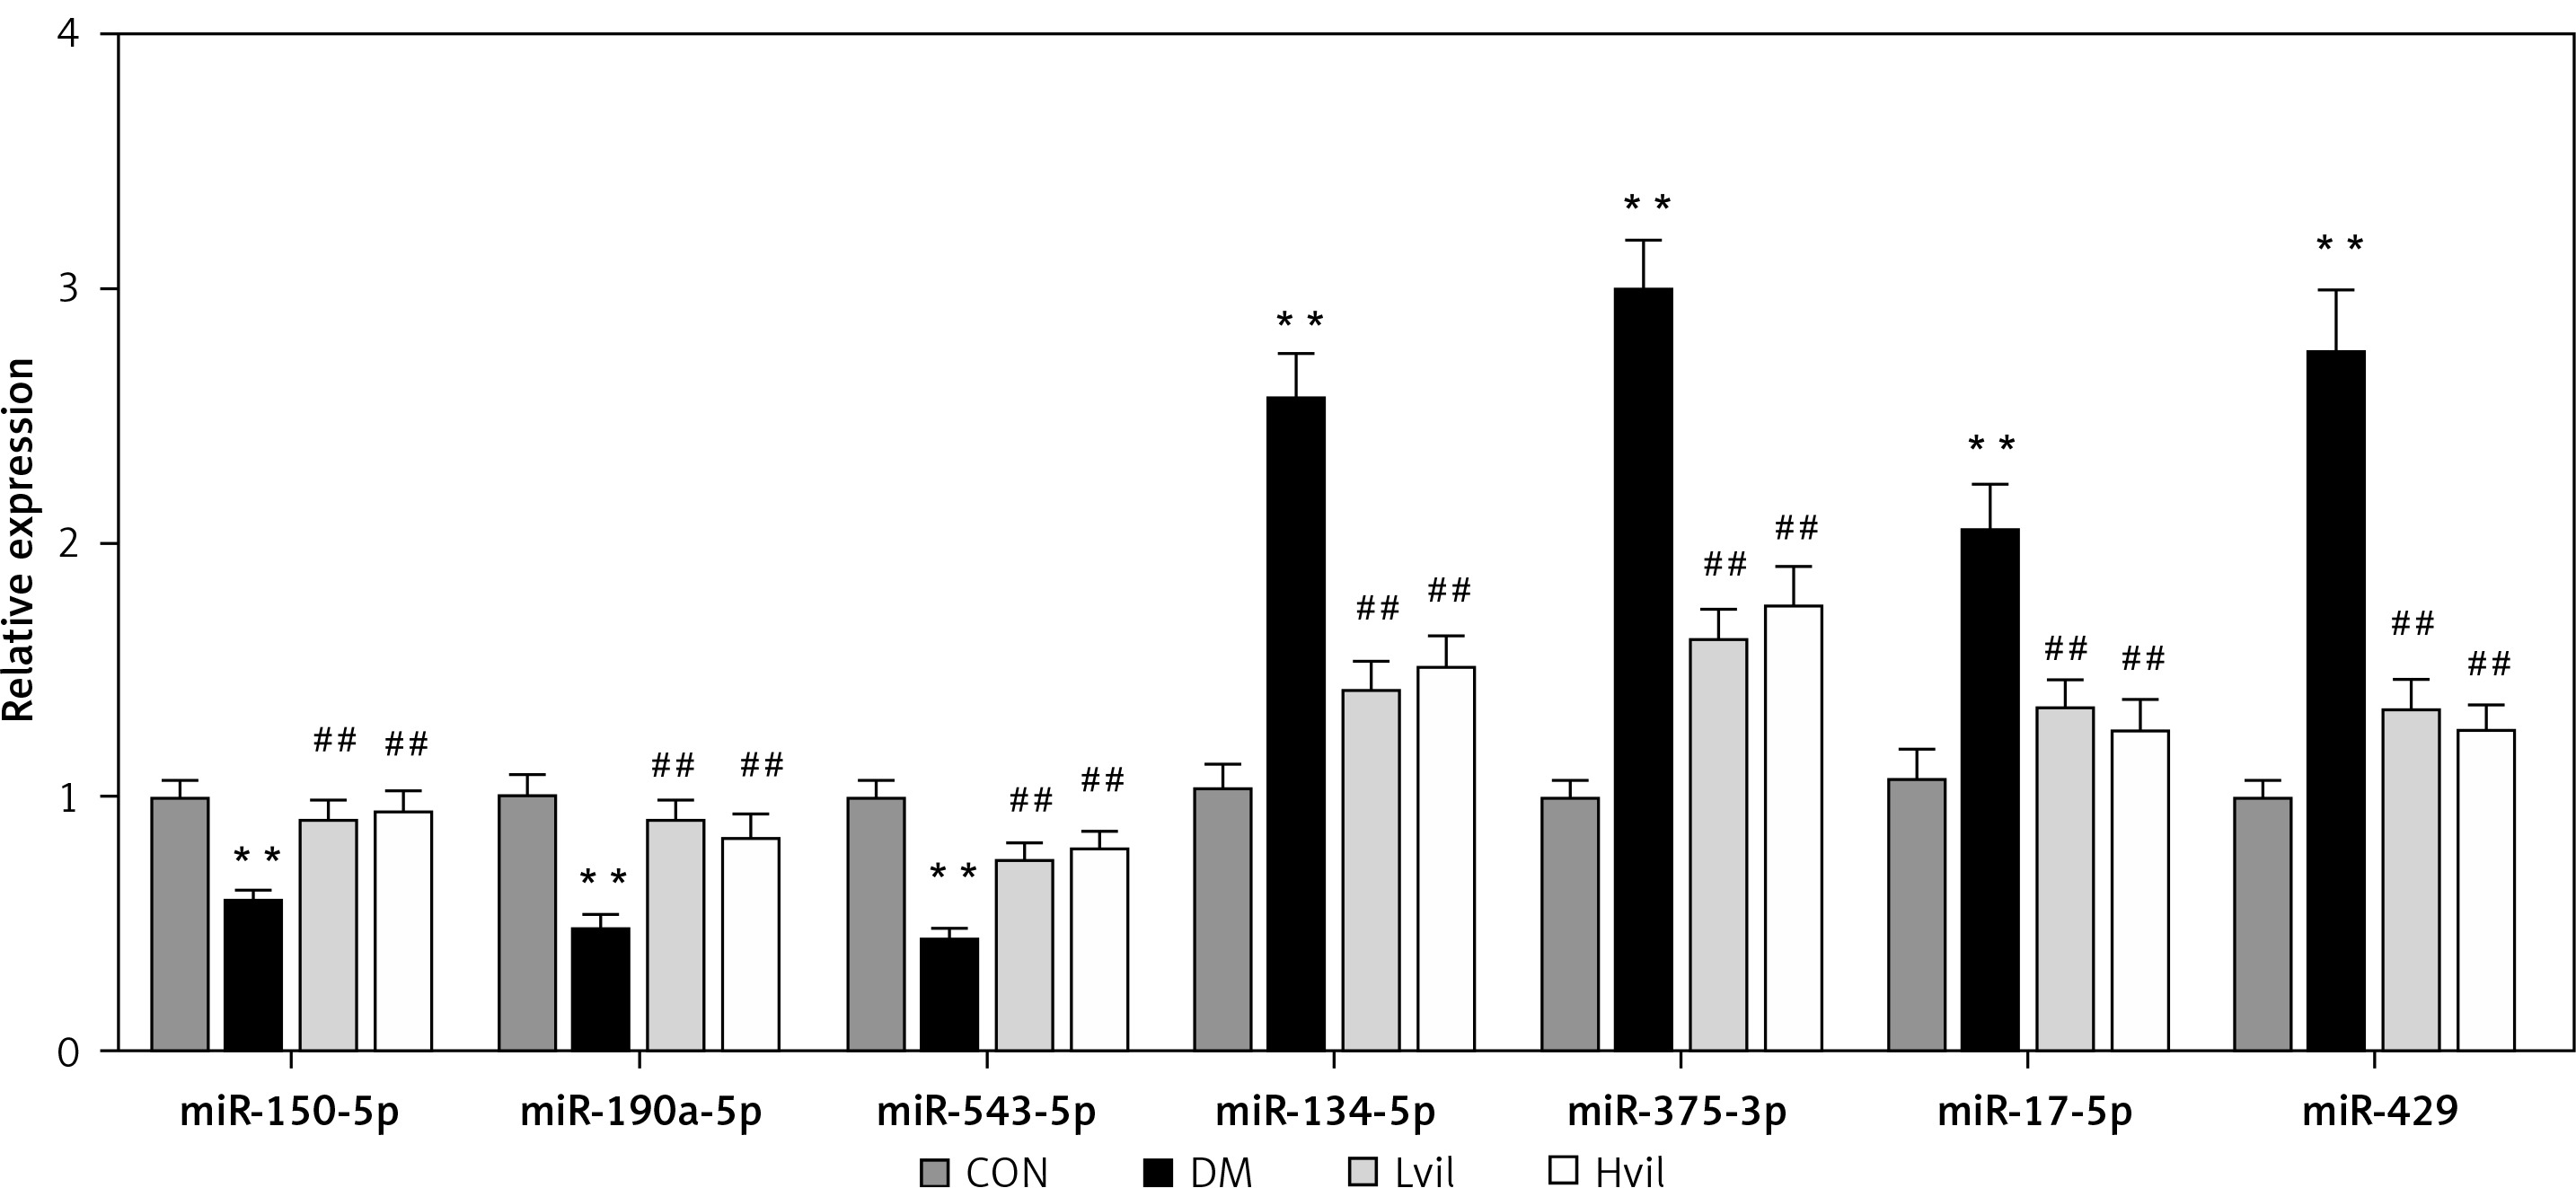
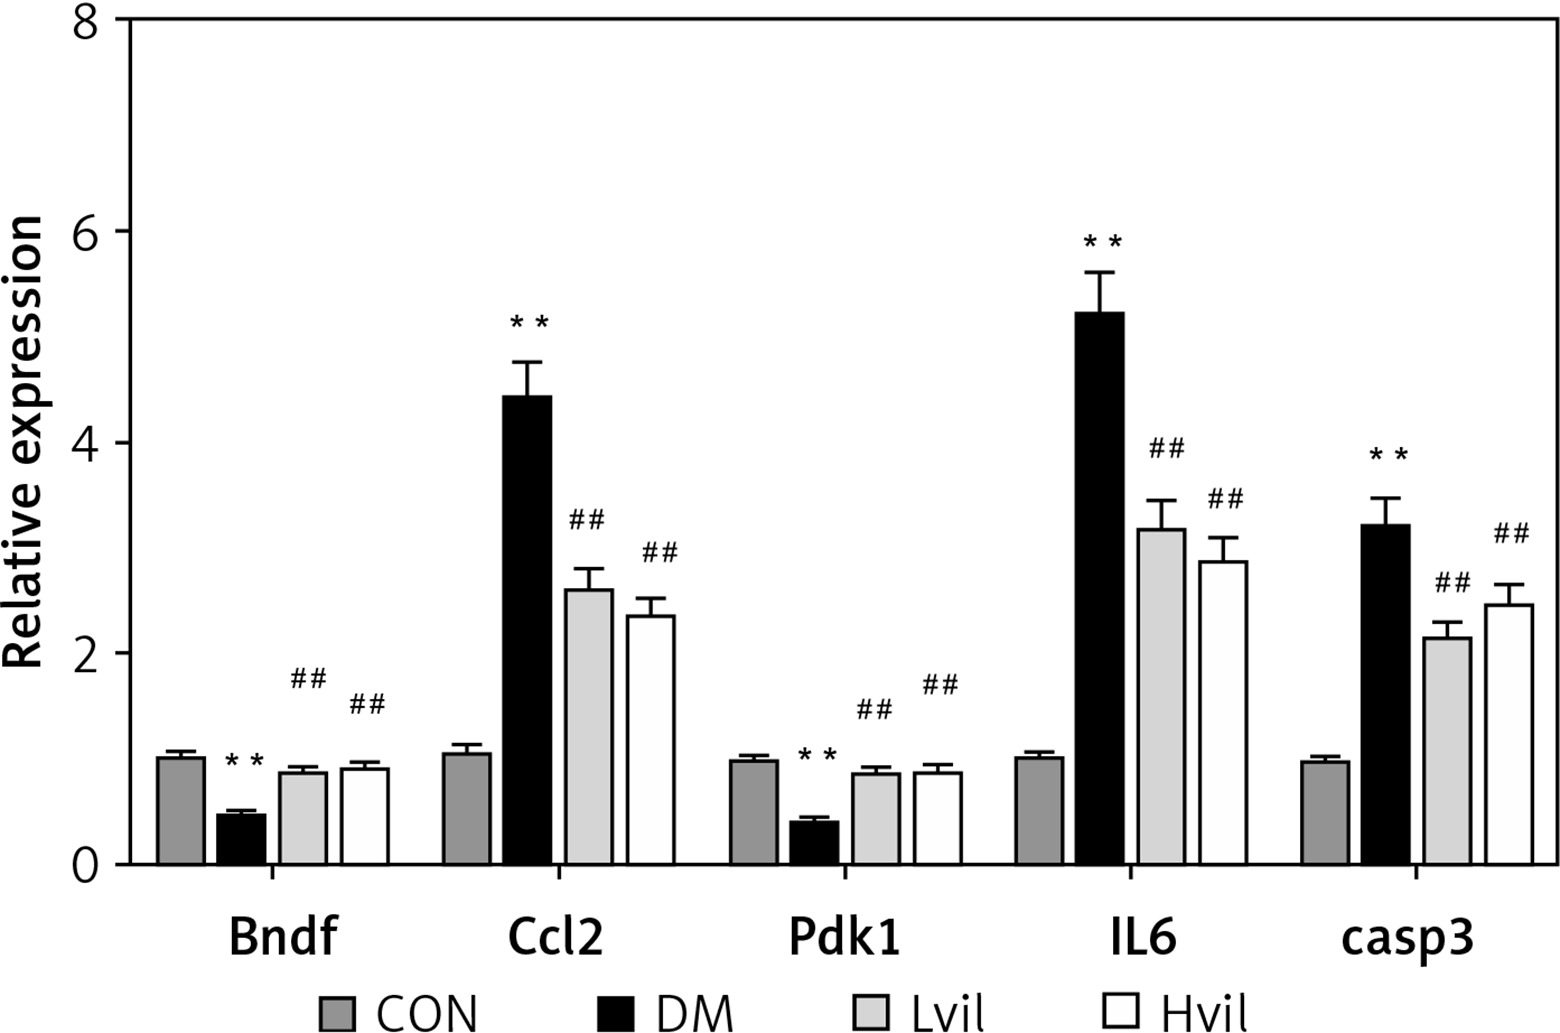
Real-time PCR results showed that the expression of brain-derived neurotrophic factor (Bdnf) and 3-phosphoinositide-dependent protein kinase-1 (Pdk1) in the Hvil group was significantly higher than in the diabetic group; however, the expression of chemokine (C-C) motif ligand 2 (Ccl2) in the Hvil group was significantly lower than in the diabetic group (Figure 4).
Figure 4
Target genes, inflammation gene, and apoptosis gene expression by using qPCR. Data are presented as mean ± SD (n = 6)
**P < 0.01 vs. control group, ##p < 0.01 vs. diabetic group. CON – control, DM – diabetes mellitus, Lvil – low dose of vildagliptin, Hvil – high dose of vildagliptin, Bdnf – brain-derived neurotrophic factor, Ccl2 – C-C motif chemokine ligand 2, Pdk1 – 3-phosphoinositide dependent protein kinase-1, IL6 – interleukin 6, Casp3 – caspase 3.
Discussion
In our study, we found that vildagliptin reduced blood glucose, TC and LDL-C, and moderated insulin sensitivity. Similar results were obtained for the effect of DPP-4 inhibitors on glucose and lipid metabolism. Saxagliptin treatment for 24 weeks improved total cholesterol in type-2 diabetic patients [35].
We also found that vildagliptin moderated endothelial function in diabetic rats. Increasing evidence has shown that DPP-4 inhibitors improve vascular function. Alogliptin leads to dose-dependent relaxation of aortic rings, even under GLP-1 receptor antagonist pretreatment [14]. In HUVECs, alogliptin induces phosphorylation of the Akt-eNOS pathway and nitric oxide (NO) release [14]. DPP-4 inhibitors improved NO release and reduced inflammation in endothelial cells [36].
We found that miR-134-5p was down-regulated in the vildagliptin-treated group. Bdnf is a target of miR-134-5p [37]. We also found that the expression of Bdnf was up-regulated in the vildagliptin-treated group. BDNF is a major member of the neurotrophin (NT) family. Patients suffering acute coronary syndrome (ACS) [38], acute myocardial infarction (MI) [39], metabolic syndrome [40] and type-2 diabetes [41, 42] have decreased circulating BDNF levels. Decreased circulating BDNF levels have been associated with endothelial dysfunction [43]. Endothelial dysfunction is associated with cardiovascular diseases and risk factors such as hypertension [44]. BDNF is considered a link between endothelial dysfunction and cardiovascular diseases. Recently, evidence has shown that BDNF expression is high in the rat heart and aorta. Cardiovascular BDNF is prominent in ECs [45]. Spontaneously hypertensive rats have reduced expression of BDNF in ECs. Physical training normalizes the endothelial BDNF levels in both normal rats and spontaneously hypertensive rats [45]. Thus, vildagliptin may inhibit the expression of miR-134-5p to stimulate the expression of Bdnf and moderate endothelial function.
Moreover, we found that miR-190a-5p expression was up-regulated in the vildagliptin group. Ccl2 is one of the target genes of miR-190a-5p [46]. CCL2, also known as MCP-1, was the first human chemokine to be described [47, 48]. CCL2 can attract monocytes, such as macrophages, and microglia, in vitro and in vivo [49, 50]. CCL2 is an important chemokine for atherogenesis. Pro-inflammatory mediators induce atherosclerotic inflammation in the aorta [51, 52]. We also found that vildagliptin reduced Il6 expression in diabetic aorta. Thus, vildagliptin could activate miR-190a-5p to inhibit CCL2 expression to inhibit inflammation in the aorta.
In our research, miR-375-3p was down-regulated in the vildagliptin-treated group. Pdk1 is one of the target genes of miR-375-3p [53]. PDK1 has an anti-apoptotic function in the development of atherosclerosis [54]. The activation of PDK1 could activate the PI3K/Akt pathway. The PI3K/Akt pathway plays a prominent role in cell survival, metabolism, growth and proliferation by directly regulating apoptotic proteins such as Bcl-2, caspase-3, caspase-9 and Bax [55, 56]. In our study, vildagliptin inhibited the expression of Casp3 in diabetic aorta. Thus, vildagliptin may inhibit Casp3 through reducing miR-375-3p in diabetic aorta.
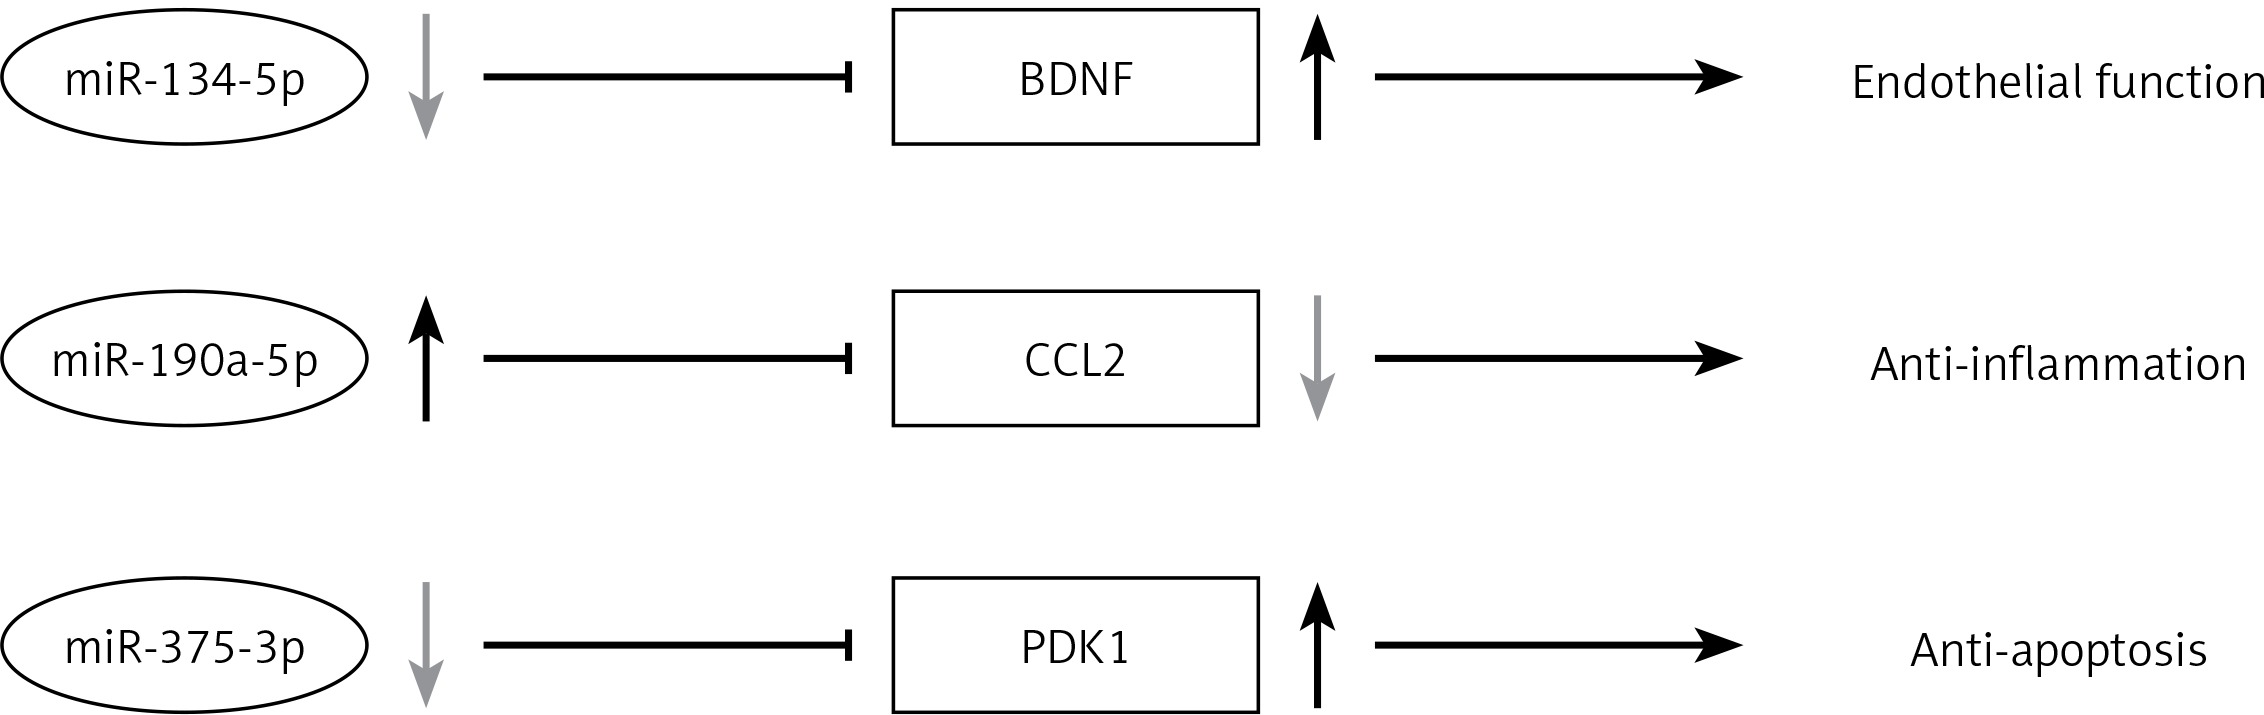
Our present study shows that vildagliptin elicits vascular protection in diabetic rats. This study provides promising evidence of DPP-4 inhibitors’ application in diabetic patients with cardiovascular disorders. Vildagliptin activates miR-190a-5p and inhibits miR-134-5p and miR-375-3p expression in the aorta to activate Bdnf and Pdk1. Vildagliptin inhibits Ccl2 to moderate endothelial function and inhibits inflammation and apoptosis (Figure 5). Involved miRNAs function still needs to be verified in vivo and in intro. Further study of the key miRNAs in the pathogenesis of the cardiovascular system will help us find the potential therapeutic targets.
Figure 5
Vildagliptin inhibit miR-134-5p in aorta to activate Bdnf to moderate endothelial function; activate miR-190a-5p to inhibit Ccl2; and inhibit miR-375-3p to activate Pdk1 to inhibit apoptosis.
Bdnf – brain-derived neurotrophic factor, Ccl2 – C-C motif chemokine ligand 2, Pdk1 – 3-phosphoinositide dependent protein kinase-1.