

Introduction
As one of the clinically most common gastrointestinal tumours, colon cancer is now becoming one of the tumours with the highest incidence [1]. The 5-year survival rate of early-stage colon cancer patients is about 70%. However, this rate can decline to no more than 50% once local or distant metastasis has occurred [2]. Distant metastasis is also the reason for the vast majority of deaths of patients with colon cancer. Against this background, the existing detection approaches such as the use of tumour markers are insufficient to detect metastatic early-stage colorectal cancers. The search for an early diagnostic marker for colon cancer has thus become a particular focus of research [3].
Long-chain non-coding RNA (lncRNA) is a type of non-coding RNA with a length exceeding 200 nucleotides [4]. Research has shown that P14AS, POU6F2-AS2, and RPR1-AS1 are abnormally expressed in colon cancers [5–7]. Extensive investigations have shown that lncRNAs are a key factor in colon cancer. One lncRNA is PCA3, which is located on chromosome 9q21-22 in intron 6 of Prune homology 2 (i.e. PRUNE2 or BMCC1) in an antisense manner [8, 9]. PCA3 has been shown to be significantly overexpressed in multiple tumours [10, 11]. Studies have also indicated that PCA3 has the potential to effectively enhance the proliferation, invasion, and metastasis of prostate cancer (PCa). In addition, PCA3 has been used as a diagnostic and therapeutic tool for PCa [12, 13]. Moreover, it has been found that PCA3 tends to be overexpressed in ovarian cancers [14]. However, to date, the effects of PCA3 on colon cancers have not been reported. This study was thus implemented to explore the significance of PCA3 in the clinical pathology of colon cancers. The specific mechanism by which this lncRNA is involved in the occurrence and development of colon cancers is also investigated from a cytological perspective.
Material and methods
Clinical data
Specimens of colon cancers that were radically removed from 2009 to 2014 from 62 patients at Lianshui People’s Hospital Affiliated to Kangda College of Nanjing Medical University were collected. Each specimen included tumour tissues and normal peritumoral colon tissues (at least 2 cm away from the edge of tumour tissues). No cases had been treated with radiotherapy or chemotherapy. Fresh tissue specimens were placed in liquid nitrogen for rapid freezing within 30 min of being separated; they were subsequently moved to a deep freezer (–80°C) for storage. For all colon cancer cases, pathological proof of the diagnosis had been obtained, with the patients including 42 male and 20 female patients aged 53.80 ±11.20 years. There was complete follow-up information of all involved patients. The longest follow-up was 60 months, while the shortest was 1 month. The median follow-up was 25 months. All patients provided written informed consent. The study was approved by the Ethics Committee of Lianshui People’s Hospital Affiliated to Kangda College of Nanjing Medical University and conformed to relevant medical ethics requirements.
In situ hybridisation (ISH)
After a probe had been prepared, paraffin embedding was conducted for tissue specimens. The embedded slices were incubated for 5 min in HCl at room temperature and washed with PBS three times for 5 min each. Subsequently, the slices were further incubated in Proteinase K for 20 min, followed by washing with PBS three times for 5 min each. After 10 min of incubation in paraformaldehyde, the slices were washed with PBS twice for 5 min each. Afterwards, they were incubated for 10 min in acetic anhydride and triethanolamine solution at room temperature, followed by washing with PBS twice for 5 min each. After 2 h of hybridisation in pre-hybridisation solution without probes, denaturation of the probes diluted with the hybridisation solution was performed for 5 min at 85°C. The probe sequence was made by Boster Company, Wuhan, China; the sequence was 5′-GCACAGAGATCCCTGGGAGAAATGCC-3′. This was followed by the addition of the tissues and sealing overnight at 37°C. The tissues were then immersed in SSC buffer solution and washed twice for 20 min each. Afterwards, they were rinsed with formamide/SSC buffer solution three times at 37°C for 20 min each. In addition, they were rinsed with TBST five times for 10 min each, sealed in 3% BSA for 1 h at room temperature, incubated overnight at 4°C after anti-digoxin primary antibody (1 : 1000) had been added, washed with TBST four times for 10 min each and with BCIP/NBT staining/buffer solution twice for 10 min each, stained with BCIP/NBT for 4–48 h in the dark, and eventually washed with TE buffer solution (pH8.0) twice. At this point, the reaction was ended, after which residual solutions were rinsed with water and dehydration and mounting were completed. The samples were then observed under an inverted microscope and photographed. The slices were analysed by the image analysis software Image J.
HE staining
Successively, paraffin sections were soaked in xylene for deparaffinisation, dehydrated by ethyl alcohol, stained with Harris haematoxylin, differentiated using 1% hydrochloric acid alcohol solution, made blue again with the help of 1% ammonium hydroxide (for 5 min), stained with eosin staining solution, dehydrated with ethyl alcohol, made transparent with xylene, and eventually sealed by neutral balsam. In this way, corresponding results could be observed under a microscope.
Real-time qPCR detection
TRIZOL was used to extract total RNA. The extracted total RNA underwent reverse transcription (RT) as follows: 15 min RT reaction at 37°C and 5 min enzyme inactivation at 98°C. Corresponding RT products were stored at –20°C. In terms of real-time PCR, a moderate amount of cDNA was selected as a template using 2×SYBR Green PCR MasterMix and was then used for amplification. Based on the target gene, upstream and downstream primers were designed and synthesised for the purpose of performing PCR amplification. The lncRNA PCA3 primer sequences were as follows: F: 5′-TGGCACTATGAGCTGCCAAT-3′, and R: 5′-CCCCAGCTGAGACCTAATGC-3′. In the case where GAPDH served as an internal reference, the GAPDH primer sequences were as follows: F: 5′-GGTGAAGGTCGGAGTCAACG-3′, and R: 5′-CCATGTAGTTGAGGTCAATGAAG-3′. By the 2–ΔΔCt method, the relative expression level of the lncRNA PCA3 was determined.
Follow-up
All patients agreed to being followed up by telephone and re-examined. Such follow-up focused on general condition, clinical symptoms, and imaging examinations. The initial follow-up period was set from the date of an operation or biopsy to the last follow-up time, which was set as October 9, 2019. At the end of the follow-up period, 31 patients survived and 31 had died; no cases were lost to follow-up.
Materials
HCoEpiC and human colon cancer cell lines (SW480, HT-29, SW620µ, and HCT116) were purchased from the Cell Bank of Chinese Academy of Sciences (CAS); Trizol and transfection reagents (i.e. pcDNA3.1 and Lipofectamine 2000 Reagent) were purchased from Invitrogen (USA); real-time PCR (RT-PCR) kit was provided by TaKaRa (Japan); methyl thiazolyl tetrazolium (MTY) was provided by Amersco (USA); and Fast SYBR Green Master Mix was purchased from ABI (USA).
Cell culture and transfection
In a CO2 incubator with a volume fraction of 5%, cells were cultured with RPMI 1640 medium containing 10% foetal bovine serum at 37°C. Cell transfection was completed based on the instructions of Lipofectamine 2000 Reagent. The cell experiment was divided into two parts. In the first part, cells were divided into groups of NC, pcDNA3.1, and PCA3; in the second part, they were classified into groups of NC, si-NC, and si-PCA3. Cells in the logarithmic phase were taken and incubated in a cell culture plate at 4 × 10⁵ per well. Once the fusion rate reached approximately 80%, the original culture medium was replaced by RPMI 1640 medium not containing foetal bovine serum. For transfection aided by Lipofectamine 2000 reagent, pcDNA3.1, pcDNA3.1-PCA3, si-NC, and si-PCA3 were added, as directed in the operating manual, into an RNase-free centrifugal tube that had been loaded with 100 µl of Opti-Medium in advance. Subsequently, 4 µl of Lipofectamine 2000 reagent was also added and plasmids were mixed with the corresponding lipidosome solution. The mixture was left to stand for 20 min and then added to the culture wells. Additionally, another RNase-free centrifuge tube with 100 µl of Opti-Medium was selected as the blank group. At 46 h after transfection, cells were collected to extract total RNA and total protein for subsequent use.
MTT assay
After cells in the different groups had been treated for 48 h, 20 µl of MTT (5 mg/ml) was added to each well. After 4 h, 100 µl of dimethyl sulphoxide (DMSO) was added and then shaken for 10 min at room temperature. Afterwards, an enzyme-linked immunometric meter was utilised to determine the absorbance (A) values of the respective wells at a wavelength of 490 nm. In addition, the corresponding cell proliferation rate was calculated.
Apoptosis assay
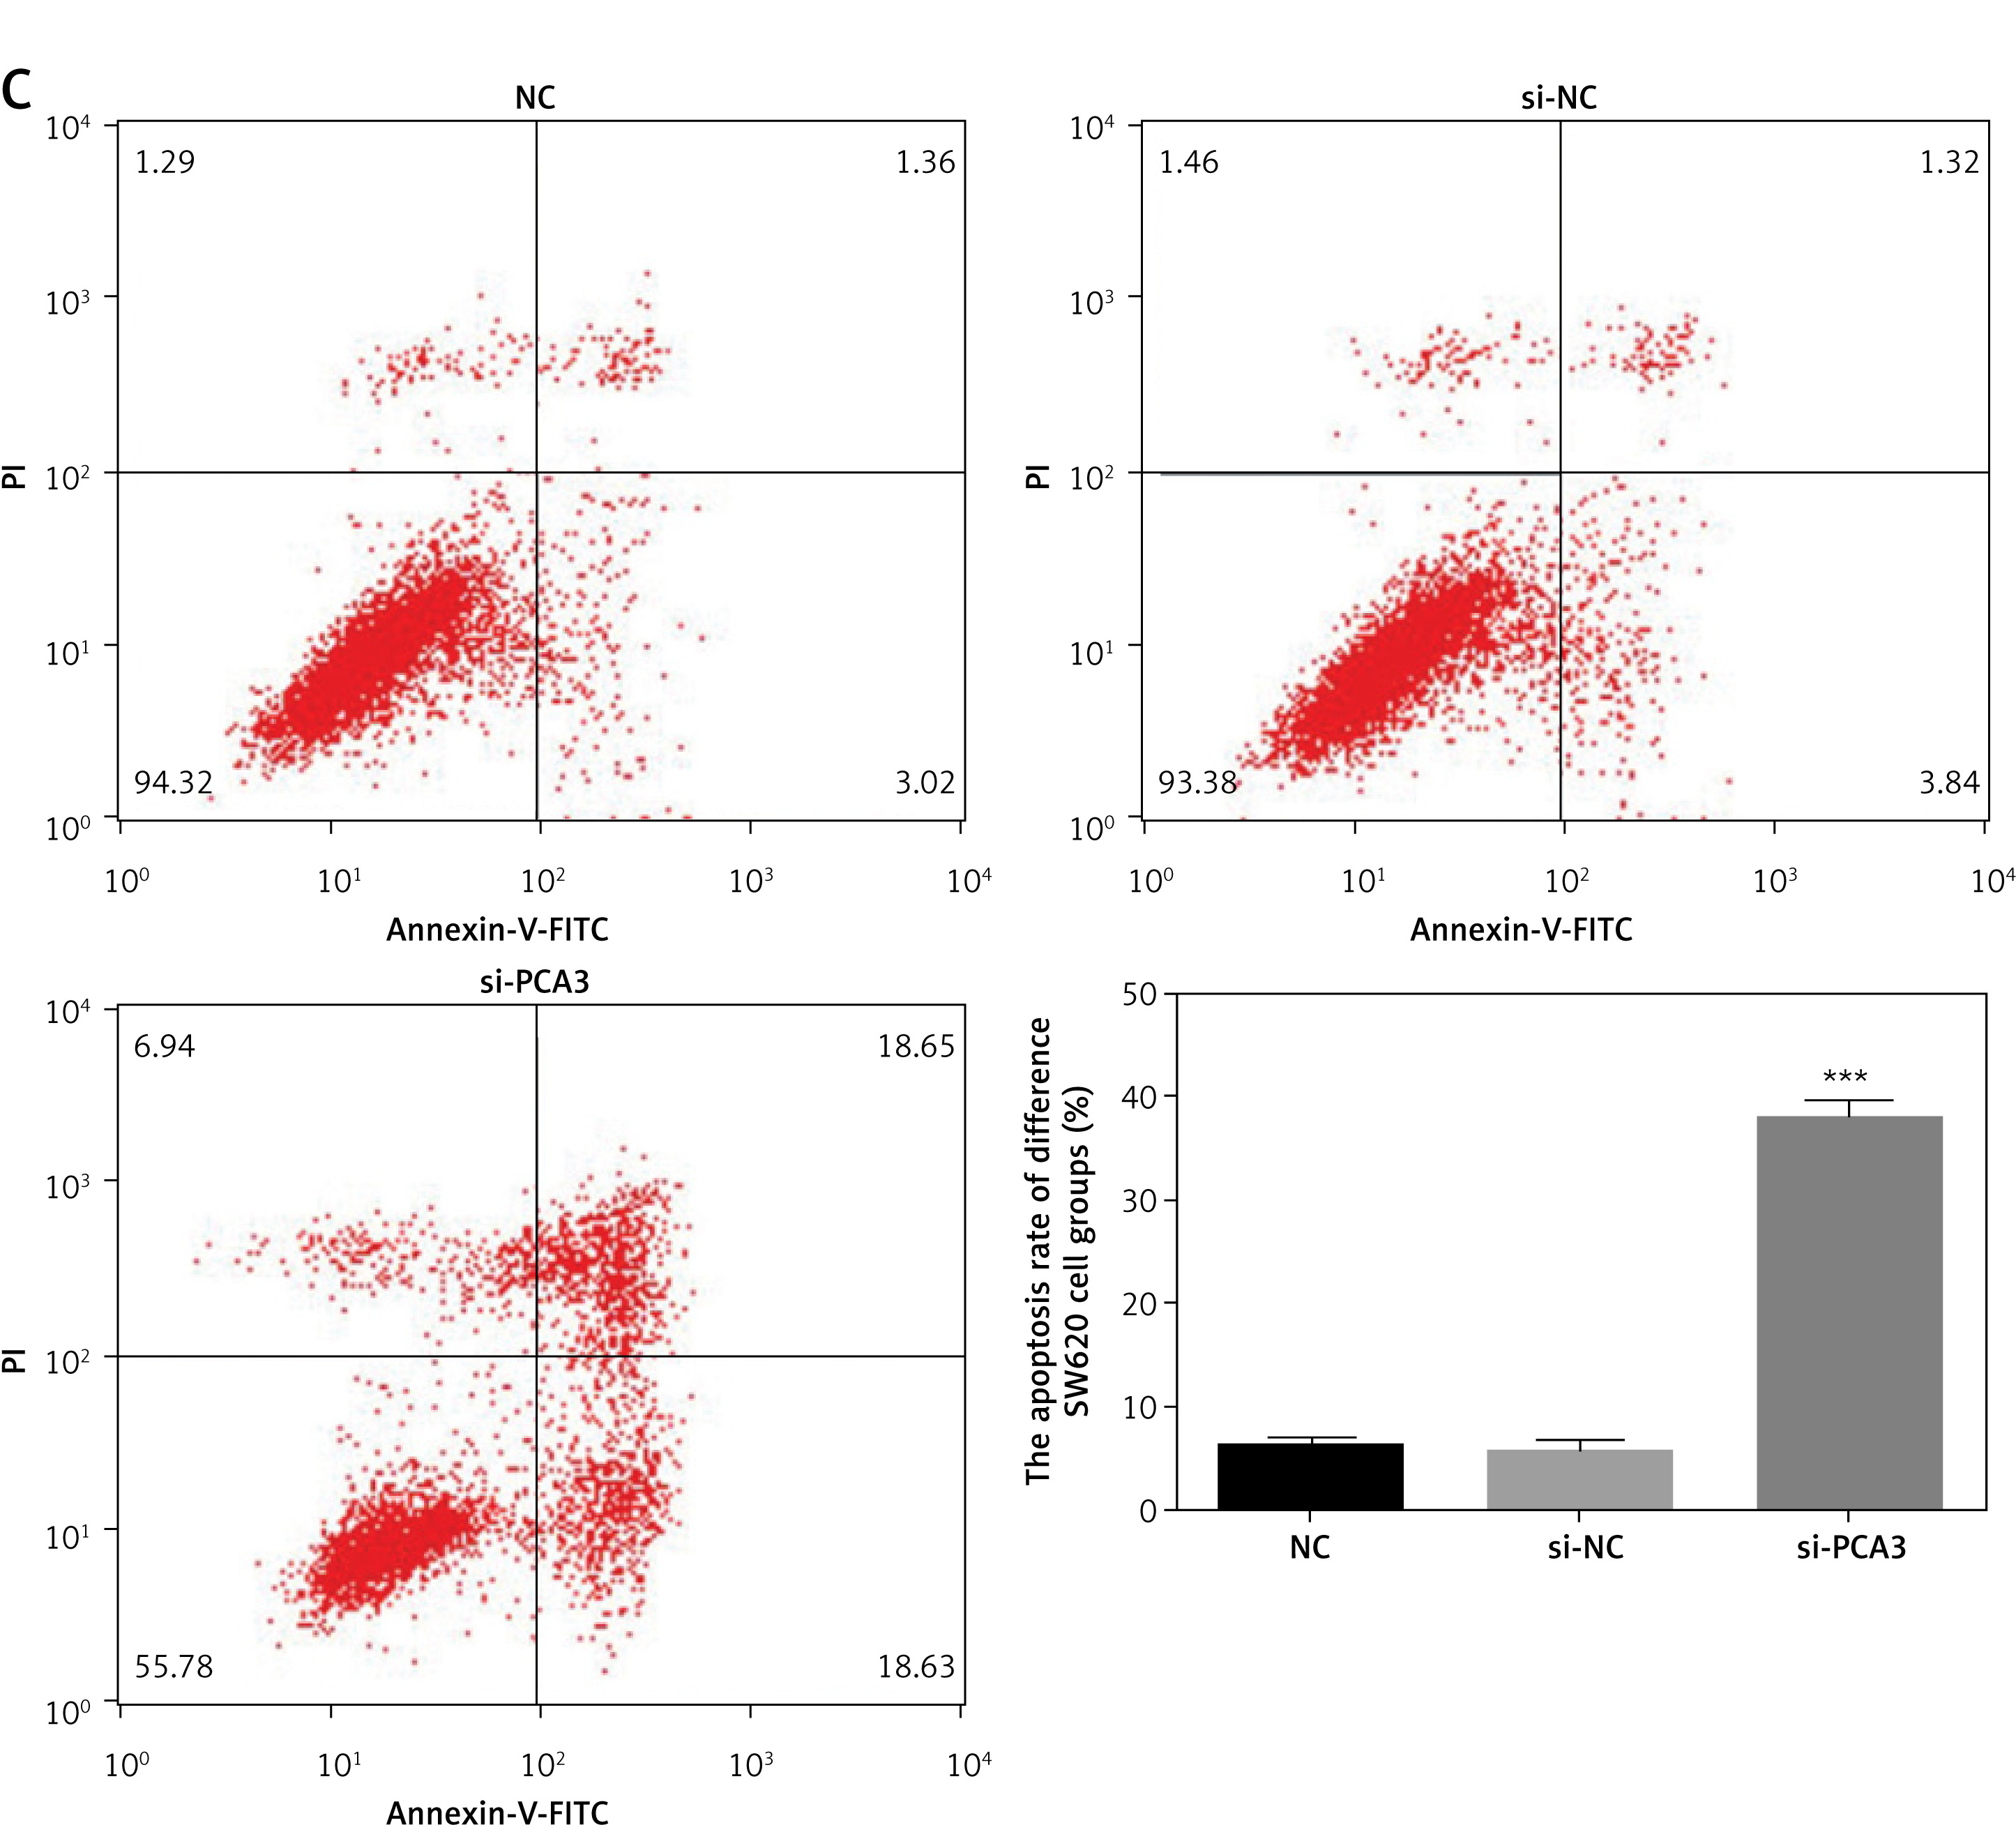
Annexin V/PI double staining was conducted to detect apoptosis. Cells were collected from each group and then digested and resuspended in PBS. In accordance with the scheme provided together with the kit, a flow cytometer was used for the apoptosis assay. In the flow cytometry diagram, the left lower quadrant stands for cell debris, while the right lower quadrant represents early and late apoptotic cells. In addition, the left upper quadrant refers to dead cells. The apoptosis rates of all groups were determined using the following equation: apoptosis rate (%) = (apoptotic cell population/total cell count) × 100%. After three measurements were performed independently, the mean value was obtained.
Transwell assay
Cells from each group were treated as required, suspended in serum-free culture medium, and then uniformly incubated in a 24-well plate at a cell concentration of 2 × 10⁵. An ordinary chamber was selected for the migration experiment, while for the invasion assay a tailored Matrigel Invasion Chamber was selected. Moreover, 800 µl of culture medium with 10% (volume fraction) foetal bovine serum was added to the lower chamber, and 150 µl of cell suspension without any serum was added to the upper chamber. After that, the cells were cultured for 24 h in an incubator. Then, the chamber was carefully removed using tweezers. Liquid on the upper chamber was removed and then the chamber was moved into a well that had been loaded with about 800 µl of methyl alcohol. After being kept at room temperature for 30 min, DAPI staining was performed, which was followed by observation and counting.
Wound healing assay
After cells from the different groups had been treated as required for 48 h, they were uniformly incubated in a 6 µl plate at a concentration of 5 × 10⁵. This culture did not stop until the cells reached confluence. Each well was scratched by the tip of a sterile transfer pipette, and then washed with sterile PBS to remove cell debris and cultured in a pure medium that did not contain PBS. At 0, 24, and 48 h the migration status at the same position in each well was photographed and recorded.
Western blot assay
The total protein of cells was extracted and quantified by BCA. After sealing by electrophoresis, transfer membrane, and skim milk powder, the target protein primary antibody (RhoC, Bcl-2, Bax, MMP-2, and GAPDH; Abcam, Cambridge, Britain) was incubated overnight at 4°C. After subsequent incubation and reaction with horseradish peroxidase-labelled secondary antibody at room temperature, film scanning was conducted by an image analyser through film exposure, development, and fixation. Finally, relevant greyscale levels were analysed.
Statistical analysis
Data were statistically analysed by SPSS 20.0. The correlations of the lncRNA PCA3 and various clinicopathological parameters were also analysed. Data are expressed as mean ± standard deviation (SD). Data were first tested for normality. Data conforming to a normal distribution were subjected to a homogeneity test for variance by Bartlett’s test. If the variance was shown to be homogeneous, variance analysis was performed with the goal of comparing the means among five groups. Once these means failed to be equal to each other, the SNK test was conducted for pairwise comparison. When the data failed to conform to a normal distribution, pairwise comparison was performed by non-parametric tests. Regarding measurement data, they were expressed in relative numbers. χ2 test was selected for between-group variances, and survival analysis was performed using Kaplan-Meier curves.
Results
Expression of the lncRNA PCA3 in colon cancer and normal peritumoral tissues, and analysis of correlation between lncRNA PCA3 and prognosis
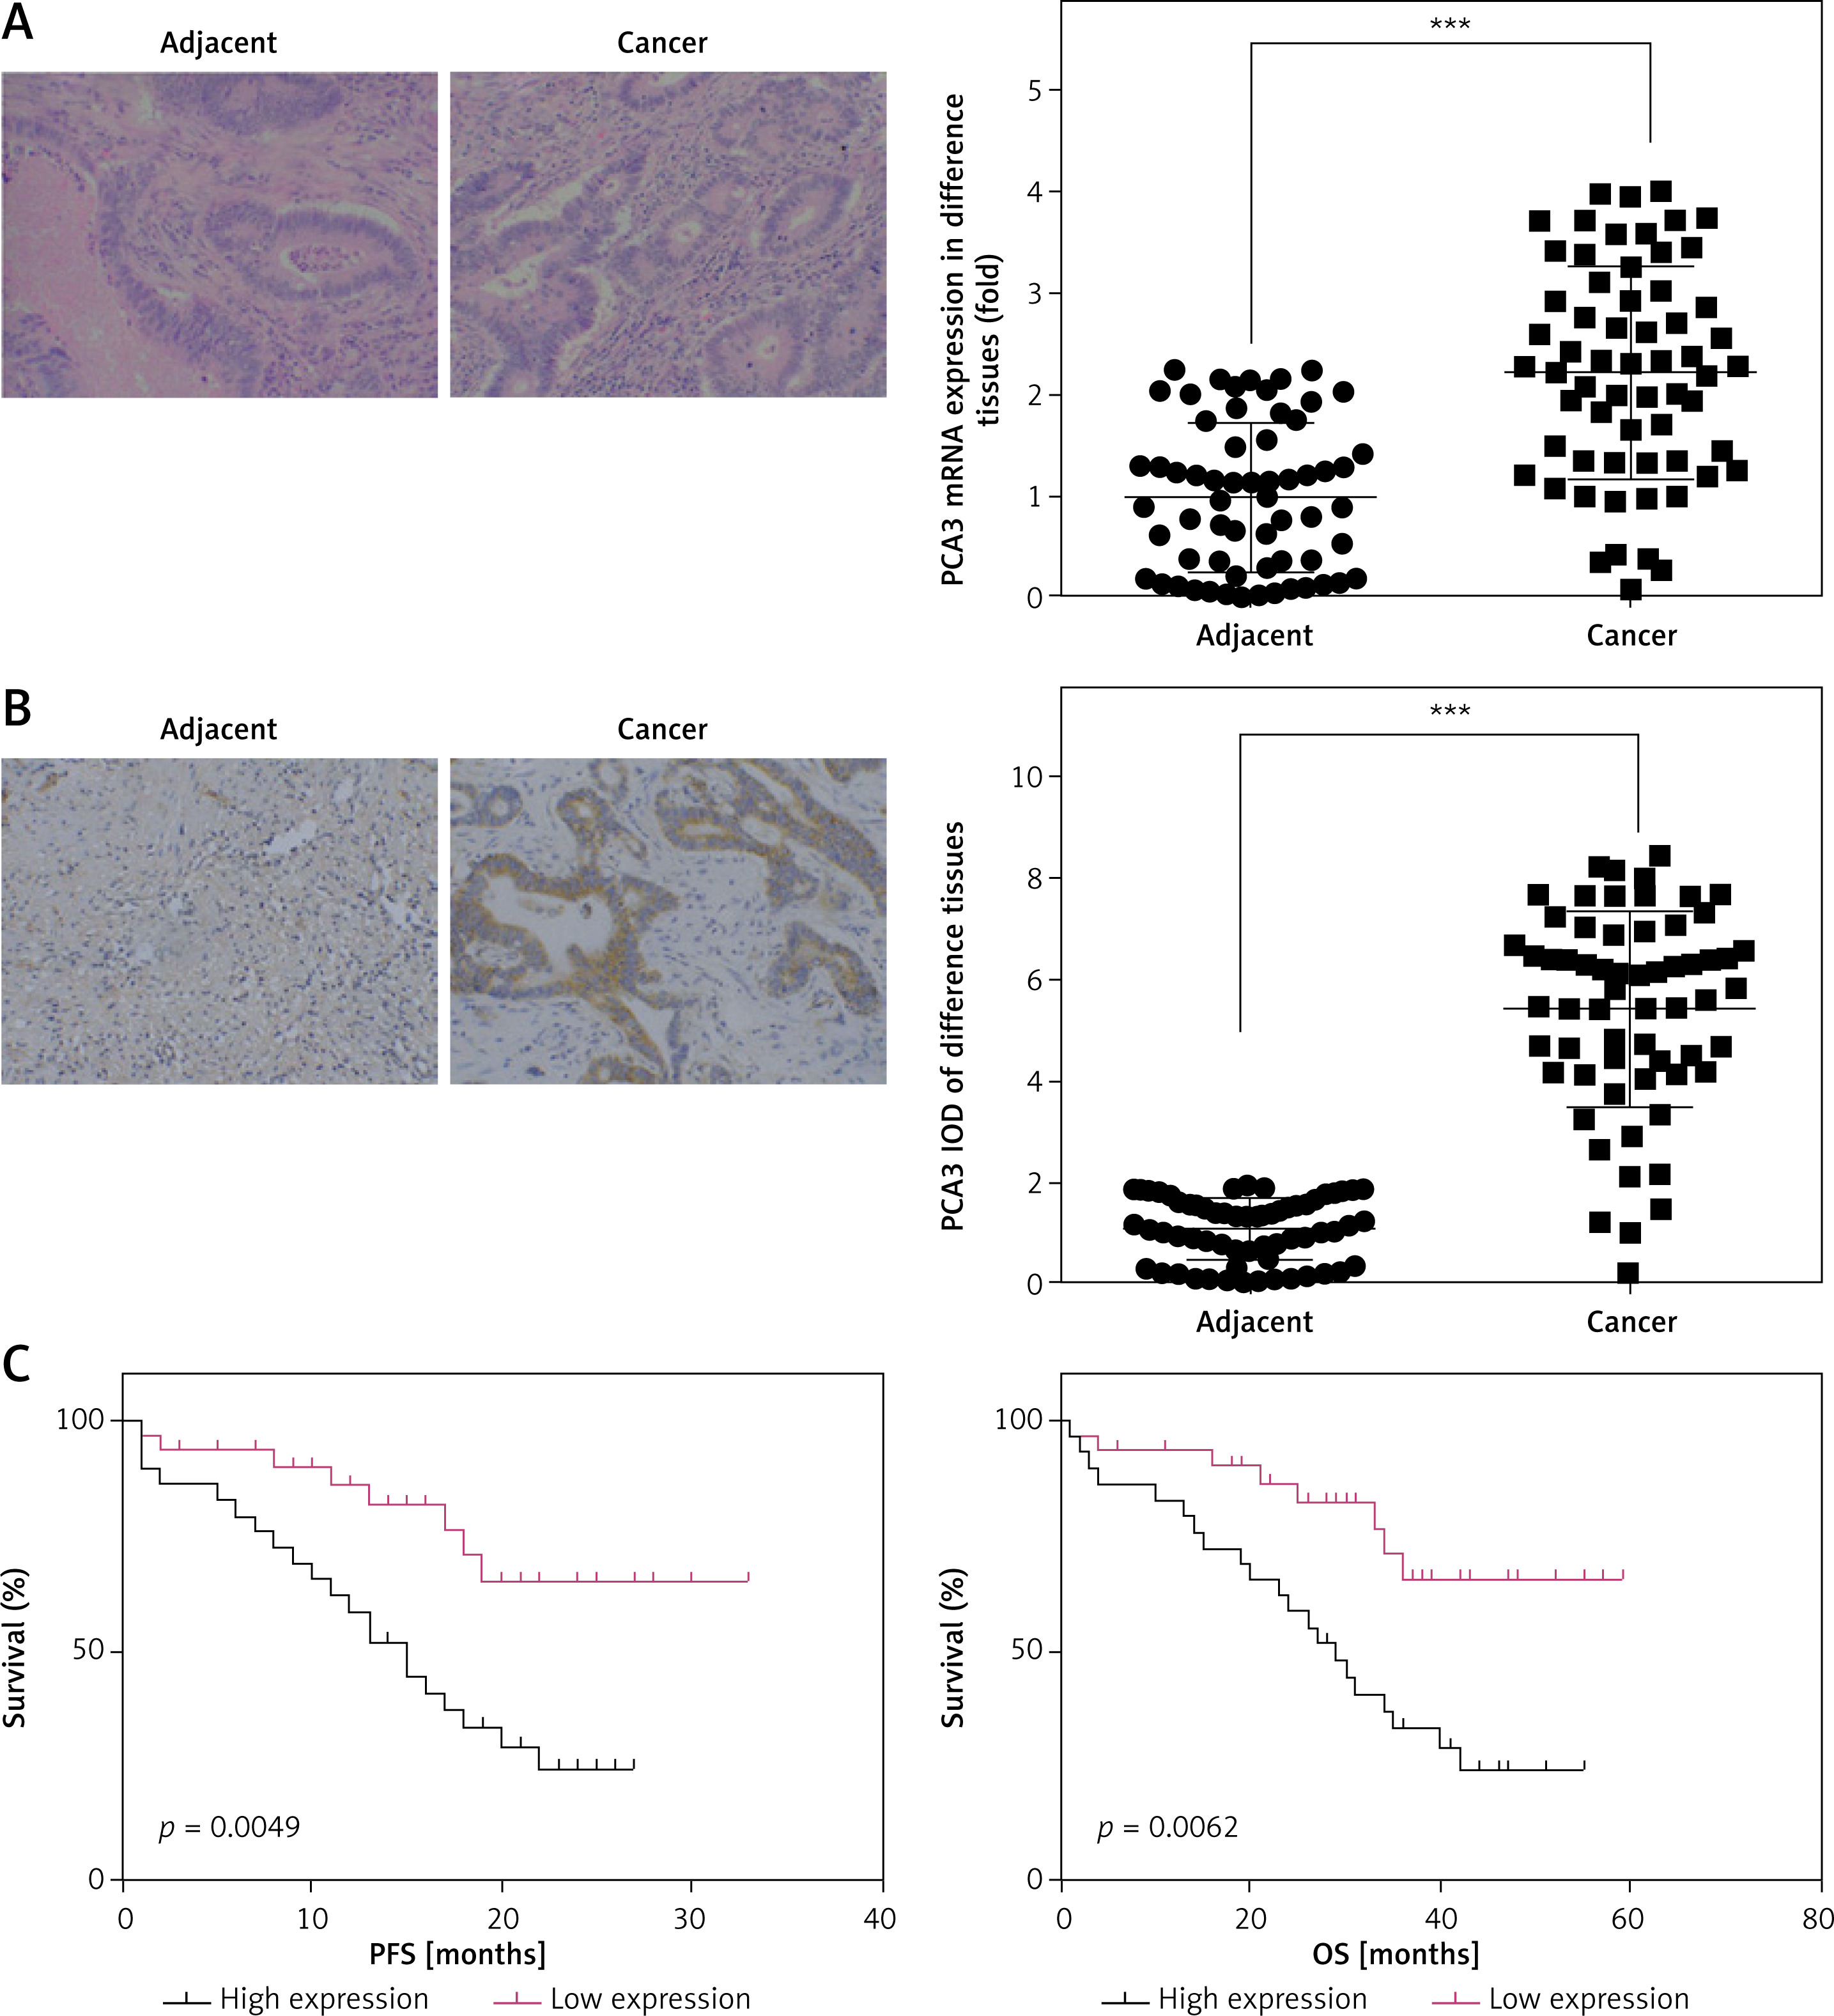
HE staining revealed that the cellular infiltration and degree of invasiveness of colon cancer tissues were significantly higher than those of normal peritumoral tissues. Moreover, in cancer tissues, cell boundaries were blurred, as shown in Figure 1 A. According to the RT-qPCR detection results, the lncRNA PCA3 expression level in colonic tumour tissues was significantly higher than that in normal peritumoral tissues (Figure 1 A, p < 0.001). When lncRNA PCA3 expression was verified by ISH, the results showed that the lncRNA PCA3 expression level in the NC group was significantly below that in colon cancer tissues (p < 0.001, Figure 1 B). In terms of Kaplan-Meier analysis, the results indicated that both progression-free survival and overall survival of patients with highly expressed PCA3 were dramatically lower than those of patients with low PCA3 expression (both p < 0.01, Figure 1 C).
Figure 1
LncRNA PCA3 expression in colon cancer and normal peritumoural tissues and correlation analysis for lncRNA PCA3 and prognosis. A – Pathology by HE staining (200.) and PCA3 gene expression by RT-qPCR assay. B – PCA3 expression by ISH assay (200.). C – PFS and OS in patients
Adjacent – normal tissues; Cancer – colon cancer tissues. ***P < 0.0001, compared with Adjacent group.
Relationships of lncRNA PCA3 expression level and clinicopathological features
Patients were equally divided into a group with high PCA3 expression and a group with low PCA3 expression. Pearson’s correlation analysis revealed that the PCA3 expression levels were significantly correlated with tumour size, differentiation, Duke’s staging, and blood vessel invasion (all p < 0.05, Table I). Regarding patients in the group with high expression, their tumours were larger in size, less differentiated, and had more advanced Duke’s staging. However, there were no significant correlations between the lncRNA PCA3 expression level and clinicopathological features (e.g. sex, age, lymphatic metastasis, and distant metastasis).
Table I
The relationship between PCA3 expression and clinical parameters in patients with colon cancer
lncRNA PCA3 expression in different cells
RT-qPCR results indicated that PCA3 expression levels of the colon cancer cell lines SW480, HT-29, SW620, and HCT116 were significantly higher than that of the normal colonic epithelial cell line HCoEpiC (p < 0.01 or p < 0.001, Figure 2 A). Among the cells SW620, HT-29, SW480, and HCT116, lncRNA PCA3 expression peaked in SW620 and HT-29. For this reason, SW620 and HT-29 were selected as the focus in this study.
Figure 2
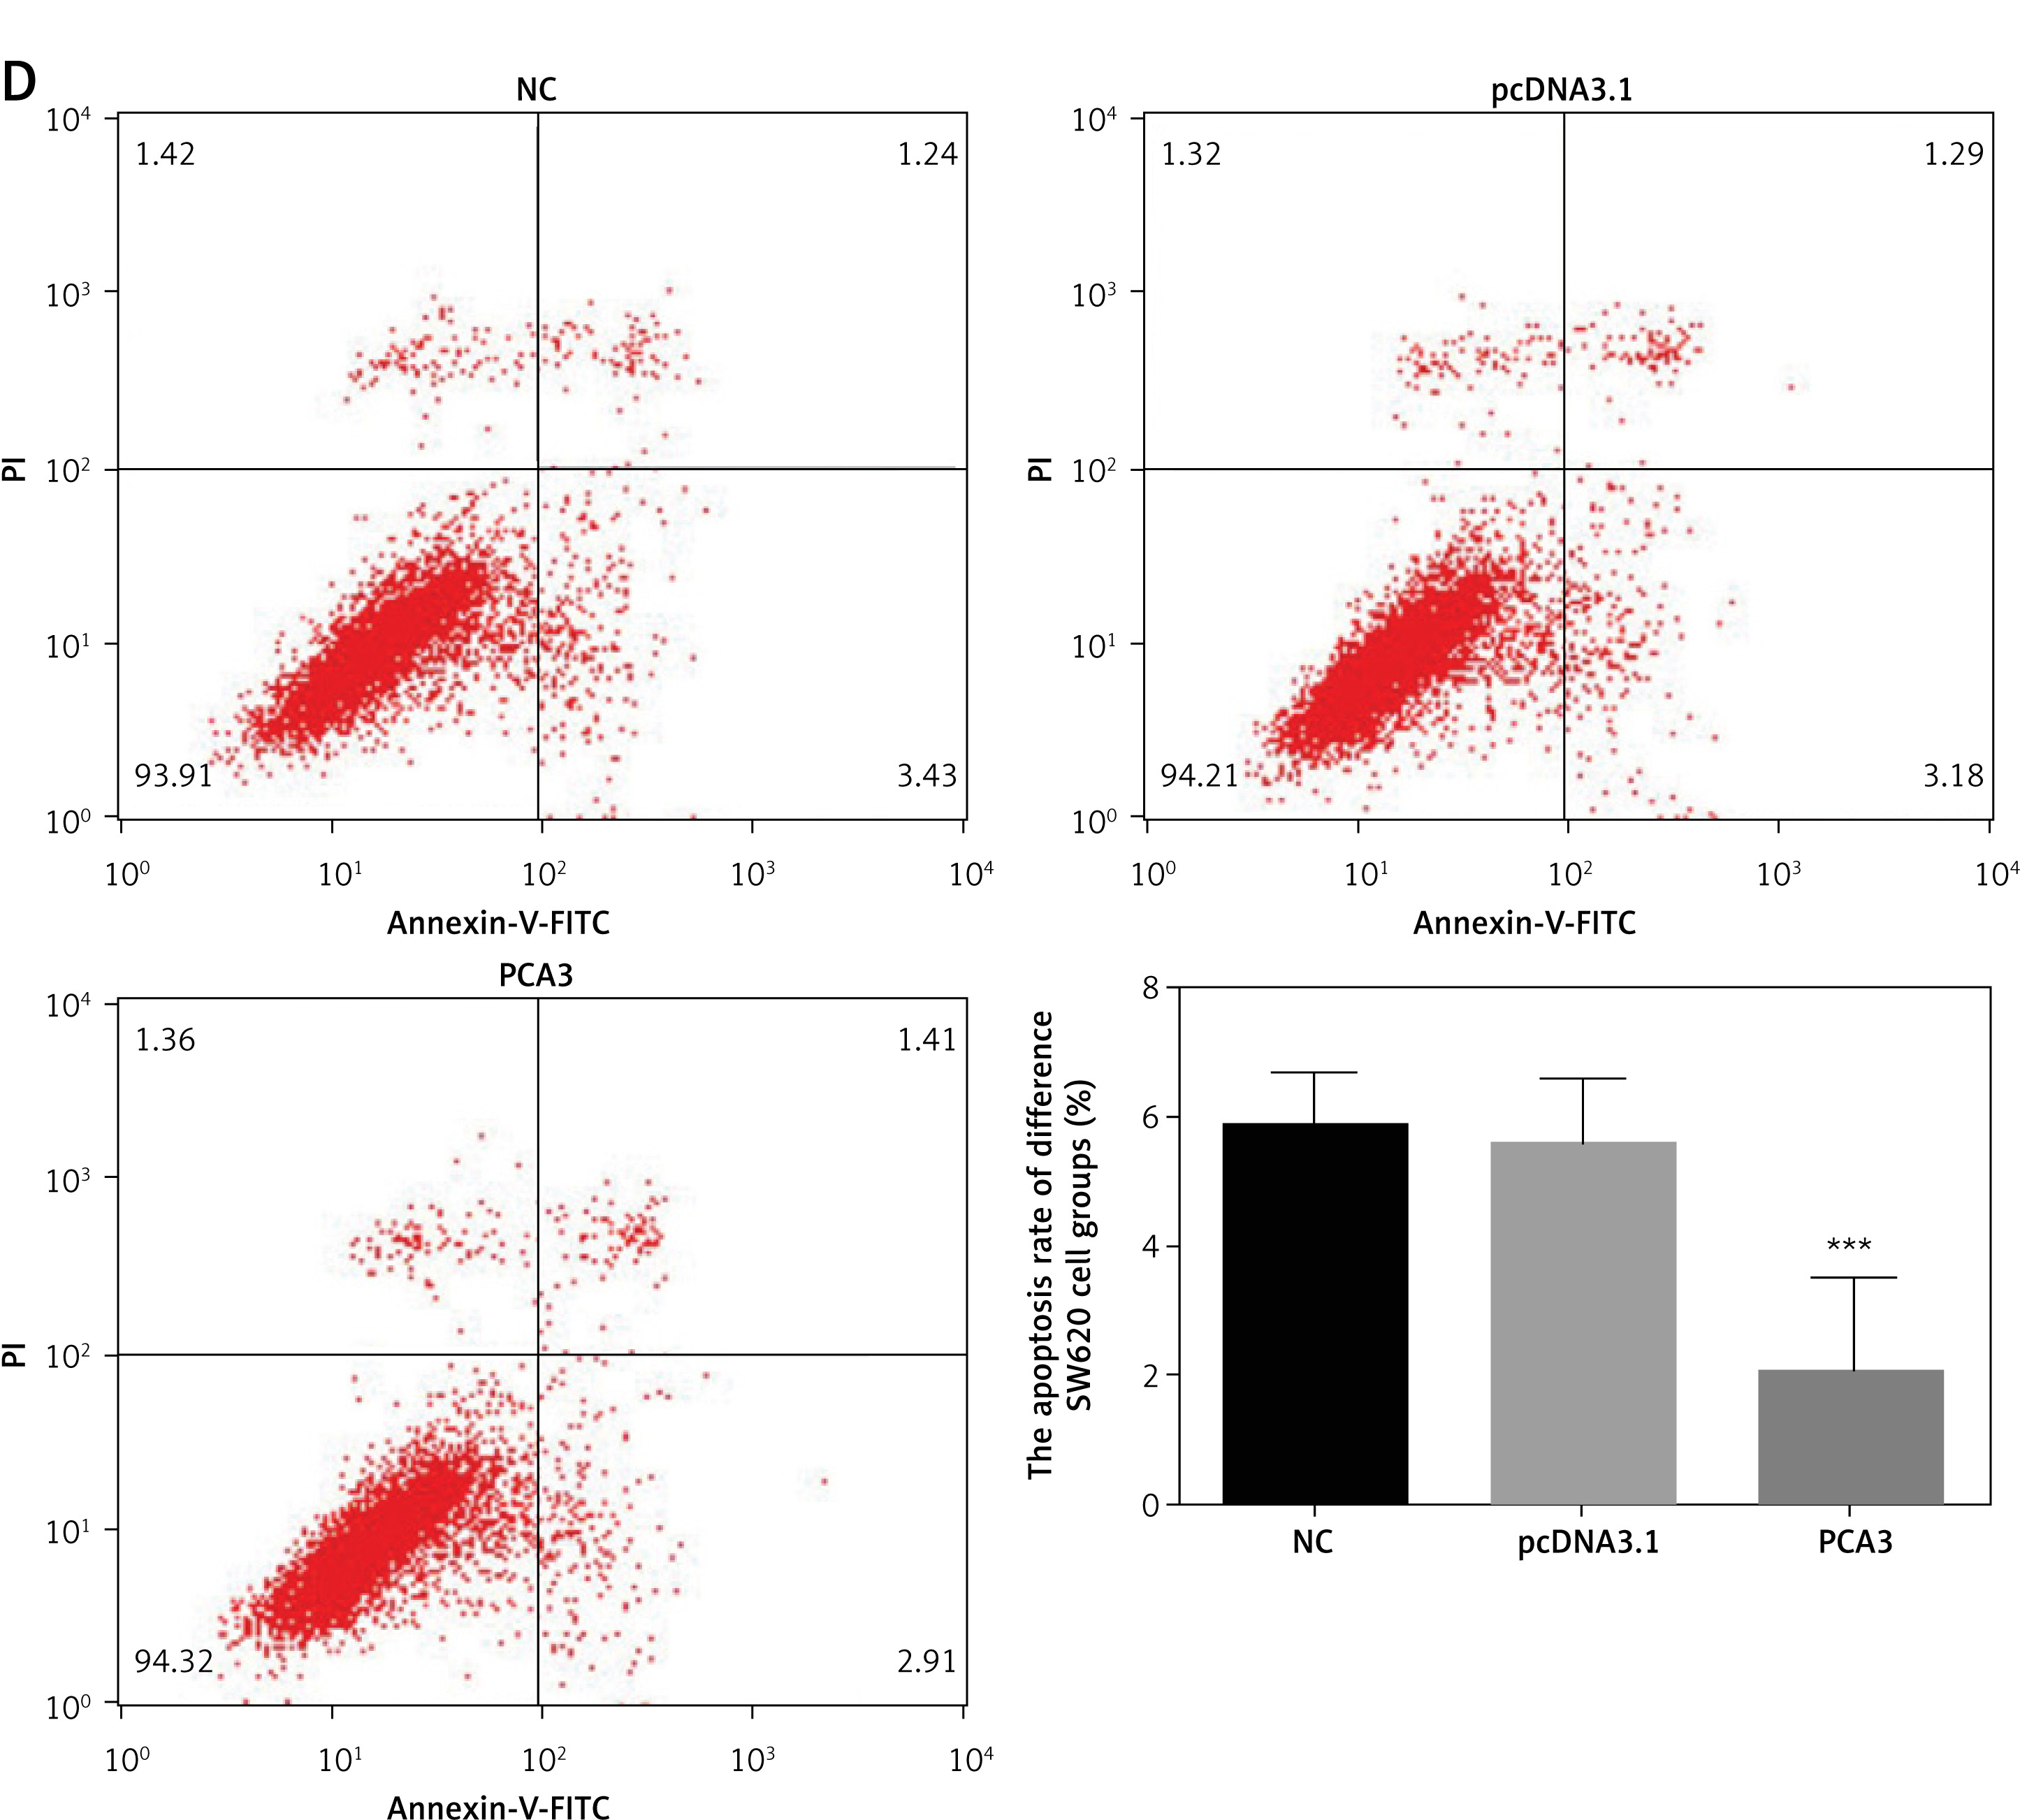
PCA3 gene expression and PCA3 over-expression on cell proliferation and apoptosis. NC – the cells were treated with normal treatment; pcDNA3.1 – the cells were transfected with pcDNA3.1; PCA3 – the cells were transfected with PCA3 by pcDNA3.1. A – PCA3 gene expression by RT-qPCR assay. **P < 0.01, ***p < 0.001, compared with HCoEpiC. B – The cell proliferation rate of difference groups by MTT assay. ***P < 0.001, compared with NC group. C – The apoptosis rate of difference HT-29 cell groups. ***P < 0.001, compared with NC group. D – The apoptosis rate of difference SW620 cell groups. ***P < 0.001, compared with NC group
The influence of PCA3 overexpression on cell proliferation and apoptosis
In comparison with the NC group, there were no significant differences in the cell proliferation rates in the pcDNA3.1 group. In addition, the MTT assay revealed that the cell proliferation rates in the PCA3 group were significantly increased (p < 0.001, Figures 2 B). In line with the flow cytometry findings, the apoptosis rate in the pcDNA3.1 group did not significantly differ from that in the NC group (p > 0.05, Figures 2 C, D), while the apoptosis rate in the PCA3 group was significantly lower (p < 0.001, Figures 2 C, D).
The influence of PCA3 overexpression on cell invasion and migration
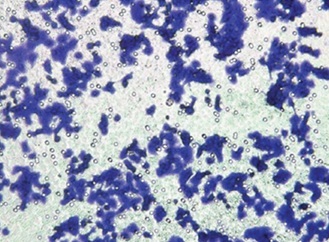
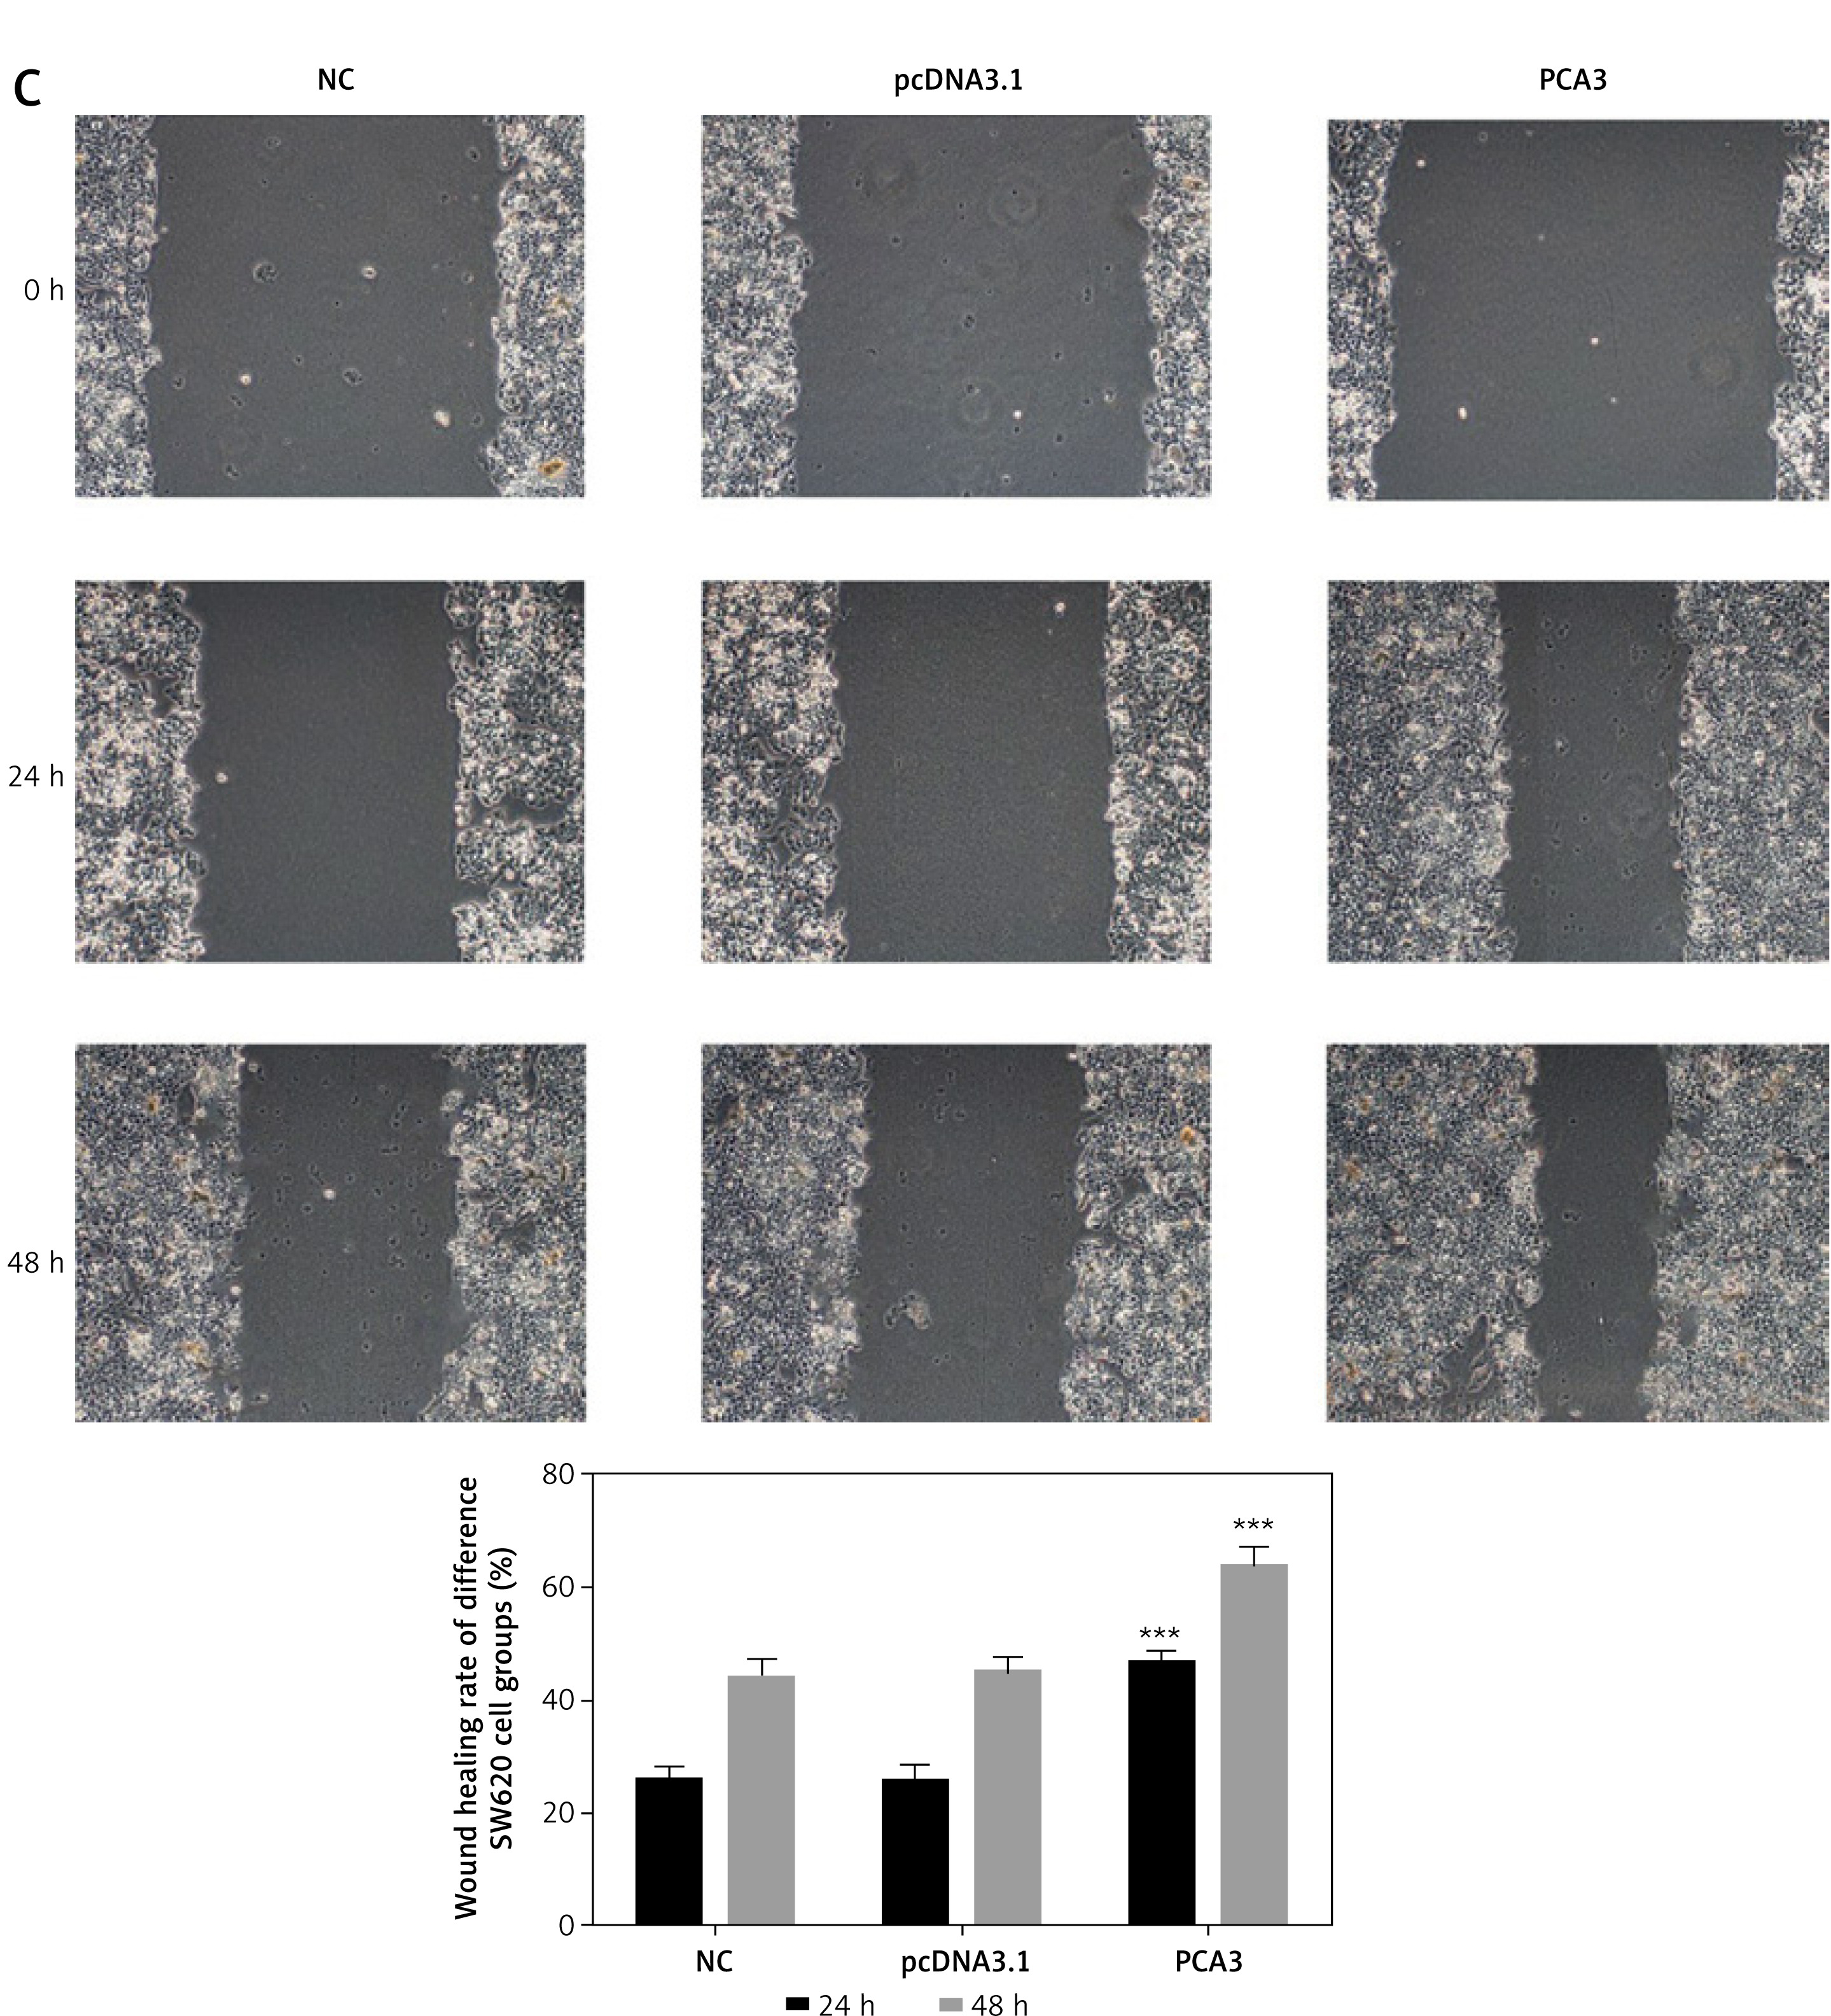
In line with the Transwell detection results, there were no significant differences in the invasive cell counts between the NC group and the pcDNA3.1 group, as shown in Figures 3 A and B (p > 0.05). Additionally, the number of invasive cells in the PCA3 group significantly increased (p < 0.001, Figures 3 A and B). From wound healing detection, the wound healing rates at 24 and 48 h in the pcDNA3.1 group were found not to differ significantly from those in the NC group (p > 0.05, Figures 3 C and D); however, the wound healing rates increased at both 24 and 48 h in the PCA3 group (p < 0.001, Figures 3 C and D).
Figure 3
The influence of PCA3 over-expression on cell invasion and migration. NC – the cells were treated with normal treatment; pcDNA3.1 – the cells were transfected with pcDNA3.1; PCA3 – the cells were transfected with PCA3 by pcDNA3.1. A – Invasion HT-29 cell number of different HT-29 cell groups by transwell assay. B – Invasion SW620 cell number of different SW620 cell groups by transwell assay. C – Wound healing rate of different HT-29 cell groups by wound healing assay. D – Wound healing rate of different SW620 cell groups by wound healing assay
***P < 0.001, compared with NC group.
The influence of PCA3 overexpression on associated proteins
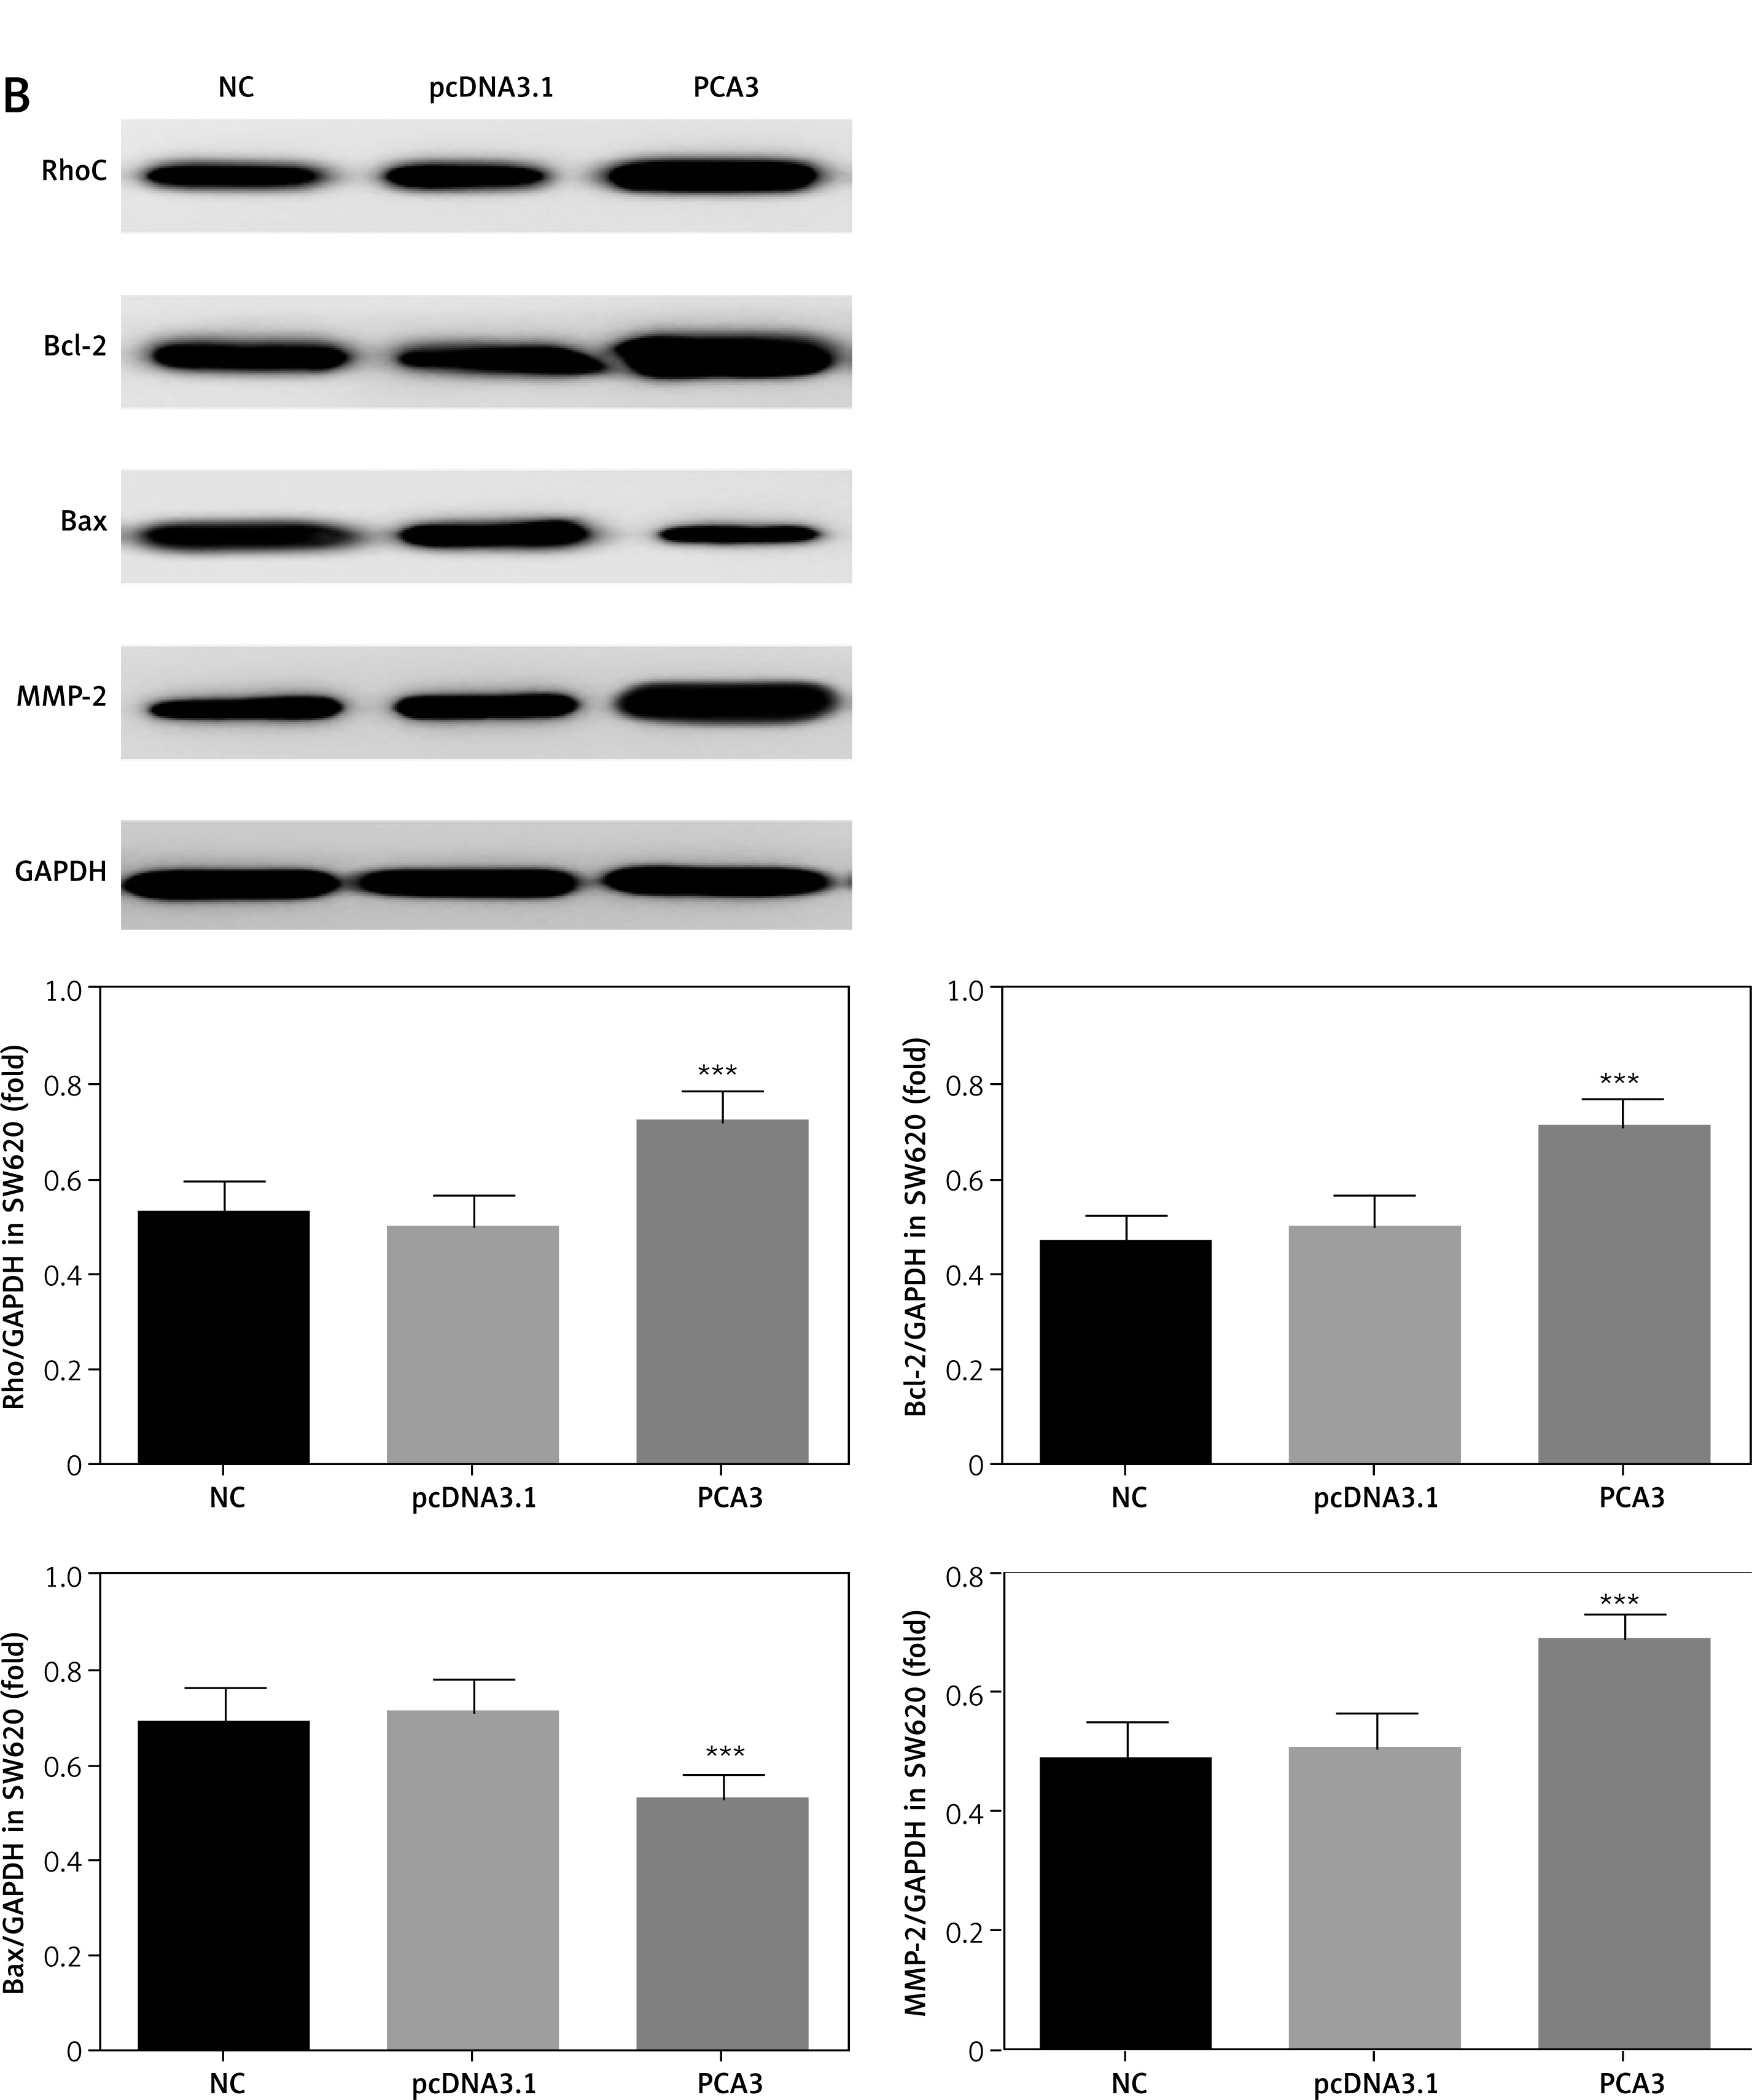
Western blotting proved that the protein expression levels of RhoC, Bcl-2, Bax, and MMP-2 showed no significant differences between the NC and pcDNA3.1 groups (all p > 0.05, Figure 4). However, in the PCA3 group, not only were the expression levels of the above-mentioned proteins significantly increased (all p < 0.01, Figure 4), but also the Bax protein expression level was significantly decreased (p < 0.01, Figure 4).
Figure 4
The relative protein expressions by WB assay. NC – the cells were treated with normal treatment; pcDNA3.1 – the cells were transfected with pcDNA3.1; PCA3 – the cells were transfected with PCA3 by pcDNA3.1. A – Relative protein expression by WB assays in HT-29 cell groups. B – Relative protein expression by WB assays in SW620 cell groups.
***P < 0.001, compared with NC group.
The influence of PCA3 knockout on cell proliferation and apoptosis
As indicated by the MTT assay, the cell proliferation rates in the NC and si-NC groups did not differ significantly, as illustrated in Figure 5 A (p > 0.05). In the si-PCA3 group, the cell proliferation rate decreased significantly (p < 0.001, Figure 5 A). According to the flow cytometry findings, there were no significant differences in apoptosis rates of the NC and si-NC groups (p > 0.05, Figures 5 B and C), while this rate in the si-PCA3 group increased significantly (p < 0.001, Figures 5 B and C).
Figure 5
The influence of PCA3 knockout on cell proliferation and apoptosis. NC – the cells were treated with normal treatment; si-NC – the cells were transfected with empty vector (si-NC); si-PCA3 – the cells were transfected with si-PCA3. A – The cell proliferation rate of different cell groups by MTT assay. B – The apoptosis rate of different HT-29 cell groups. C – The apoptosis rate of different SW620 cell groups
***P < 0.001, compared with NC group.
The influence of PCA3 knockout on cell invasion and migration
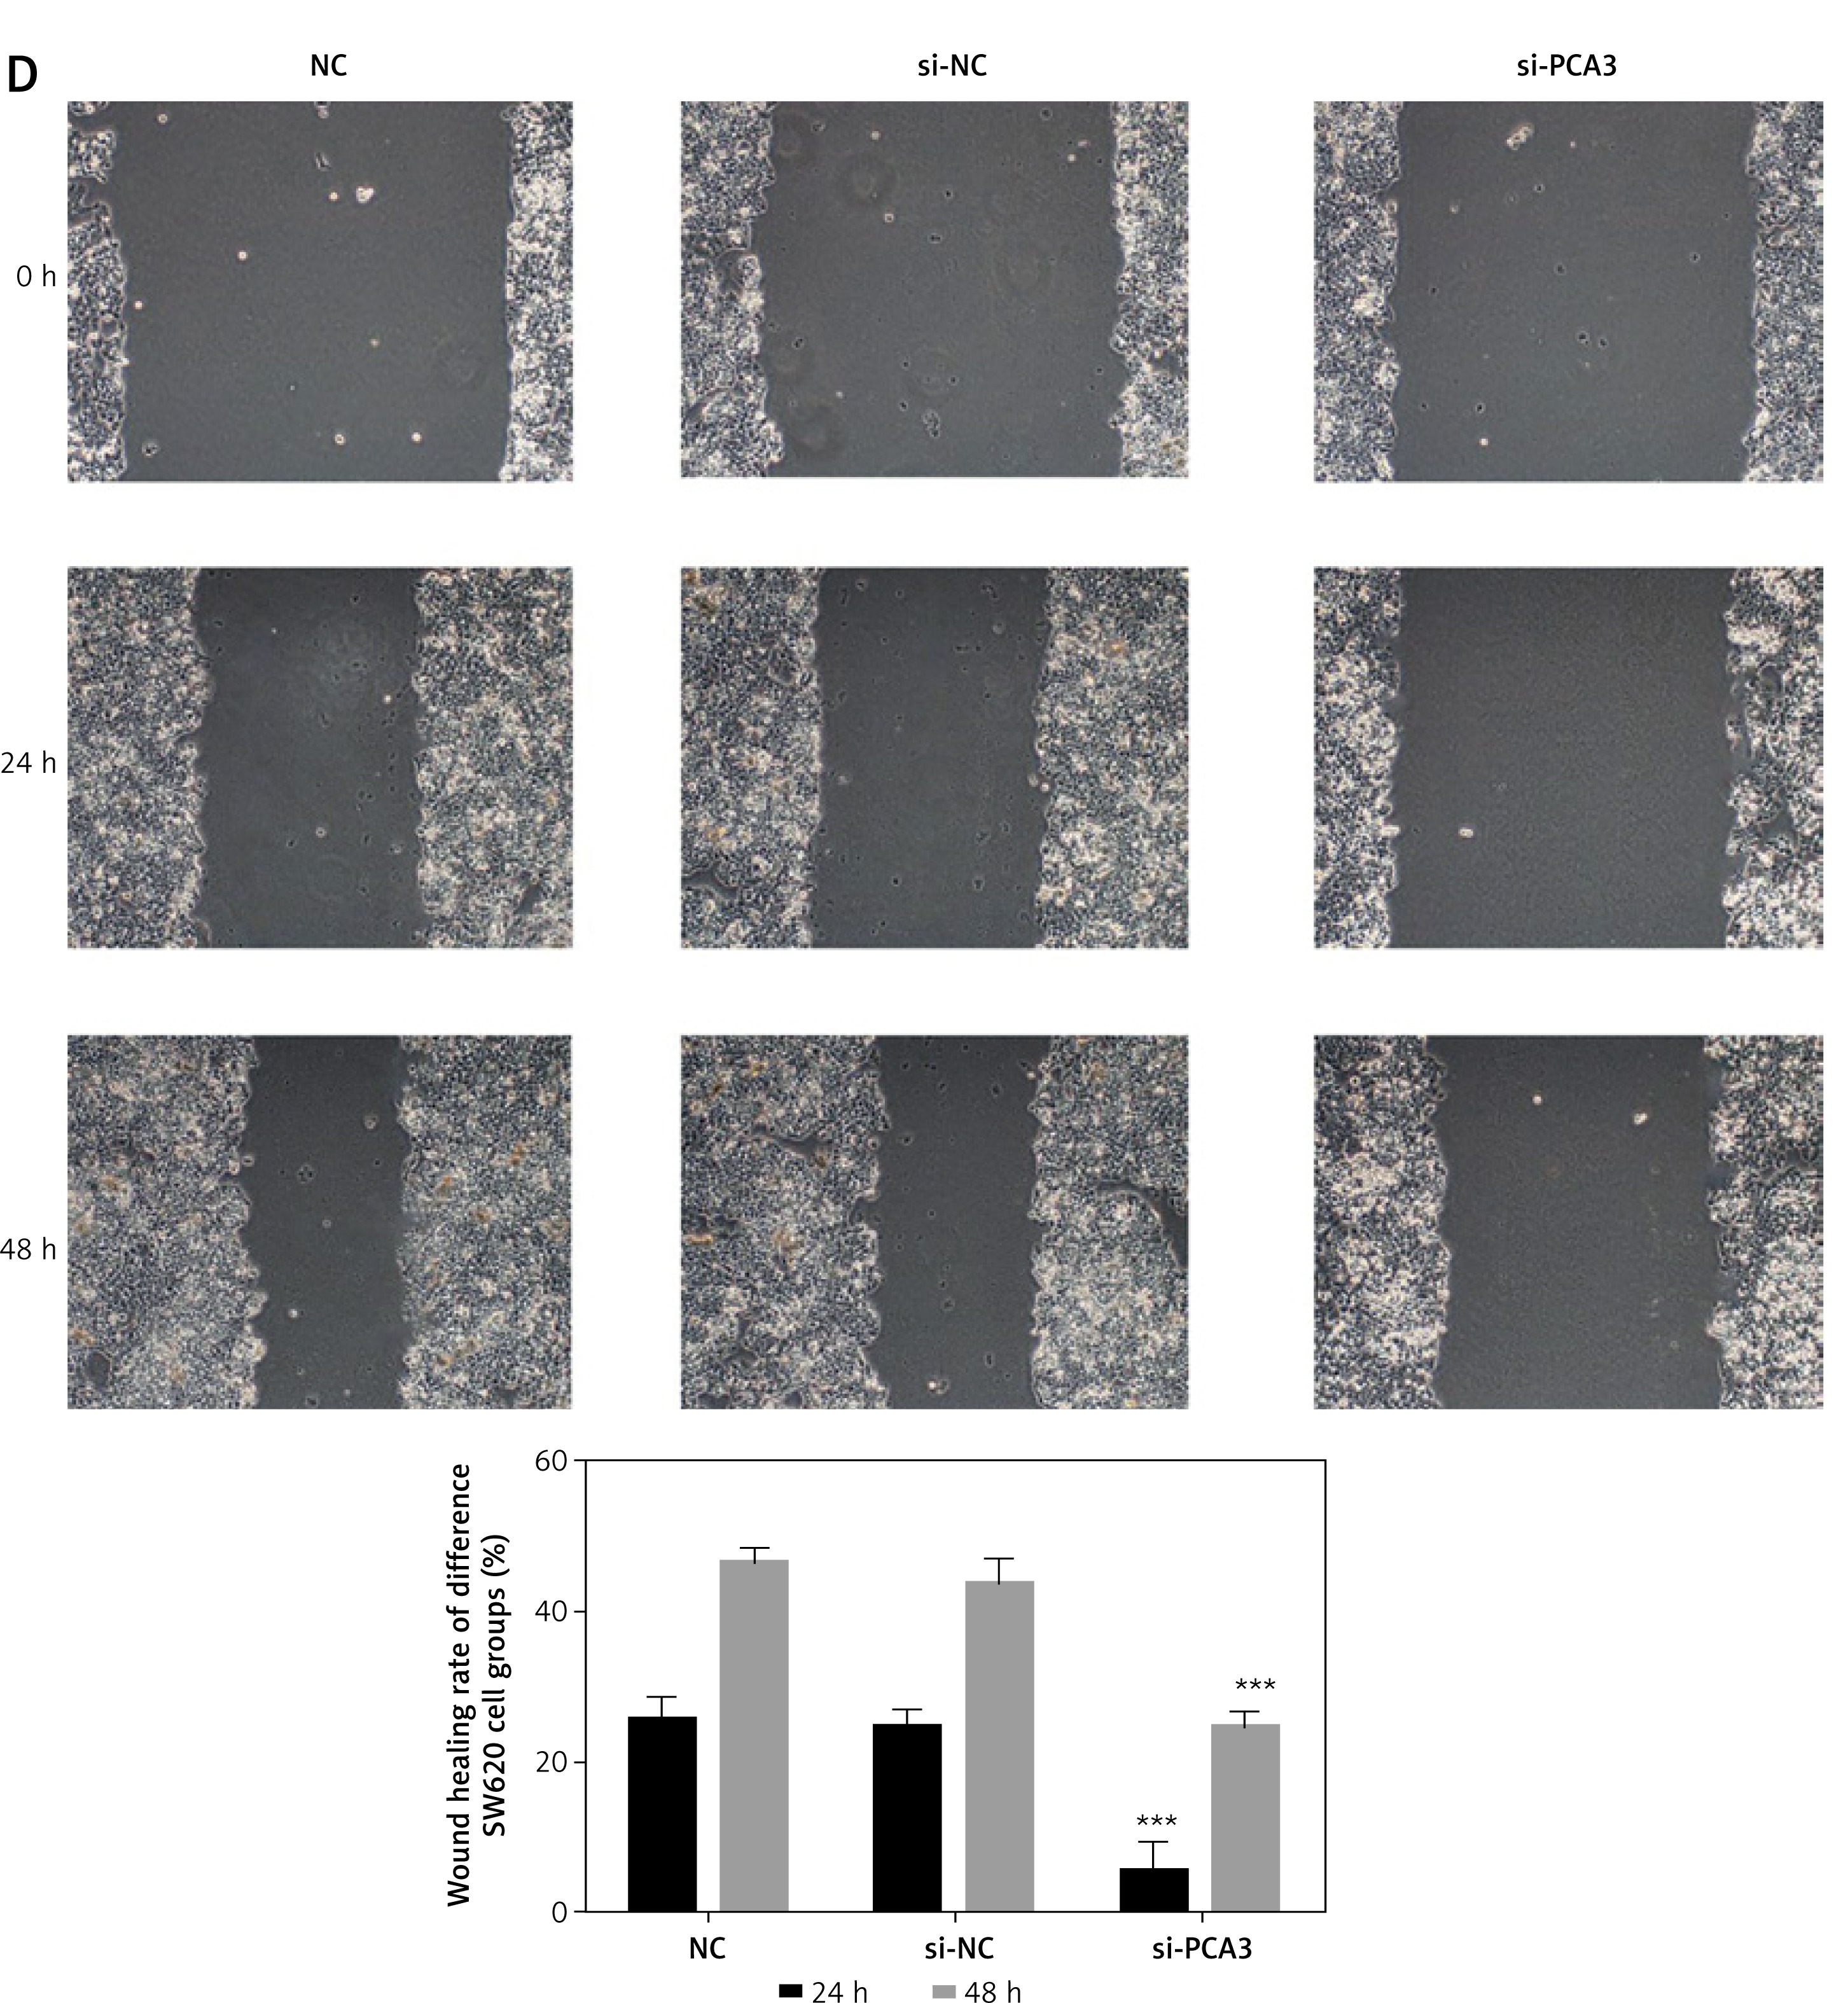
The Transwell assay revealed that the invasive cell count in the si-NC group did not differ significantly from that in the NC group, as presented in Figures 6 A and B (p > 0.05), while that in the si-PCA3 group decreased significantly (p < 0.001, Figures 6 A,B). Wound healing rates at 24 and 48 h in the si-NC group were demonstrated by the wound healing assay not to be significantly different from those in the NC group (p > 0.05, Figures 6 C, D). Moreover, the wound healing rates at 24 and 48 h were significantly inhibited in the si-PCA3 group (p < 0.001, Figures 6 C, D).
Figure 6
The influence of PCA3 knockout on cell invasion and migration. NC – the cells were treated with normal treatment; si-NC – the cells were transfected with empty vector (si-NC); si-PCA3 – the cells were transfected with si-PCA3. A – Invasion HT-29 cell number of different groups. B – Invasion SW620 cell number of different groups. C – Wound healing rate of different HT-29 cell groups. D – Wound healing rate of different SW620 cell groups
***P < 0.001, compared with NC group.
The influence of PCA3 knockout on associated proteins
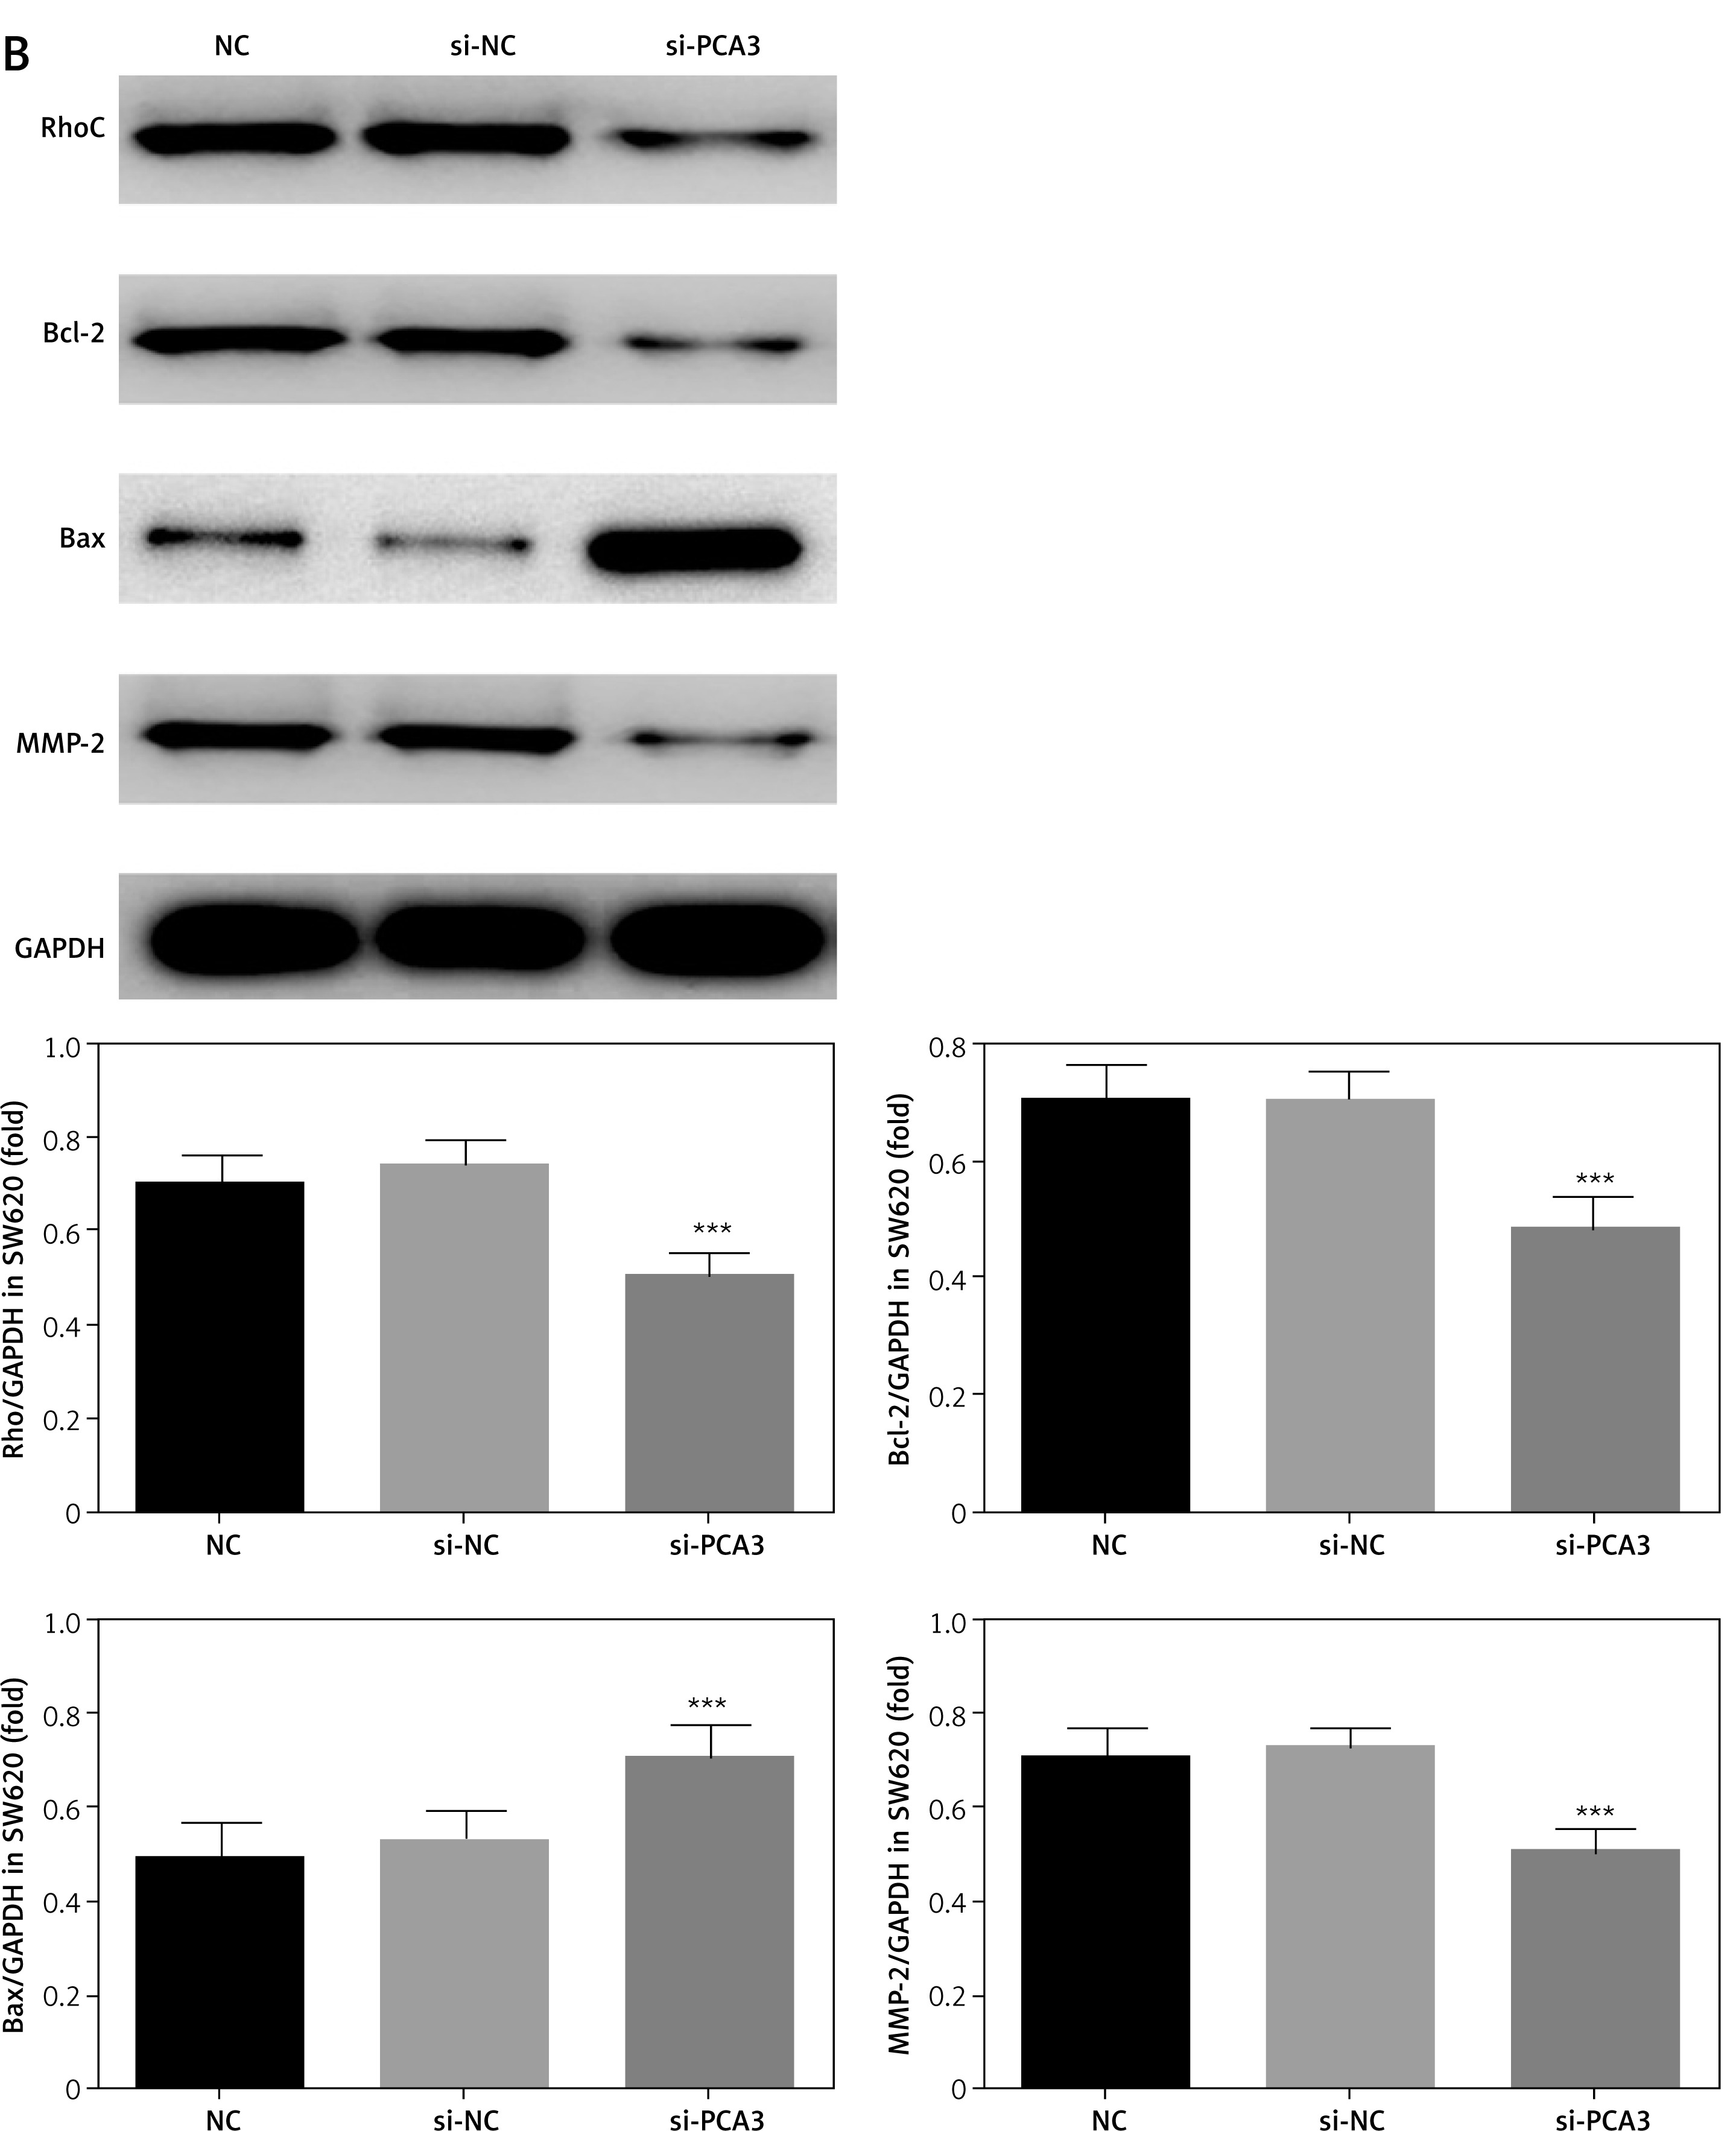
With regard to the expression levels reflected by western blotting, the proteins RhoC, Bcl-2, Bax, and MMP-2 in the si-NC group were not significantly different from those in the NC group (all p > 0.05, Figure 7). In contrast, the protein expression levels of RhoC, Bcl-2, and MMP-2 were significantly reduced in the si-PCA3 group, as shown in Figure 7 (all p < 0.001), while that of Bax presented a significant increase (p < 0.001, Figure 7).
Figure 7
The influence of PCA3 knockout on associated protein. NC – the cells were treated with normal treatment; si-NC – the cells were transfected with empty vector (si-NC); si-PCA3 – the cells were transfected with si- PCA3. A – The relative protein expressions in different HT-29 cell groups by WB assay. B – The relative protein expressions in different SW620 cell groups by WB assay
***P < 0.001, compared with NC group.
Discussion
As a type of lncRNA with superior performance, PCA3 has been proven to be a novel PCa biomarker, with rather high specificity and sensitivity. It has been reported that PCA3 shows greater diagnostic accuracy among Chinese patients with a PSA protein level in the range 4.0–10.0 ng/ml [9]. Nevertheless, it has also been pointed out that variations in PCA3 gene expression level are not significantly correlated with PCa [15]. In this study, clinical investigations revealed that lncRNA PCA3 expression in colonic cancer tissues was significantly improved, while clinical analysis also indicated that the PFS and OS of patients in the PCA3 overexpression group were significantly below those of patients with low PCA3 expression. Furthermore, patients from the overexpression group showed more advanced clinical staging, larger tumours, and greater differentiation than the cases in the low-expression group. With the goal of further exploring the mechanisms of action of PCA3 in the occurrence and development of colon cancer, an in vitro cell experiment was carried out. The results showed that PCA3 overexpression results in not only a significant rise of cell proliferation, invasion, and migration, but also significant inhibition of apoptosis. By contrast, upon the knockout of PCA3 by si-mRNA, colon cancer cell proliferation, invasion, and migration were all significantly inhibited, while the apoptosis of these cells was markedly elevated. On this basis, it is inferred that PCA3 has the ability to promote the occurrence and development of colon cancer, and to improve the bioactivity of colon cancer cells (e.g. cell proliferation, invasion, and migration). Upon the knockout of PCA3, their bioactivity was significantly inhibited.
The RHO subfamily (e.g. RhoA and RhoC) not only plays a critical role in regulating the invasion, migration, and apoptosis of tumour cells [16–19], but also has an influence on tumour occurrence and development by regulating angiogenesis [20]. Through PCA3 overexpression and knockout, it was revealed herein that RhoC protein expression in HT-29 and SW620 cells can be significantly increased or decreased. This indicates that PCA3 expression is positively correlated with RhoC protein expression. Additionally, RhoC overexpression has been demonstrated to effectively regulate the expression of downstream Bax, Bcl-2, and MMP-2 [21, 22].
In a case where the normal apoptotic mechanism regulates disorders in tumour cells, the apoptotic factors Bax and Bcl-2 exert important effects. According to research findings by Sharifi et al. [23], doxorubicin-induced mitochondria-dependent apoptosis downregulates Bax protein expression. For this reason, it is speculated that doxorubicin has the potential to induce mitochondria-dependent apoptosis by upregulating Bax expression levels. From the results obtained by Vafaiyan et al. [24], the activity of telomerase declines in breast cancer cells that have been treated with valproic acid, while the ratio of Bax to Bcl-2 increases and there is a significant positive correlation between them (p = 0.001). This indicates that the reason why valproic acid lowers breast cancer cell activity is that telomerase activity drops but the specific value between Bax and Bcl-2 increases. Owing to PCA3 knockout, the Bcl-2 expression level presents a significant decline, while that of Bax is improved in a significant manner. Accordingly, it can be deduced that PCA3 knockdown can effectively inhibit colon cancer cell proliferation and promote apoptosis. As for the corresponding mechanism of action, it may be closely related to the upregulation of Bax expression and the downregulation of Bcl-2 expression.
As a topic of particular discussion in recent years, the tumour microenvironment is formed by a combination of various local cells, extracellular matrix (ECM), enzymes, and cell factors. ECM is deemed to be a natural histological barrier to tumours, and degradation of the ECM or basement membrane is a key part of tumour invasion and distant metastasis [25, 26]. Matrix metalloproteinases (MMPs) are a major family of proteins whose main function is to degrade the ECM. They also play an essential role in pathophysiological events such as embryonic development, angiogenesis, as well as infiltration and distant metastasis of fibrotic diseases and malignant tumours. Among them, collagenase type IV has been most extensively investigated. It consists of two major forms. While one form (molecular weight: 92 kD) is saccharified and named MMP-9, the other form is non-saccharified and called MMP-2; the molecular weight of the latter is 72 ku. Both MMP-2 and MMP-9 have been intensively investigated. In detail, also known as gelatinase or collagenase type IV, they are capable of promoting the invasion and migration of multiple malignant tumours by degrading collagen type IV, a major component of the basement membrane [27, 28]. The research presented herein shows that MMP-2 protein expression levels are significantly lowered after PCA3 knockout. This may be closely related to the inhibition of colon cancer cell invasion and migration after PCA3 knockout.
In conclusion, the lncRNA PCA3 is of great significance for the occurrence and development of colon cancers. After PCA3 expression levels are reduced, the bioactivity of colon cancers can be effectively reduced. This mechanism may be associated with regulation of the expression of RhoC, as well as Bcl-2, Bax, and MMP-2 downstream of it.

