Introduction
Age-related macular degeneration (AMD) is a leading cause of central vision loss in the developed world, with 6–9% of legal blindness globally and an increasing prevalence (0.2% to 13%) related to the growing economic burden [1–5]. From 1990 to 2017, global disability-adjusted life years (DALYs) increased by 108.2% (2.5 million to 5.3 million) due to AMD [6]. The Blue Mountains Eye Study reported that the 15-year incidence was 22.7% for early-stage AMD and 6.8% for late-stage AMD [7]. Vision impairment causes significant challenges in both personal life and the global economy [8], and it increases the probability of mortality [9]. To restore the quality of life of patients with visual impairment, various types of interventions are required, including psychotherapy, self-management, education, and problem-solving treatment [10]. Understanding the epidemiological change of AMD is essential for targeting resource allocation of medicine, interventions, and the economy.
As an age-related disease, the prevalence of AMD is correlated with patient longevity. The prevalence of age-related disorders is generally impacted by changes in population growth, global age patterns, and life expectancy worldwide [11]. The Global Burden of Disease Study (GBD 2019) comprehensively estimated the global and annual burden of diseases from 1990 to 2019, including case number, incidence, and DALYs, or years lived with disability (YLDs) in each country, region, gender, and year, providing a systematic scientific assessment of the AMD burden [12, 13]. Although AMD affects fewer middle-aged and older individuals compared to other age-related disorders, central vision loss of AMD usually causes great inconvenience to life and requires more rehabilitation investment. The sociodemographic index (SDI) and YLDs can be used to estimate the prevalence of AMD in various sociodemographic conditions, as well as its impact on the population. The increase in YLDs reflects the aging global population, corresponding to the decline in mortality [14]. Thus, instead of DALYs, YLDs may be more valuable for prevalence assessment and policymaking in the evaluation of AMD burden [15].
In the present study, data comprising the global prevalence and YLDs of AMD by SDI, gender, region, and age group from 1990 to 2019 based on the GBD 2019 were retrieved and used to estimate the epidemiological changes of the disease. The present findings serve as an important supplement and extension to previous studies [6, 16], thus contributing to the development of global strategies for AMD prevention.
Material and methods
Data source
Annual data from 1990 to 2019 on AMD burden were extracted by SDI (high, high-middle, middle, low-middle, and low), gender (female and male), 5-year age group, and 21 GBD regions from the Institute for Health Metrics and Evaluation (http://ghdx.healthdata.org/gbdresults-tool.). The data included prevalence, YLDs, and risk factors of AMD. The 95% uncertainty intervals (UI) for all estimates were generated using 2.5 and 97.5 centiles of the posterior distributions from 1000 random draws. The estimated world population was extracted from the United Nations World Population 2022 (https://population.un.org/wpp/Download/Standard/Population/).
Statistical analysis
The prevalence (numbers and percentages of patients in the population) and YLDs (years and age-standardized rate) were used to evaluate the effects caused by AMD. R software (version 4.3.0; https://www.R-project.org/) and the Joinpoint regression model (version 4.9.1.0; https://surveillance.cancer.gov/joinpoint/) were used to evaluate the temporal changes in the prevalence of AMD. Changes were described by connecting line segments at the “joinpoints”, where the linear slope significantly changed. Annual percent changes (APCs) were also calculated by Joinpoint. The number of new cases and age-standardized rate due to AMD were predicted from 2019 to 2039 by running a NORDPRED age-period-cohort analysis. The p-value was estimated with a significance level of 0.05.
Results
Global burden due to AMD
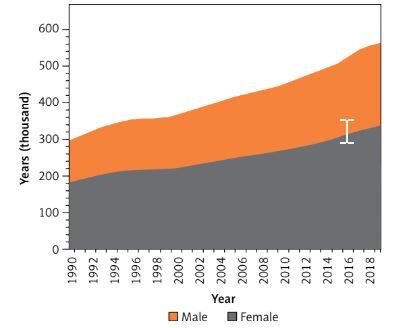
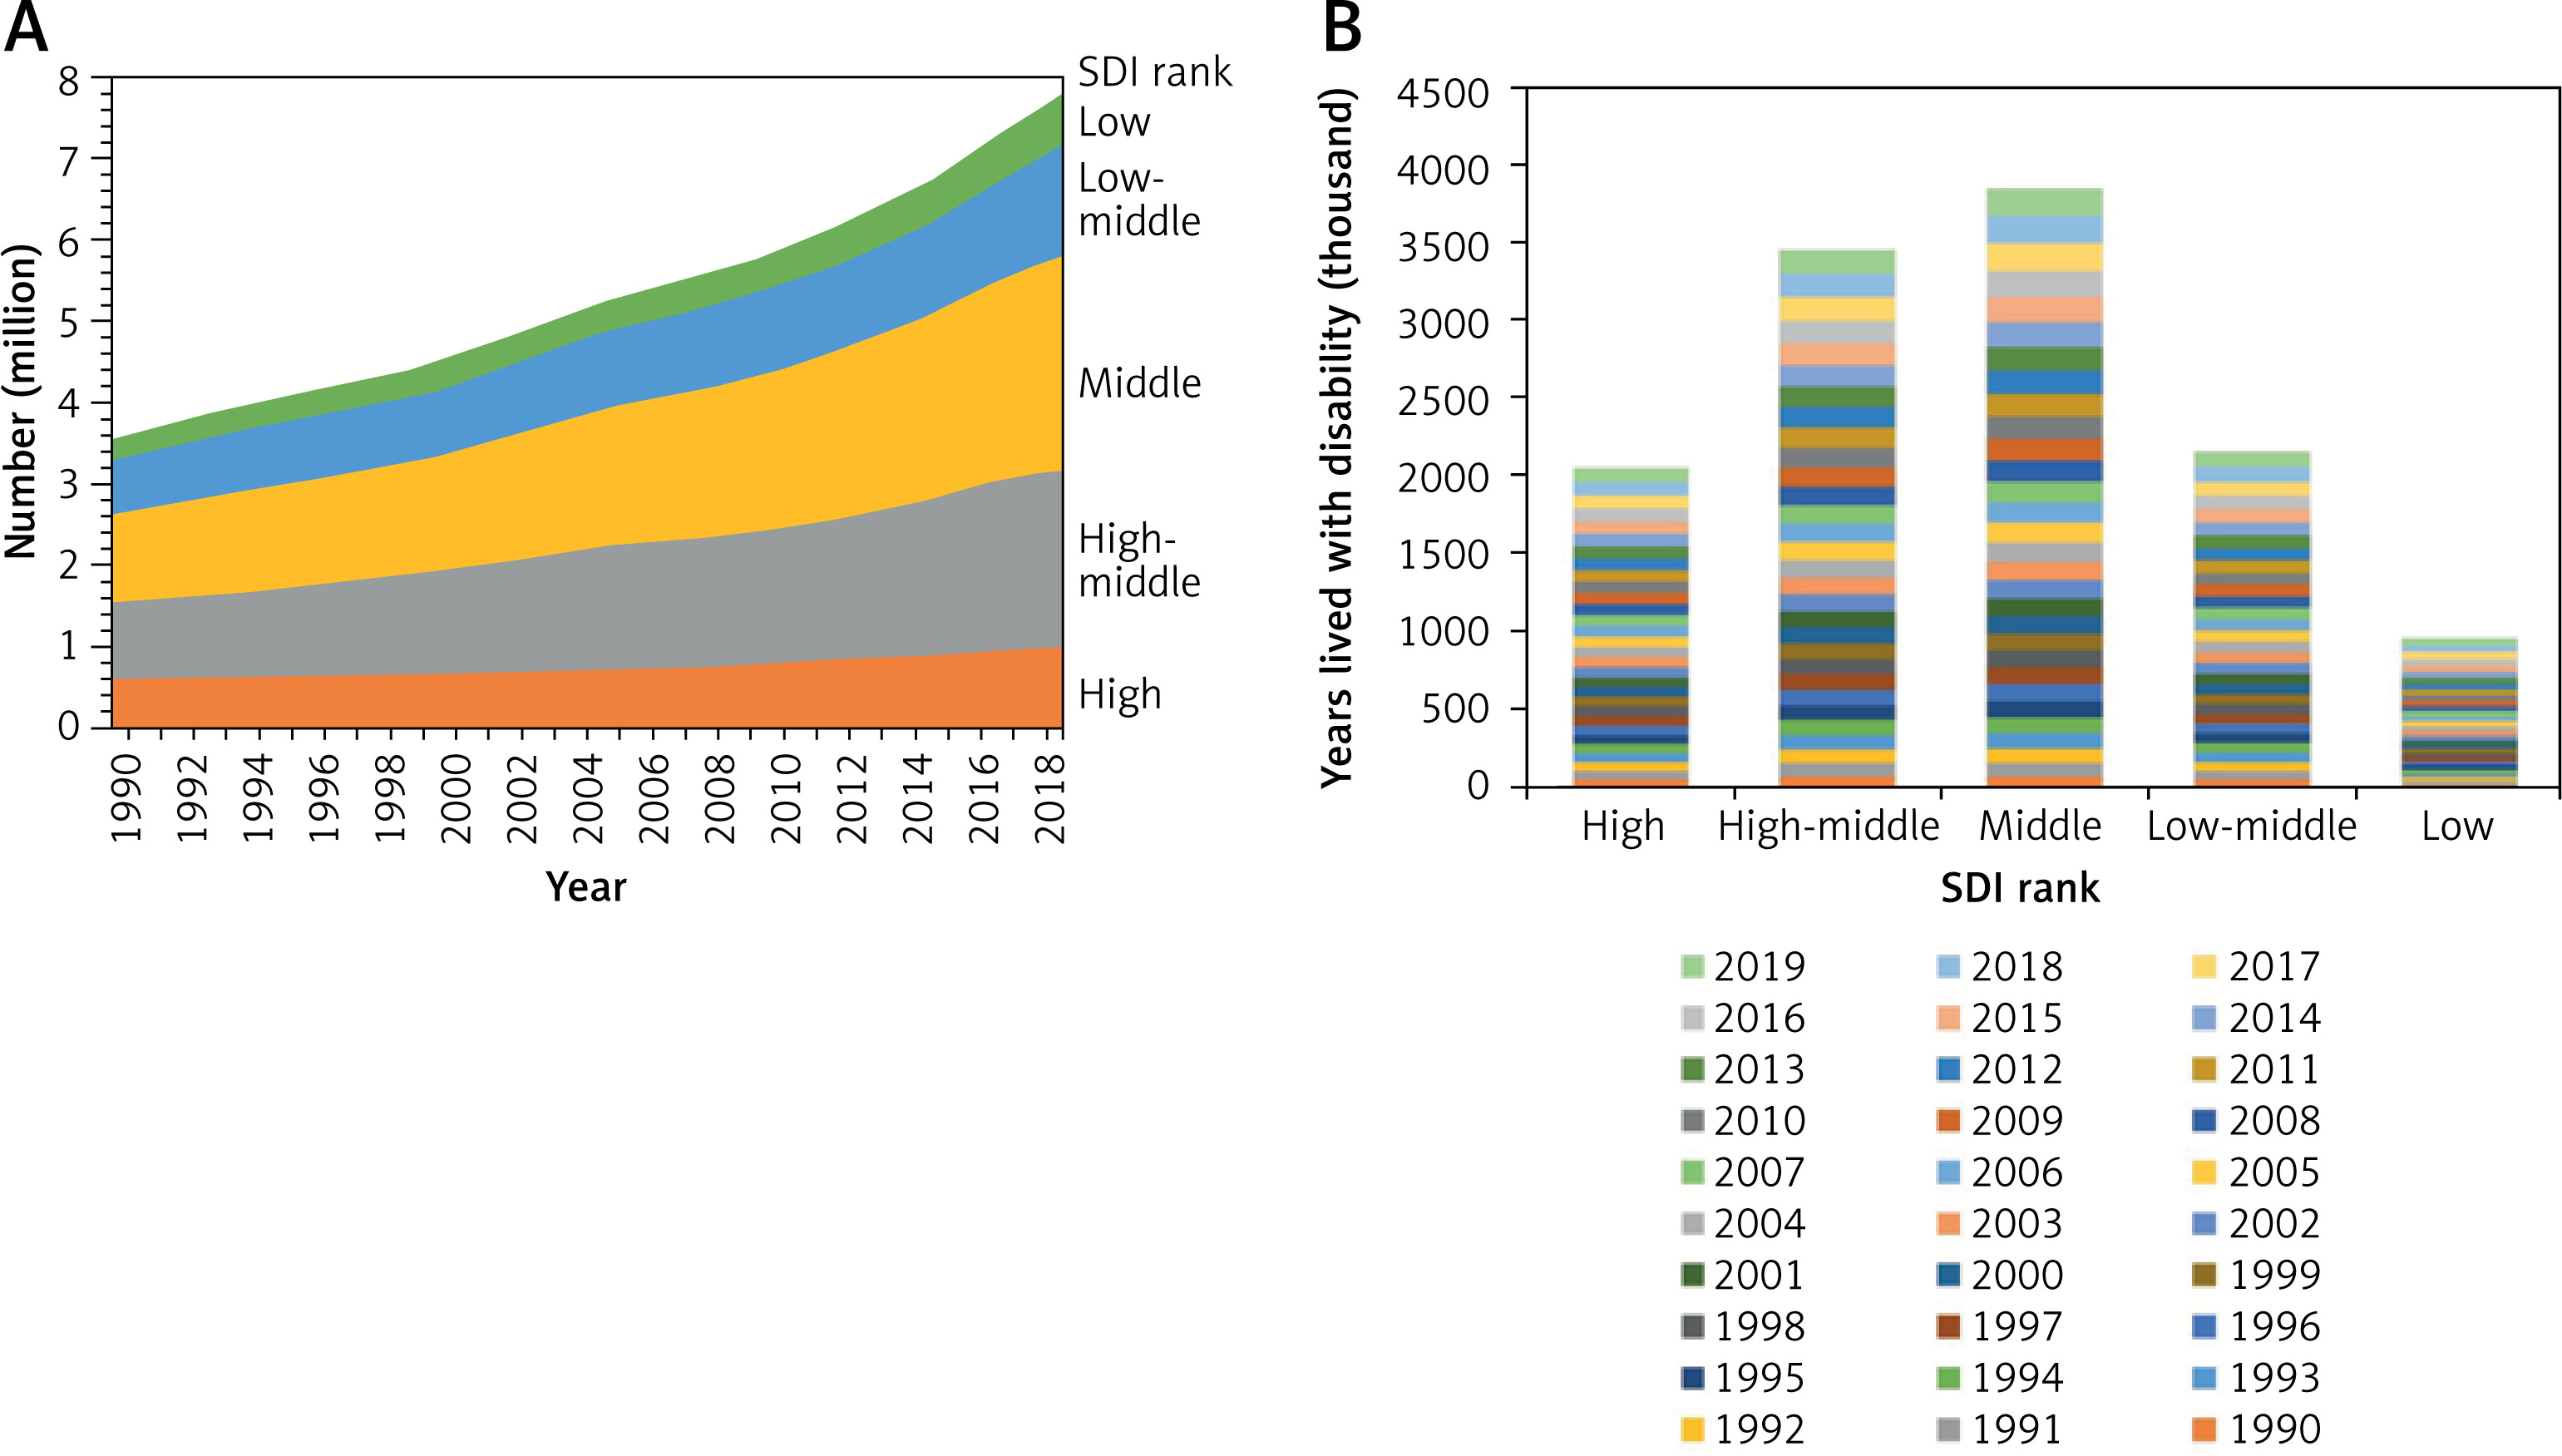
The global number of AMD patients increased from 3581.33 (95% UI: 3025.62 to 4188.84) thousand in 1990 to 7792.53 (95% UI: 6526.08 to 9159.39) thousand in 2019, and the YLDs increased from 296.77 (95% UI: 6526.08 to 9159.39) thousand years to 564.06 (95% UI: 392.93 to 789.19) thousand years. The prevalence and YLDs of all subgroups, including gender, region, and SDI, increased correspondingly. Female, high-middle SDI, and middle SDI accounted for a large proportion (Table I). Although the number of YLDs increased, the age-standardized rate of YLDs decreased in 30 years (Figure 1).
Table I
Global and regional age-related macular degeneration burdens in 1990 and 2019
Temporal changes of global AMD burdens and risk factors of tobacco
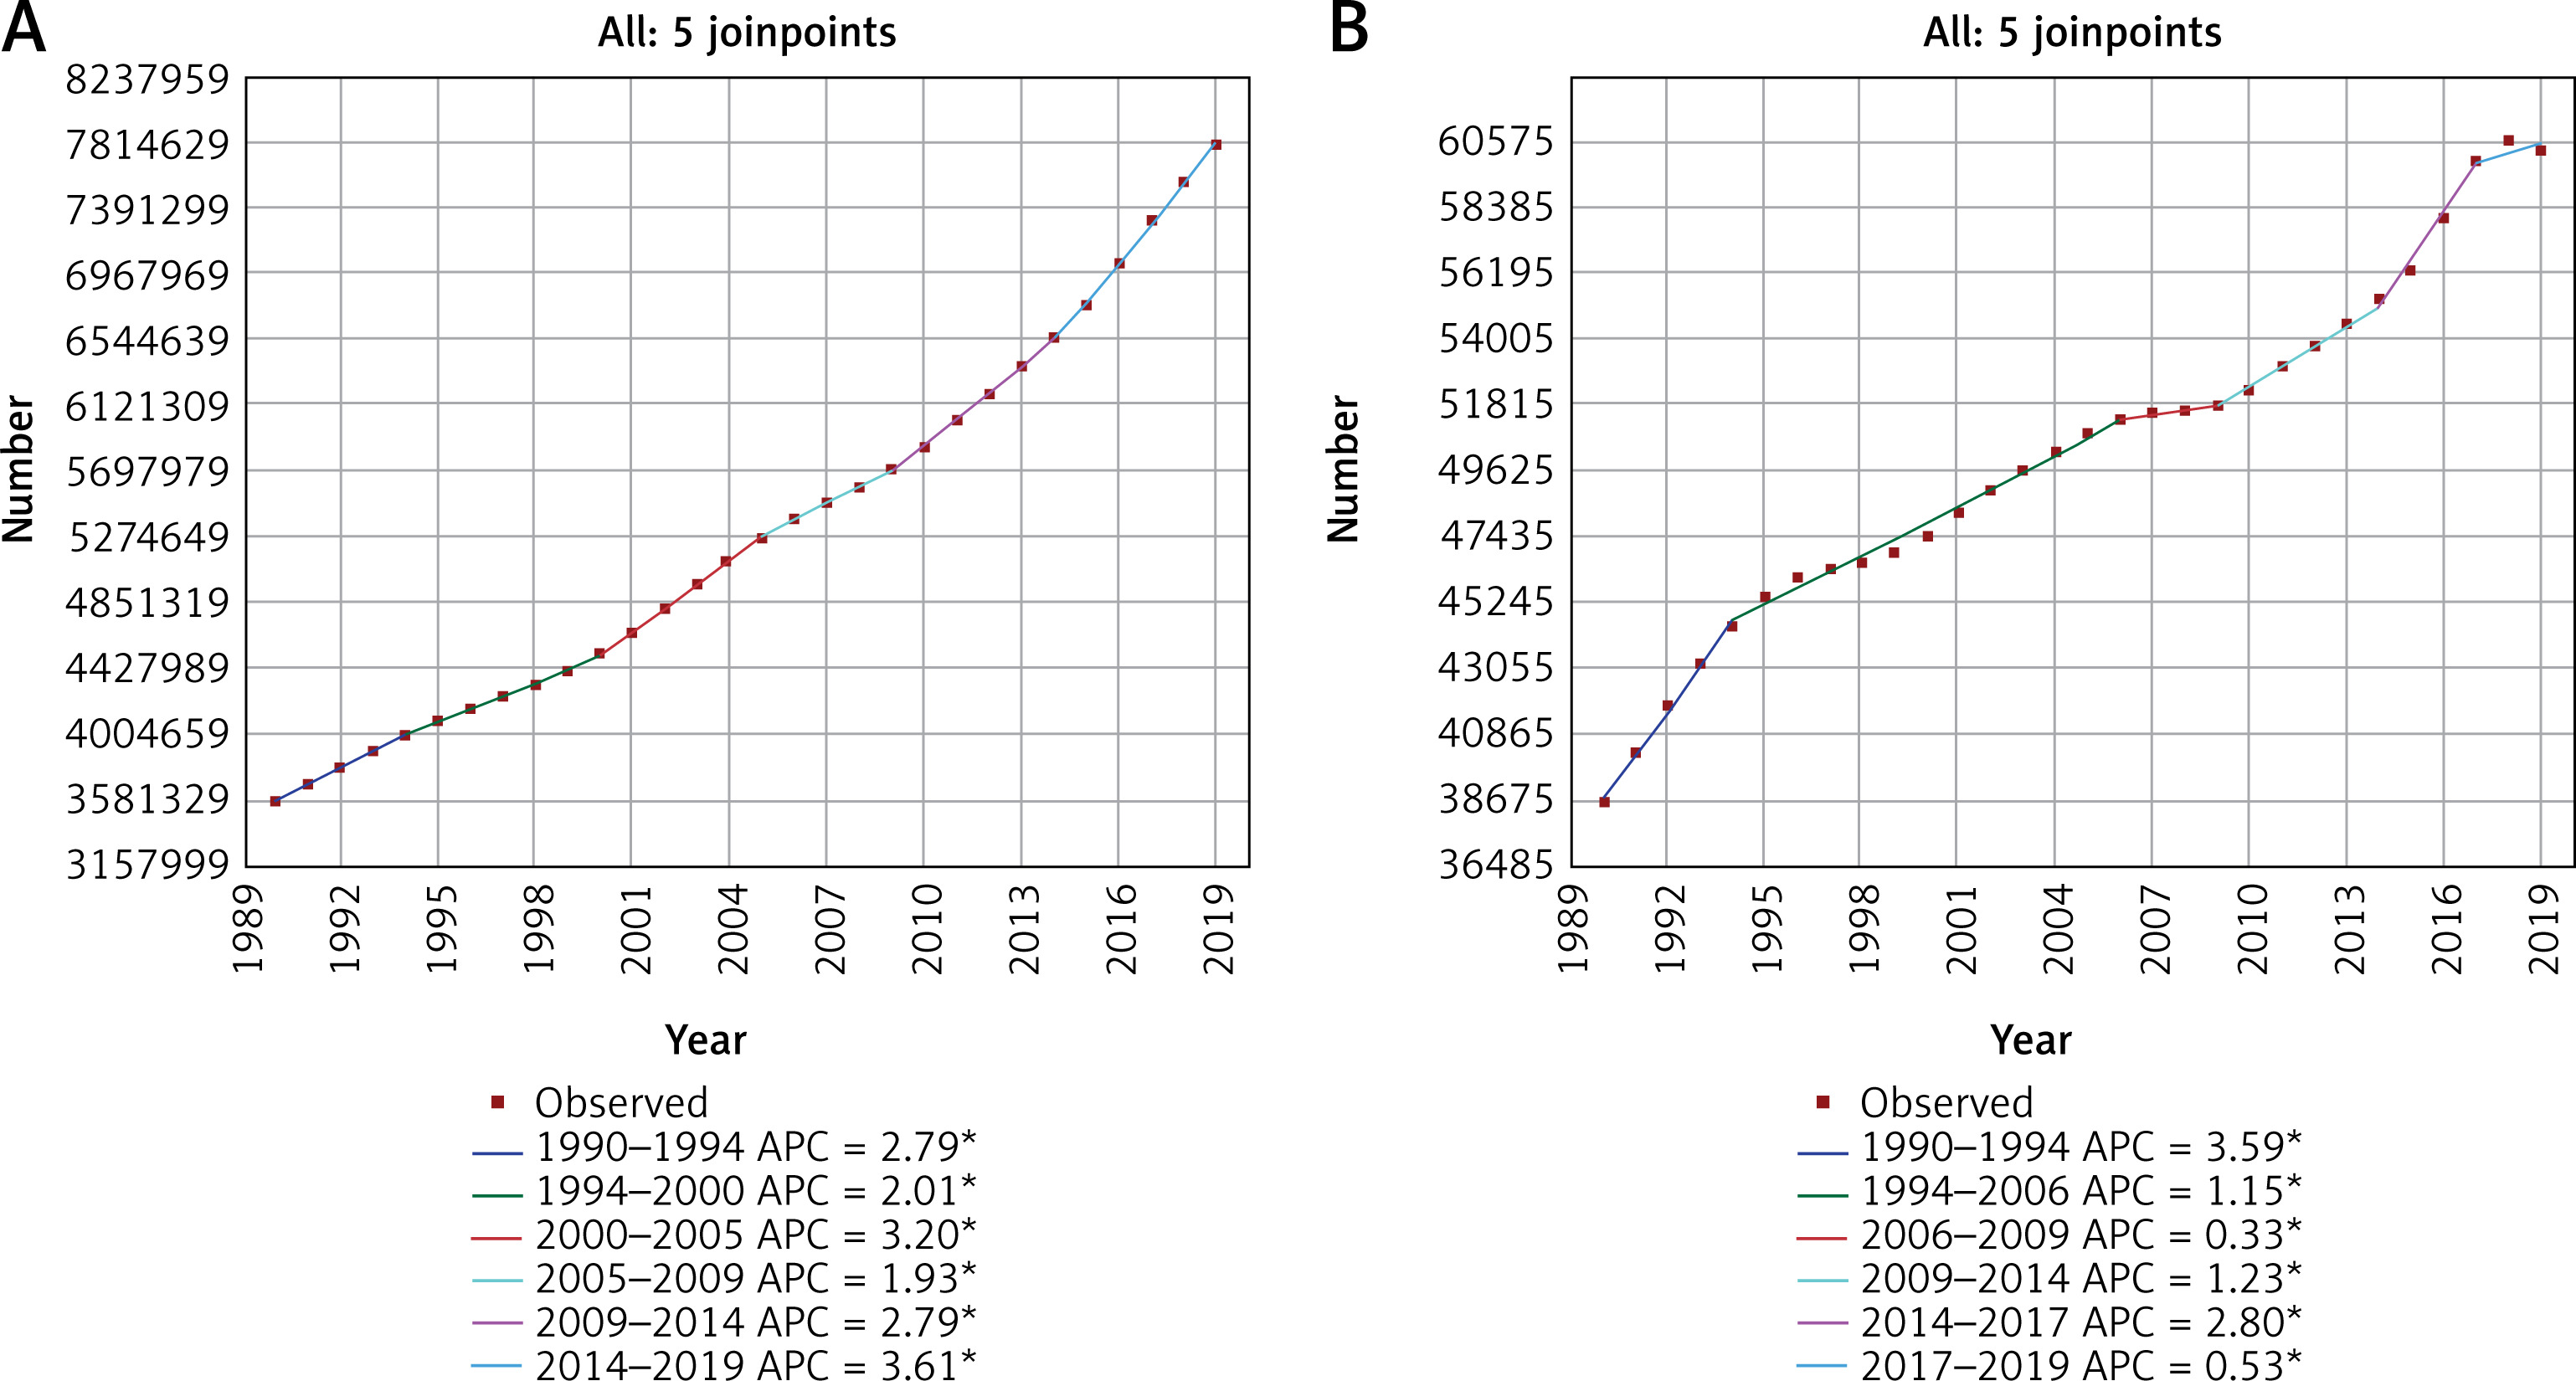
The prevalence of AMD has increased significantly since 1990. The epidemiological changes of AMD during past 30 years are presented in Figure 2. The most significant increase occurred between 2014 and 2019 (APC = 3.61%, p < 0.05), followed by 2000–2005 (APC = 3.20%, p < 0.05).
Figure 2
Temporal trends of global age-related macular degeneration burdens and the risk factor of tobacco for both genders combined for all ages. A – Temporal trends of global prevalence. B – Temporal trends of prevalence related to tobacco use. *Indicates that the annual percent change (APC) is significantly different from zero at the a = 0.05 level; final selected model: 5 Joinpoints
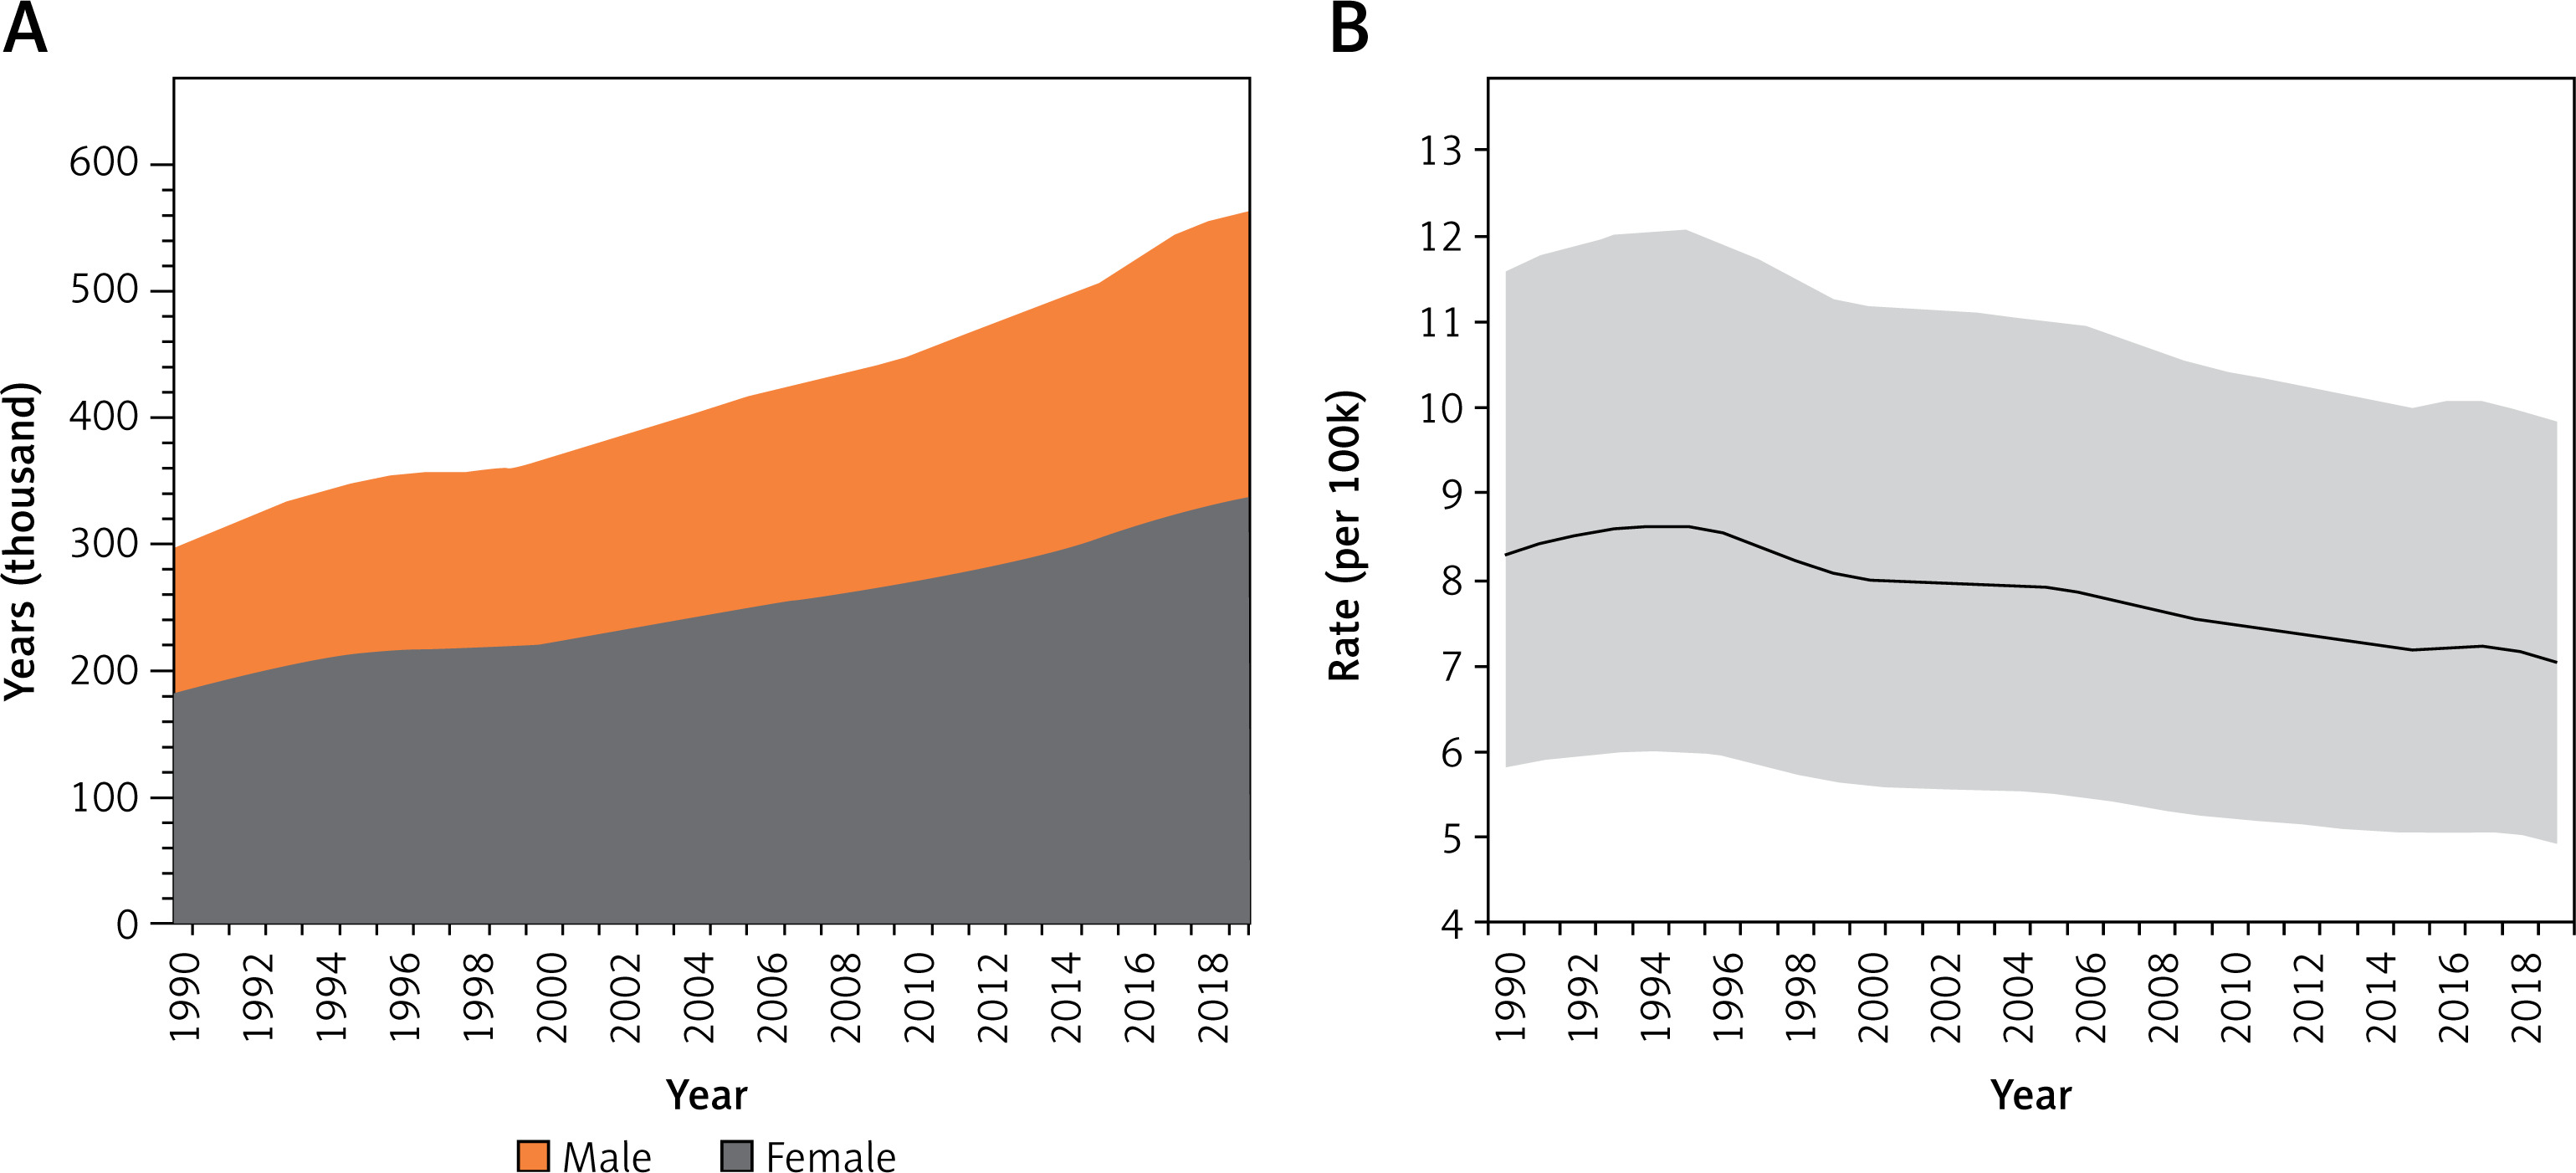
Searching the GBD 2019 database for risk factors associated with AMD indicated that tobacco was the only related factor. Figure 2 shows the YLDs changes in 30 years of AMD related to tobacco, and the most significant increase occurred between 1990 and 1994 (APC = 3.59%, p < 0.05), followed by 2014–2017 (APC = 2.80%, p < 0.05). The APCs from 2006 to 2009 and 2017 to 2019 were near zero.
Global gender- and age-specific AMD burden
In the subgroup analysis of gender, the total burden of AMD among females was higher than among males every year, and the proportion of females was stable at 57.77–59.20% (Figure 1).
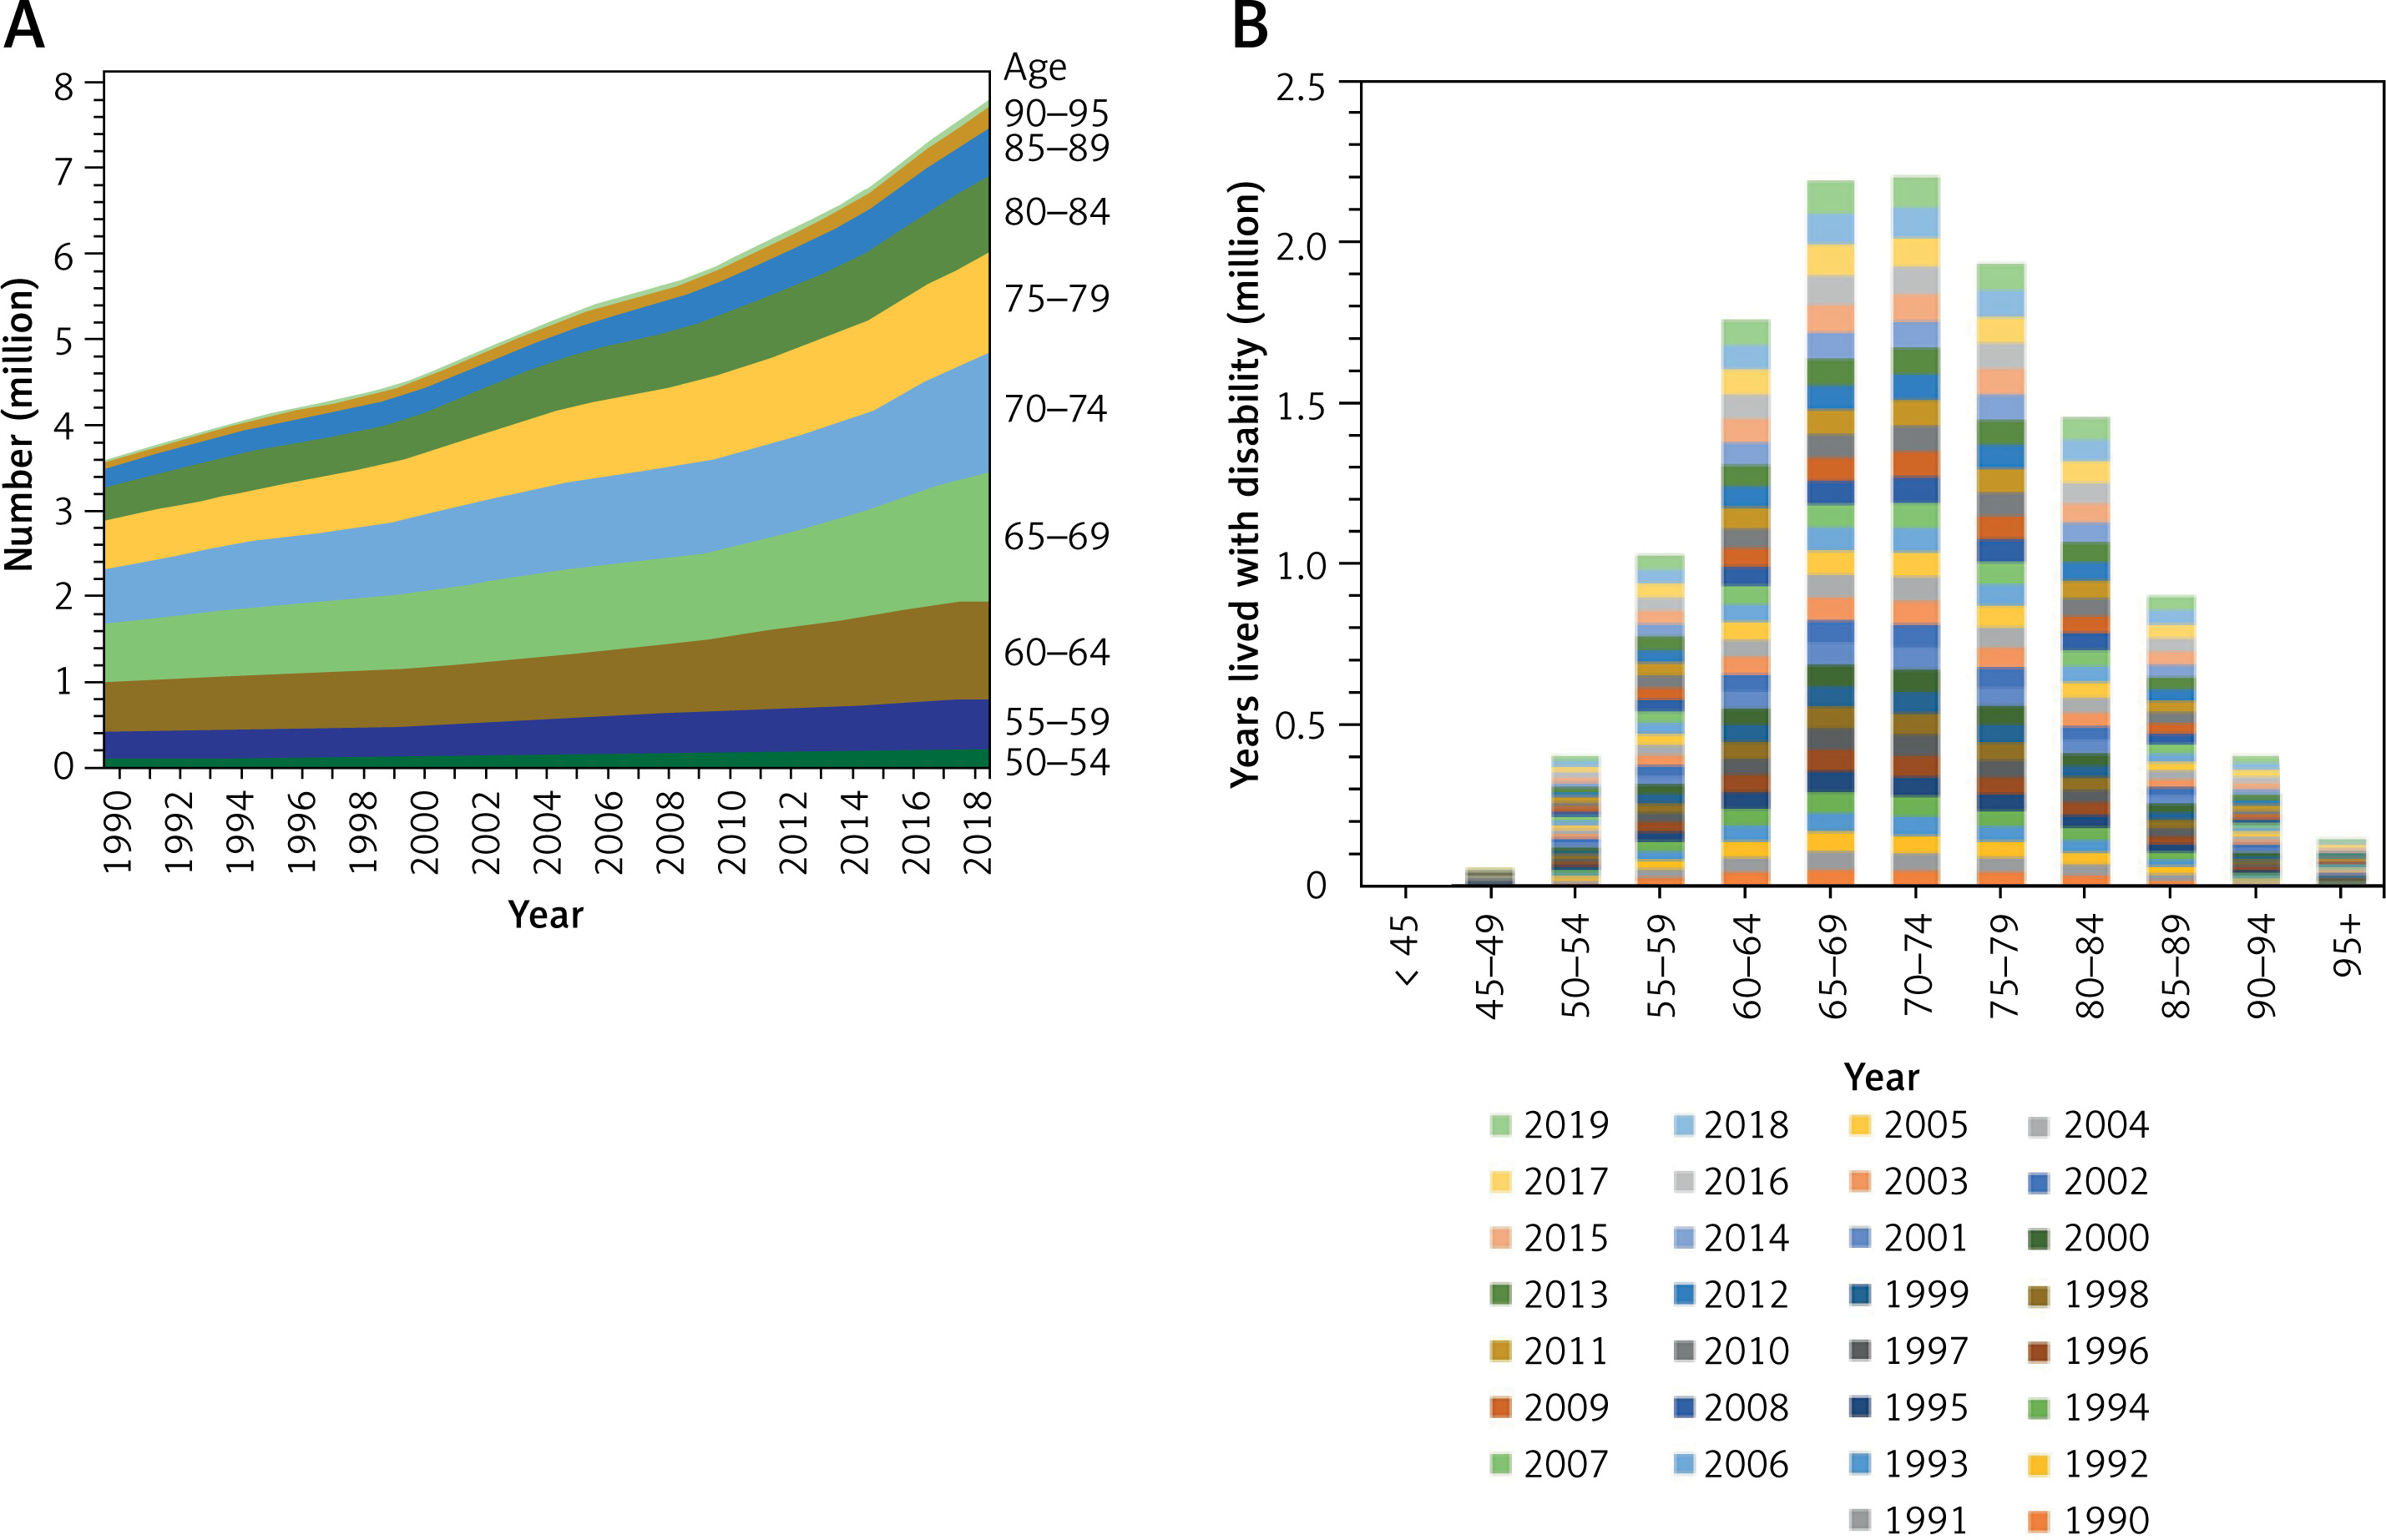
In the subgroup analysis of age, the YLDs and prevalence were highest among individuals in the 65–74 age group, and the data were similar for individuals in the 65–69 and 70–74 age groups (Figure 3). Among individuals younger than 45, the prevalence of AMD was close to 0.
Variation in AMD burden at the SDI and regional levels
The YLDs and prevalence of AMD varied greatly with SDI. As shown in Figure 4, the YLDs and prevalence were highest in high-middle SDI and middle SDI countries, which accounted for 56.09% of the total AMD patients worldwide in 1990 and 61.38% in 2019.
Figure 4
Age-related macular degeneration burdens in the different subgroups of the socio-demographic index from 1990 to 2019. A – Prevalence. B – Years lived with disability
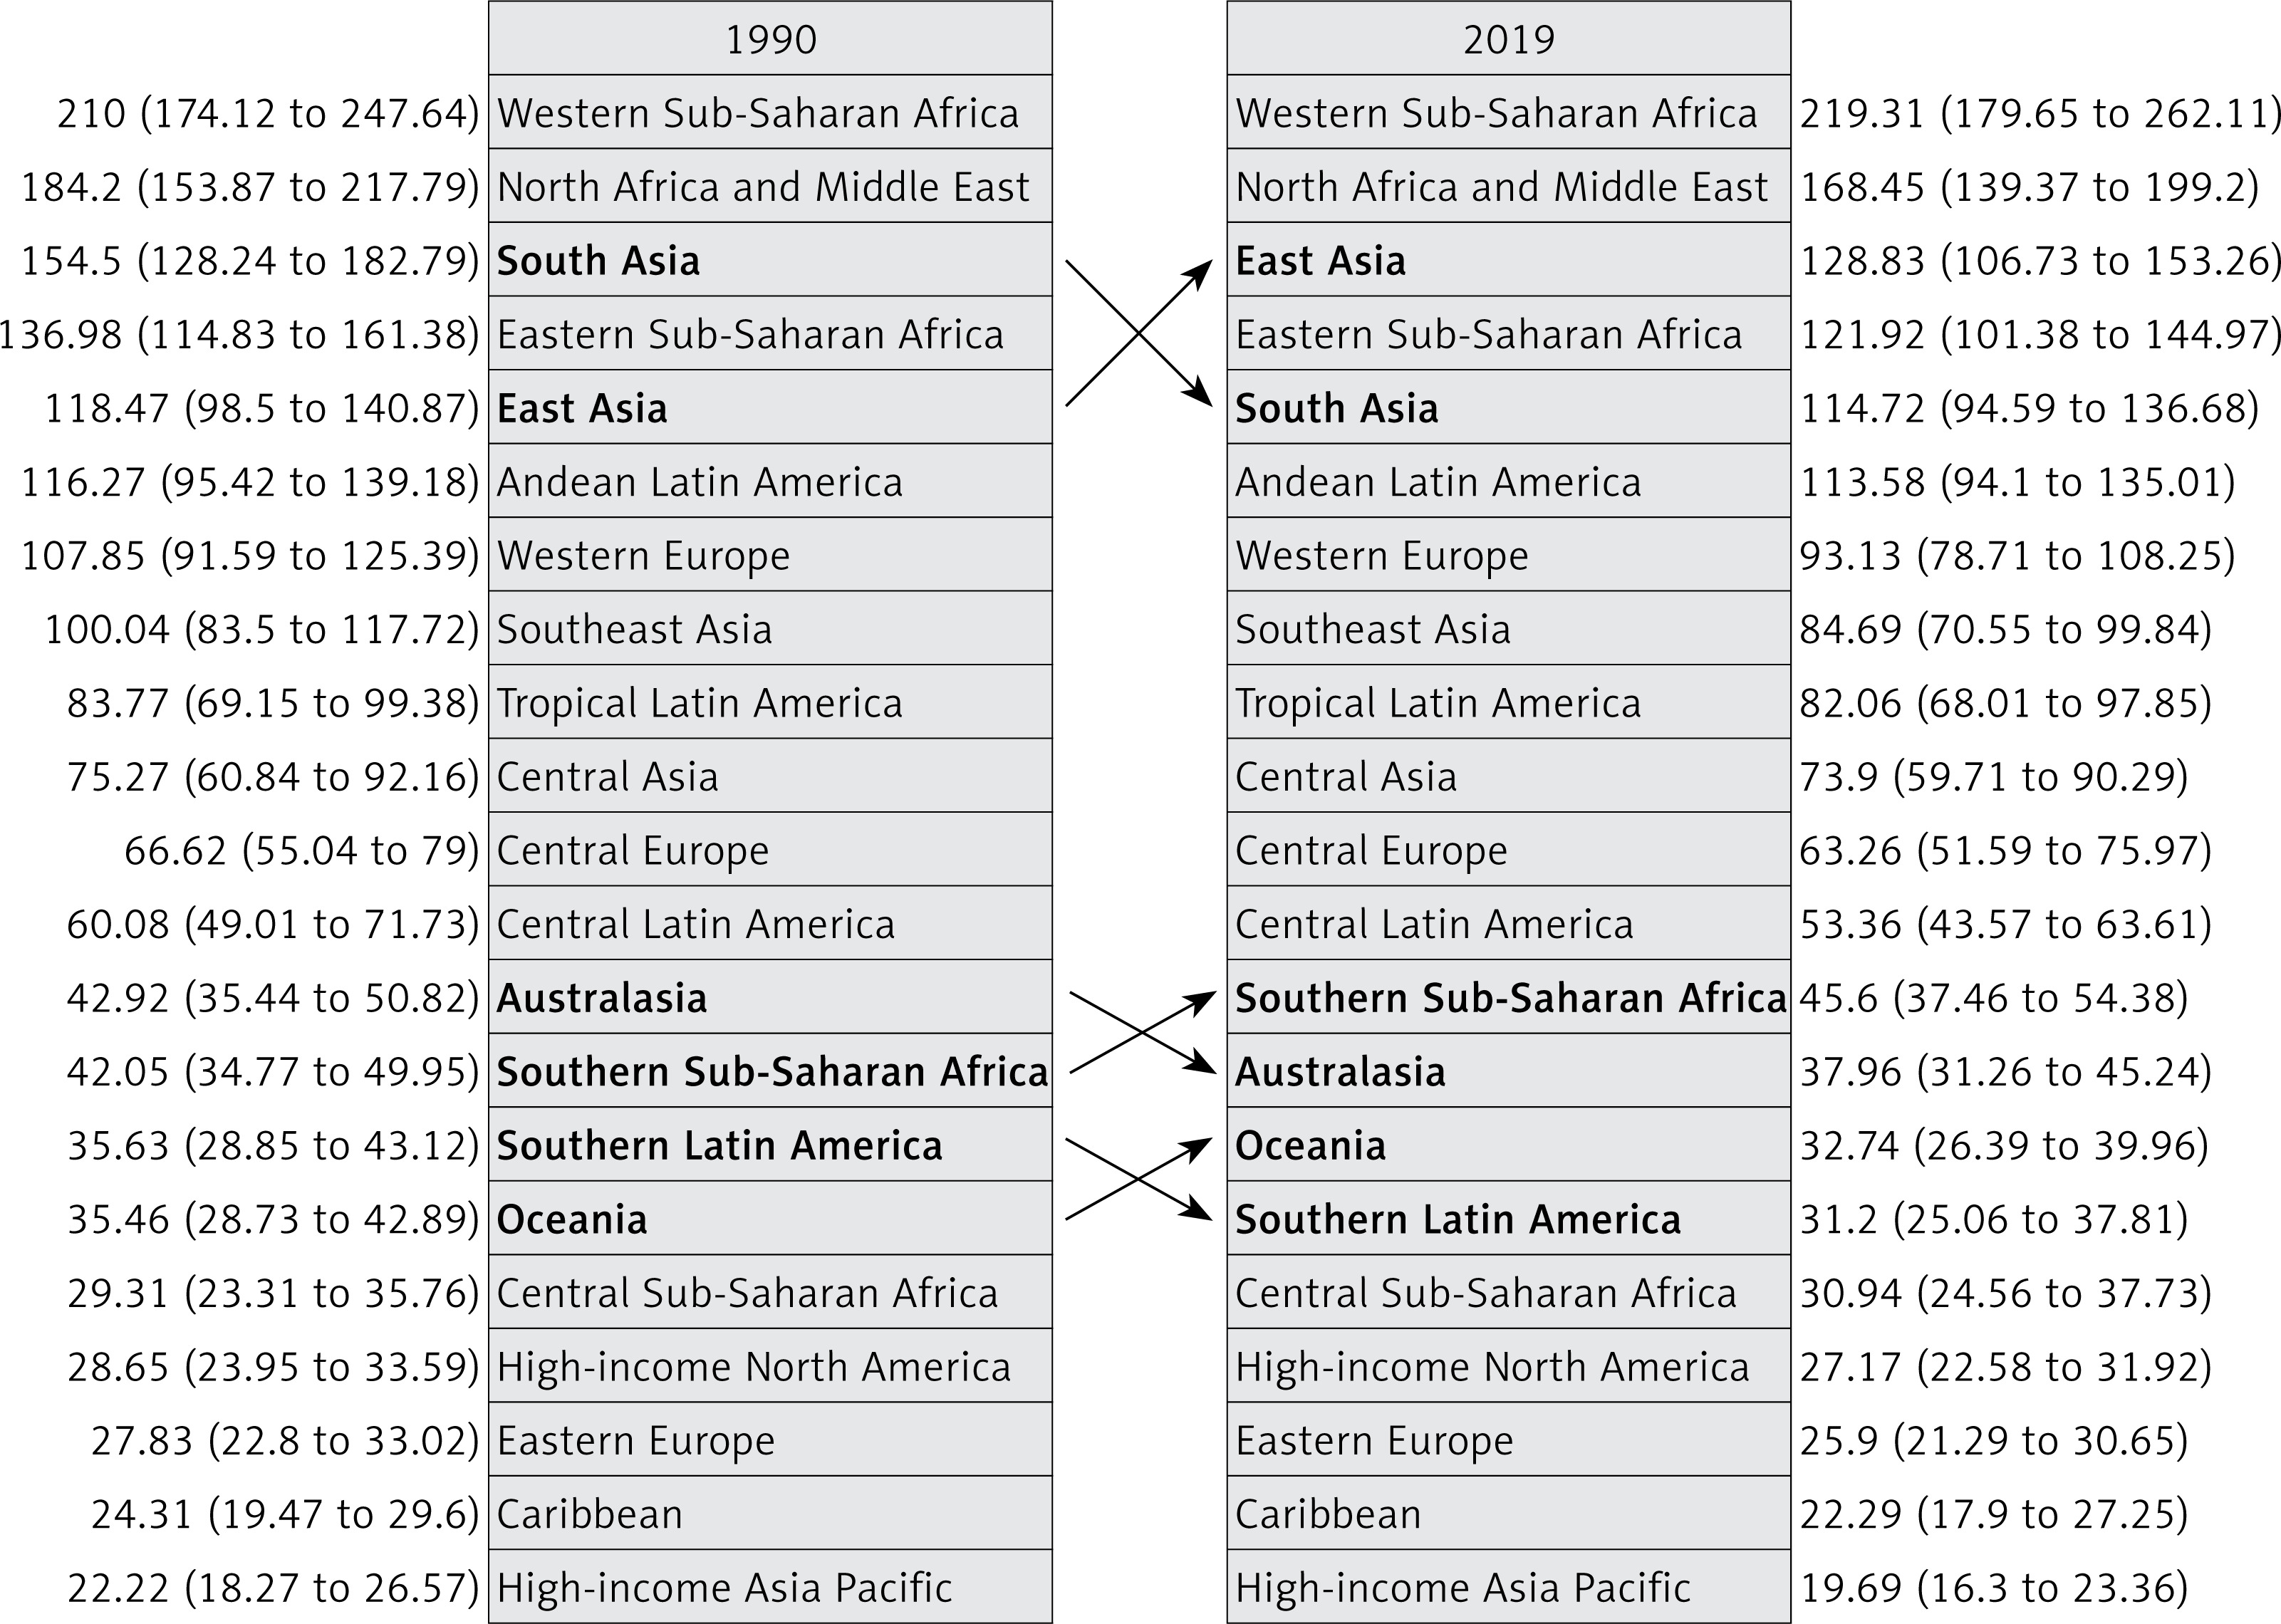
Regionally, East Asia had the highest number of AMD patients from 1990 to 2019, followed by South Asia. The two regions accounted for 45.96% of the total AMD worldwide in 1990 and 53.03% in 2019 (Table I). Among the countries in East and South Asia, mainland China (number 2,601 thousand) and India (number 1,100 thousand) accounted for 62.96% and 26.64% of the total AMD worldwide in 2019. Western Sub-Saharan Africa had the highest age-standardized rate of prevalence in 1990 and 2019. Moreover, the age-standardized rate of prevalence declined in all regions in 2019, except in Western Sub-Saharan Africa (Figure 5).
Predictions of AMD patient number and age-standardized rate
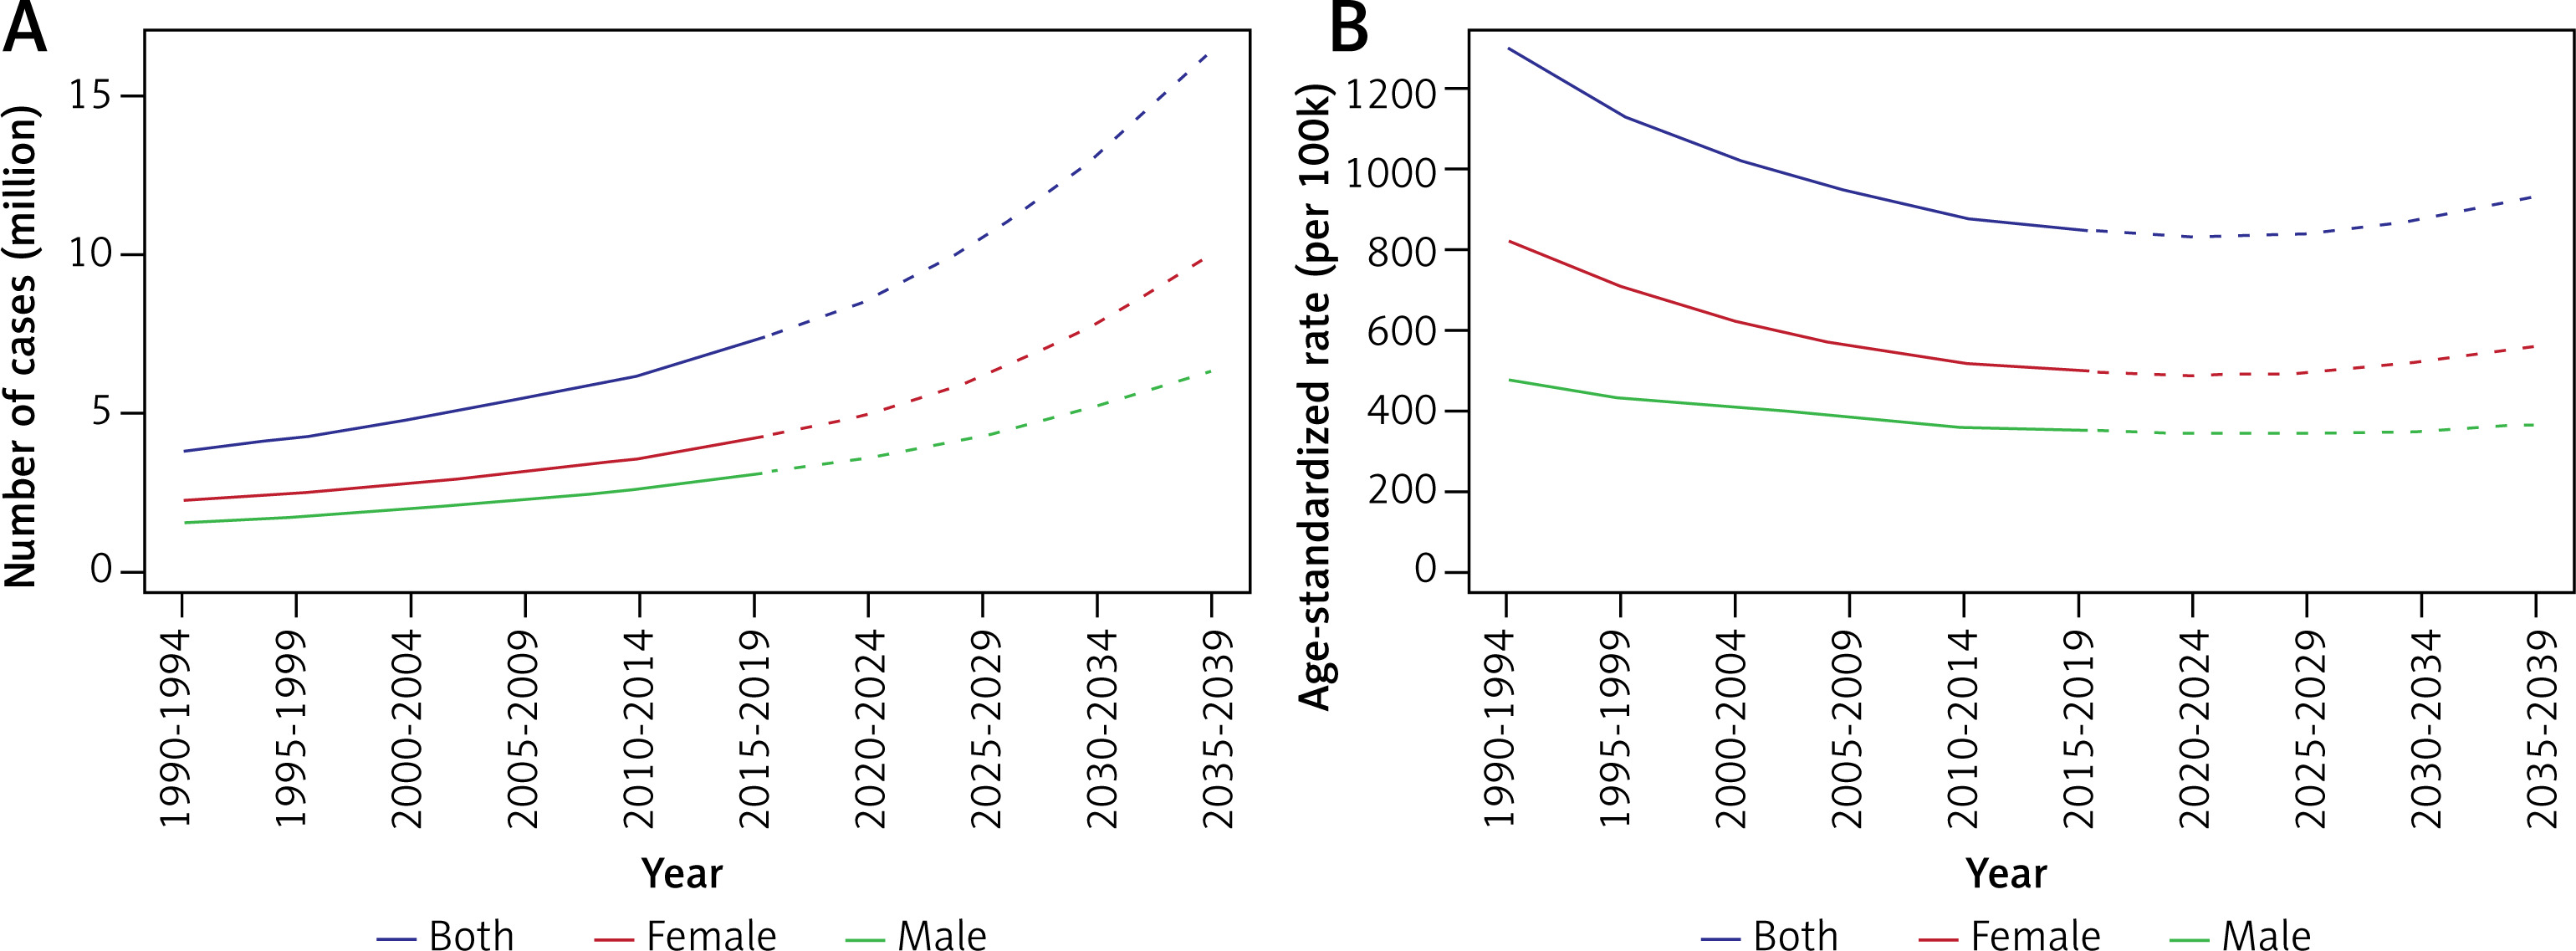
The number of AMD patients worldwide was predicted to increase for each sex. The total number of AMD cases was predicted to reach 16 377.82 thousand by 2039, which is 2.1 times the number of cases in 2019. The age-standardized rates of AMD prevalence were predicted to be relatively stable (928.85 per 100 k). The predicted number and rate were predicted to be substantially lower in males than in females (Figure 6).
Discussion
The present study summarized the temporal changes between 1990 and 2019, as well as the prevalence and YLDs, of AMD on a worldwide and regional scale. Over these 30 years, the burden of AMD continuously increased, with an increase of 4.21 million people for prevalence and 267.29 thousand years for YLDs. This dual growth may be attributed to the following two reasons: 1) an increase in global life expectancy and a shift in population age structure, which increases the number of patients and YLDs [11]; and 2) the significant increase in the global number of smokers [17]. Although the prevalence of AMD is increasing rapidly, it is still far lower than the 193 million AMD cases in 2020 predicted by a previous study [18]. Under the background of continuous prevalence growth, the burden of AMD varies among subgroups of age, sex, SDI, and region. Therefore, the precise patterns of differences and changes may contribute to the design of global targeted strategies for AMD prevention.
Previous studies on the disease burden of AMD have mainly focused on the DALYs, demonstrating a decreasing tendency among the age-standardized AMD burden [6, 19]. The leading causes of DALYs in middle-aged and older individuals are ischemic heart disease, stroke, diabetes, and chronic obstructive pulmonary disease [12]. For blindness and vision loss diseases, however, AMD accounted for only 2.5% in 2019 [16]. As a leading cause of central vision loss and blindness, assessing the disease burden of AMD by YLDs may be more useful in guiding public health practice. The present study found that during the past 30 years, both the overall YLDs and the YLDs increased in all subgroups, including gender, region, age (over 45), and SDI. The worldwide YLDs increased by 1.9 times, which indicated a considerable increase in the burden of central visual impairment and the consequent economic productivity loss and medical rehabilitation [8, 10].
In terms of AMD burden, the number of AMD patients and YLDs tended to be more prevalent in middle and high-middle SDI regions, as well as in East and South Asia. The SDI is a composite of per capita income, years of education, and fertility rates for women under 25 years of age [12]. In the GBD database, East Asia and West Asia are divided into mainland China, the Democratic People’s Republic of Korea, India, Nepal, Bhutan, Bangladesh, and Pakistan. Among these countries, China and India, with a vast population, account for the majority of the AMD population [19]. For the age-standardized rate of prevalence, Western Sub-Saharan Africa was highest during 1990 and 2019. Moreover, the rate of AMD in Western Sub-Saharan Africa continually increased, which may result in higher demands for controlling the growth of AMD. Regarding the age subgroups, the YLDs and prevalence were highest among individuals in the 65–74 age group. With the increase in the world population and the shifting of age structure, the number of AMD patients under 65 years old may also increase, which would increase the YLDs. Because YLDs is a factor that increases with age, the decrease in YLDs in the 74-year-old and older age groups was attributed to a declining number of elderly AMD patients. The YLDs were similar between the 65–69 and 70–74 age groups, reflecting the dynamic balance of a declining number of patients and an increasing AMD prevalence with age. In the present study, the total burden of AMD among females was higher than among males from 1990–2019, and it was predicted to be higher in females from 2020 to 2039. These findings suggested that females with AMD need more economic investment and medical attention.
The epidemiological changes in AMD prevalence were also analyzed in the present study. The prevalence of AMD has increased significantly since 1990. The most significant increase occurred between 2014 and 2019. The increase in the prevalence of AMD and the increase in life expectancy are attributed to the popularity of optical coherence tomography equipment and its high sensitivity to detect AMD [20]. The increasing prevalence rate suggests that the economic and medical demands caused by AMD will continue to increase and may accelerate in the future. Current smokers (both male and female) have a higher risk of AMD compared to former smokers and those who have never smoked [21–23]. In the present study, the most significant increase in YLDs related to tobacco occurred between 1990 and 1994, whereas there was no significant increase in 2006–2009 or 2017–2019, which may be due to the significant decrease in smoking rates of females and males aged 15 and above in recent years [17]. Despite significant progress in reducing tobacco use in all regions and all stages of development, population growth has led to a significant increase in the total number of smokers [17]. Accelerating the reduction of the smoking rate may bring health benefits to citizens. In the GBD database, tobacco use is a risk factor for AMD, and other risk factors may be involved and should be explored, such as genetic variants, ultraviolet radiation, gout, obesity, and diabetes [24–29].
Along with the aging population and the increasing world population, understanding the epidemiological changes of AMD burden is essential for public health policy planning and healthcare investment. With the development of artificial intelligence, the early detection rate of AMD has also increased [30]. NORDPRED age-period-cohort analysis can be used to predict the case number and rate of esophageal cancer [31]. The present study predicted an increase in the number of future global AMD patients and showed a relatively stable age-standardized rate by NORDPRED age-period-cohort analysis. As predicted in the present study, the number of AMD patients will double in 2039 compared to 2019, indicating the need for increased attention to AMD patients, as well as the innovation of treatment programs, economic investment, and policymaking.
To the best of our knowledge, the present study is the first systematic analysis of spatiotemporal changes in AMD burden. Interpretation of the present results should consider that biases in fitting unavailable data were inevitable when assessing the global burden of disease in the GBD Study 2019.
In conclusion, the present study demonstrated an increasing AMD burden in the past 30 years, and it predicted that this trend will continue during the next 20 years. Disease burdens were higher among females, the elderly, and individuals in high-middle and middle SDI regions. The present findings will contribute to healthcare investment and policymaking.