Introduction
Spinal fractures (SF), also referred to as vertebral fractures, are profoundly disabling [1], posing a grave threat to both quality of life and life expectancy, while also imposing a substantial economic burden on healthcare systems and affected individuals [2–4]. In the United States, for instance, the annual economic burden of SF is estimated to exceed $9.7 billion [5, 6]. In 2019, the global prevalence of SF was reported to reach 5.16 million cases, accompanied by 0.53 million years lived with disability (YLDs) [7]. High-energy traumatic injuries are the predominant cause of SF in younger individuals [8, 9], whereas low-energy fractures are more prevalent in older populations and are widely regarded as a characteristic manifestation of osteoporotic fractures [10]. Despite significant advances in prevention, diagnosis, and treatment, the global burden of SF remains substantial, with notable disparities evident across various regions and socioeconomic strata.
Previous studies have examined the global epidemiology of SF using data from the Global Burden of Disease Study (GBD). The GBD 2019 analysis demonstrated a significant reduction in age-standardized rates (ASR) of SF incidence, prevalence, and YLDs from 1990 to 2019 [7]. However, the total number of incidences, prevalences, and YLDs increased over this period, primarily driven by population growth and aging. The analysis also revealed persistent disparities across geographic regions and Socio-Demographic Index (SDI) quintiles. Despite these insights, a comprehensive evaluation of the global burden of SF and projections of future SF trends using the latest GBD 2021 data remain lacking.
To bridge this knowledge gap, the present study was undertaken to assess trends in the prevalence, incidence, and YLDs attributable to SF from 1990 to 2021 at global, regional, and national levels, and to project these metrics for the next three decades. Our analyses were stratified by sex, age, and SDI to identify the populations most impacted by SF and to guide the development of targeted prevention and treatment strategies.
Material and methods
Data source
This study leveraged the most recent epidemiological data from the GBD 2021 study and employed a well-established, standardized methodology in alignment with the Guidelines for Accurate and Transparent Reporting of Health Estimates (GATHER) to evaluate the burden of SF [11, 12]. The definition of SF within the GBD study was based on the International Classification of Diseases (ICD) codes (ICD-9 and ICD-10). Data sources for SF in this study encompassed hospital records, emergency department reports, insurance claims, surveys, and vital registration systems from multiple countries [13]. The SF data were meticulously processed, and access to the GBD data is publicly available [13].
Data estimation and modeling
The GBD study employed advanced modeling techniques to process raw data. During this process, the incidence and prevalence of diseases were estimated using the DisMod-MR 2.1 tool (a Bayesian meta-regression for disease modeling). This Bayesian geospatial software facilitates a thorough analysis of disease parameters, epidemiological relationships, and geospatial data [11]. To calculate the YLDs due to SF, long-term and short-term prevalence rates were multiplied by disability weights to derive the YLDs [7, 14, 15]. Detailed methodologies for these calculations are outlined in previous publications [7].
Incidence, prevalence, YLDs
This study presents the incidence, prevalence, and YLDs attributable to SF from 1990 to 2021, along with temporal trends disaggregated by region, sex, age, and SDI. SF incidence is defined as the number of new cases of SF arising from a specific cause within a defined population over a designated time period. SF prevalence refers to the proportion of the population affected by SF during a particular timeframe and geographic location. YLDs quantify the number of years an individual endures either short- or long-term disability, serving as a metric for the burden of SF-related disability.
Sociodemographic Index
In this study, countries and regions worldwide are categorized into five SDI groups: low, low-medium, medium, medium-high, and high. This classification facilitates an analysis of the relationship between socio-economic development and SF, as the SDI quantifies a country’s or region’s development based on fertility rates, educational attainment, and per capita income. Specifically, the SDI ranges from 0 to 1, with higher values reflecting greater levels of socioeconomic development [11].
Statistical analysis
This study used age-standardized prevalence rate (ASPR), age-standardized incidence rate (ASIR), and age-standardized years lived with disability (ASYR), along with 95% uncertainty interval (UI), to assess the epidemiology and burden of SF. Temporal trends in ASIR, ASPR, and ASYR for SF were examined using the estimated annual percentage changes (EAPCs). The 95% UI was derived through the Bayesian-based model DisMod-MR 2.1 during the estimation process. Linear regression modeling was applied to calculate the 95% confidence intervals (95% CI) for the EAPC [16]. The equation used was: Y = α + βX + e, where Y represents the natural logarithm of the age-standardized rate (ASR), X signifies the calendar year, α is the intercept term, β denotes the slope, and e is the error term. The EAPC is calculated as 100 × [exp(β) – 1], reflecting the annual percentage change. If the EAPC value and its lower limit of the 95% CI are both above zero, the ASR was considered to exhibit an upward trend; otherwise, the trend was deemed downward.
Prediction of the global burden of SF disease
Using time series data, the autoregressive integrated moving average (ARIMA) model and the exponential smoothing (ES) model were employed to forecast the burden of SF from 2020 to 2050. The ARIMA model is a statistical technique that analyzes and predicts time series data by incorporating autoregressive, integrated, and moving average components [17]. The ES model is a forecasting method for time series that relies on a weighted average approach [18], predicting future values by computing an exponentially weighted average of past data points. All analyses and visualizations were conducted using the World Health Organization’s Health Equity Assessment Toolkit and R statistical computing software (version 4.4.1).
Results
1990–2021 global SF disease burden
In 2021, the global burden of SF remained substantial, with a total of 3.4 million cases (95% UI: 2.958–3.926 million), representing a 58.0% increase compared to 1990. Despite the notable rise in the absolute number of cases, the ASPR declined from 81.55 cases per 100,000 individuals (95% UI: 71.55–93.04) in 1990 to 65.19 cases per 100,000 individuals (95% UI: 56.89–75.28) in 2021. The EAPC for the ASPR was –0.32 (95% CI: –0.53 to –0.12) (Table I, Figure 1). The global ASIR decreased from 115.75 per 100,000 (95% UI:91.28–145.92) in 1990 to 92.75 per 100,000 (95% UI: 72.12–119.99) in 2021. The total number of incidents rose from 5.856 million (95% UI: 4.615–7.403 million) in 1990 to 7.497 million (95% UI: 5.835–9.737 million) in 2021, reflecting a 28.0% increase. Throughout the study period, the EAPC for the ASIR was –0.64 (95% CI: –0.7 to –0.59), signifying a consistent decline in the incidence rate of SF (Table 1, Figure 1). The global YLDs due to SF in 2021 amounted to 0.550 million (95% UI: 0.367–0.757 million), with an ASYR of 6.62 per 100,000 (95% UI: 4.43–9.2), and an EAPC of –0.37 (95% CI: –0.56 to –0.18) (Table 1, Figure 1).
Table I
Global and regional trends in SF burden: prevalence (1990–2021)
Regional SF disease burden
The global burden of SF reveals substantial regional disparities, which are closely linked to the SDI. The ASPR exhibited pronounced regional differences, with high SDI regions reporting the highest prevalence at 131.65 per 100,000 individuals (95% UI: 114.84–149.24), in contrast to the lowest prevalence in low SDI regions, which stood at 33.49 per 100,000 individuals (95% UI: 27.67–41.42) (Table 1, Figure 2). The most significant reductions in prevalence occurred in high-middle SDI regions, where the EAPC was –1.01 (95% CI: –1.09 to –0.92). In these regions, the ASPR declined from 83.07 per 100,000 (95% UI: 72.53–95.12) in 1990 to 64.26 per 100,000 (95% UI: 55.80–74.54) in 2021, suggesting the success of preventive and management strategies (Table 1, Figure 2). Conversely, low SDI regions exhibited the least substantial reductions, with an EAPC of –0.04 (95% CI: –0.15 to 0.06), indicating that the burden of SF remains persistent in these areas (Table 1, Figure 2). The ASIR further accentuates these regional contrasts. High SDI regions reported the highest ASIR, at 157.17 per 100,000 individuals (95% UI: 119.04–207.76), compared to 63.4 per 100,000 individuals (95% UI: 49.74–80.95) in low SDI regions (Table 1, Figure 2). This stark disparity underscores the inequities in access to primary healthcare and subsequent outcomes. These regional variations are further illustrated by the ASYR, with high SDI regions bearing the heaviest burden, reflected by an ASYR of 13.36 per 100,000 individuals (95% UI: 8.95–18.51), while low SDI regions exhibited the lowest burden at 3.44 per 100,000 individuals (95% UI: 2.39–4.87) (Table 1, Figure 2). Collectively, these findings underscore the intricate interplay between sociodemographic factors and SF outcomes, indicating that while substantial progress has been achieved in reducing the prevalence and impact of SF in high SDI regions, considerable challenges remain in low SDI areas.
Our findings indicate that the Australasia regions bear the greatest burden of SF prevalence globally (Table I, Supplementary Figure S1). Specifically, Australasia reported the highest ASPR at 182.32 per 100,000 individuals (95% UI: 158.11–208.92), closely followed by high-income regions of North America, which exhibited an ASPR of 157.60 per 100,000 individuals (95% UI: 138.08–178.17) (Table 1, Figure 3 A). The North American regions, in turn, also demonstrated a notably high ASPR of 157.57 per 100,000 individuals (95% UI: 138.05–178.13), securing the third position among the studied regions. The elevated ASPR in Australasia, high-income North America, and North American regions may be attributed to inadequate regulation and enforcement of preventive measures.
Figure 3
The global disease burden of SF for both sexes in 204 countries and territories. A – Number of incident cases, prevalent cases, and years lived with disability B – Rates of incidence, prevalence, and years lived with disability C – Changes in the number of incident cases, prevalent cases, and years lived with disability D – EAPC of incidence, prevalence, and years lived with disability
Our analysis underscores the urgent need for attention to the incidence of SF in Europe (Table 1, Supplementary Figure S1). The findings reveal that Western Europe and Eastern Europe are among the regions with the highest ASIR globally. Specifically, Western Europe reported an ASIR of 177.62 per 100,000 individuals (95% UI: 128.55–243.91), while Eastern Europe exhibited an ASIR of 168.73 per 100,000 individuals (95% UI: 130.9–221.27). These rates ranked second and third, respectively, only surpassed by the Australasia regions, which had an ASIR of 232.18 per 100,000 individuals (95% UI: 174.33–303.58). In stark contrast, Commonwealth Low-Income regions had the lowest ASIR at 38.33 per 100,000 individuals (95% UI: 30.09–49.26) (Table 1, Figure 3). Furthermore, temporal trends from 1990 to 2021 reveal divergent patterns within Europe. Western Europe experienced the smallest decline in ASIR, with an EAPC of –0.53 (95% CI: –0.73 to –0.33), whereas Eastern Europe demonstrated the most pronounced decrease, with an EAPC of –1.02 (95% CI: –1.25 to –0.8) (Table I). These contrasting trends highlight the complex and region-specific dynamics of SF incidence within Europe, underscoring the necessity for targeted interventions and further research to address these disparities.
From 1990 to 2021, the ASYR due to SF increased the most in the Caribbean (EAPC: 1.15, 95% CI: 0.82–1.48) and decreased the most in Southern Africa (EAPC: –1.16, 95% CI: –1.55 to –0.76) (Table 1, Figure 3, Supplementary Figure S1). The high ASYR in the Caribbean may be attributed to factors such as armed conflict.
National SF disease burden
The geographic distribution heat map (Figure 3) reveals substantial variation in the disease burden of SF across countries in 2021. The five countries with the highest incidence were China (1,194,465 cases), India (1,141,146 cases), the United States of America (679,567 cases), the Russian Federation (248,916 cases), and Brazil (243,009 cases) (Figure 3 A). When adjusted for age and population, the top five countries with the highest ASIR per 100,000 individuals were New Zealand (252.30 per 100,000), Finland (241.64 per 100,000), Belgium (233.36 per 100,000), Australia (227.85 per 100,000), and France (217.73 per 100,000) (Figure 3 B).
In terms of prevalence, the top five countries with the highest burden of SF were the United States of America (851,924 cases), China (717,078 cases), India (553,007 cases), Japan (265,088 cases), and Germany (252,146 cases) (Figure 3 A). After adjusting for age and population, the five countries with the highest ASPR per 100,000 individuals were Andorra (240.56 per 100,000), Belgium (210.26 per 100,000), Finland (206.82 per 100,000), Greenland (192.89 per 100,000), and New Zealand (190.38 per 100,000) (Figure 3 B).
Regarding YLDs due to SF, the top five countries were the United States of America (83,891 cases), China (74,079 cases), India (56,954 cases), Japan (26,446 cases), and Germany (24,987 cases) (Figure 3 A). After adjusting for age and population, the countries with the highest ASYR per 100,000 individuals were Andorra (24.33 per 100,000), Belgium (21.34 per 100,000), Finland (21.06 per 100,000), Greenland (19.48 per 100,000), and New Zealand (19.48 per 100,000) (Figure 3 B).
Afghanistan exhibited the most dramatic increase in incident cases, with an astounding 628% rise, while Eritrea recorded a 76% reduction (Figure 3 C). Similarly, the United Arab Emirates saw the greatest increase in prevalent cases, with a 578% increase, whereas Eritrea experienced a 48% decline (Figure 3 C). Furthermore, the United Arab Emirates also had the most significant rise in the number of YLDs, with a 575% increase, while Eritrea experienced a 51% decrease (Figure 3 C).
When adjusted for age and population, the countries with the highest EAPC in incidence were the Syrian Arab Republic (5.24 per 100,000), Yemen (2.38 per 100,000), Libya (1.84 per 100,000), the Central African Republic (1.71 per 100,000), and Afghanistan (1.63 per 100,000) (Figure 3 D). Similarly, the countries with the highest EAPC in prevalence were the Syrian Arab Republic (5.28 per 100,000), Haiti (2.08 per 100,000), Libya (1.93 per 100,000), Yemen (1.68 per 100,000), and Bhutan (1.65 per 100,000) (Figure 3 D). Finally, the countries with the highest EAPC in YLDs were the Syrian Arab Republic (5.27 per 100,000), Haiti (1.94 per 100,000), Libya (1.88 per 100,000), Yemen (1.70 per 100,000), and Bhutan (1.56 per 100,000) (Figure 3 D).
Global age and sex distribution of SF disease burden
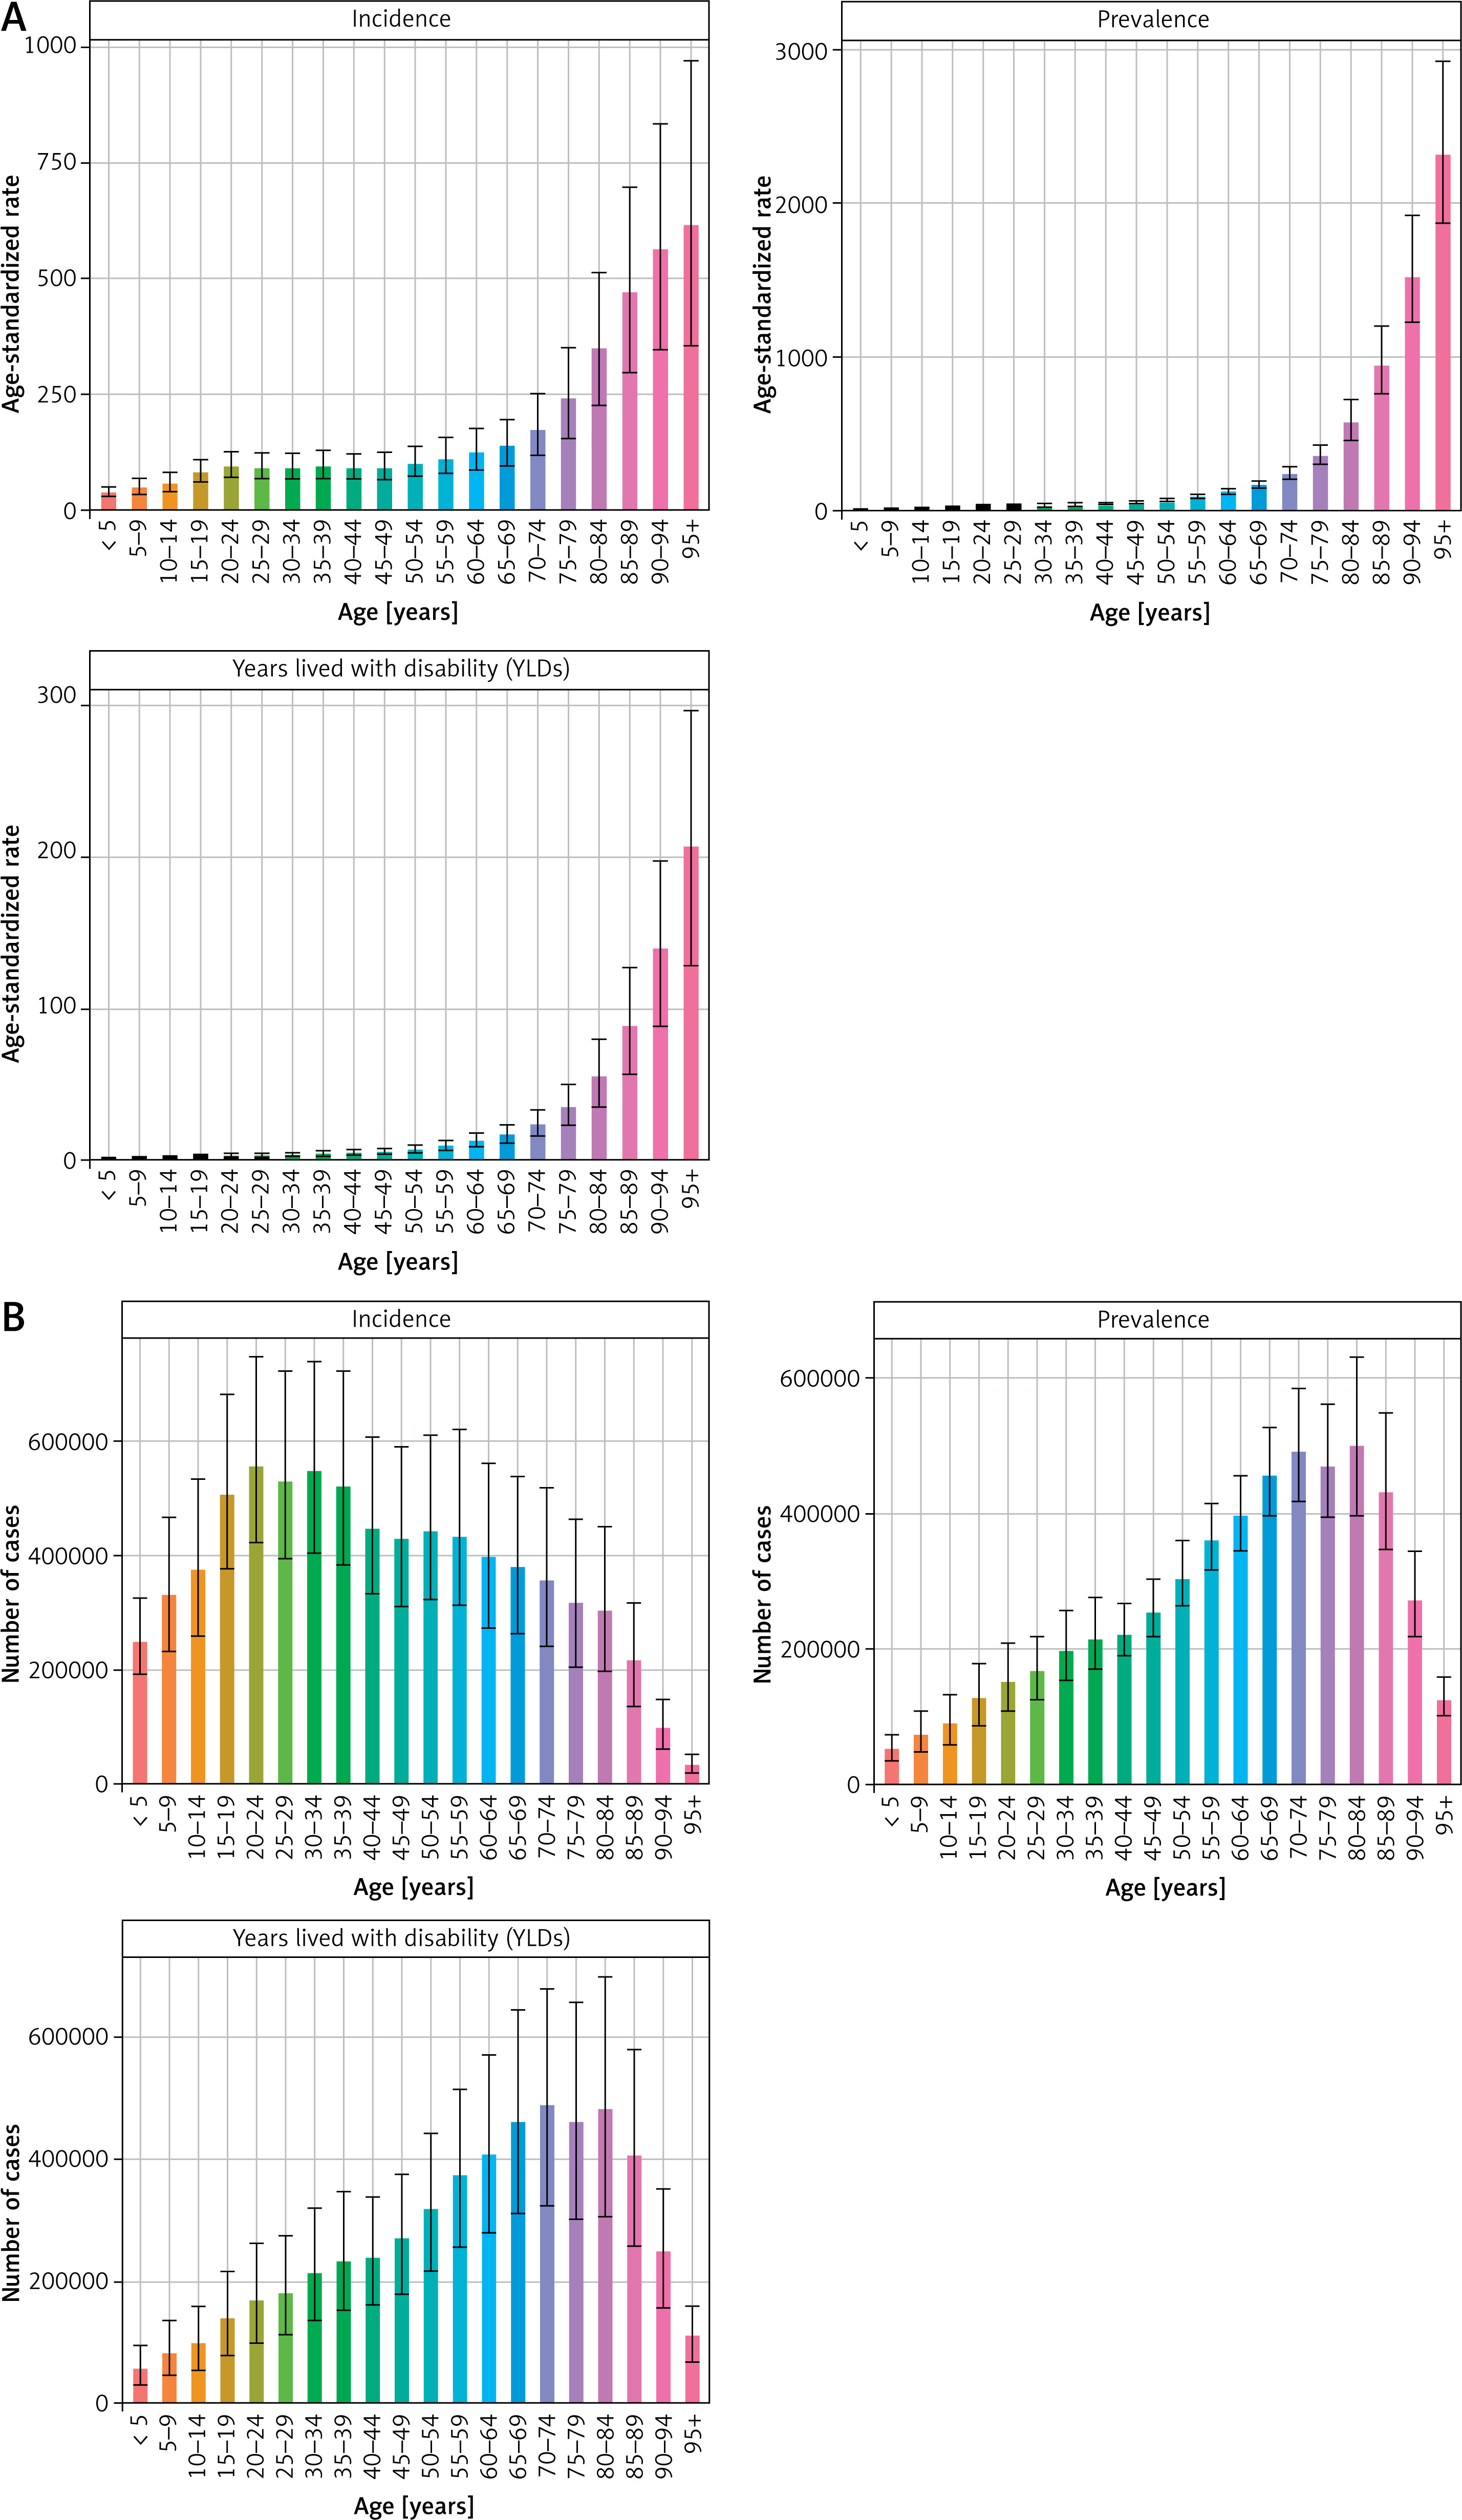
The global ASPR, ASIR, and ASYR for SF consistently rose with advancing age (Figure 4 A). Notably, the number of incident cases of SF rose markedly with age, peaking between the ages of 20 and 39 years before declining after the age of 60 (Figure 4 B). In contrast, the number of prevalent cases of SF increased gradually with age, reaching a peak between 65 and 84 years before declining thereafter (Figure 4 B). The number of YLDs exhibited a similar upward trend with age, peaking between 65 and 84 years before subsequently decreasing (Figure 4 B).
Figure 4
Numbers of SF patients with incidence, prevalence, and YLDs and their ASR in each age group (per 5-year). A – Rates of incidence, prevalence, and years lived with disability. B – Numbers of incident cases, prevalent cases, and years lived with disability
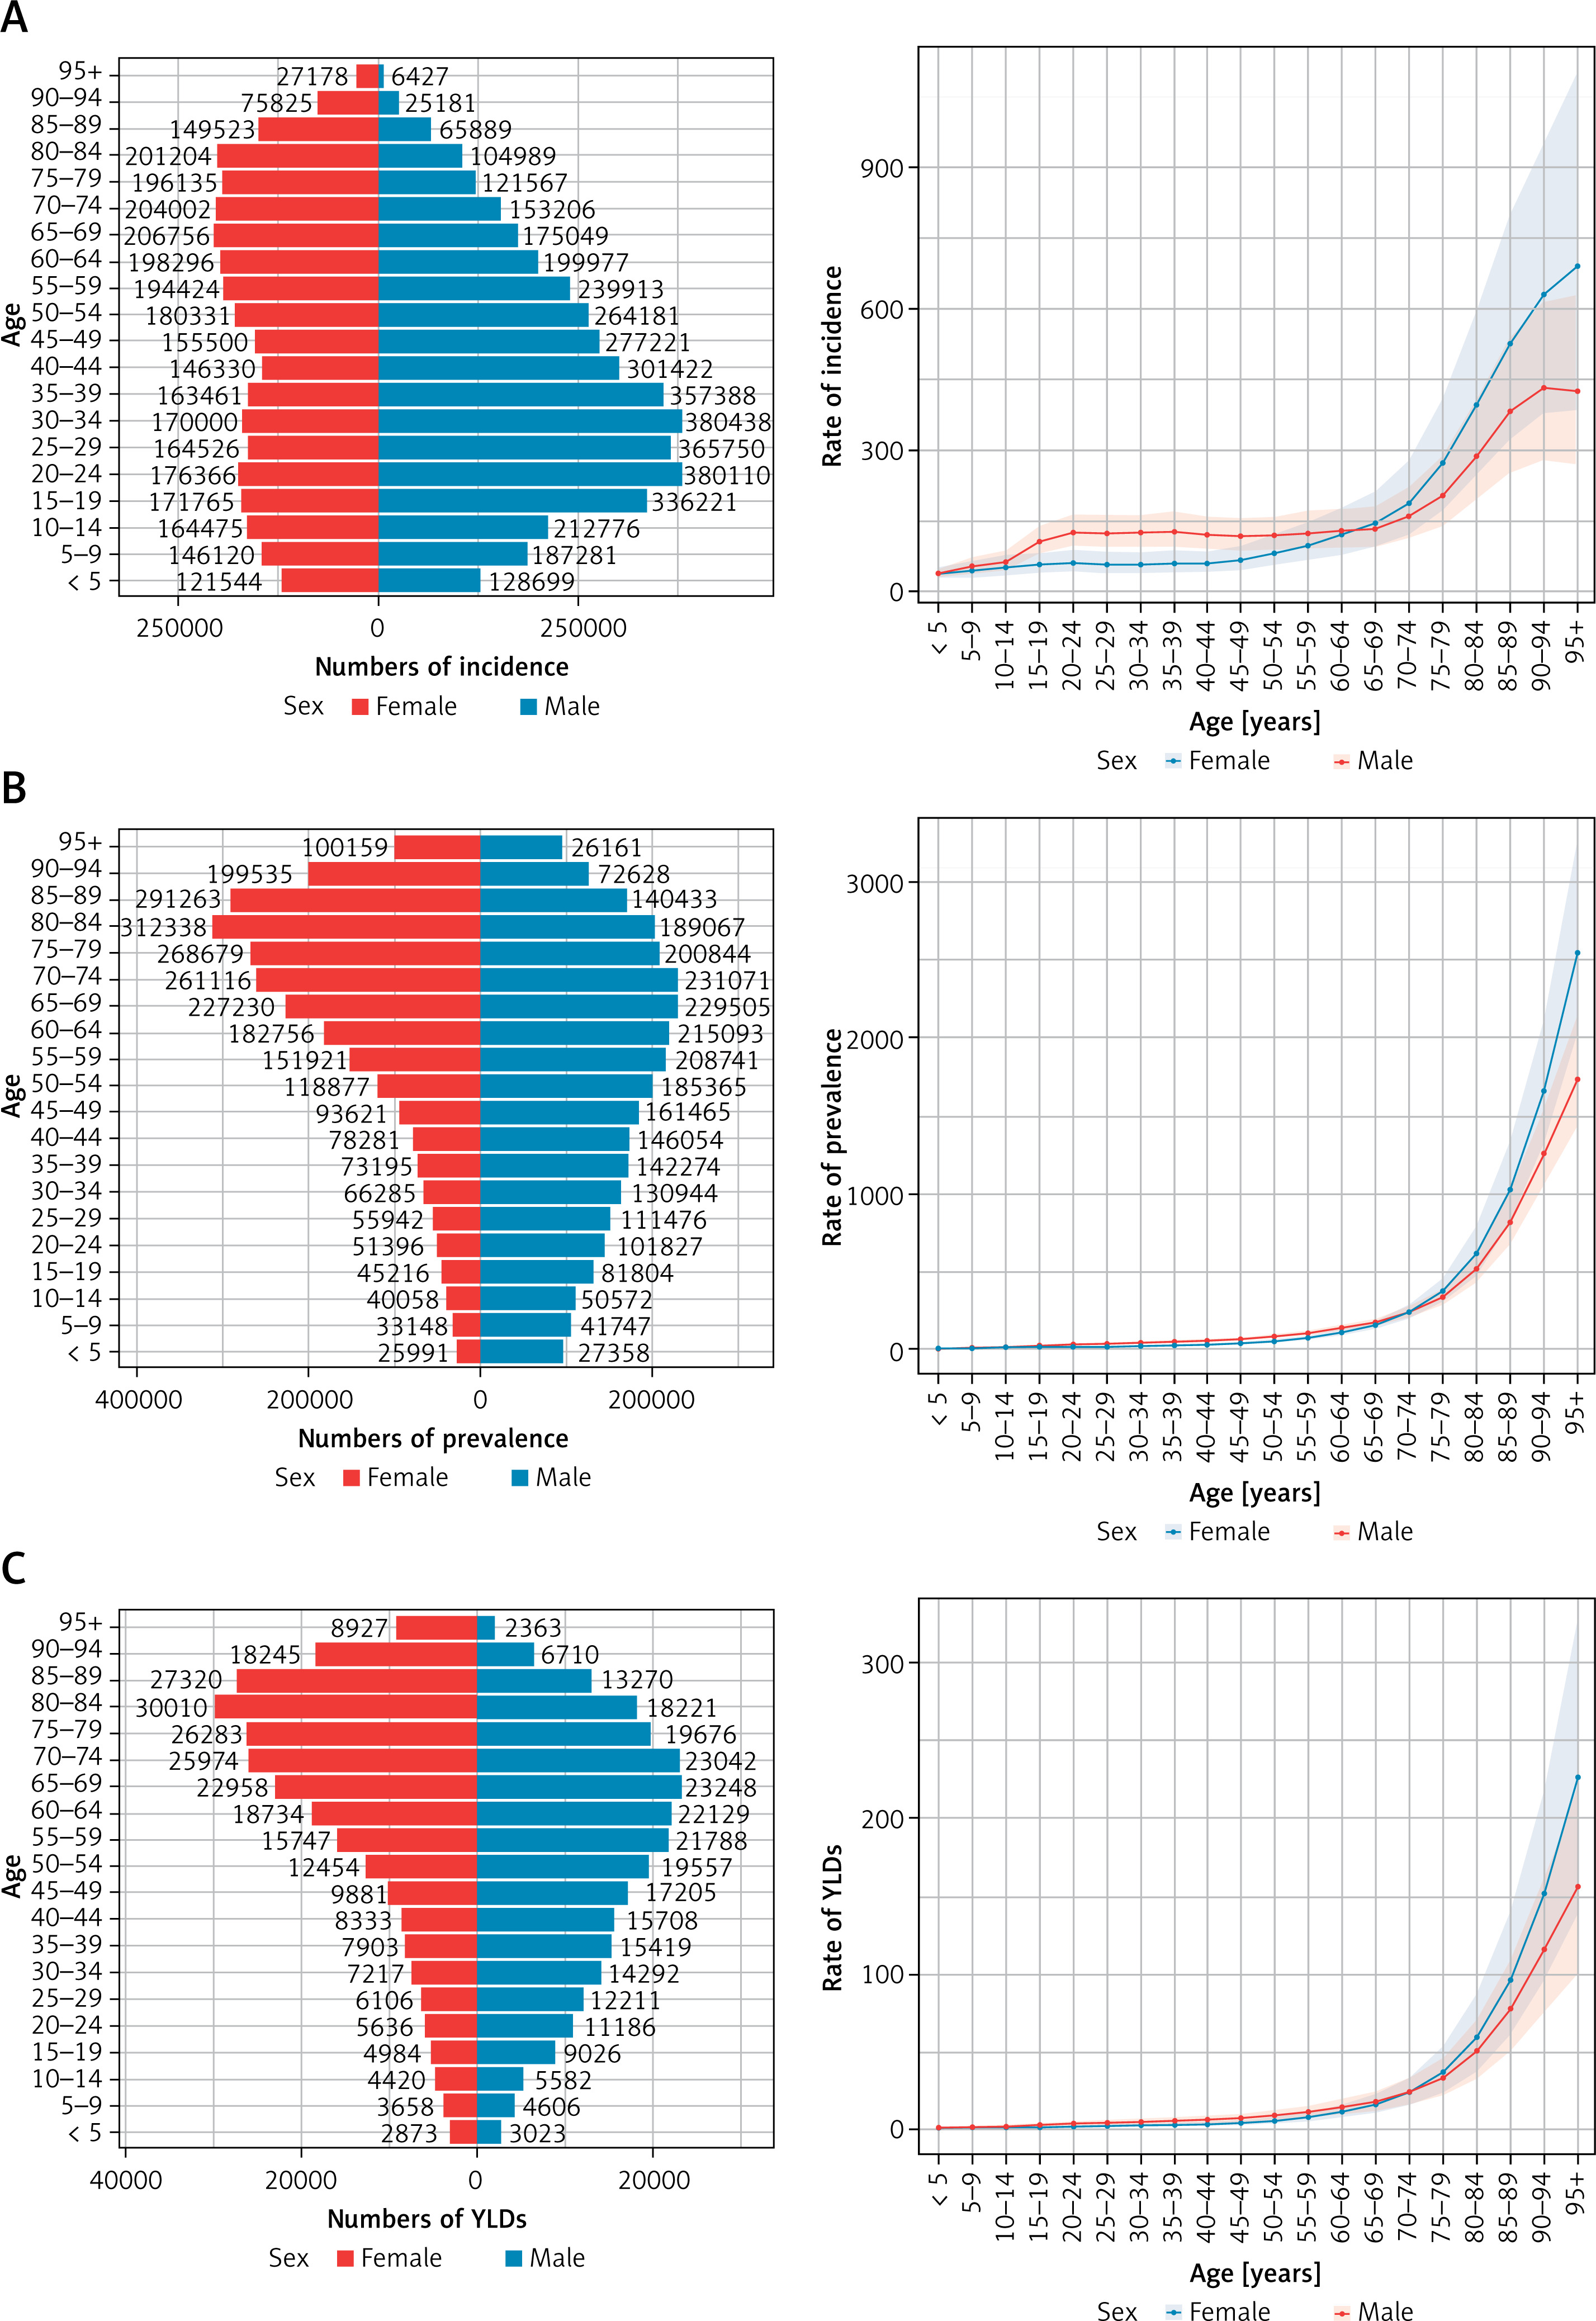
In 2021, the ASPR of SF exhibited a progressive increase with advancing age, reaching a peak among those aged 95 years and older (Figure 4 A). While the ASPR for male and female was comparable at ages 5 to 19 and 69 to 74, male consistently exhibited higher ASPR than female at ages 20 to 68; in individuals aged 95 years and older, the ASPR was consistently higher in females compared to males (Figure 5 A). Similarly, the ASIR of SF in 2021 exhibited a gradual rise with age, reaching a peak in individuals aged 95 years and older. Among the population aged 5 years and older, the incidence in males progressively surpassed that in females, while in those aged 65 years and older, the difference between the sexes was reversed (Figure 5 B). YLDs also exhibited an upward trend in 2021 relative to 1990, with ASR being greater in women than in men after the age of 75 (Figure 5 C).
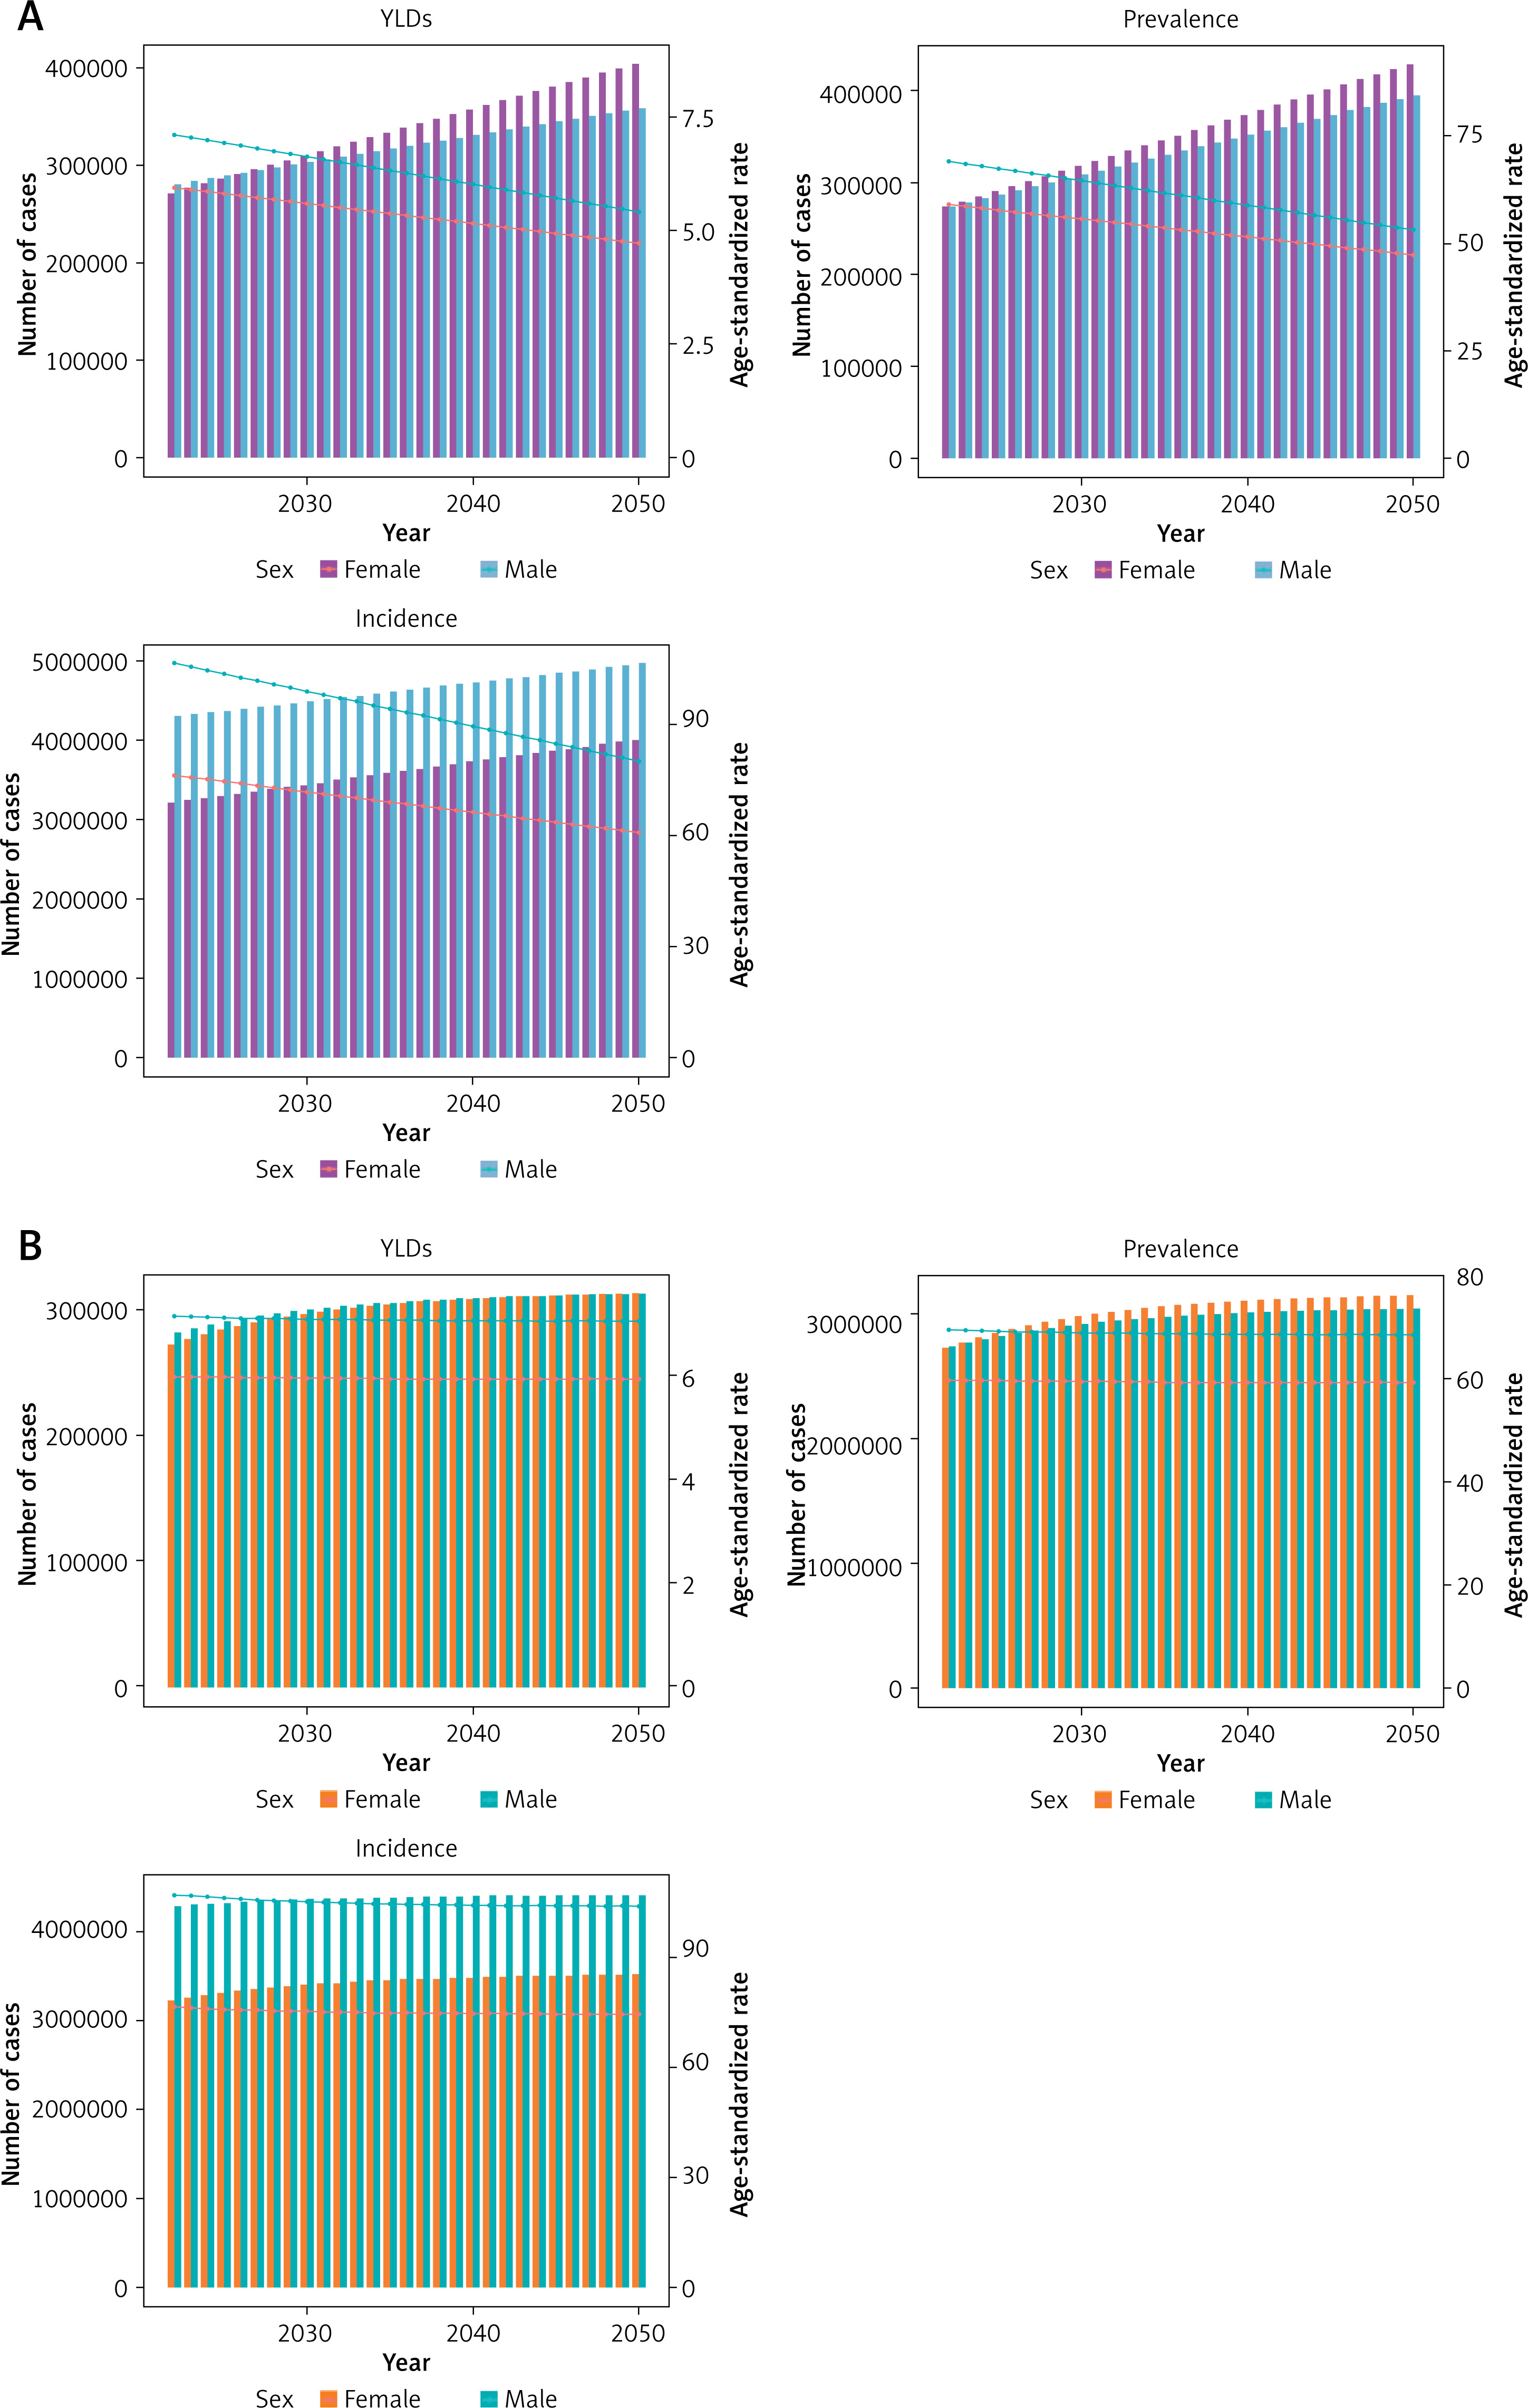
Future forecasts of global burden of SF
We have projected the future disease burden of SF from 2022 to 2050 using both the ARIMA and ES models. Due to their differing sensitivities to time-series data, the projected values from the two models diverge. According to the ARIMA model, the global ASPR of SF is expected to decline to approximately 100.59 cases per 100,000 population by 2050 (Figure 6 A). Specifically, the prevalence in males is projected to decrease to 53.21 cases per 100,000, while in females, it is expected to decrease to approximately 47.38 cases per 100,000. The ASIR is anticipated to decrease to about 141 cases per 100,000 population, with males experiencing a reduction to 80.13 cases per 100,000 and females to 60.87 cases per 100,000. The ASYR for SF is projected to decline to approximately 10.12 cases per 100,000 population, with males at 5.40 cases per 100,000 and females at 4.72 cases per 100,000. In contrast, the ES model predicts a substantial change in the global burden of SF from 2022 to 2050, with varying trends across different indicators (Figure 6 B). The ASPR is expected to increase globally, rising from approximately 65.19 per 100,000 population in 2021 to about 128.04 per 100,000 by 2050, reflecting an approximate 96% increase over the next three decades. For males, the prevalence is projected to remain relatively stable, with a slight decrease from about 69.58 per 100,000 in 2021 to 68.76 per 100,000 in 2050. Similarly, prevalence among females is expected to show minimal change, decreasing slightly from 59.57 per 100,000 in 2021 to 59.28 per 100,000 in 2050. The global incidence of SF is projected to increase significantly for both sexes combined, with the ASIR rising from approximately 92.74 per 100,000 in 2021 to about 178.36 per 100,000 by 2050. The ASYR for SF is also expected to continue an upward trajectory, increasing from 6.62 per 100,000 in 2021 to approximately 12.98 per 100,000 by 2050. Across all three measures, males consistently exhibit higher rates than females, particularly in terms of incidence.
Discussion
Our study used the most recent SF data, released in 2021, to conduct a comprehensive analysis of the global SF burden from 1990 to 2021. The analysis revealed complex regional patterns and trends associated with sociodemographic indices. On a global scale, the ASPR, ASIR, and ASYR of SF decreased from 1990 to 2021. These findings align with the GBD 2019 study, which also reported a decline in ASR of SF over time [7]. At the regional level, the highest ASPR, ASIR, and ASYR were observed in regions with high SDI, while the lowest rates were found in low SDI regions. This highlights the persistent socioeconomic disparities in the global burden of SF. The higher burden in high SDI regions may be attributed to well-established healthcare systems [19], effective public health interventions, and greater awareness of SF risk factors and symptoms. In contrast, the lower burden in low SDI regions may be linked to a combination of factors, including limited access to healthcare, suboptimal management of risk factors, and inadequate secondary prevention strategies. For example, Australasia and parts of America, which exhibit high ASPR, as well as Australasia and parts of Europe, with high ASIR, are high SDI regions. These areas, despite having overall high health coverage, benefit from regular medical check-ups and better access to healthcare services, which can help proactively detect vertebral fractures, especially asymptomatic cases. However, these factors do not necessarily reduce the associated adverse outcomes, indicating that more effective measures are needed in these countries to prevent SF-related disability. The high ASYR in the Caribbean may be attributed to an increased prevalence of risk factors combined with healthcare system limitations. The region faces challenges such as armed conflict, poor access to and quality of health services, and limited resources for both prevention and acute SF care.
Despite the decrease in ASR, the absolute number of prevalent cases, incident cases, and YLDs due to SF increased from 1990 to 2021. This increase can primarily be attributed to population growth and aging [20]. As populations grow and age, the number of individuals at risk for SF rises, leading to a higher absolute disease burden. Moreover, limited access to quality healthcare, including acute SF services and rehabilitation facilities, may further exacerbate the burden of SF, particularly in resource-constrained settings.
In 2021, the global population reached 7.8 billion. In this study, the incidence and prevalence of SF were estimated to be 7.5 million and 5.37 million cases, respectively, accounting for 0.1% and 0.07% of the global population. These rates are considerably lower than those reported in previous studies [3, 21]. Several factors may explain this discrepancy. First, prior studies specifically targeted the detection of SF and were conducted in older adults, who are more susceptible to the condition. As a result, patients with latent or asymptomatic SF were more likely to be identified. Second, earlier studies were regional in nature rather than global [21]. Finally, since the incidence and prevalence of SF have been declining since 1990, previous studies may not accurately reflect the current situation.
In our study, we observed that areas with high SDI continue to exhibit high ASYR. This may be attributed to a lack of awareness about osteoporosis [22, 23], poor adherence to osteoporosis-specific treatments [24], high medication costs [25], and concerns about the side effects of anti-osteoporosis medications [24]. Therefore, it is crucial for spine surgeons to consider osteoporosis-related SF in the absence of other apparent causes of low back pain [26]. Additionally, it is necessary to analyze the patient’s psychological needs and provide appropriate assistance [27, 28]. Policy-level interventions, such as medical education, physician training, health insurance reform, and public awareness campaigns, are essential to bridging the gap in osteoporosis treatment.
Osteoporosis is a major cause of SF in the elderly. In the present study, ASIR, ASPR, and ASYR were higher in women aged over 75 years compared to men, likely due to postmenopausal osteoporosis. Osteoporotic SF significantly impacts the health of the elderly and imposes a substantial economic burden on society [29, 30]. Additionally, ASIR, ASPR, and ASYR were higher in older adults than in younger adults, increasing with age. This suggests that older adults are more vulnerable to osteoporotic SF and its related disabilities. However, early diagnosis of osteoporotic SF remains challenging. This is partly due to the high costs and the need for specialized appointments, and partly because the condition can be clinically asymptomatic, with most cases detected incidentally during routine health checks for other conditions [31, 32]. It is therefore essential to reduce screening costs, diversify diagnostic approaches, and incorporate bone mineral density and spinal assessments into routine physical examinations.
SF in young and middle-aged adults may be due to high-energy trauma, such as road traffic accidents, and is more common in men [33], which may account for the higher ASIR, ASPR, and ASYR in men in the present study; SF in older adults may be due to a combination of low-energy trauma and low bone density, such as falls [34, 35]. Preventing falls in older people and reducing their weight may be the major means of reducing associated injuries [36], which requires a concerted effort by health care workers and family caregivers. Preventing SF due to traffic accidents, on the other hand, requires enhanced education on traffic rules and road safety. In 2019, the highest global ASIR and ASYR were seen in Middle Eastern countries due to conflict and terrorism, whereas the present study showed a significant decrease in 2021, indicating important efforts to sustain peace worldwide.
Previous research often lacked forecasts of future trends [37], and existing studies that did apply forecasting models typically relied on a single statistical method [38]. To mitigate the potential limitations inherent in using a single statistical model, better capture the dynamics of the data, and more reliably predict the future disease burden in SF, we combined two predictive models: ARIMA and ES. This approach provides a more nuanced understanding of the complexities involved in disease prediction. Both the ARIMA and ES models offer distinct advantages based on their underlying assumptions and data handling methods. The ARIMA model is well suited for smooth, hypothetical data, with a more rigorous calibration process, whereas the ES model excels at handling unstable data, offering simplicity and adaptability. The ARIMA model extracts deterministic patterns by transforming non-smooth time series into smoother ones. In contrast, the ES model predicts future data by assigning varying weights to past observations, making it more intuitive [39].
Our ARIMA model projections indicate that the SF disease burden may decline by 2050, while the ES model suggests its persistence. Therefore, structured ARIMA models may yield more conservative estimates of future disease burden, whereas the adaptive ES model, which is sensitive to control measures and other factors, could lead to different predictions. By integrating data from previous studies and the present analysis, a decreasing trend in the disease burden of SF is observed. In this context, the ARIMA model, which is more suited for long-term forecasting, may be more appropriate, while the ES model is better for short-term predictions [40]. Consequently, the results from both models complement each other, with the ARIMA model providing preventive and suggestive insights into the future burden of SF.
However, the study has several limitations. First, the accuracy of the data is influenced by the quality and availability of the data sources. The SF data were derived from inpatient, outpatient, and A&E discharge records, as well as follow-up data. However, out-of-hospital cases with latent or asymptomatic SF may not be captured by GBD studies. Second, the GBD methodology depends on various assumptions and modeling techniques, which can introduce uncertainty in the estimates. Although the GBD study employed rigorous statistical methods to address these uncertainties, its results should be considered as the best estimates based on the current available evidence.
In conclusion, despite the decrease in ASR, the absolute burden of SF remains high, with significant regional, national, and SDI-related variations. These findings highlight the need for targeted prevention and treatment strategies that cater to the specific needs of different populations. Strengthening healthcare systems, promoting healthy lifestyles, and reducing socioeconomic disparities are essential steps to mitigate the global burden of SF. Future research should focus on identifying and implementing the most effective interventions and policies for SF prevention and management.