Introduction
Since January 2020, severe acute respiratory syndrome coronavirus 2 (SARS-CoV-2) has been implicated in the biggest pandemic of our century with more than 140 million cases, accounting for more than 4.6 million deaths (https://coronavirus.jhu.edu/map.html). Among other countries, Italy, and in particular the Lombardy region, have been dramatically exposed to SARS-CoV-2, with more than 30,000 deaths (https://coronavirus.jhu.edu/map.html).
SARS-CoV-2 infection can range from asymptomatic carriers to acute respiratory failure due interstitial pneumonia, which can be fatal in a considerable proportion of patients, up to 14% [1].
In this view, determining the risk of severe disease at admission and therefore the mortality risk is crucial to support medical decision making during a pandemic with the need of allocating resources.
Imaging plays an important role in the diagnosis and management of COVID-19 pneumonia and in detecting the grade of lung involvement. Particularly, chest CT is considered the first-line imaging modality in highly suspected cases and is helpful for monitoring imaging changes during treatment [2].
Furthermore, biomarker alterations can predict mortality [3]. However, no single biomarker has been demonstrated to have prognostic value. Since the original epidemic in Wuhan (China), several mortality risk factors have been identified: genetic predisposing factors [4]; demographic factors, in particular older age and male sex [5]; the presence of comorbidities, especially cardiovascular and metabolic [6]; several laboratory findings – decreased lymphocyte count, increased lactic dehydrogenase (LDH), ferritin, and interleukin-6 (IL-6) [7]; and imaging findings [8]. Furthermore, myocardial injury is frequent among patients hospitalized with COVID-19 and is associated with a poor prognosis, while early detection of altered cardiac markers is associated with high mortality even if admitted with mild disease [9].
In this view, prognostic risk scores have been developed to assess mortality risk [10], risk of clinical worsening and intensive care unit (ICU) admission [11], or favorable outcomes [12]. A systematic literature review conducted at the beginning of the pandemic identified 50 prognostic studies assessing the risk of mortality; however, these studies had several limitations, in particular a high risk of bias, the absence of a validation cohort, the small sample size, and statistical faults [13]. So far, no risk score is routinely used in clinical practice; therefore clinical decisions are mainly based on expert opinion and clinical judgment.
Artificial intelligence (AI) represents a novel tool for analyzing big data in medicine, since it can provide the chance to assess frequently a large number of relevant variables, their temporal changes and interactions among variables with respect to the prognostic outcome. Furthermore, machine learning algorithms, such as decision trees, random forests, support vector machines, neural networks, and deep learning, can identify hidden patterns in clinical data [14]. Based on these findings, we aimed to develop a prognostic score for in-hospital mortality in patients admitted for COVID-19 pneumonia based on machine learning.
Material and methods
Data source
We conducted a retrospective cohort study on patients admitted for COVID-19 from March 1st 2020 to December 15th 2020 at Humanitas Research Hospital (Rozzano, Milan, Lombardy, Italy), a large tertiary center that has been largely converted to the management of COVID-19. Inclusion criteria were: age ≥ 18 years, diagnosis of COVID-19 with pneumonia documented by chest computed tomography (CT) requiring hospitalization. No exclusion criteria were applied.
SARS-CoV-2 viral RNA was detected by real-time polymerase chain reaction (PCR) in nasopharyngeal swabs to confirm the diagnosis of viral infection. Thoracic CT scan was used to confirm the diagnosis of pneumonia; interstitial pneumonia, bilateral ground-glass area, and absence of pleural effusion were considered typical features. In patients with a negative nasopharyngeal swab but high clinical or radiological suspicion for COVID-19, bronchoalveolar lavage was performed and SARS-CoV-2 RNA was detected in the bronchoalveolar fluid.
Selection of variables
The following data were automatically collected from the electronic medical records: age, comorbidities (including arterial hypertension, diabetes mellitus, cardiovascular disease, cancer, chronic pulmonary disease, chronic kidney disease), vital parameters at admission (arterial pressure, heart rate, respiratory rate, oxygen saturation in room air). Comorbidities were summarized using the Charlson Comorbidity Index (CCI) [15].
Patients underwent arterial blood gas analysis on admission, and pO2/FiO2 ratio (p/F) was calculated. A complete laboratory panel was obtained for each patient at admission. The laboratory parameters assessed were: complete blood cell count, cardiac biomarkers, liver and renal function, coagulation tests, inflammation indexes. Laboratory analysis was performed by an internal laboratory. Any need for non-invasive mechanical ventilation or admission to the intensive care unit, and length of stay were recorded.
The primary outcome was in-hospital mortality. Secondary outcomes were ICU admission, need for non-invasive ventilation, and length of stay.
Missing values were imputed using an iterative algorithm (Iterative Imputer) [16]. Then, all the selected features were normalized to a z-score.
Model training and development
The analysis followed a machine learning approach using a supervised framework. For the prediction of outcomes, we employed four models of increasing sophistication: we started with a logistic regression and then moved to three ensemble methods: random forest, gradient boosting and extreme gradient boosting, which allow one to control for unbalanced classes, irregular distributions and outliers. The modelling strategy was as follows:
Favor interpretable models for both outcomes using only vital parameters, laboratory values and demographic features.
Assess the cross-validation performance for each outcome and provide a baseline.
Add interaction terms to increase model complexity and consider multi-collinearity.
Assess the performance of more complex models and compare it to baseline models.
Add a feature importance analysis to find the most significant features in predicting the outcome and increase scoring.
We divided our dataset into training a set (70% of data) and a test set (30%).
An oversampling strategy (Synthetic Minority Oversampling Technique – SMOTE) was used to overcome the unbalancing of the two classes for outcomes (discharged patients – class 0 – and deceased patients – class 1) [17].
The model parameters were chosen using a randomized search algorithm, through which we evaluated the performances of the classifiers on the whole dataset. We used the randomized search in order to jointly maximize macro-average F1, receiver operating characteristic curve (AUC) and accuracy values. We decided to use the macro-average F1 in cross validation in order to determine how the system performed overall across the sets of data. We did not take into consideration the micro-average and the weighted F1 since the former is influenced by the class unbalancing and both give more weight to the class with more observation. At the end, all the results obtained after the training and test phase were evaluated through a cross-validation process.
For the logistic regression and the random forest models, we decided to also use a class-weight strategy in order to balance the two classes.
As concerns feature selection, we planned to analyze the most important variables for the prediction of the outcome through a feature importance process (mean decrease impurity for tree-based models and β-coefficients for logistic regression). For this purpose, we designed an iterative process in which all models were re-trained, tested and cross-validated considering only subsets of the original set of features. The subsets were defined using a range of thresholds (from 0.01 to 0.05 for tree-based models and from 0.1 to 0.5 for logistic regression) for feature importance and, at each step, all features with an importance below the selected threshold were excluded from the training process.
Furthermore, we used the model derived by feature selection to develop a risk score that minimized the number of variables with good overall prediction performance to stratify patients. The score performances were evaluated in terms of discrimination and calibration capabilities. The discrimination ability of the proposed score was determined by AUC, and negative predictive value (NPV) and positive predictive value (PPV), sensitivity and specificity [18]. Finally, the relative importance was quantified for the identified variables and used as a comparative measure of patients’ feature weight in determining the score.
The study received approval by the local Ethics Committee.
Statistical analysis
Statistical analysis was performed by STATA 13.1 (Stata Corp, College Station, Texas). Continuous variables were expressed as median and interquartile range (IQR), while categorical variables were expressed as percentages. Univariate analyses were performed using the χ2 test for categorical variables and Student’s t-test for continuous variables. Statistical significance was taken as p-value < 0.05.
Results
A total of 1,135 consecutive patients with confirmed COVID-19 pneumonia were included. The median age was 70 years (IQR 58–80) and 729 (64.2%) patients were men. Baseline clinical characteristics and clinical presentation are summarized in Table I. More than 40% of patients had a two or more comorbidities, mainly hypertension and chronic cardiovascular disease.
Table I
Demographic and clinical characteristics of patients admitted to hospital for COVID-19
| Parameter | Total N = 1,135 | Training cohort N = 898 | Test cohort N = 237 |
|---|---|---|---|
| Male sex | 729 (64.1) | 572 (63.6) | 158 (66.4) |
| Age [years] | 70 (58–80) | 71 (59–80) | 70 (58–81) |
| Comorbidities: | |||
| Number of comorbidities: | |||
| 0 | 290 (25.5) | 228 (25.4) | 62 (26) |
| 1 | 351 (30.9) | 281 (31.2) | 70 (29.4) |
| ≥ 2 | 496 (43.6) | 390 (43.4) | 106 (44.5) |
| Hypertension | 581 (51.1) | 456 (50.8) | 125 (52.5) |
| Diabetes (type 1 and 2) | 214 (18.8) | 168 (18.7) | 46 (19.3) |
| Chronic cardiac disease | 291 (25.6) | 218 (24.3)* | 73 (30.7) |
| Chronic pulmonary disease | 151 (13.3) | 125 (13.9) | 26 (10.9) |
| Chronic kidney disease | 108 (9.5) | 88 (9.8) | 20 (8.4) |
| Moderate or severe liver disease | 13 (1.1) | 9 (1) | 4 (1.7) |
| Malignant neoplasm | 197 (17.3) | 159 (17.7) | 38 (16) |
| Neurologic disease | 174 (15.3) | 140 (15.6) | 34 (14.3) |
| Charlson Comorbidity Index | 4 (3–6) | 4 (3–6) | 4 (3–6) |
| Vital parameters at admission: | |||
| Respiratory rate [breaths/min] | 18 (17–20) | 18 (17–20) | 18 (17–20) |
| Oxygen saturation (%) | 94 (90–96) | 94 (90–96) | 94 (90–96) |
| Systolic blood pressure [mm Hg] | 126 (117–137) | 127 (118–137) | 125 (117–137) |
| Diastolic blood pressure [mm Hg] | 73 (67–78) | 73 (67–79) | 72 (67–77) |
| Heart rate [bpm] | 80 (75–91) | 83 (75–92) | 81 (75–90) |
| p/F ratio [mm Hg] | 295 (238–347) | 295 (233–347) | 295 (247–350) |
| Glasgow Coma Scale | 15 (15–15) | 15 (15–15) | 15 (15–15) |
| Laboratory tests at admission: | |||
| White blood cell count [109/l] | 6.98 (5.23–9.89) | 6.89 (5.14–9.74) | 7.33 (5.8–10.1) |
| Neutrophil count [109/l] | 5.3 (3.7–8.1) | 5.3 (3.6–8.3) | 5.55 (4.1–8.1) |
| Lymphocyte count [109/l] | 0.9 (0.6–1.2) | 0.9 (0.6–1.2) | 0.9 (0.6–1.2) |
| Hemoglobin [g/dl] | 13.7 (12.4–14.8) | 13.8 (12.6–14.7) | 13.6 (12.4–14.8) |
| Platelet count [109/l] | 207 (158–271) | 212 (161–270) | 205 (155–271) |
| Ferritin [ng/ml] | 504 (232–967) | 469 (229–966) | 532 (249–968) |
| Creatinine [mg/dl] | 0.95 (0.77–1.27) | 0.95 (0.78–1.24) | 0.95 (0.78–1.24) |
| Urea [mmol/l] | 19 (14–27.7) | 19 (14–27.6) | 19.2 (14.1–28) |
| Bilirubin [mg/dl] | 0.7 (0.5–0.9) | 0.7 (0.5–0.9) | 0.7 (0.5–0.9) |
| LDH [IU/l] | 331 (256–428) | 331 (255–426) | 332 (263–441) |
| AST [UI/l] | 37 (26–54) | 37 (26–60) | 37 (27–53) |
| ALT [UI/l] | 27 (18–46) | 28 (18–51) | 27 (18–45) |
| C-reactive protein [mg/l] | 88.4 (36–146.9) | 87.1 (34.1–145.4) | 97.5 (42.4–150.4) |
| CPK [U/l] | 96 (57–194) | 96.5 (57–194) | 92 (57–189) |
| High sensitive troponin I [ng/l] | 10.9 (5.7–28) | 10.8 (5.6–28.4) | 11.3 (6.3–26.3) |
| BNP [pg/ml] | 66 (31–156) | 68 (32–157) | 62 (27–156) |
| Interleukin 6 [pg/ml] | 45 (21–84) | 45 (20.5–85) | 46 (21–79) |
A total of 884 patients were discharged (78%, class 0 of the ML algorithm) and 251 patients died (22%, class 1 of the ML algorithm). During hospitalization, 172 patients (15%) were admitted to ICU due to worsening respiratory failure (Table II).
Table II
Clinical outcomes in the cohort
Machine learning algorithm
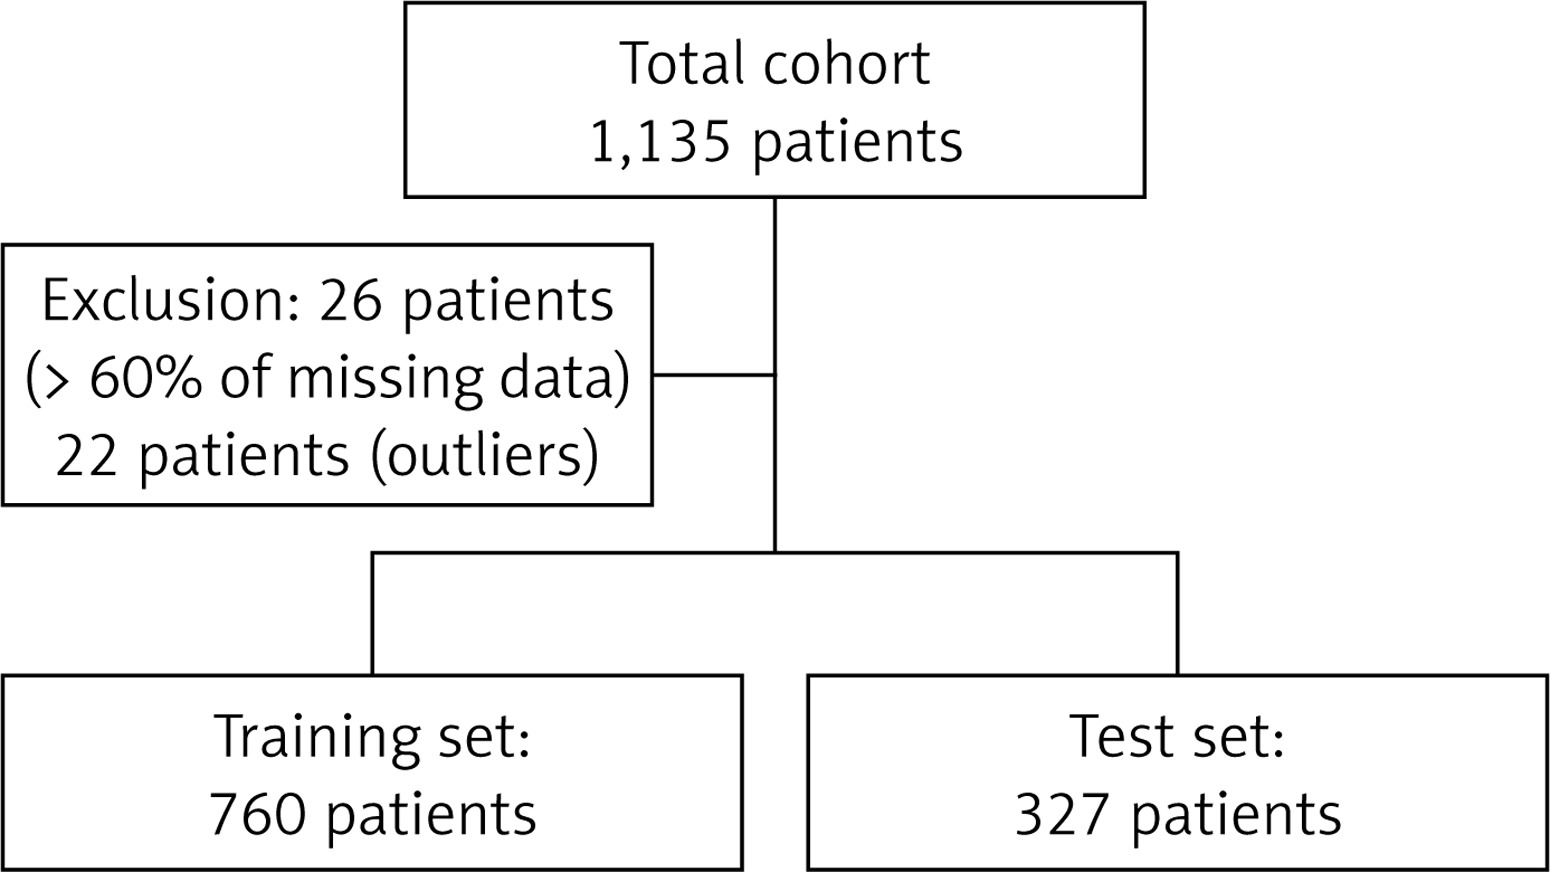
Our algorithm was trained on 760 patients and tested on 327 patients. Twenty-six patients were excluded from the cohort since they had missing values in more than 60% of considered features; a further 22 patients were subsequently excluded from the cohort since they were considered as outliers using an isolation forest algorithm (Figure 1).
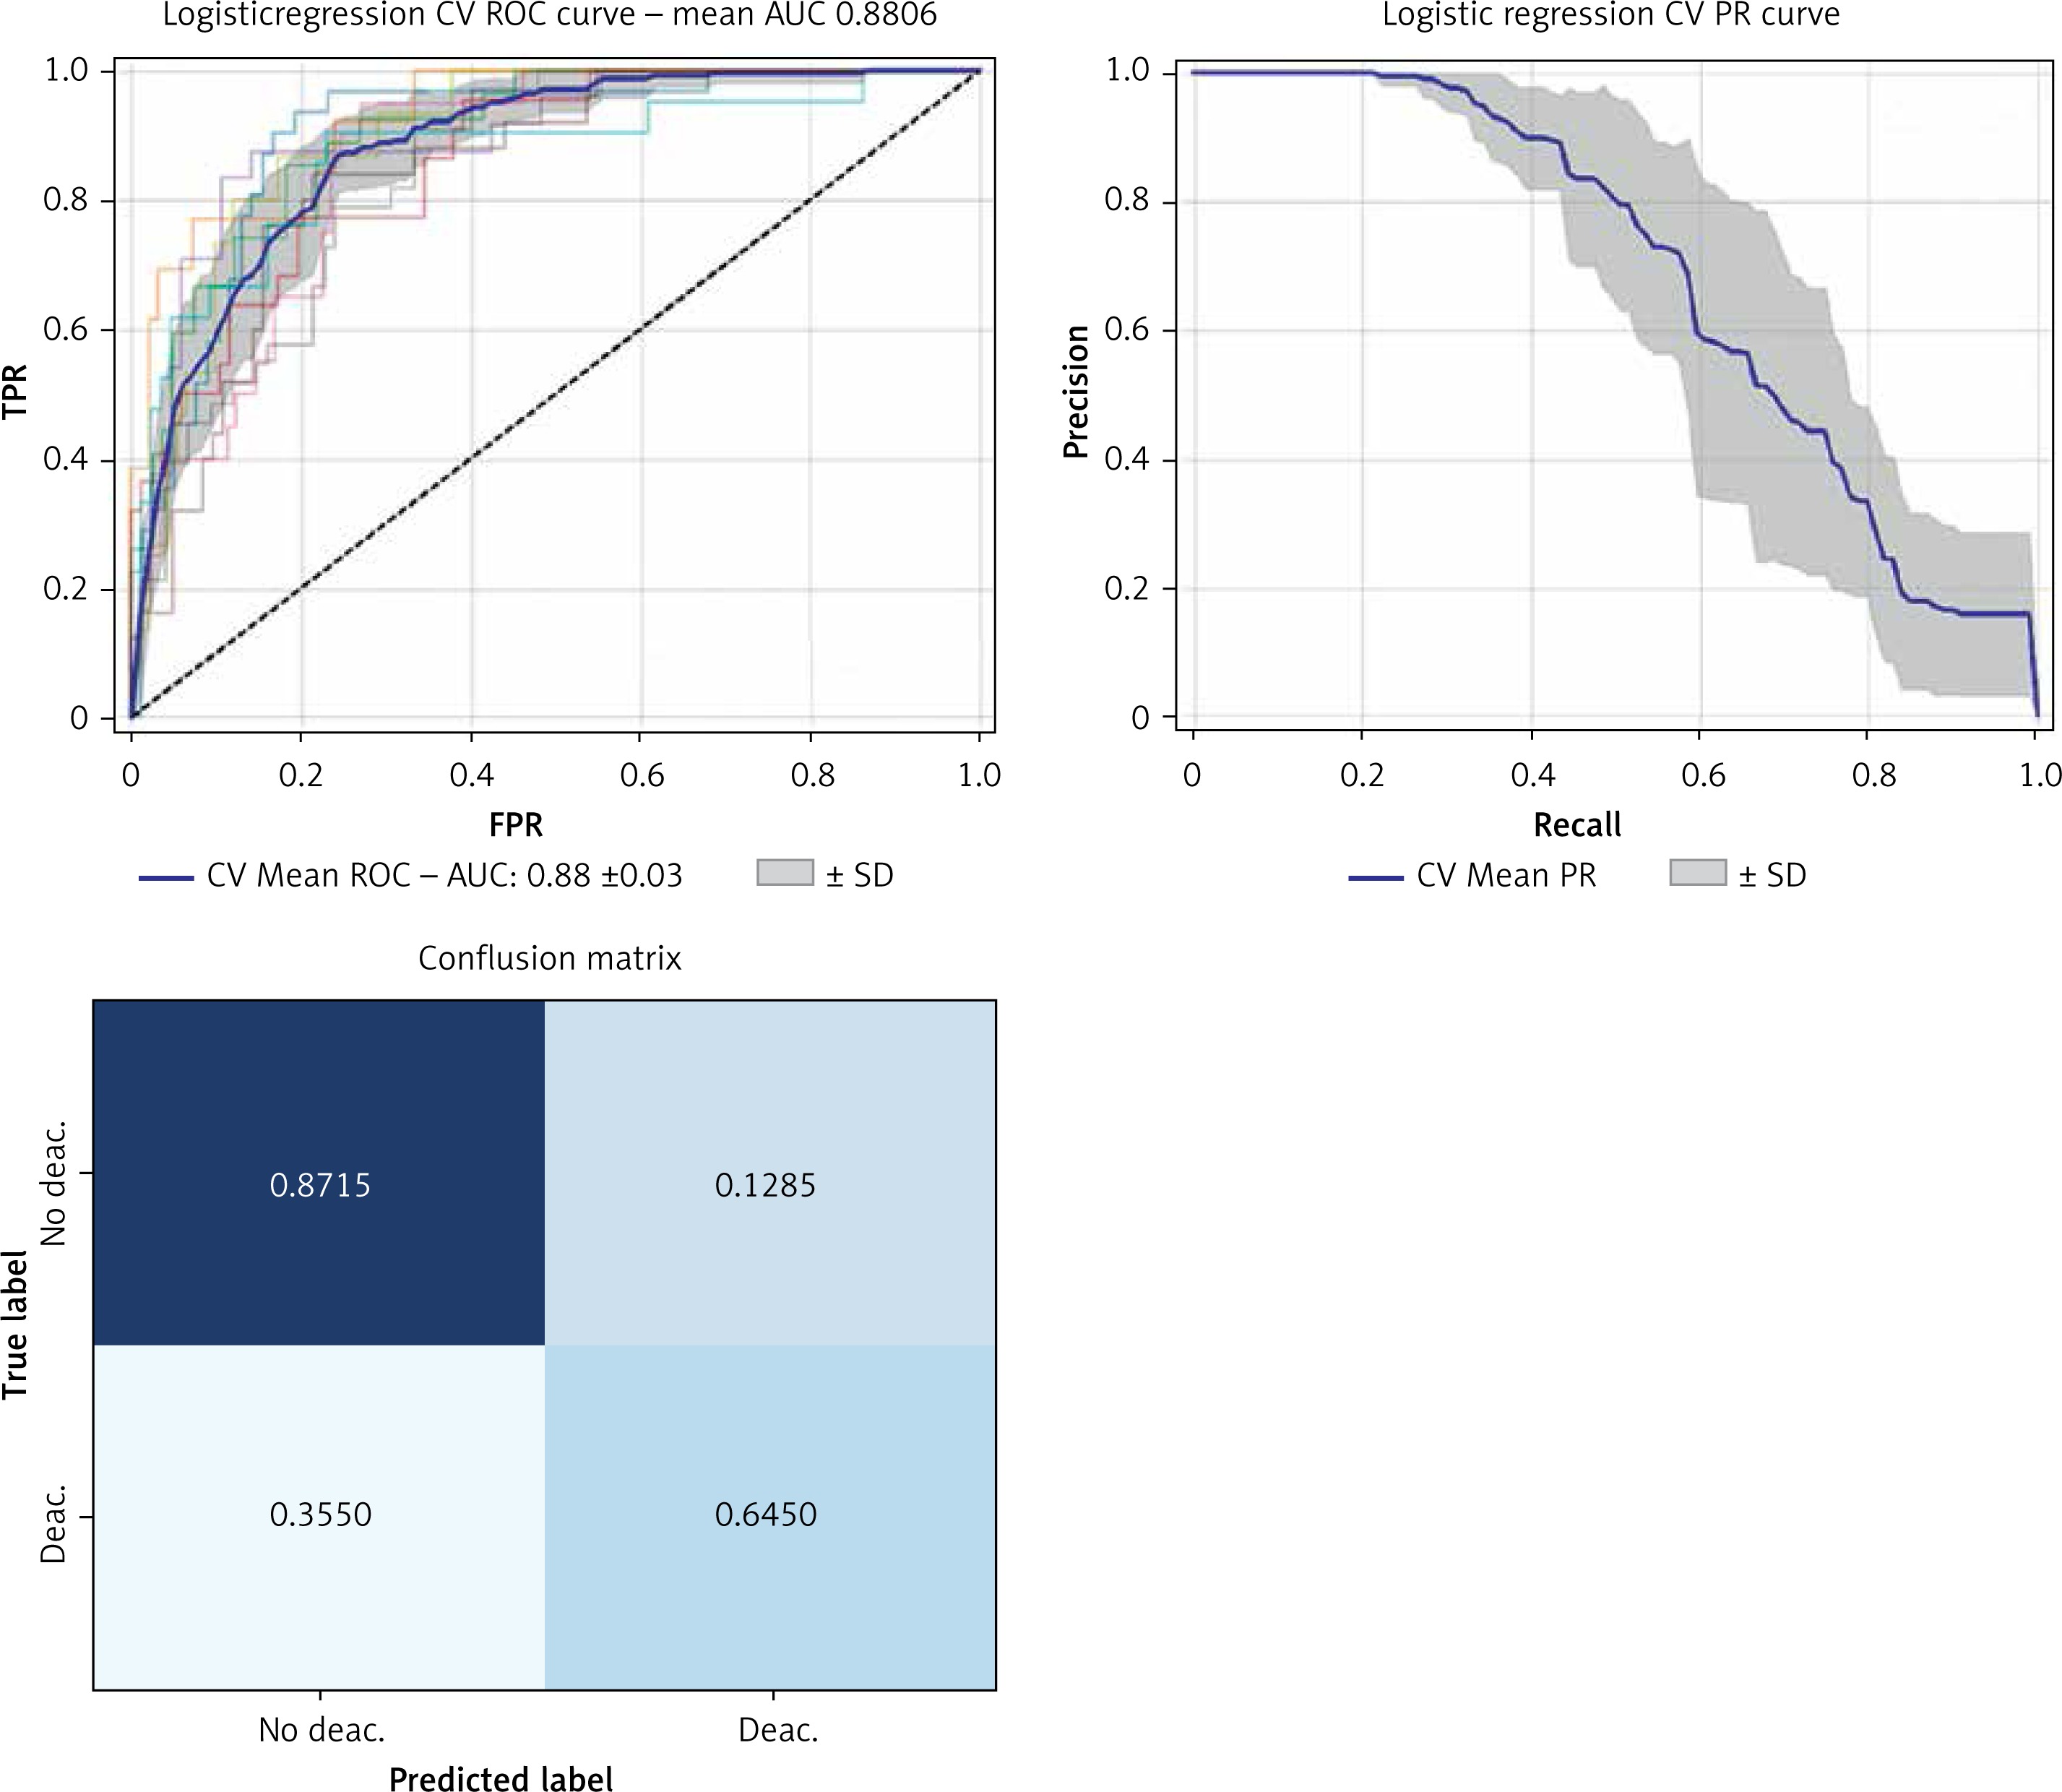
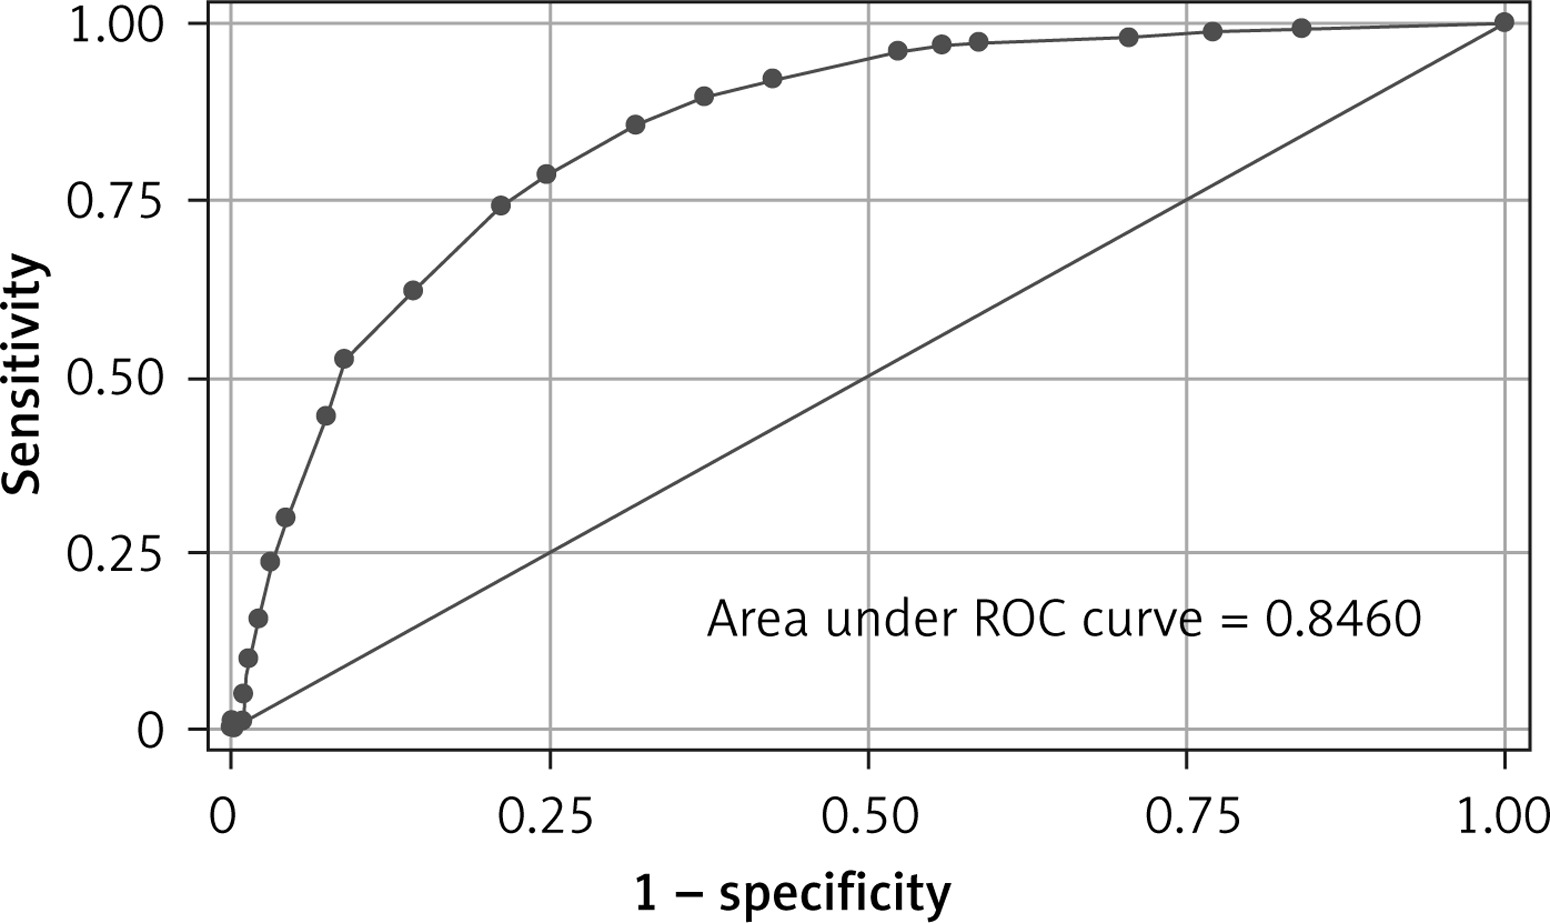
The randomized search results found that the best performing models were associated with a class 1 weight four times greater than class 0 for the random forest model and two times greater for the logistic regression model. The best performing classifier was logistic regression with class weight (Table III), which showed a mean AUC of 0.88 ±0.03, macro-average F1 0.74 in cross-validation (Figure 2).
Table III
Discriminatory performances of different machine learning models after the randomized search
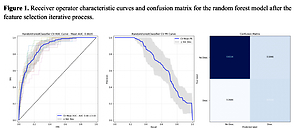
Figure 2
Receiver operator characteristic (ROC) curves and confusion matrix for the logistic regression model after the randomized search
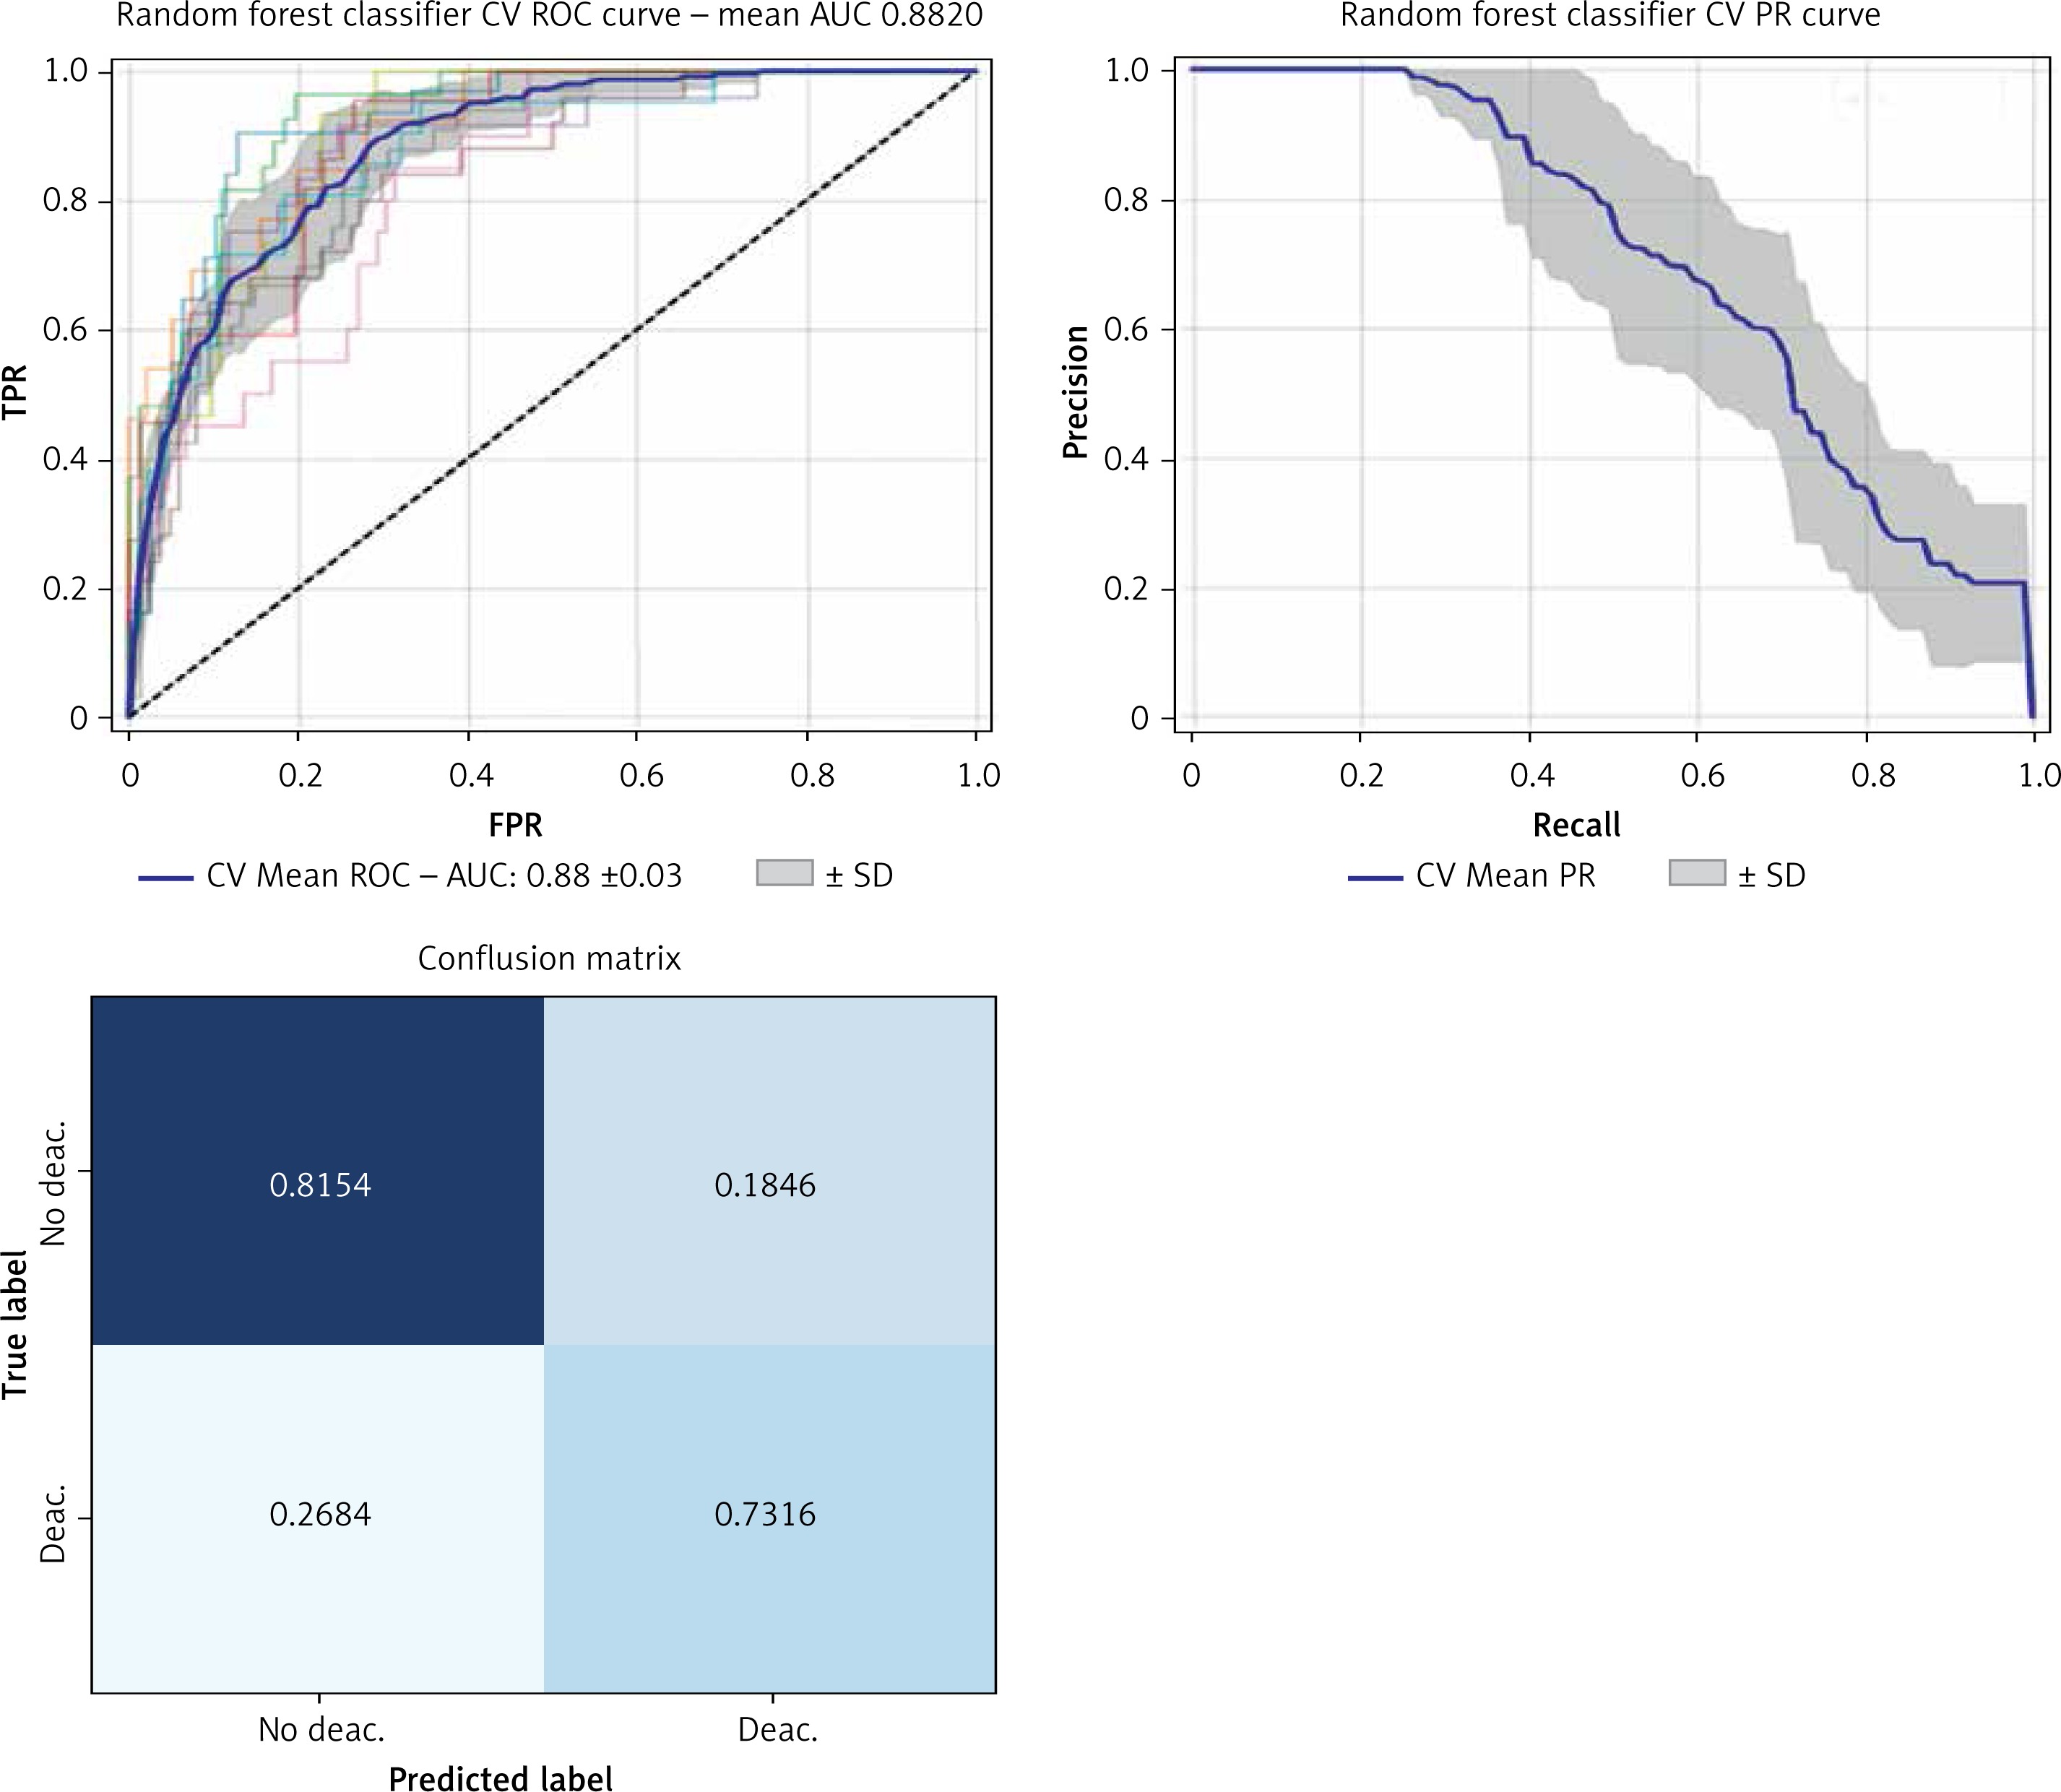
Furthermore, we used a feature selection iterative process based on feature importance to extract the most important features for outcome prediction. We set a threshold of 0.02, in order to obtain a model with less than 10 variables to be easily applied in clinical practice. The best performing classifier was the random forest, showing an AUC of 0.88 ±0.03 vs. 0.86 ±0.03 before the feature selection step, and, most importantly, from a cross-validated macro-AVG F1 0.73 (Figures 3, 4, Table IV).
Table IV
Performances of the gradient boosting classifier after the feature selection iterative process.
| Model | Macro average | Micro average | Weighted average | ||||||
|---|---|---|---|---|---|---|---|---|---|
| f1 | Precision | Recall | f1 | Precision | Recall | f1 | Precision | Recall | |
| Random forest | 0.72945 | 0.718855 | 0.777584 | 0.797596 | 0.797596 | 0.797596 | 0.810366 | 0.842462 | 0.797596 |
Clinical application
Based on the feature importance model, we aimed to develop a pragmatic risk score for use at the bedside for in-hospital mortality. Continuous variables were converted to factors with cut-off values chosen by using component smoothed functions. We converted penalized regression coefficients into a prognostic index by using appropriate scaling based on relative importance.
The developed risk score included the following variables:
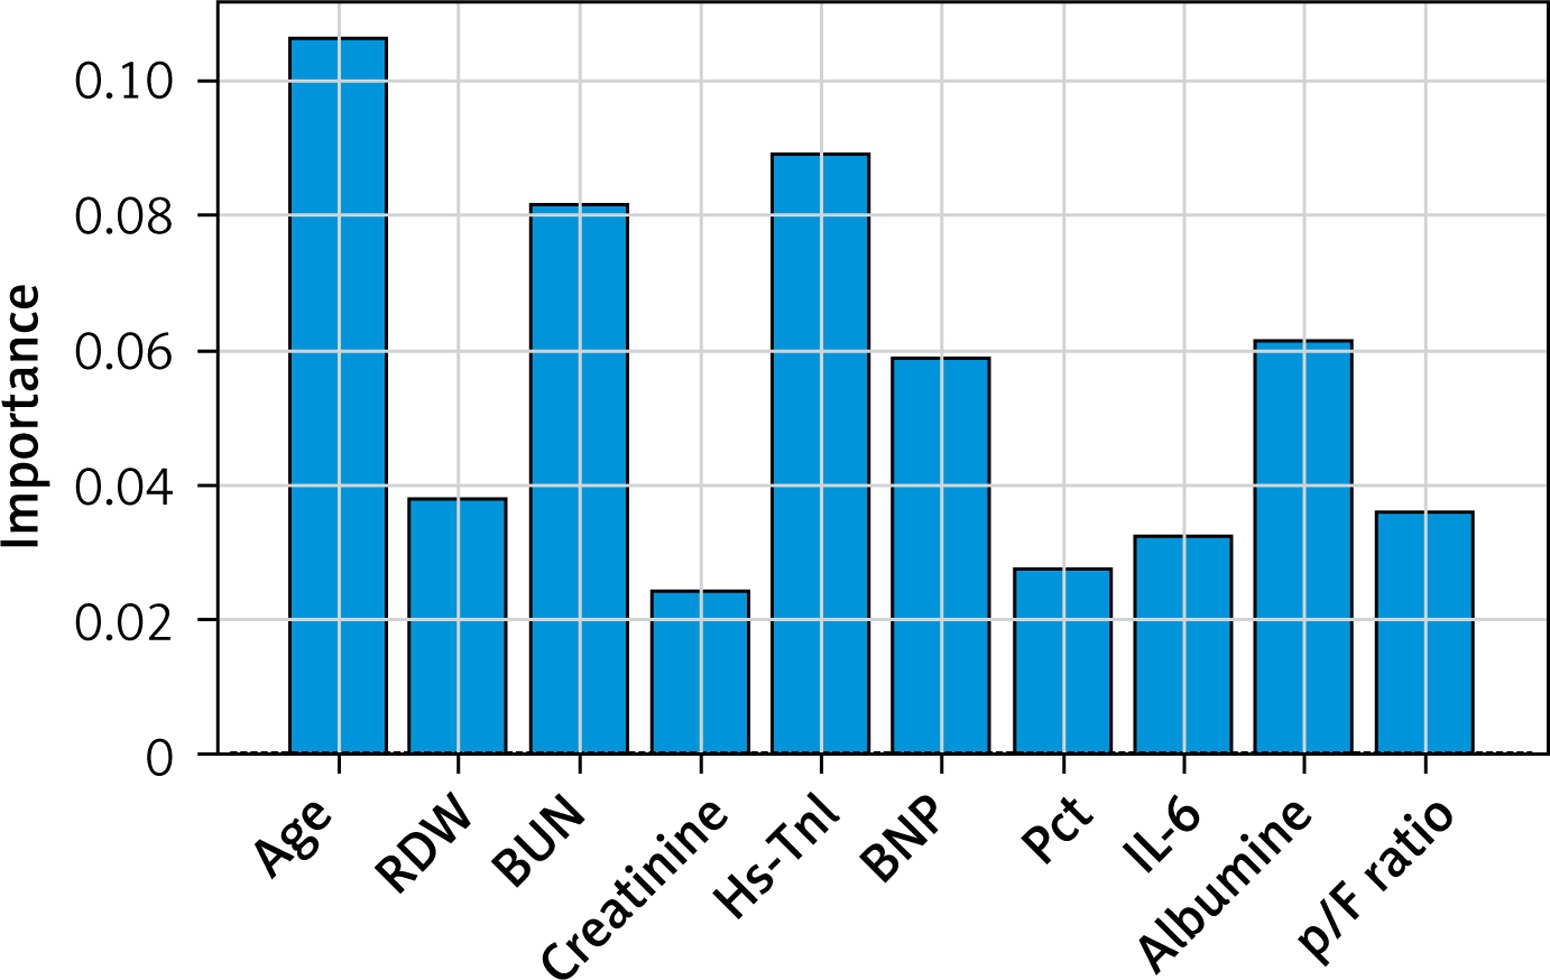
– Age (> 70 years), p/F ratio (< 250 mm Hg);
– Laboratory tests: hs-troponin I (> 20 ng/l), BNP (≥ 200 pg/ml), IL-6 (≥ 100 pg/ml), procalcitonin (≥ 1 ng/ml), red cell distribution width (RDW) (≥ 16%), urea (≥ 90 mg/dl), creatinine (≥ 1.9 mg/dl), albumin (≤ 3 g/dl).
The risk score showed good performance in clinically relevant metrics across a range of cut-off values (Table V). The corresponding AUC for in-hospital mortality was 0.85 (95% CI: 0.82–0.87) (Figure 4). Based on the performance metrics of the score, the score was grouped in three levels: low risk (0–6, 528 – 46.5%), high risk (7–10, 235 – 20.7%), and very risk (≥ 11, 372 – 32.8%). A progressive increase in mortality rate was observed across risk levels (low risk 3.8%, high 19.15%, very high 50%). Regarding the relative importance of each feature, age, p/F ratio and hs-troponin I were the most important predictors of death (Figure 5).
Table V
Performance metrics of the risk score to rule out and rule in mortality at different cut-off values in validation cohort
Discussion
We have developed a machine learning based prediction score for in-hospital mortality in patients with COVID-19 pneumonia. The score uses demographics, clinical parameters, and blood tests available at hospital admission and can accurately characterize the population at low and very high risk of death. We used machine learning techniques to identify variables that predicted in-hospital mortality. We then reduced the number of variables using a feature selection process to build a more pragmatic score that could be easily used in the clinical setting. Using this approach, we were able to have satisfactory performance with good utility. More specifically, a low score has high specificity, and high NPV for a score higher than 11. This is particularly important in the context of a pandemic, such as COVID-19, which has dramatically altered hospitals’ organization and led to the development of emergency ICUs and wards to assist ill patients. In this emergency setting, choosing which patient to admit to a regular ward versus discharge can be challenging. Therefore, the application of an easy-to-use risk score may help to quickly prioritize patients and apply stricter observation for at-risk patients.
The application of artificial intelligence has great potential benefits, as it allows one to collect and analyze a large amount of data, and, more importantly, to identify hidden trends and unknown interactions among different variables with respect to the outcome. Several studies have used machine learning approaches for COVID-19 diagnosis and prognosis [19]. However, many of the proposed models have high risk of bias due to limited cohort dimension, lack of external validation, and the development only in the first wave of the pandemic, which might limit their generalizability [10].
In line with previous findings, we identified that predictors of in-hospital mortality are age, severity of respiratory illness expressed as p/F ratio, biomarkers of cardiac damage, i.e. hs-TnI and BNP, inflammatory markers, i.e. IL-6 and Pct; creatinine, BUN, albumin and RDW.
With regards to biomarkers of cardiovascular damage, it is interesting to see how both median hs-TnI and BNP showed only mild increases above the normal range, but strongly predicted in-hospital mortality, including in patients without overt cardiovascular disease, similarly to other studies [20]. Potential causes of the increase of myocardial damage enzymes in COVID-19 include respiratory failure with hypoxemia, as in ARDS, pulmonary embolism, and myocardial injury, which have all been reported during severe SARS-CoV-2 infection with CT documented pneumonia [1]. Compared to existing risk scores, in our cohort of COVID-19 low albumin levels are associated with worse outcomes. Albumin levels have been associated with elevated risk of short-term and long-term mortality, and this could reflect both a status of malnutrition and acute illness [21]. Moreover, high levels of IL-6, a pleiotropic marker of inflammation, have been reported in the peripheral blood of hospitalized patients with COVID-19, with higher levels in those admitted to the ICU and an association between IL-6 levels and the probability of survival [22]. Furthermore, the use of the IL-6 receptor blocker tocilizumab in hospitalized COVID-19 patients with hypoxia and systemic inflammation improved survival and other clinical outcomes, as reported in a recent randomized clinical trial.
Recently, Halasz et al. proposed a prognostic score for COVID-19 mortality based on machine learning approaches: the Piacenza score, based on 852 patients with COVID-19 pneumonia, admitted to Piacenza Hospital (Emilia Romagna, Italy) between February and December 2020 [21]. The Piacenza score takes into account 6 variables, namely age, mean corpuscular hemoglobin concentration, PaO2/FiO2 ratio, temperature, previous stroke, and gender. Compared to the work by Halasz et al., our study has several differences. First, we used one of the largest cohorts of hospitalized COVID-19 patients. Second, Halasz et al. used a Naïve Bayes classifier, while we adopted tree-based models, which have been shown to have better performances. Third, our model shows better performances in terms of AUC (0.88 vs. 0.78), while it is not possible to compare other performance values since they did not report the values. Conversely, the Piacenza score has been externally validated, but only in 86 patients admitted to a cardiology hospital in Milan [22].
We are aware that our study has several limitations. First, the single-center nature of the study has intrinsic limitations. However, during the COVID-19 emergency, we were able to systematically collect data and laboratory tests, using electronical medical records and applying artificial intelligence. Furthermore, the study is based on retrospective data and is not validated in an external cohort, but we were able to overcome this using cross-validation. Moreover, we did not collect information about symptoms’ duration before hospitalization; therefore we might have included patients at different stages of the disease. Additionally, we did not develop a specific model for the secondary outcomes, as selection bias may have occurred in the first vs second wave of SARS-CoV-2 infection for the ICU admission criteria. Conversely, the present study represents one of the biggest cohorts analyzed by machine learning approaches [22]. Furthermore, we included only patients with CT documented COVID-19 pneumonia, which is a prognostic criterion for the need of oxygenation support and intubation.
In conclusion, we have developed and validated using a machine learning driven approach a pragmatic prognostic score for in-hospital mortality in COVID-19 patients with documented pneumonia, based on clinical and laboratory measurements, tested and validated on a large cohort of patients during both the first and second SARS-CoV-2 infection wave. The application of artificial intelligence allowed us both to collect and analyze data to develop a practice tool for severity stratification of hospitalized COVID-19 patients.