Introduction
Parkinson’ disease (PD) is the second most common neurodegenerative disease in the world, affecting about 1–2% of the population over 60 years old [1, 2]. The classic symptom of PD is tremor [3]. PD was long considered to be caused by environmental factors [4]; however, recently, genetic factors have been the focus of most studies, revealing novel diagnostic biomarkers and therapeutic targets [5]. At present, there are still no therapies for PD due to the unclear mechanism of this disease [6]. It is therefore necessary to study the molecular mechanisms of PD.
Generally, complex diseases, such as PD, result from a combination of genetic factors and their interactions [7]. Moreover, a number of genes, or genetic mutations, have been found to be involved in PD pathogenesis, establishing a basis for the mechanism of PD pathogenesis [8, 9]. Previous studies have revealed that a specific α synuclein (aSyn) RNA transcript isoform with an extended 3′untranslated region is associated with PD pathogenesis [10]. Both over-expression of wild-type and an A53T mutant of human aSyn in C. elegans can lead to damage of dopamine neurons [11]. Loss of VPS35 enhances toxicity of aSyn in PD and relates to EIF4G1 [12]. Leucine-rich repeat kinase 2 (LRRK2) mutations (c.6055G >A (p.G2019S)) are the most frequent cause of PD, accounting for as many as 40% of cases in people of Arab descent [13], and 1–7% in those of European origin [14]. Homozygous c.192G>C (p.E64D) mutations in the DJ-1 (Parkinsonism associated deglycase, PARK7) gene are associated with early-onset PD in individuals of Turkish decent [15]. In spite of these genetic links, less than 10% of this disease is currently ascribed to a single monogenic mutation, and much remains to be discovered with regards to its multifactorial nature, and the combination of genes and environmental factors involved [8].
Recent research has advanced knowledge of the biological processes involved in complex diseases. Many methods using gene co-expression networks have been used to elucidate relationships between differentially co-expressed genes pairs [16, 17]. Biological networks are a powerful tool that could help clarify the molecular mechanisms behind complex diseases, such as PD [18, 19]. This methodology has already been used to identify presenilin-associated rhomboid-like protein (PARL) as pathogenic in PD based on the known protein functions and protein interaction patterns [20]. Genes, and their encoded proteins, do not play their roles in isolation, but in coordination, and should be evaluated as a part of a greater network.
In this study, the gene expression profile of GSE7621 was downloaded from Gene Expression Omnibus (GEO). Then, the differentially expressed genes (DEGs) were identified in PD samples, and Gene Ontology (GO) enrichment analysis of DEGs was performed. Additionally, differentially co-expressed genes (DCGs) and differentially co-expressed gene pairs or links (DCLs) were identified using the DCGL package in R software. Finally, the gene transcription regulatory network (GTRN) in PD was constructed, including DCLs and transcription factors (TFs) that were identified as potentially altered in disease. This study will contribute to a deeper understanding of the mechanisms underlying PD and provide new information for further study.
Material and methods
Microarray data for Parkinson’s disease
Gene Expression Omnibus (http://www.ncbi.nlm.nih.gov/geo/), which is maintained at the National Center for Biotechnology Information (NCBI), pools high-throughput gene expression data from the research community all over the world. The gene expression profile GSE7621 was downloaded from GEO, and contained substantia nigra tissue samples of postmortem brains from 9 healthy samples and 16 PD patients. These samples were prepared on an Affymetrix Human Genome U133 Plus 2.0 Array (GPL570 [HG-U133_Plus_2]).
Data preprocessing and identification of DEGs
CEL files were preprocessed using the Robust Multi-array Average (RMA) algorithm from the Affy package for background adjustment, quantile normalization, summarization, and logarithmic transformation(http://www.bioconductor.org/packages/release/bioc/html/affy.html). For each sample, the mean value of the probes was defined as the final expression value of the gene when the different probes were mapped to the same gene symbol.
T-tests were used to identify DEGs between the 9 control samples and the 16 PD samples with cut-off criteria of p < 0.05 and |log fold change (FC)| > 0.5.
GO enrichment analysis
GO analysis is common method for enrichment analysis of large-scale genomic or transcriptomic data [21]. DAVID (the Database for Annotation, Visualization and Integration Discovery (http://david.abcc.ncifcrf.gov/) is a public, high-throughput, functional annotation tool that creates an integrated data-mining environment for analyzing gene lists [22]. To explore DEGs involved in PD pathogenesis, these DEGs were input into DAVID for GO term enrichment analysis with a threshold of p < 0.05.
Identification of DCGs and DCLs
After data preprocessing, the DCGL package (Differentially Co-expressed Gene Link) in R software [23] was used to identify DCGs and DCLs with the cut-off criteria of p < 0.05 and a correlation coefficient (absolute value) > 0.6, respectively. The default values were used as parameters in the differential co-expression enrichment (DCe) function.
Construction of the GTRN and identification of key TFs
DCLs that were related to potential differential regulation mechanisms were identified according to TF-target information. The DR sort function in the DCGL V2.0 package was used to analyze the relationship between DCLs found in our study and TF-target information from humans from the University of California, Santa Cruz (UCSC) database (http://genome.ucsc.edu/) [24]. Two types of DCL were found as potential differential regulators: one that coincided with TF-target relations, and the other where both genes shared a common TF. We constructed the GTRN with TFs and target genes. The networks were visualized by Cytoscape Software (http://cytoscape.org/) [25]. The number of target genes regulated by a certain TF was used to assign the degree of each TF in the GTRN.
Results
DEGs in PD samples
We examined 19,686 genes after the data were preprocessed using the RMA algorithm in the Affy package. Then, a total of 131 DEGs, including 77 up-regulated DEGs (e.g. RELN, AKR1C3, AKR1C2, etc.) and 54 down-regulated DEGs (e.g. ICAM1, CTHRC1, EDN1, etc.), were identified using the t-test.
Function of DEGs
To investigate the potential functions of DEGs in PD, the online biological classification software DAVID was used to annotate function-related DEGs. We obtained a total of 40 GO terms under the threshold of p < 0.05. There was enrichment of DEGs involved in cell migration, including ICAM1, CTHRC1, RELN, KIT, PPAP2B, KDR, and NR2F1, as well as those involved in prostanoid metabolism, which included AKR1C3, AKR1C2, and EDN1 (Table I).
Table I
The Gene Ontology (GO) functions of differentially expressed genes (DEGs)
[i] This table shows the top 10 GO terms in order of P value from small to large. BP – biological process, MF – molecular function, CC – cellular component, ICAM1 – intercellular adhesion molecule 1, CTHRC1 – collagen triple helix repeat containing 1, CTGF – connective tissue growth factor, DNAJA1 – DnaJ heat shock protein family (Hsp40) member A1, RELN – reelin, KIT – KIT proto-oncogene receptor tyrosine kinase, PPAP2B – phosphatidic acid phosphatase type 2B, KDR – kinase insert domain receptor, NR2F1 – nuclear receptor subfamily 2, group F, member 1, AKR1C3 – aldo-keto reductase family 1 member C3, GGT5 – γ-glutamyltransferase 5, AKR1C2 – aldo-keto reductase family 1 member C2, EDN1 – endothelin 1.
Construction of co-expression network
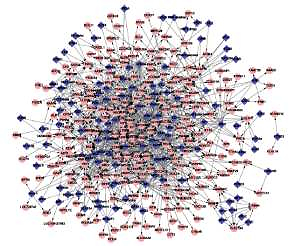
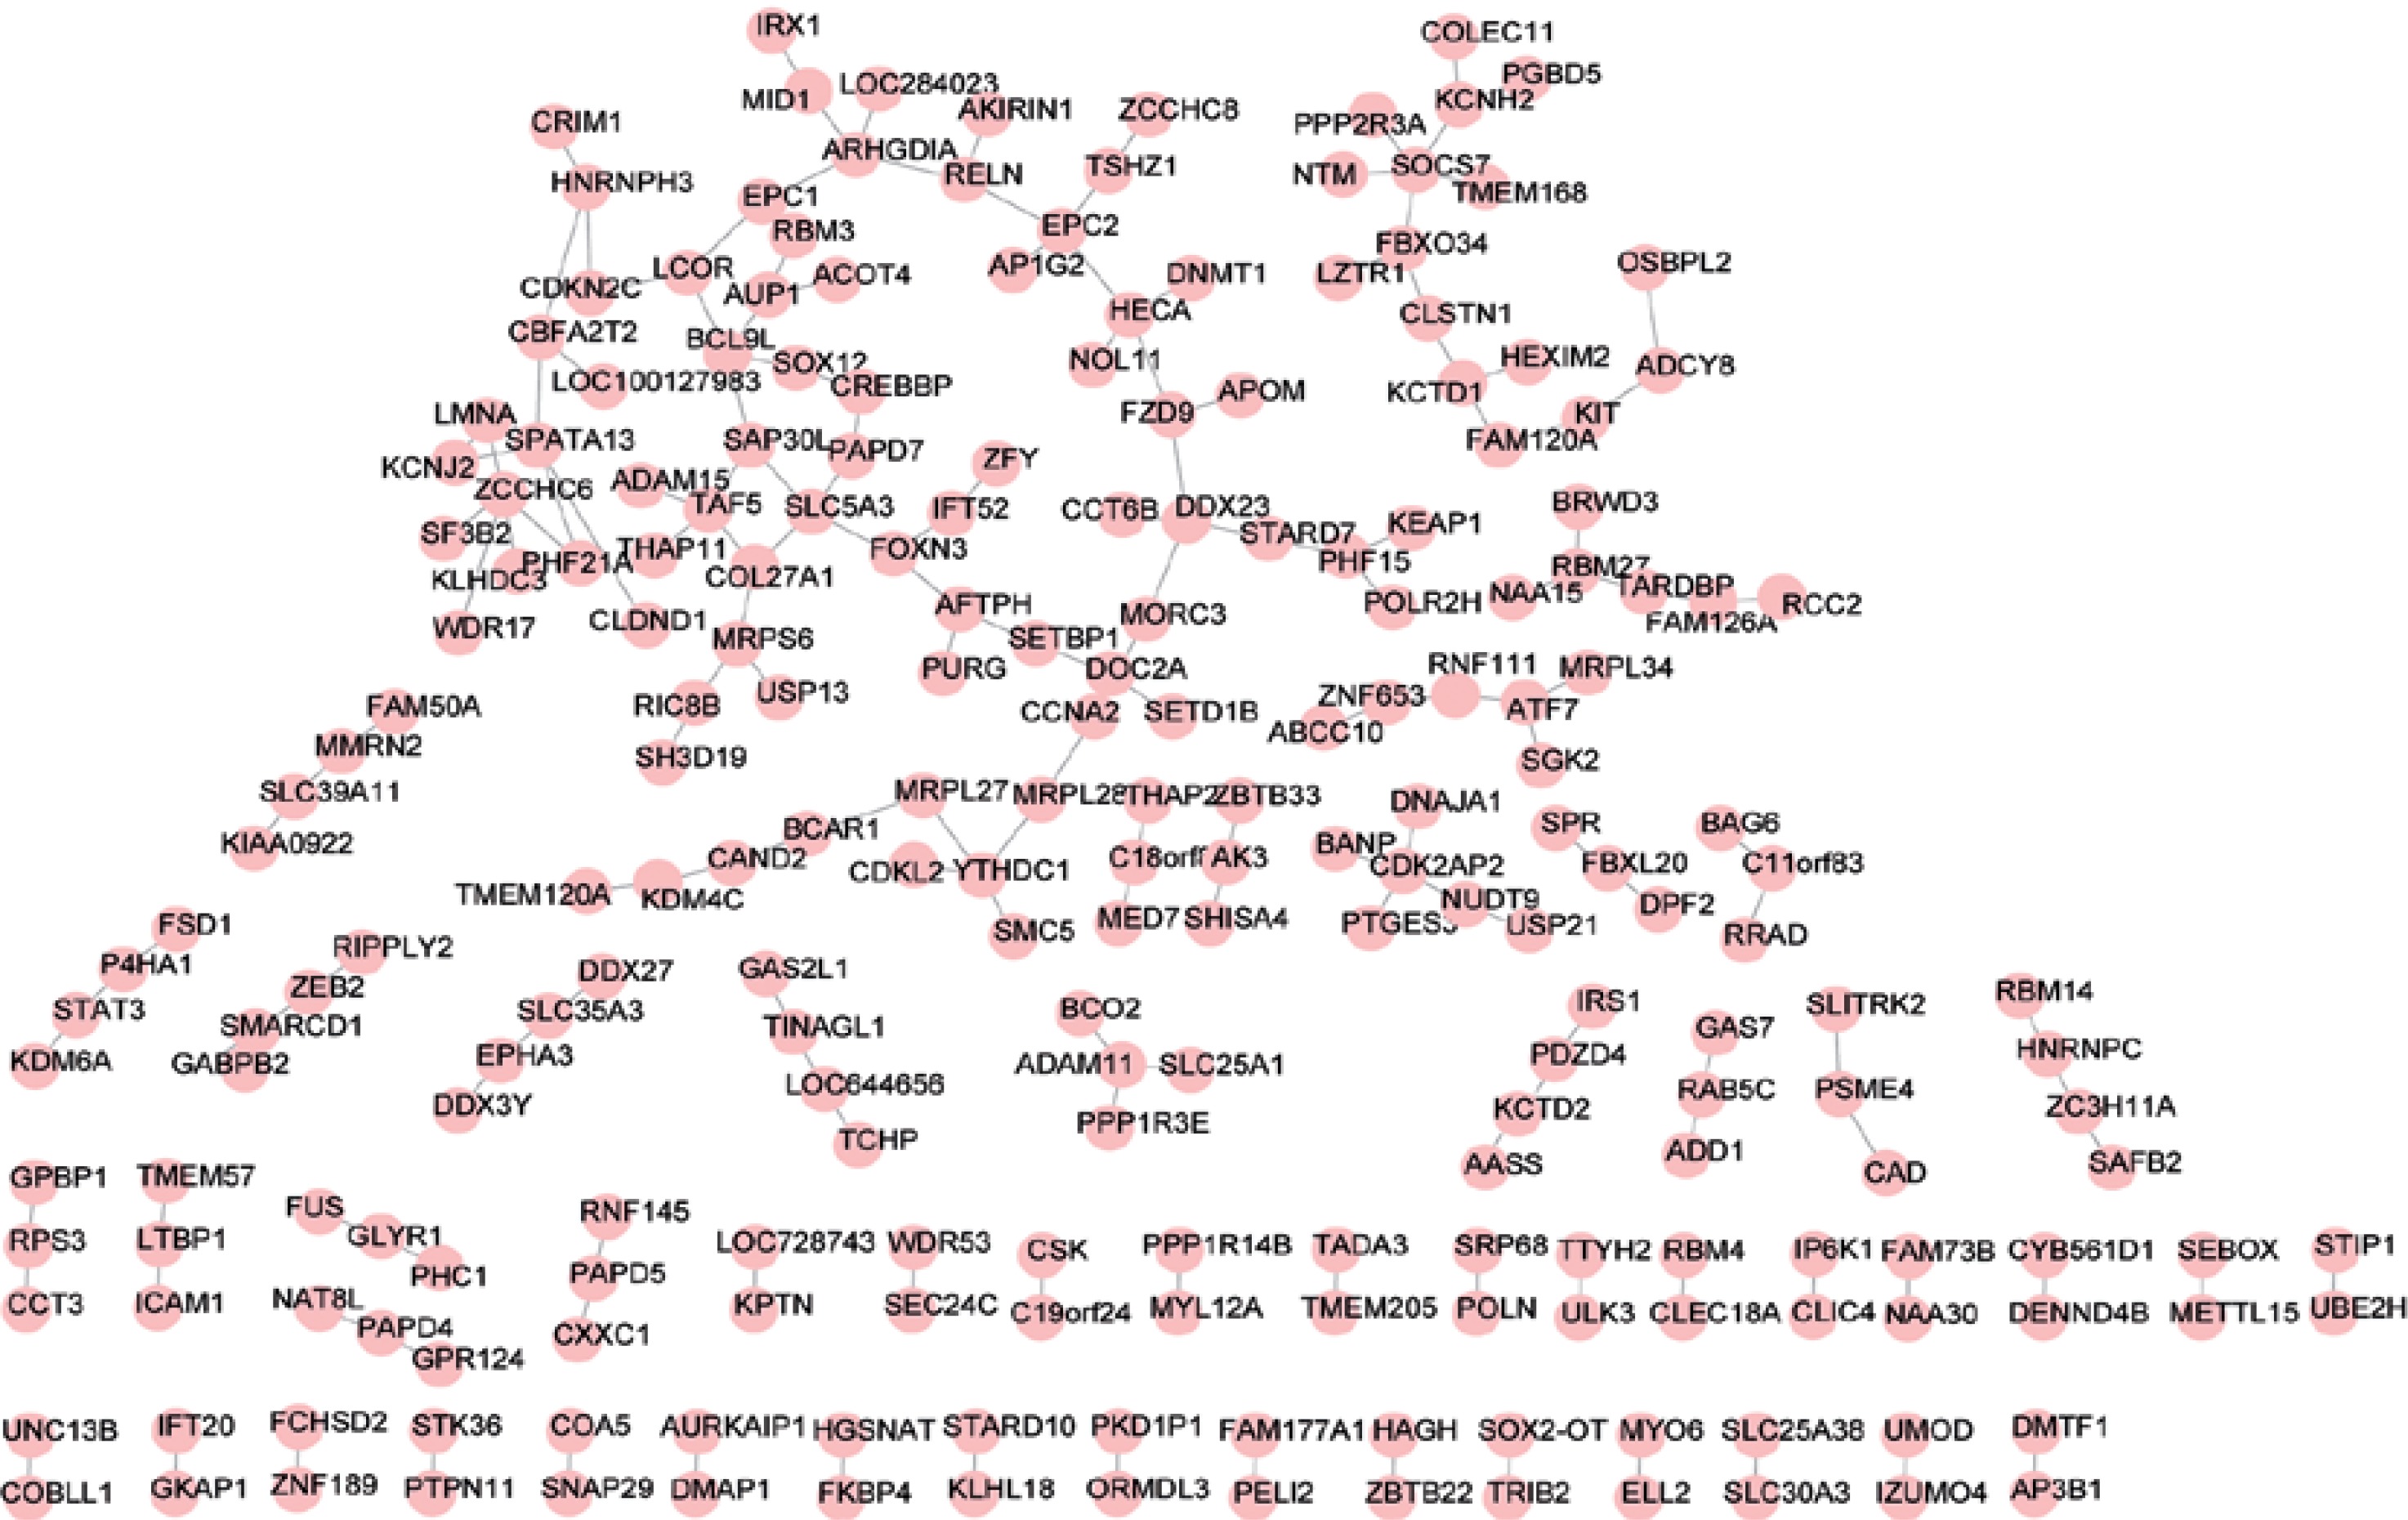
A total of 338 DCGs and 620 DCLs were identified, including ICAM1-LTBP and CTHRC1-UTP3. Additionally, the results showed that there was no coincidence with TF-target relations in these DCLs. However, 614 DCLs where both genes shared the same TF were found. We constructed co-expression networks with 230 DCGs and 614 DCLs, which are shown in Figure 1. The majority of DCLs were unassisted, as shown in Figure 2, but there were interactions in a small number. The changes seen in these DCLs may be involved in the development of PD.
Analysis of the GTRN
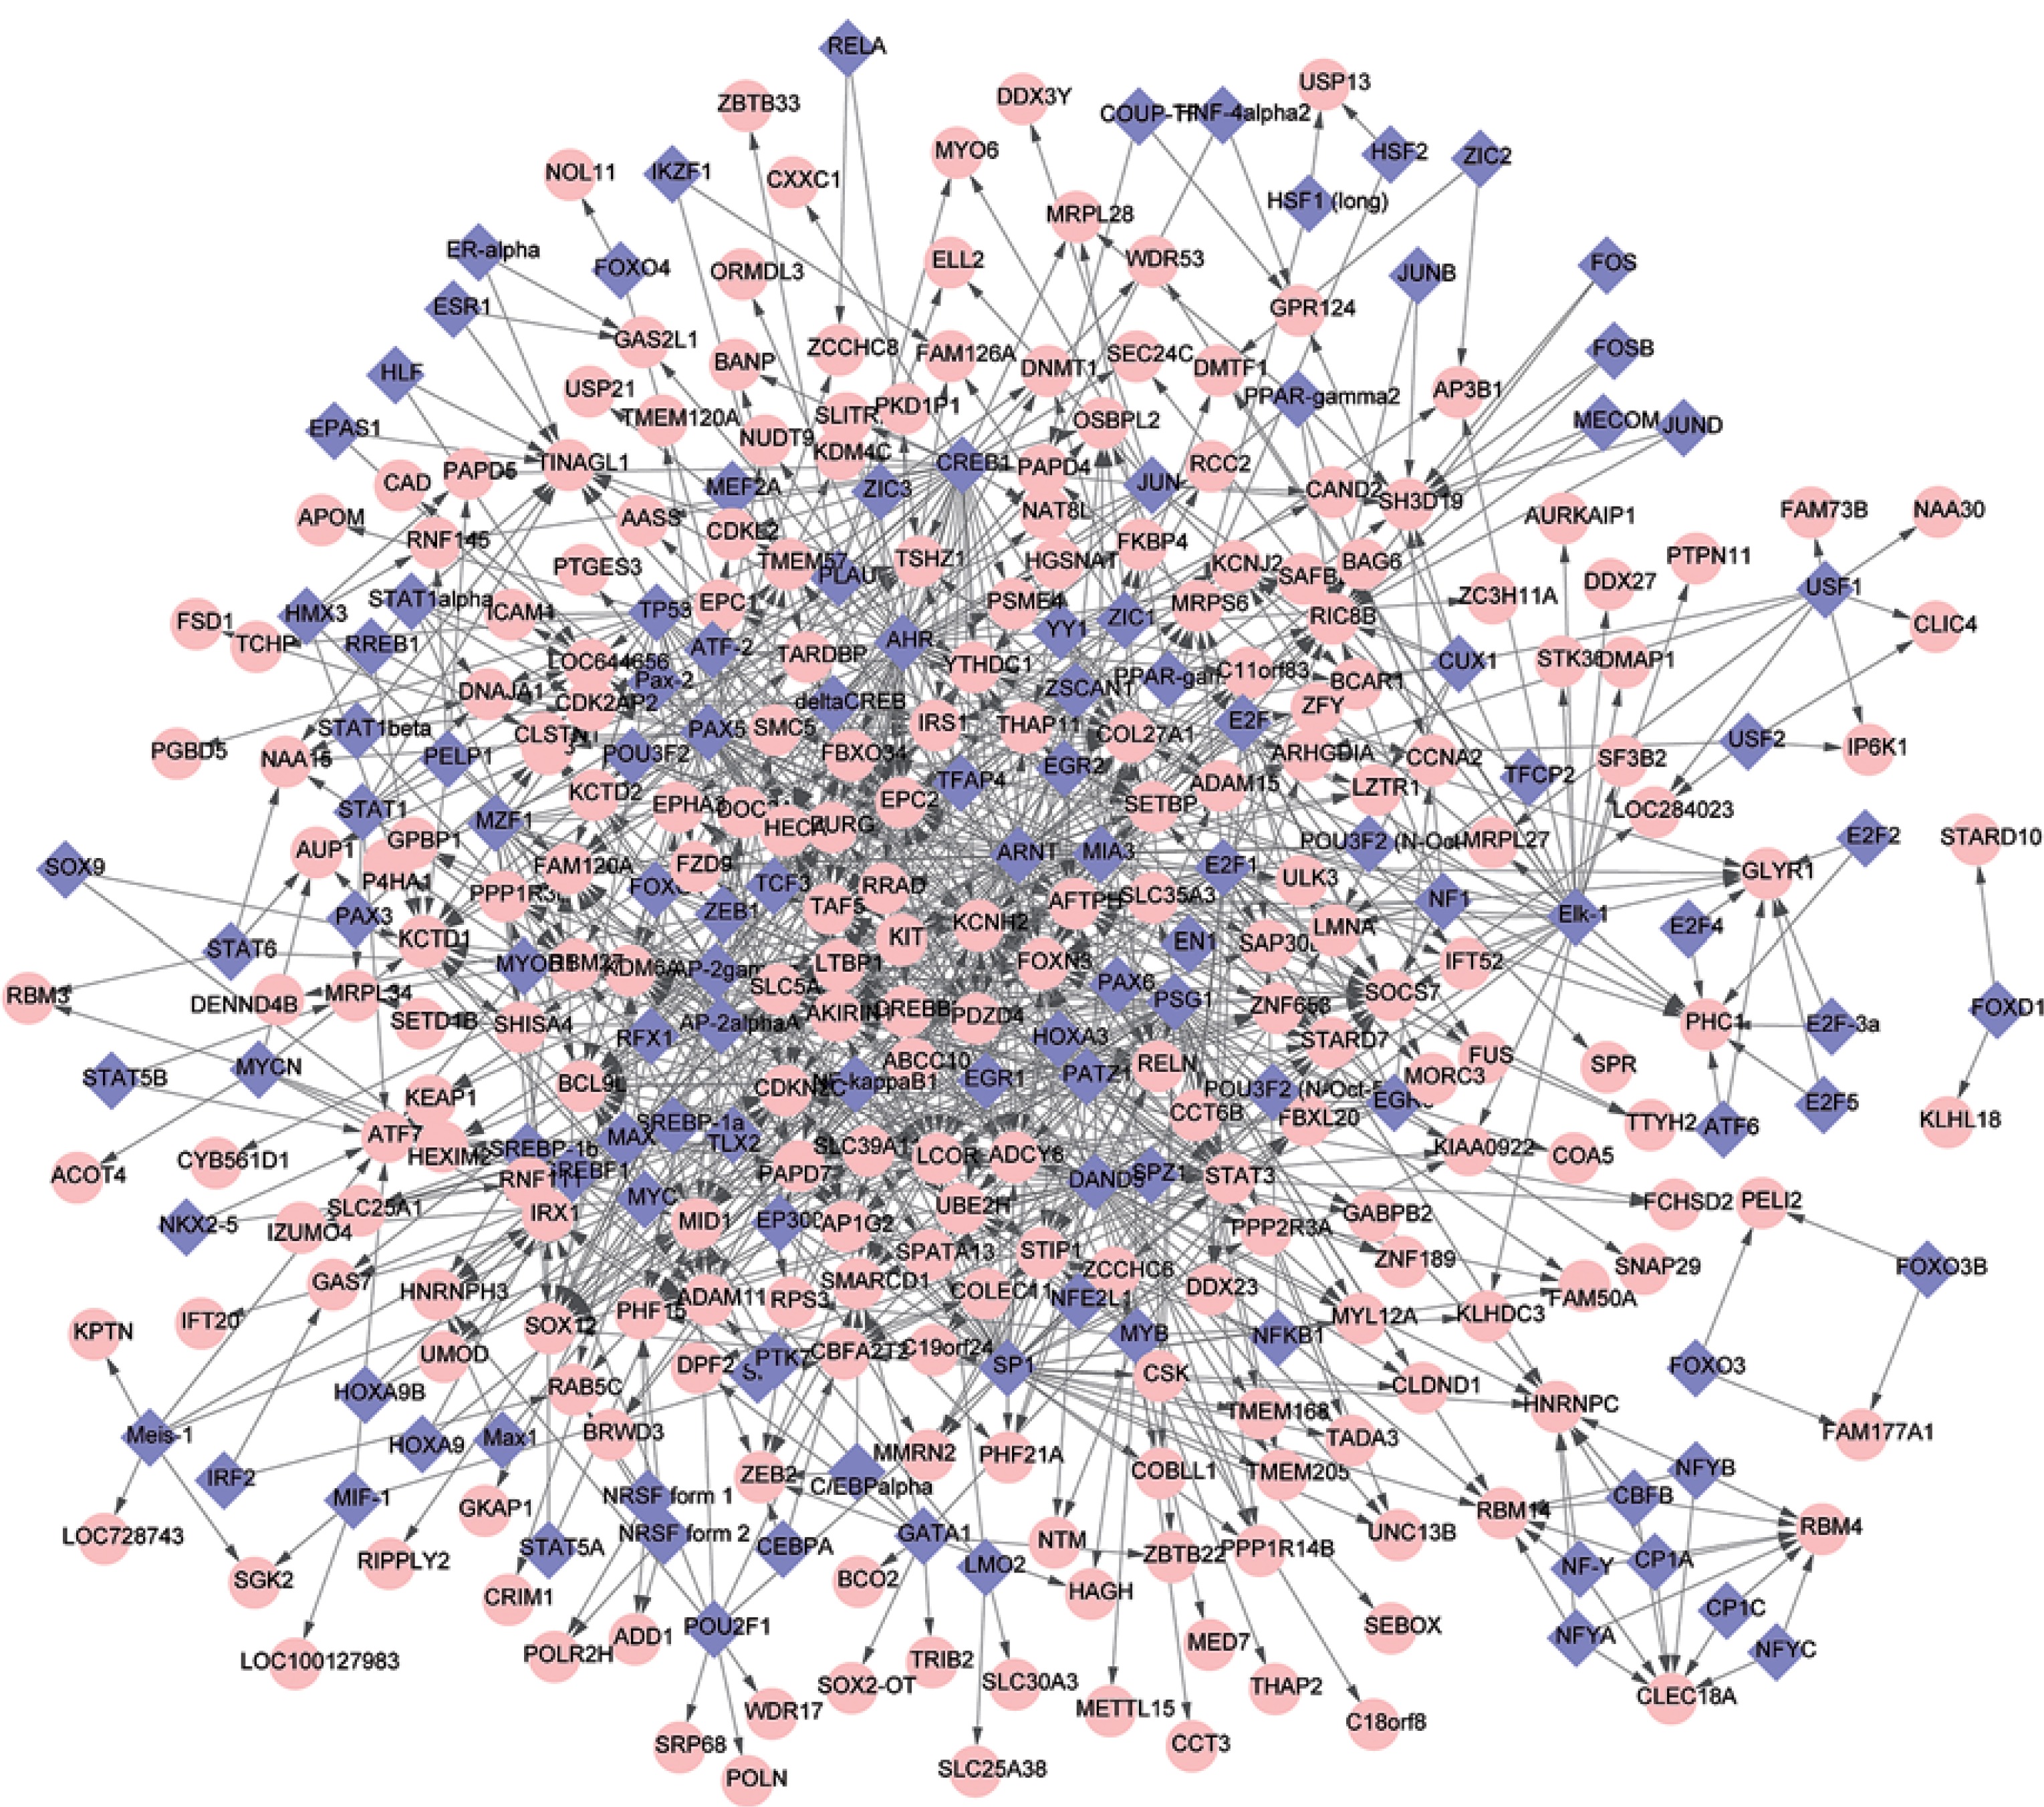
The GTRN was constructed using relationships in gene regulation in potentially altered DCLs and common TFs. There were a total of 348 nodes and 1045 DCLs in the network, including 118 TFs and 230 regulated genes (Figure 2). In this network, several genes had a higher degree, such as AHR (degree = 56), SP1 (degree = 54), and PAX5 (degree = 52) (Table II).
Discussion
The PD is the second most common neurodegenerative disease among the elderly population worldwide [26]. Age, environment, and genetics are all considered to be risk factors for PD [27, 28]. At present, there is no effective therapy in PD.
Identification of DEGs has a key role in describing the molecular mechanisms of different biological processes [29]. In this study, we used bioinformatics to propose possible biological roles of DEGs, and their protein products, in PD pathogenesis by GO analysis. We found enrichment of genes involved in cell migration, such as ICAM1 and CTHRC1, as well as genes involved in prostanoid metabolism, such as AKR1C3, AKR1C2, and EDN1. Additionally, the GTRN included 118 TFs and 230 DCGs, such as AHR, SP1, and PAX5.
ICAM1, also known as CD54, encodes a cell surface glycoprotein that is typically expressed on endothelial cells and immune cells. A previous study determined that ICAM1 increases expression of neprilysin, which can prevent, or treat, neurological diseases, including PD [30]. aSyn stimulates human U-373 MG astrocytoma cells by up-regulating both interleukin-6 (IL-6) and ICAM1 [31], and has a causative role in PD [32]. In addition, ICAM1-positive reactive astrocytes play a role in substantia nigra inflammation in PD [33]. Therefore, ICAM1 might play a key role in PD pathogenesis.
However, DEGs, and their protein products, function not only in isolation but also in coordination [34]. Some studies have used network analysis to reveal previously unknown mechanisms of PD [35]. In the present study, a total 338 DCGs and 620 DCLs were identified in the differential co-expression network, such as the differential co-expression of ICAM1-LTBP and CTHRC1-UTP3. Latent-transforming growth factor β-binding protein (LTBP) has been shown to affect activation of transforming growth factor β (TGF-β) released from neurons [36]. TGF-β plays a role in injury repair at sites surrounding brain injury. Both TGF-β1 and TGF-β2 have been shown to be significantly increased in the ventricular cerebrospinal fluid of PD patients [37]. Thus, LTBPs may play a role in the neurodegenerative cascade leading to PD symptoms and pathology. Although the relationship between ICAM1 and LTBP has not yet been characterized, we identified a clear interaction of this gene pair in PD. Additionally, the role of CTHRC1 and UTP3 in PD is also unclear, and should be further characterized experimentally.
Interestingly, genes encoding proteins involved in prostanoid metabolism were enriched in the study. Previous studies have suggested that thiamine is effective in improving the motor and neuromotor symptoms in PD [38, 39]. The properties of prostaglandin are similar to those of thiamine in many regards [40]. Thus, prostaglandin, as a signaling molecule, may play an important role in PD pathophysiology. In summary, the GO terms found to be enriched in the study could reflect the involvement of DEGs in PD. These DEGs and DCGs, such as ICAM1 and LTBP, may help elucidate and clarify pathways involved in PD pathogenesis.
Additionally, we identified a number of TFs, such as AHR, SP1, PAX5, that regulate many target genes in the GTRN of PD, and could alter target gene regulation or affect the interaction of common target genes. Synphilin-1 (SP1) is predominantly expressed in neurons, and is a component of Lewy bodies found in brains of sporadic PD patients. Importantly, SP1 reduces mutant G2019S-LRRK2 kinase activity and plays a neuroprotective role in PD pathogenesis [41]. Therefore, SP1 is related to the pathogenesis of PD. In addition, PAX5 has been shown to be essential for initiating B cell lineage commitment, and plays an important role in neural development [42]. Single nucleotide polymorphisms (SNPs) located in non-coding DNA involved in cell type differentiation, such as PAX5, were identified as risk factors for PD [43]. PAX5 regulates the DCL ICAM1-LTBP noted in this study. The TFs identified in this study should be further investigated in the context of PD,
There are some limitations of our study. First, the number of samples, including control and PD, is small. Additionally, ethnic diversity was not taken into account in our study. In the next study, more attention will be paid to minimizing these limitations. Although further experimental verification is needed, our results help to illustrate the molecular mechanisms involved in PD and may help find a novel treatment target for PD.
In conclusion, we found that ICAM1 and LTBP may play a role in PD pathology, which may lead to a better understanding of the biological processes involved in PD. Additionally, the TFs identified in this study (AHR, SP1, PAX5, etc.) may regulate many of the target genes in PD, and may alter target gene regulation or affect the interaction of common target genes.