Introduction
Hepatocellular carcinoma (HCC) is a multifactorial disorder with a poor outcome, which explains still high interest in seeking novel markers [1]. People infected with hepatitis C virus (HCV) have very high probability that they will suffer from cancer or will develop HCC in the future [2]. Imbalances in free iron level have been reported in cases of HCC related to chronic hepatitis C [3–7]. Iron acts as a cofactor for enzymes involved in a huge number of biochemical processes. However, free iron ions can produce free radicals in the Fenton reaction, resulting in oxidative stress, which in turn has been associated with cancer progression [8–11]. Chronic hepatitis C leads to iron accumulation in the liver through a very complex mechanism [12]. This can be in part due to an aberrant hepcidin transcription level caused by HCV and aberrant regulation of expression of other iron metabolic proteins, such as ferroportin (FPN1), ferritin light chain (FTL), divalent metal transporter 1 (DMT1), transferrin (TF), and transferrin receptor (TFR1) [13–16].
Ferroportin is a transmembrane protein acting as an iron transporter, moving iron out of cells such as enterocytes, macrophages, adipocytes and hepatocytes [15, 17, 18]. FPN1 can be inhibited by hepcidin, resulting in its internalization within the cell and increased cellular iron retention. Another protein, transferrin, is synthesized mainly in the liver. Each TF molecule is able to carry two ferric ions from delivery centers to cells throughout the body. The delivery system contains a transferrin receptor that binds the transferrin – 2Fe3+ complex and carries it inside the cell, where the iron ions are released. The presence of unconjugated Fe ions in the bloodstream can be extremely harmful to cells due to their high redox activity. Divalent metal transporter 1 transports ferrous ions into cells. Finally, ferritin light chain forms part of the ferritin protein complex, which serves as the main iron store in hepatocytes [19].
Iron homeostasis may be disturbed by alterations of the expression and function of microRNAs caused by infection with HCV [19]. MicroRNAs (miRs or miRNAs) are small noncoding RNA strands, typically consisting of 17-24 nucleotides, that inhibit the translation or trigger degradation of targets’ mRNA molecules [20]. It was recently revealed that the circulating miRNAs’ expression profile can be related to diseases associated with disruptions in iron metabolism, such as congenital hemochromatosis and age-related macular degeneration [21].
The present study investigates whether the profiles of miRNAs associated with iron metabolism are influenced by the development of HCV-induced HCC and its progression. Therefore, the study: 1) estimates the expression of miRNAs regulating genes involved in iron metabolism in the sera of HCC patients and healthy subjects, 2) investigates the serum level of iron-related proteins in the patients and healthy subjects, 3) analyzes the relationship between miRNA levels and the clinic-pathological parameters of HCC, 4) identifies miRNAs related to serum iron level in the patients and healthy controls, and 5) compares miRNA levels in tissue specimens of HCC and adjacent liver tissue.
Material and methods
Collection of biological samples
Tissue samples of liver tumors and unchanged tissue, which were formalin-fixed and paraffin-embedded (FFPE), as well as blood samples, were taken with approval RNN/228/11/KE of the Committee of Bioethics at the Medical University of Lodz and donors provided informed consent in line with the Declaration of Helsinki.
A total of 65 samples were taken from HCC patients, and another 65 from healthy controls were obtained during hospitalization in the Department of Surgical Oncology and the Department of Infectious and Liver Diseases and the Medical University of Lodz. Table I presents characteristics of the study groups. The peripheral blood mononuclear cells (PBMCs) and serum were isolated from all blood samples according to Szemraj et al. for analysis [21]. All samples were stored at –80°C.
Serum iron level determination
The iron level in serum samples was measured colorimetrically at 450 nm in a PowerWave XS spectrophotometer (BioTek Instruments) using the QuantiChrom Iron Assay kit (Bioassay Systems).
Protein level determination
The levels of TF, TFRI, DMT1, FTL and FPN1 proteins were measured in triplicate in serum samples by ELISA as described previously [22]. The ELISA was performed using the Human TF ELISA (Thermo Fischer Scientific), the Human TFR1 and the Human DMT1 ELISA (Biocompare), the Human FTL and the Human FPN1 ELISA (MyBiosource). For the control of protein concentration, we used the b-actin with Human Actin Beta ELISA kit (BMASSAY).
RNA extraction
Circulating serum miRNAs were isolated using the mirVana PARIS kit (Ambion) and their amount and quality were estimated by an Agilent RNA 6000 Nano kit on a 2100 Bioanalyzer (Agilent Technologies).
RT PCR analysis
The expression of 377 miRNAs for five HCC patients and five healthy controls was analyzed using the MegaplexTMRT Primers Human Pool A and B and the TaqMan Human MicroRNA Array A and B (Applied Biosystems) on a 7900 HT System (Applied Biosystems). Twenty-eight different miRNA genes, which were expressed in the cancer patients, but not in the controls, were chosen for further investigation.
miRNA conversion to cDNA was achieved by the TaqMan MicroRNA Reverse Transcription kit (Applied Biosystems) and the obtained cDNA was stored at –80°C. During the analysis using TaqMan MicroRNA Assay (Thermo Fisher Scientific), 5 nmol mirVana miRNA Mimic (cel-miR-39) (Ambion) was used as an endogenous control. The reaction was performed as follows: 2 min at 50°C and 10 min at 95°C, then 40 cycles consisting of 95°C for 30 s, 60°C for 30 s, and 72°C for 60 s. Data were analyzed in the ABI Prism 7000 sequence detection system (SDS Software). Each assay included samples without RT and cDNA. The 2–∆∆Ct method was used for calculations of relative gene expression levels [23, 24].
Statistical analysis
Paired variables were compared by the Mann-Whitney rank sum test. Spearman’s rank correlation coefficient (R) was employed to compare iron metabolism proteins and miRNA levels. Receiver operating characteristic (ROC) curve analysis was used to test the prognostic and diagnostic value of miRNA expression in the study. All tests were performed with MedCalc Statistical Software version 18 (MedCalc Software bvba, http://www.medcalc.org) and p-levels below 0.05 were considered statistically significant.
Results
Profiling of miRNA in serum of hepatocellular carcinoma patients and healthy controls
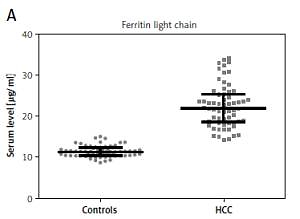
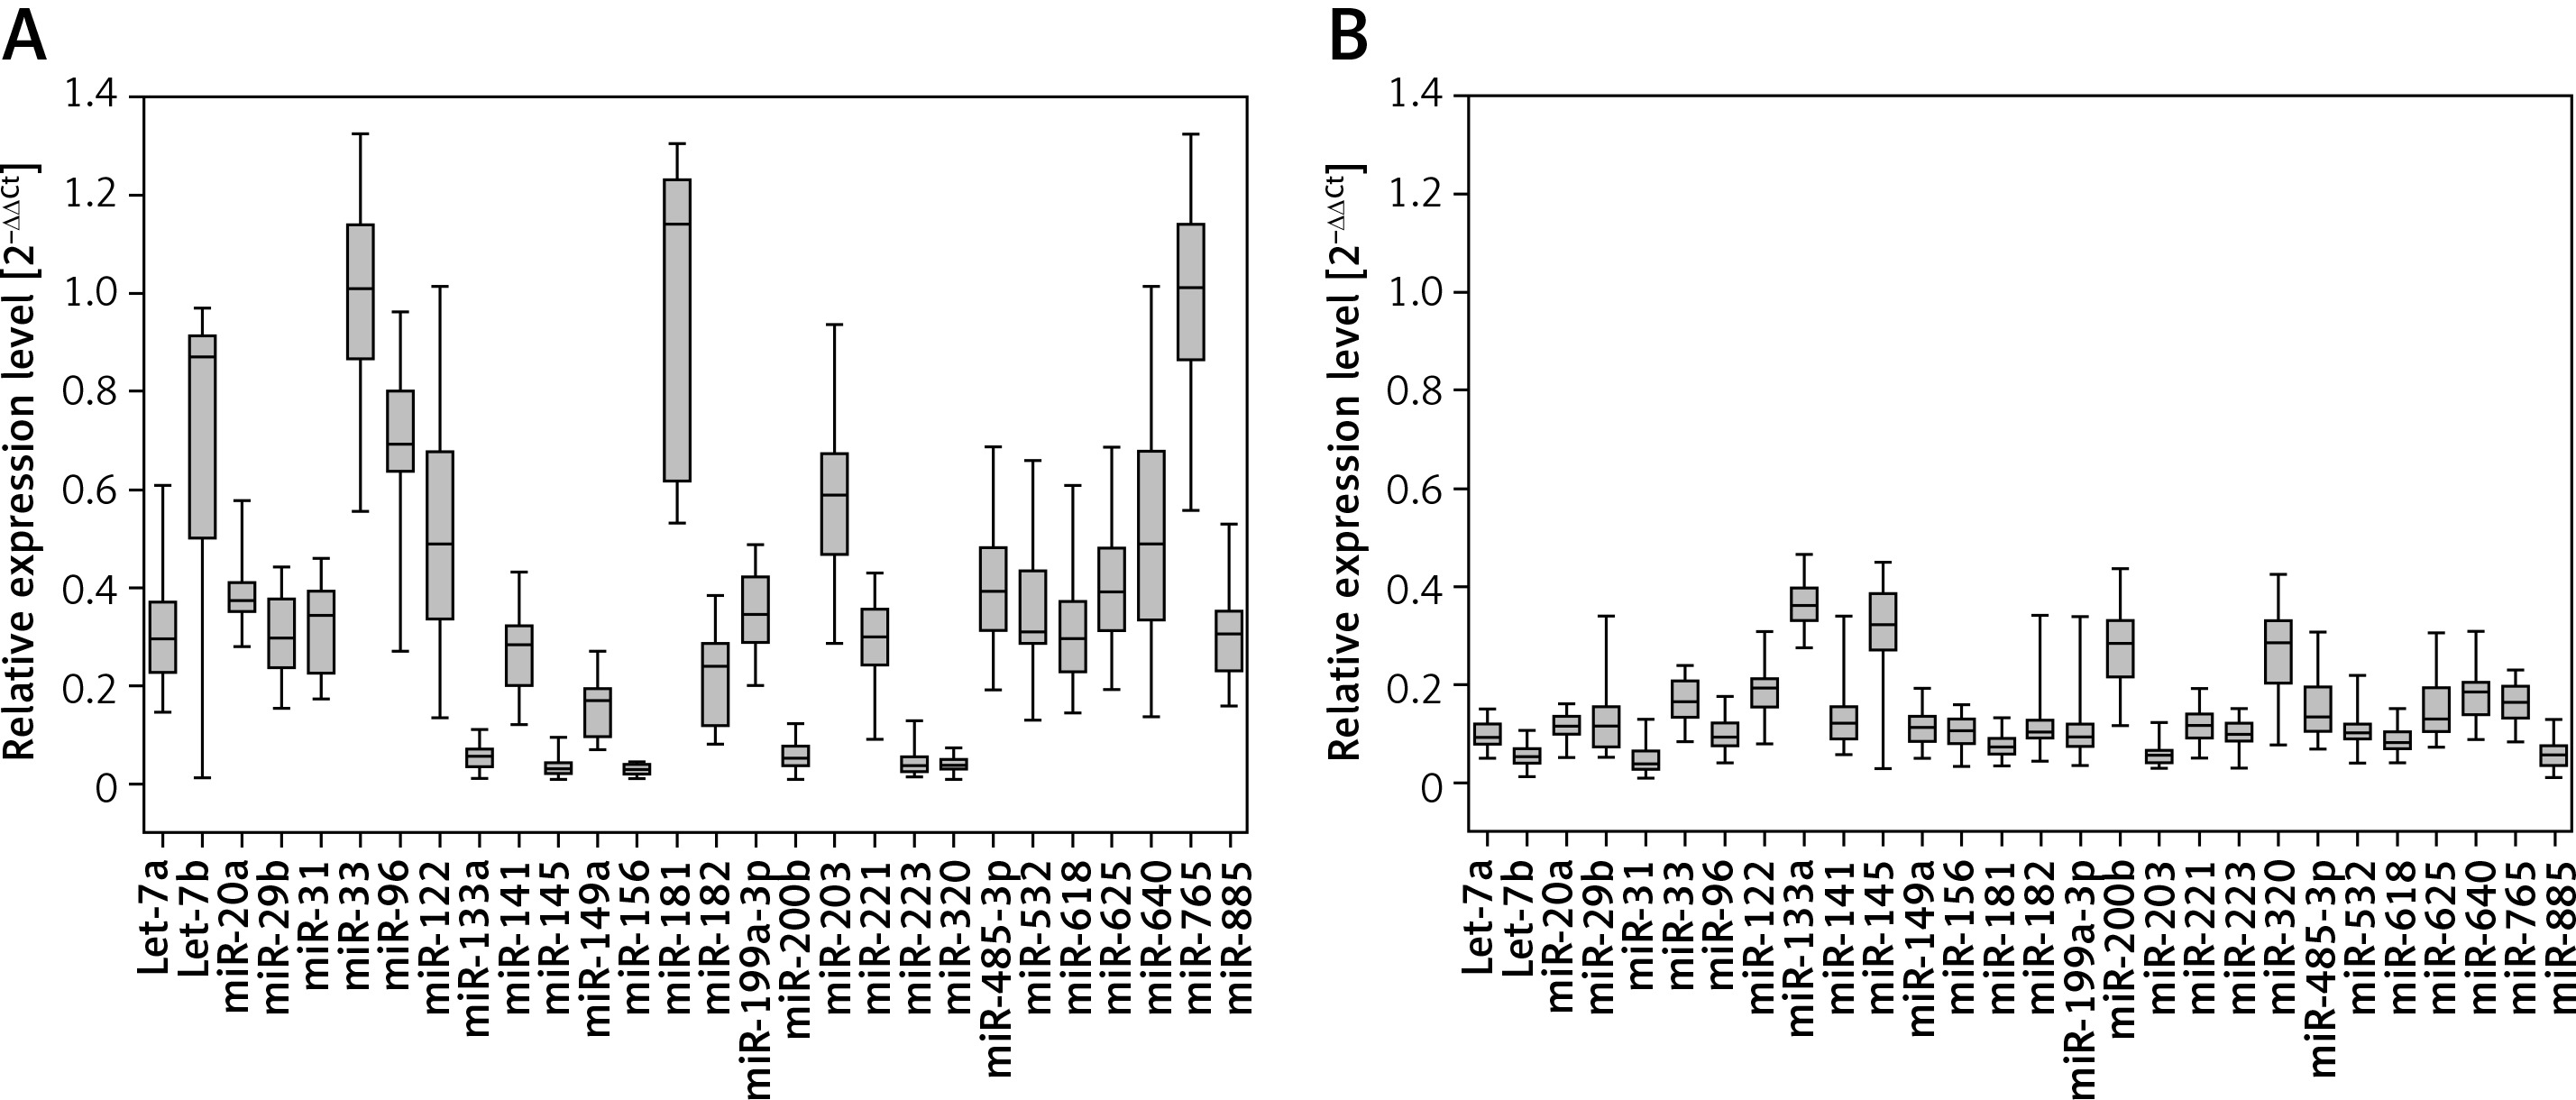
Significant differences were found in levels of 28 miRNAs between the serum samples taken from the HCC patients and healthy subjects (Figure 1 A and B; p < 0.001). Six miRNAs were downregulated in cancer serum samples as compared to controls, while the remaining 22 miRNAs were upregulated.
Profiling of miRNA in hepatocellular carcinoma and adjacent liver tissue specimens
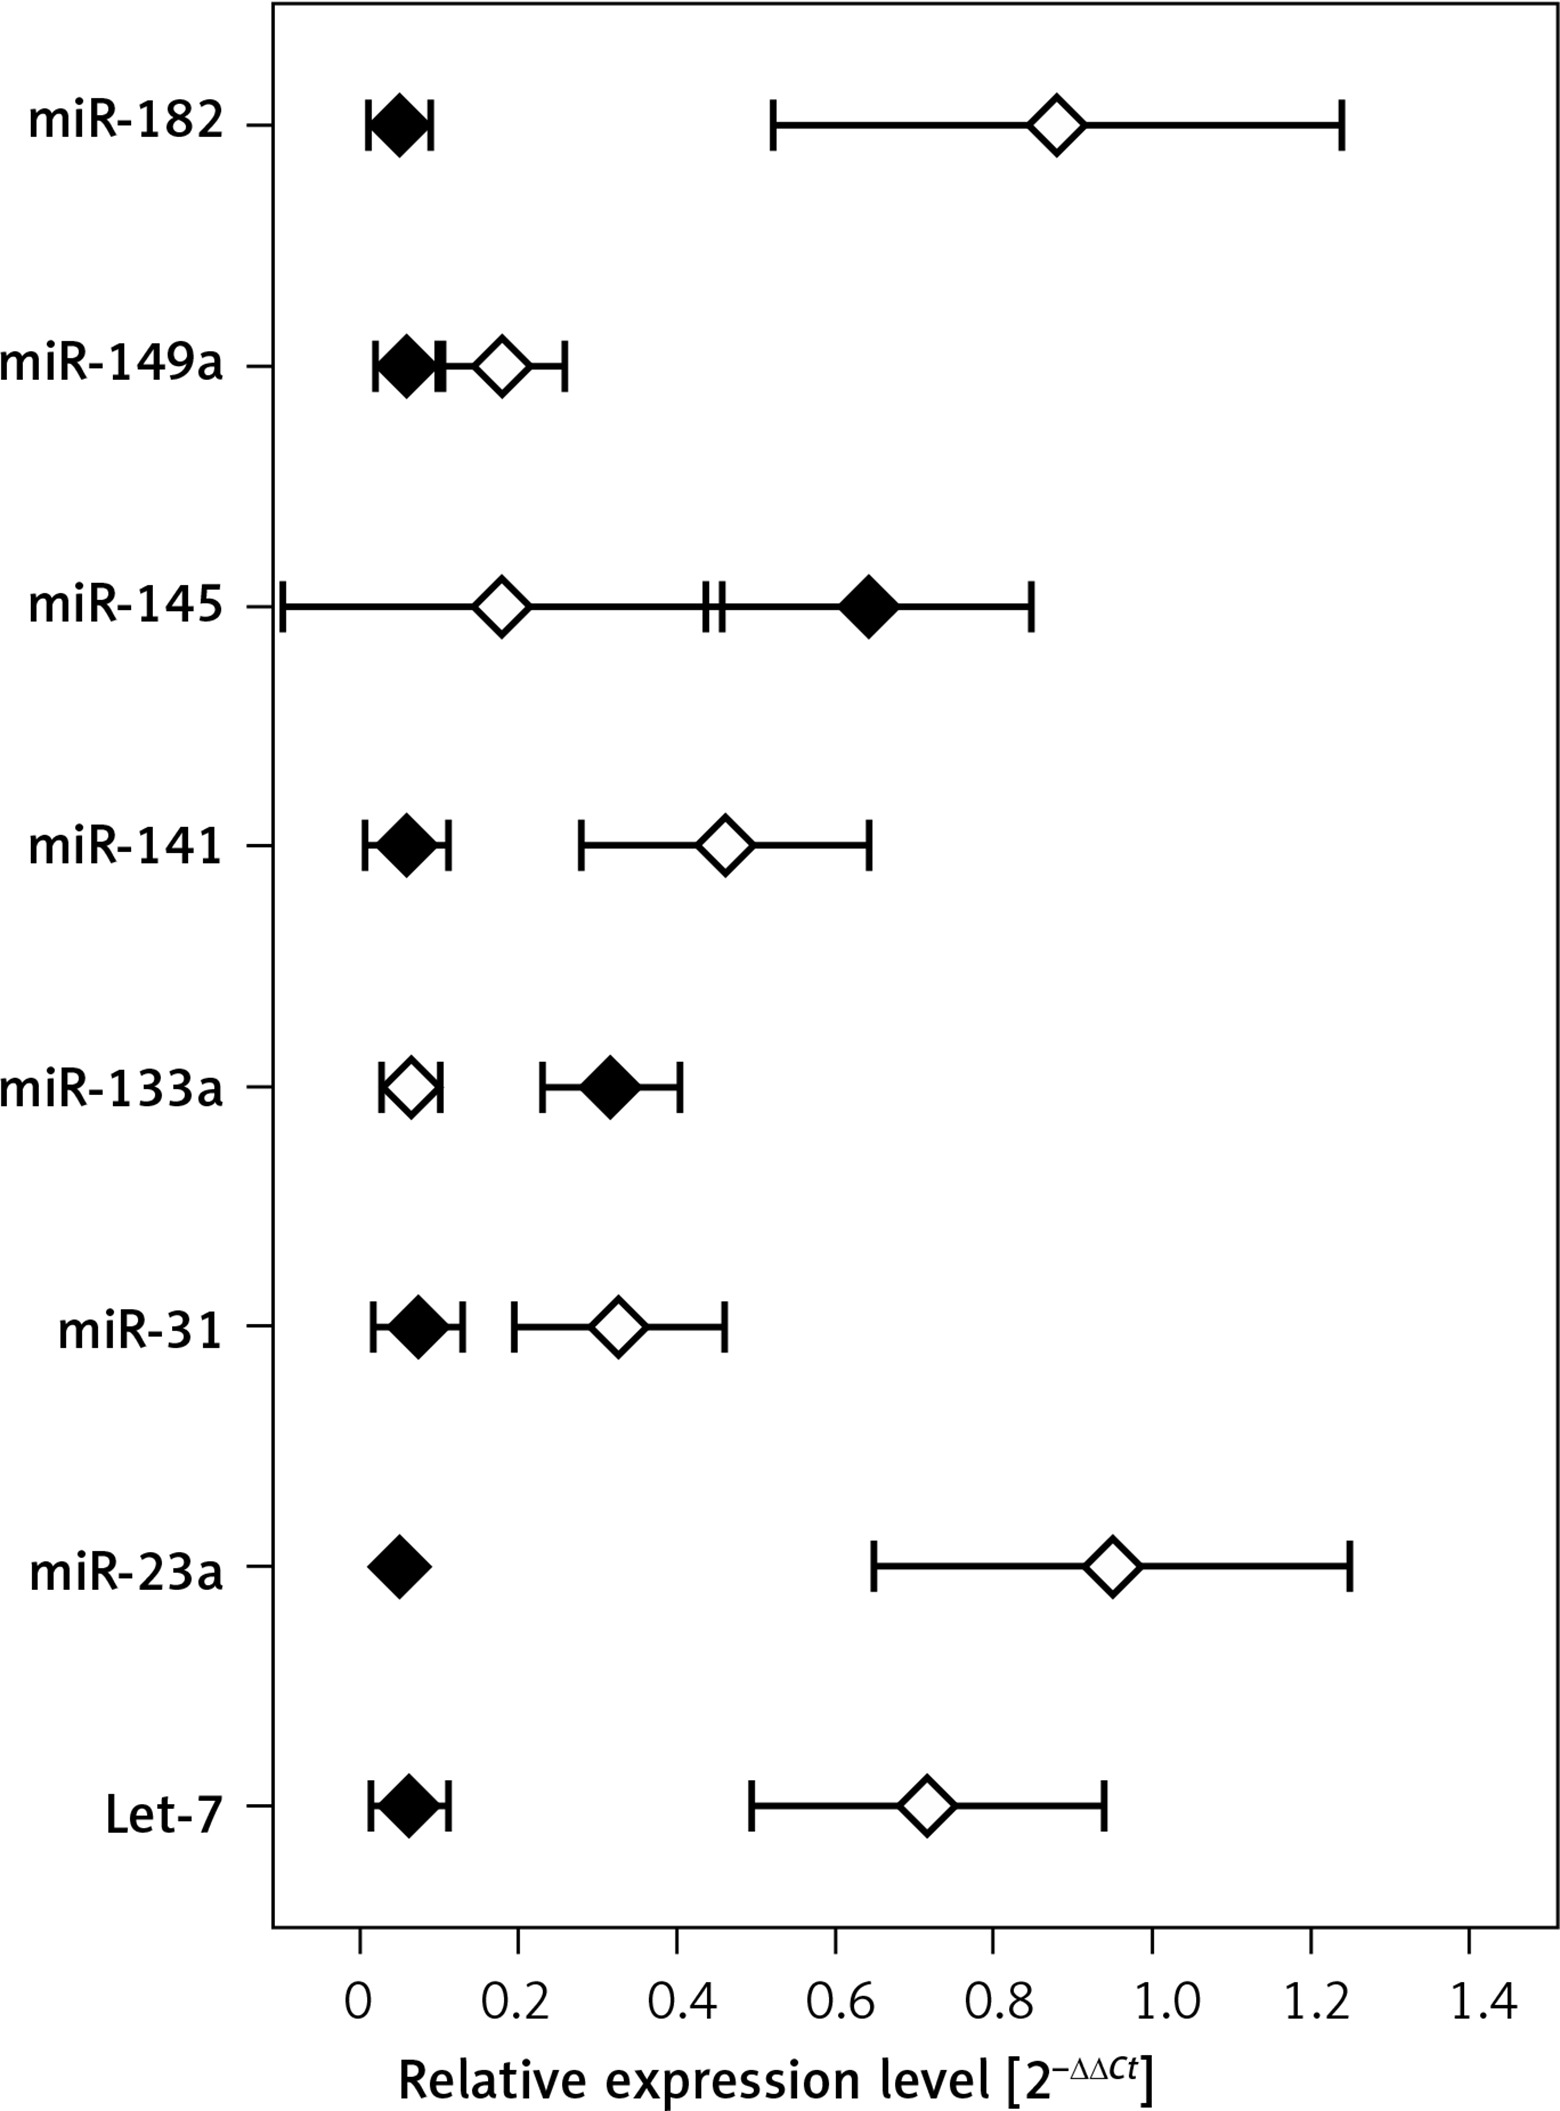
Figure 2 shows mean expression of miRNAs that significantly differed between the HCC tumors and adjacent tissue obtained from cancer patients (p < 0.001).
Levels of iron metabolism proteins in the serum of hepatocellular carcinoma patients and healthy controls
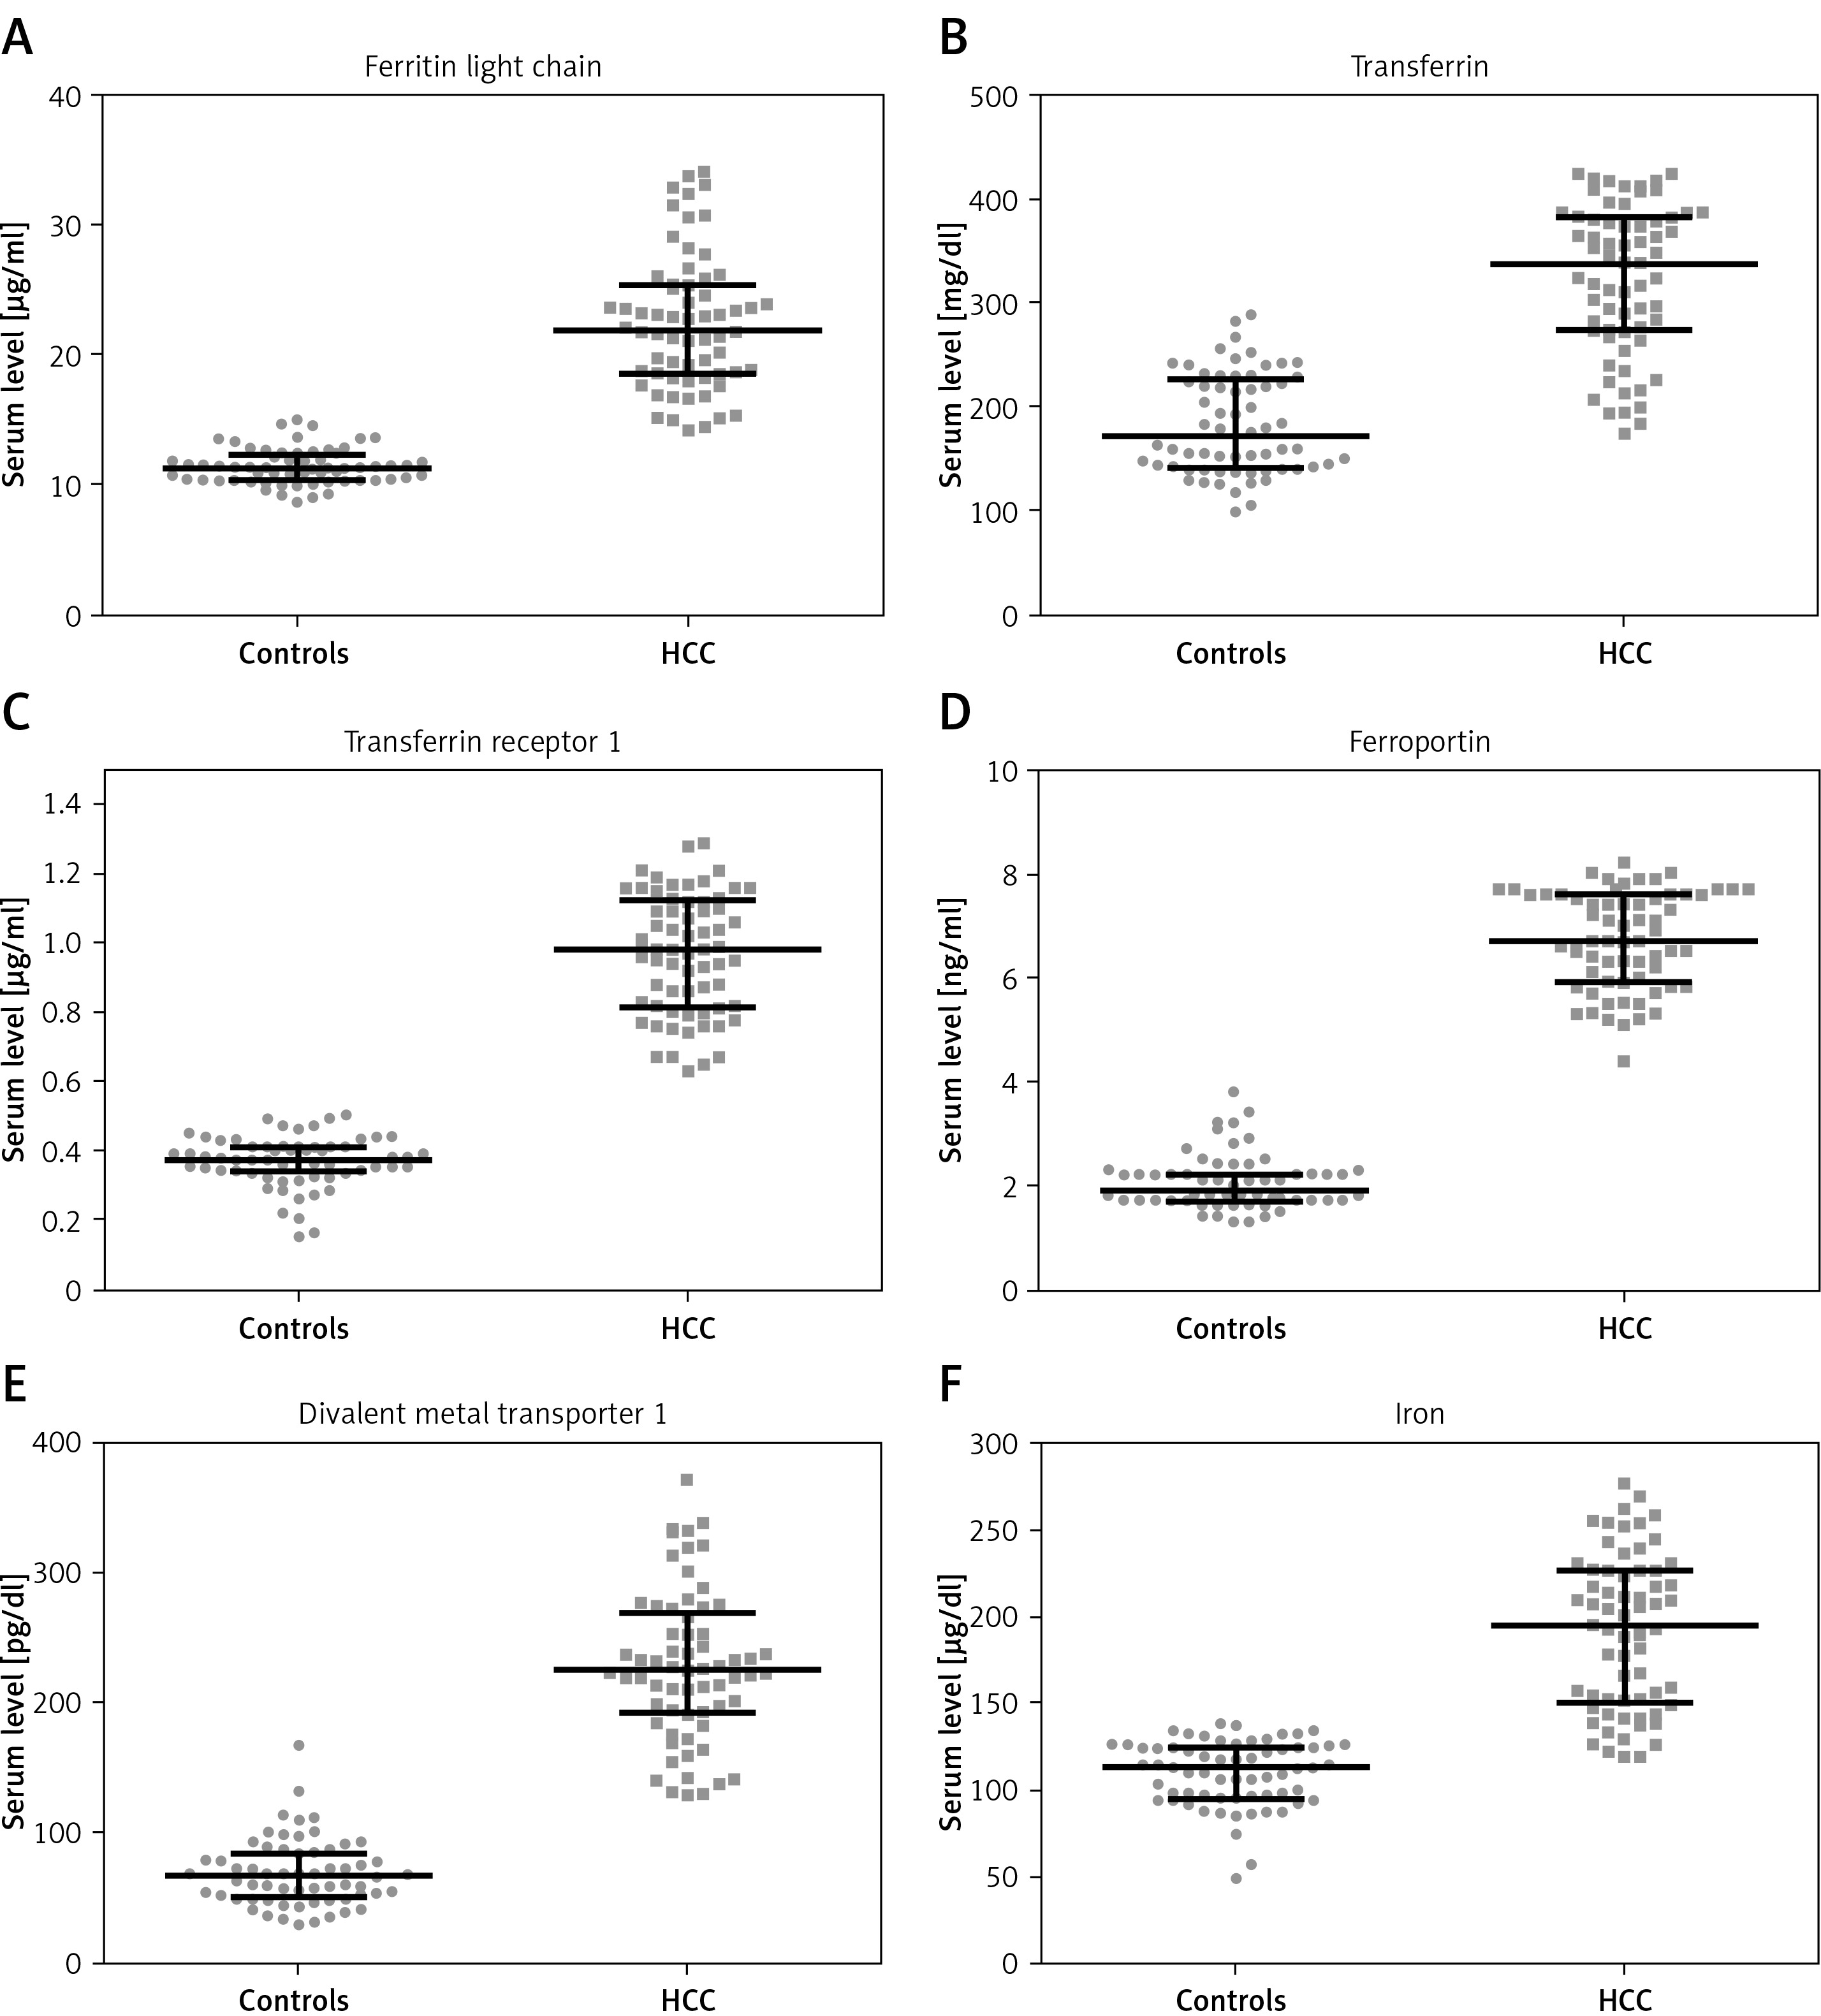
The amount of proteins involved in iron metabolism was significantly higher in HCC patients than healthy controls (Figure 3; p < 0.001).
Iron levels in hepatocellular carcinoma patients and healthy controls
Higher levels of circulating iron were observed in the patients than in healthy subjects (Figure 3 F; p < 0.001). In the control group, this level was negatively correlated with miR-96 expression level (R = –0.298, p = 0.0163). The patients’ serum iron level was not associated with miRNA expression.
ROC curve analysis of miRNA level in serum of hepatocellular carcinoma patients and healthy subjects
Results from area under the ROC curve (AUC) analysis of differentiation between HCC patients and healthy were higher for 23 of the investigated miRNAs than that for α-fetoprotein (AFP; Table II). Nine of the investigated RNAs distinguished HCC patients and healthy subjects with 100% sensitivity and specificity.
Table II
Area under the ROC curve (AUC) analysis of discrimination between HCC patients and healthy controls for serum α-fetoprotein (AFP) and miRNAs. AUC values higher than those for AFP are indicated in bold
ROC curve analysis of clinic-pathological features of hepatocellular cancer patients and miRNAs
The results of the AUC analysis of the discrimination between stage II and stage III or IV of HCC for 15 miRNAs were higher than that for α-fetoprotein (Table III). Moreover, 21 miRNAs gave higher AUC results than AFP for discrimination between G1 and G2 or G3 stage of HCC (Table IV).
Table III
Area under the ROC curve (AUC) analysis of discrimination between stage II or stages III and IV HCC patients for serum α-fetoprotein (AFP) and serum miRNAs. AUC values higher than those for AFP are indicated in bold
Table IV
Area under the ROC curve (AUC) analysis of discrimination between G1 and G2 or G3 stage patients for serum α-fetoprotein (AFP) and serum microRNAs (miRs). MiRs with AUC values higher than those for AFP are indicated in bold
Discussion
Aberrant miRNA profiles have been associated with many hepatocellular disorders including non-alcoholic fatty liver disease, insulin resistance, obesity, hepatitis B and C-associated cirrhosis and metabolic pathways related to HCC. This study investigated the expression of 28 miRs in serum samples obtained from 65 HCV-related hepatocellular carcinoma patients and 65 age- and sex-matched healthy controls and, additionally, the expression of eight miRNAs in tumor and adjacent non-cancerous liver tissue obtained surgically from the patients.
Some of the miRNAs used in the panel in the present study are involved in the HCV infection process. While Let-7b prevents the multiplication of HCV by direct interaction with its 5′UTR region, MiR-199a-3p and miR-122 promote HCV infection by supporting its replication or translation. Despite the fact that HCV does not encode any particular miRNA, it interacts with cellular miRNAs, disturbing the correct expression of genes and damaging their functioning through depression and sequestration of miRNAs [25].
All the miRNAs investigated in the current study were found to influence the expression of iron metabolism proteins, including those studied here (data not shown) [16, 21]. The patients’ blood samples were found to have an iron content almost twice that of controls, together with greater expression of iron-related proteins (Figure 3). Elevated levels of TFR1 in HCC have been reported in many studies [26, 27]. Our findings are also in agreement with previous studies indicating elevated serum iron levels in HCV-infected patients, accompanied by a high level of ferroportin [28]. This abnormal relationship between the expression of miRNAs and iron-related proteins in HCC patients indicates destabilization of the mechanisms for regulating iron concentration in HCV-related HCC patients, resulting in elevated serum iron levels.
Previous studies indicate that some of the miRNAs tested herein are related to the actions of HCV, including carcinogenesis [29]. Let-7a, Let-7b, miR-29b, miR-122 and mir-145 were downregulated in hepatocellular carcinoma specimens or HCC-derived cell lines [30–33]. While miR-122 expression was linked to HCC metastasis, mir-221 was upregulated in HCC, promoted cell cycle progression and participated in angiogenesis and cancer progression. Let-7a and Let-7b were downregulated in early-stage HCC in cancer specimens in comparison to non-cancerous adjacent liver tissues, and Let-7a expression was positively related to serum and vein invasion of HCC [34–36]. MiR-145 and 199a showed a lower level in HCC than chronic hepatitis C patients [37]. Similar results were obtained in the present study for miR-133a and miR-145 when comparing HCC specimens and adjacent liver tissues, while expression of other miRNAs was elevated in HCC tissue.
Circulating miRNAs are good candidates for cancer markers due to the availability of blood samples and relatively easy determination. Several miRNAs have previously been tested as diagnostic and prognostic factors of hepatocellular carcinoma [38]. Six miRNAs tested by us had higher expression in the serum of cancer patients than healthy patients. Among them was miR-221, the liver injury indicator. To determine whether the tested miRNAs could serve as prognostic or diagnostic factors for HCV-related HCC, ROC curve analysis was performed. The results were compared with those obtained for α-fetoprotein (AFP), a serum albumin useful as a diagnostic factor for HCC when used in combination with liver ultrasound [39]. The present study is based on a panel of 24 miRNAs that can distinguish between healthy controls and cancer patients with higher specificity and sensitivity than AFP. Among them, nine were found to have the ability to distinguish HCC patients from healthy subjects with 100% specificity and sensitivity, suggesting that they are potential diagnostic agents in this type of cancer. Our findings also indicate that another group of tested miRNAs (let-7a, miR-20a, miR-96, miR-122, mir-133a, miR-223, miR-485-3p, miR-532, miR-618, miR-625, miR-640) can be considered as auxiliary prognostic factors, indicating that HCC has reached a high stage or grade of development. However, as no miRNAs examined herein were found to demonstrate 100% specificity and sensitivity in ROC curve analysis, none can be considered as an independent prognostic factor for HCC.
The obtained data can be of great clinical importance regarding hepatocellular carcinoma in the near future, provided additional experiments are carried out. Namely, the relatively small number of participants analyzed in our study is an obvious limitation, which is why further research based on larger populations is indispensable to confirm the diagnostic significance of our miRNA panel.
In conclusion, this is the first study to investigate such a complex panel of miRNAs related to the regulation of iron metabolism protein expression in HCV-related HCC in a Polish population. Patients with hepatocellular carcinoma display a disrupted profile of miRNAs related to iron metabolism. miR-20a, miR-31, miR-33, miR-96, miR-133a, miR-181, miR-203, miR-320 and miR-885 can be considered as independent diagnostic factors of hepatocellular carcinoma. Further research on larger populations is necessary to confirm our results.