Introduction
Telomeres are protective heterochromatic structures formed by DNA tandem repeats bound by specialized protein complexes, that cap the end of linear chromosomes and play a key role in maintaining genomic integrity [1]. Most somatic tissues lack telomerase activity and in the absence of compensatory mechanisms show progressive telomere shortening, leading to loss of chromosomal stability, senescence and apoptosis [2]. Telomeres are dynamic structures, showing differences in diverse tissues. Their maintenance and shortening is a complex process which could be influenced by genetics and epigenetic mechanisms [3, 4]. Several environmental factors might contribute to telomere shortening, including oxidative stress, inflammation or psychiatric conditions [5–7]. Telomere dysfunction and defects in telomere maintenance could contribute to a higher risk of many aging-related diseases [8], and as some studies found that telomere length (TL) of leukocytes could predict mortality [9, 10] and longevity [11], it was suggested as a potential biomarker of biological aging [12, 13], yet the exact relationship between TL and aging is not fully understood [14].
Mitochondrial DNA copy number (mtDNAcn) was also proposed as a marker of cellular aging [15]. Mitochondria are fundamental ATP-generating organelles, playing a crucial role in both metabolic homeostasis, cellular differentiation, proliferation and apoptosis [16]. Each mammalian cell harbours hundreds to thousands of mitochondria in their cytoplasm, and each organelle contains two to ten copies of circular mitochondrial DNA [17]. With advancing age, more reactive oxygen species (ROS) are produced by mitochondria, resulting in accumulating mtDNA damage, leading to defects in mitochondrial function, and consequently to cellular dysfunction and senescence, contributing to a wide range of pathologies [18, 19]. Because of the close proximity to the main cellular source of ROS, mtDNA could be easily damaged [20], and it was found that an altered mtDNA sequence could cause several mitochondrial disorders [21]. Furthermore, mitochondria alter their DNA copy number as a compensation for mtDNA damage. Several studies have suggested that alterations of mtDNA copy number could be associated with a number of diseases, such as different types of cancer, cardiomyopathy, diabetes, neurodegeneration, rheumatoid arthritis and infertility [22–26]. Both genetic and environmental factors have been reported to correlate with mtDNA copy number by recent studies [27–29]. Mitochondrial DNA copy number decline has been referred to as a seemingly valid marker of cellular aging, although the literature remains inconsistent [30].
It has been suggested that co-regulation of TL and mtDNAcn may be important in the pathophysiology of several human diseases, and functional links were proposed, but the relationship is still not completely understood [30, 31]. Although population-based studies focusing on the possible co-regulation of mitochondria and telomere length have only recently started and have been limited in number so far, associations were reported both in health and disease [30, 31], which could highlight the potential of mtDNAcn and TL as candidate biomarkers. The aim to identify relevant biomarkers that could help in the early diagnosis of frequent pathologies, such as cancer, cardiovascular disorders or diabetes, has been in the spotlight of recent research [32–36].
Twin studies provide unique opportunities to disentangle genetic and environmental factors that contribute to the variance in a certain phenotype [37, 38]. The aim of our study was to investigate the relationship of mtDNA copy number, telomere length and clinical data, besides assessing co-twin similarities of monozygotic (MZ) and dizygotic (DZ) twin subjects for their mtDNAcn and TL measures. To the best of our knowledge, we are the first to examine the relationship of mtDNAcn and TL in MZ and DZ twins.
Material and methods
Study subjects and design
A total of 142 twin volunteers, comprising 96 monozygotic (48 complete pairs) and 46 dizygotic twins (23 complete pairs), members of the Hungarian Twin Registry [39], were enrolled and included in the analysis. The mean age of participants was 50.54 ±15.43 years (range: 20–75 years). Medical history was taken, blood pressure and heart rate were measured, and fasting venous blood was drawn for serum glucose, renal function, lipid profile and C-reactive protein (CRP) measurements. An hour after awakening, peripheral blood was drawn, always at the same time for both members of a twin pair. Blood was collected and transferred for molecular biology examinations.
The subjects in the selected sample were in generally good health, and none of the subjects had any acute clinical condition or were diagnosed with any type of cancer. Exclusion criteria included pregnancy or foreseeable lack of compliance with test procedures.
All experiments were performed with the understanding and consent of each subject, with the approval of the appropriate local ethics committee (Ethical Committee of Scientific Research of Hungary, Semmelweis University ETT-TUKEB 30/2014, ETT-TUKEB 3583-3/2015/EKU).
Blood collection and PBMC isolation
Venous blood samples were collected in 9 ml ethylenediamine tetraacetic acid (EDTA) tubes (EDTA tube, Greiner Bio-One). Peripheral blood mononuclear cells (PBMCs) were extracted applying density gradient centrifugation (830 g for 20 min at 20°C), and the blood samples were layered over the Ficoll-Paque (Sigma, St. Louis, USA). Following centrifugation, buffy coat was obtained, and after aspiration washed with PBS. The pelleted PBMCs were resuspended in fetal calf serum that contained dimethyl sulfoxide (10%) and the samples were frozen at –80°C until analysis.
Telomere length and mtDNA copy number
DNA was isolated using the QIAamp DNA Blood Mini Kit (Qiagen Inc., Valencia, CA) according to the manufacturer’s protocol. DNA samples were measured using a NanoDrop spectrophotometer (Thermo Scientific, Wilmington, DE). Absolute telomere length and absolute mitochondrial DNA copy number were estimated using quantitative polymerase chain reaction (qPCR) as previously defined [40] with minor modifications [41]. First the mtDNAcn was measured by calculating the ratio between the amount of mtDNA (Cytochrome b (MT-CYB)) and that of a single-copy gene (albumin (ALB)). Telomere length was calculated as the number of telomere repeats relative to that of a single-copy gene (ALB) used as a quantitative control, relative to a reference sample. All qPCR reactions were completed using the StepOnePlus Real-Time PCR System (Applied Biosystems, Foster City, CA) with TaqMan Universal Master Mix II, no UNG (Applied Biosystems, Foster City, CA). Three qPCRs were accomplished to quantify copy numbers for telomeres, MT-CYB and ALB.
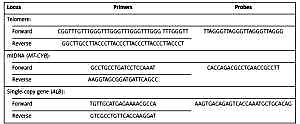
The primer and probe sequences (Table I) were previously defined [40–43]. The probe had a fluorophore at the 5′-end, 6-carboxyfluorescein and a quencher at the 3′-end, 3′ non-fluorescent quencher – minor groove binder. Primer concentrations were 100 nM and cycling conditions were: 10 min at 95°C, followed by 45 cycles of 95°C for 15 s, 60°C for 1 min. During the analysis in the case of each sample triplicated runs were applied, using 20 ng of DNA and classified as correct, provided the standard deviation of the Ct values were < 1 Ct (CV > 5%). For the standard curve method, 6-point serial-dilution of cloned amplicons with no template control and the same calibrator sample were used in each run to gain comparable data. The results were evaluated by StepOne Software v2.3 (Applied Biosystems, Foster City, CA). In each case the correlation coefficient (R2) was above 0.95, and the PCR efficiency was between 90% and 100%. During TL and mtDNAcn measurement, age and twin status of participants were completely blinded for all samples.
Table I
Primer and probe sequences for qPCR standard curve method
Statistical analysis
Continuous variables were expressed as mean ± standard deviation (SD) unless otherwise specified. Statistical significance was set at a probability level of p < 0.05. Logarithmically transformed data were used in the case of mtDNAcn and TL in order to approximate a normal distribution. To assess the bivariate associations between mtDNAcn, TL and available predictors, standard coefficients from a full information maximum likelihood estimated regression were presented, which also controlled for age and sex. Their interpretation is analogous to Pearson’s correlations but accounts for the lack of independence between twin pair and incidental missing data on the predictors. P-values were calculated using cluster corrected standard errors. To test the relationship between mtDNAcn and TL, the aforementioned strategy was used, and both standardized and unstandardized coefficients were presented. Additionally, a regression model controlling for all significant predictors based on the bivariate analysis was used. The analyses were conducted using Mplus 8 [44].
Intraclass correlation coefficients (ICCs) for mtDNAcn and TL were computed for the twin pairs to estimate the level of co-twin similarity. The ICCs were calculated using the residual variance proportion of a baseline and age- and sex-corrected mixed effects model. Confidence intervals were derived using a family-based bootstrap with 1000 draws. Statistical analysis was carried out by applying linear mixed effects regression models [45] using the lme4 package [46] of the software [47].
Results
A total of 142 individuals, comprising of 96 monozygotic and 46 dizygotic twin subjects were included in the analysis. DNA was isolated from peripheral blood mononuclear cells, and telomere length (kilobase per diploid cell), (kb/cell) and mitochondrial DNA copy number (number of circular DNA per cell), (pcs/cell) were analysed by qPCR standard curve method. Mitochondrial DNA content in the cohort was 201.57 ±103.73 pcs/cell, and TL was 167.35 ±84.74 kb/cell (mean ± SD). Table II details demographic and metabolic characteristics of participants, as well as mtDNAcn and TL values, stratified to MZ and DZ groups (Table II).
Table II
Demographic and metabolic characteristics of participants
[i] Demographic and metabolic data (shown as mean ± standard deviation) are presented. DNA was isolated from peripheral blood mononuclear cells, telomere length (kilobase per diploid cell) and mitochondrial DNA copy number (number of circular DNA per cell) were analysed by the qPCR standard curve method. We note that in some cases clinical data were missing for certain twin subjects due to incidental technical issues of blood laboratory assessment or missing demographic data. The numbers of MZ and DZ twins with relevant data are indicated in the ‘n’ columns. mtDNA – mitochondrial DNA, BMI – body mass index, HDL – high-density lipoprotein cholesterol, LDL – low-density lipoprotein cholesterol, LDL/HDL – ratio between low-density lipoprotein cholesterol and high-density lipoprotein cholesterol levels, cholesterol/HDL – ratio between cholesterol and high-density lipoprotein cholesterol levels, ApoA1 – apolipoprotein A1, ApoB – apolipoprotein B, CRP – C-reactive protein, SD – standard deviation, n – number of individuals.
Association between mtDNAcn, TL and clinical data
We carried out bivariate analysis and presented age- and sex-corrected standardized regression coefficients. The results of the bivariate model indicated that mtDNA copy number and telomere length were positively associated (p < 0.01) (Table III). Table III also shows that lower levels of HDL cholesterol were significantly associated with shorter telomere length (p < 0.001), while lower pulse rate and carbamide levels were associated with higher TL (p < 0.001 and p < 0.01 respectively). As for mtDNA copy number, lower hip-and waist circumference were correlated with higher mtDNAcn (p < 0.05), while higher ApoB and CRP levels were positively associated with mtDNAcn (p < 0.05) (Table III).
Table III
Bivariate association. Age- and sex-corrected standardized regression coefficients
| Parameter | mtDNA copy number estimate | Telomere length estimate |
|---|---|---|
| mtDNA copy number | – | 0.278** |
| Telomere length | 0.277** | – |
| Birth order | 0.092* | 0.037 |
| Birth weight | –0.099 | 0.042 |
| Birth week of pregnancy | 0.042 | 0.022 |
| BMI | –0.019 | –0.203 |
| Glucose | 0.021 | –0.064 |
| Cholesterol | –0.032 | 0.007 |
| HDL | –0.001 | 0.300*** |
| LDL | –0.030 | –0.194 |
| LDL/HDL | 0.034 | –0.236 |
| Cholesterol/HDL | 0.056 | –0.201 |
| Triglyceride | 0.007 | –0.041 |
| ApoA1 | –0.173 | –0.119 |
| ApoB | 0.153* | –0.041 |
| Lipoprotein A | 0.130 | –0.026 |
| Carbamide | –0.041 | –0.304** |
| Creatinine | –0.125 | 0.057 |
| Systolic blood pressure | 0.143 | –0.095 |
| Diastolic blood pressure | 0.134 | –0.062 |
| Pulse rate | –0.025 | –0.427*** |
| DM type 2 | 0.008 | 0.081 |
| Alcohol | –0.004 | 0.007 |
| Smoking (present) | 0.090 | 0.183** |
| Smoking (past) | –0.098 | –0.110 |
| Hypertonia | 0.145 | –0.069 |
| CRP | 0.126* | 0.047 |
| Sport | 0.042 | –0.085 |
| Hip circumference | –0.370* | –0.120 |
| Waist circumference | –0.373* | –0.280 |
| Weight | –0.090 | –0.210 |
| Height | –0.208 | 0.033 |
Bivariate analysis was performed to assess the possible associations of different demographic and metabolic parameters with mtDNA copy number and telomere length. The association of mtDNAcn with telomere length was also analyzed. Age- and sex-corrected standardized regression coefficients of mitochondrial DNA copy number and telomere length are presented. mtDNA – mitochondrial DNA, BMI – body mass index, HDL – high-density lipoprotein cholesterol, LDL – low-density lipoprotein cholesterol, LDL/HDL – ratio between low-density lipoprotein cholesterol and high-density lipoprotein cholesterol levels, Cholesterol/HDL – ratio between cholesterol and high-density lipoprotein cholesterol levels, ApoA1 – apolipoprotein A1, ApoB – apolipoprotein B, DM type 2 – diagnosed and taking oral medication for diabetes mellitus type 2, Alcohol – consuming maximally an equivalent of 3 glasses of beer/wine per week, Smoking (present) – currently smoking, Smoking (past) – used to smoke, CRP – C-reactive protein, Sport – exercising at least three times weekly.
Table IV shows the regression model controlling only for age and sex (bivariate columns) and for all significant predictors (multivariate columns) that were found significantly associated with mtDNAcn or TL based on the bivariate analysis of Table III. The association of mtDNAcn and TL, which do not depend on relevant controls, was further confirmed (Table IV).
Table IV
Unstandardized regression coefficients
| Parameter | mtDNA copy number | Telomere length | ||
|---|---|---|---|---|
| Bivariate | Multivariate | Bivariate | Multivariate | |
| Telomere length | 0.257** | 0.23* | ||
| mtDNA copy number | 0.3** | 0.264** | ||
| Birth order | 0.033 | |||
| ApoB | 0.017 | |||
| CRP | 0.014 | |||
| Waist circumference | –0.005 | |||
| HDL | 0.062** | |||
| Carbamide | –0.036* | |||
| Pulse rate | –0.001*** | |||
| Smoking (present) | 0.096* | |||
| Age | 0.002 | 0.002 | –0.001 | 0.002 |
| Female | –0.003 | 0.014 | –0.048 | –0.099 |
Unstandardized regression coefficients of mitochondrial DNA copy number and telomere length of twin subjects are presented. The regression model controlling only for age and sex (bivariate columns) and for all significant predictors (multivariate columns) that were found significantly associated with mtDNA copy number or telomere length based on the bivariate analysis of Table III is displayed. mtDNA – mitochondrial DNA, ApoB – apolipoprotein B, CRP – C-reactive protein, HDL – high-density lipoprotein cholesterol, Smoking (present) – currently smoking.
Not displayed in the tables, we also corrected the estimates of the bivariate analysis with the additional significant predictors, whereby the coefficients were modified from 0.277 (p < 0.01) to 0.25 (p < 0.05) in the case of mtDNAcn predicted by TL (and controls); and from 0.278 (p < 0.01) to 0.239 (p < 0.01) in the case of TL predicted by mtDNA (and controls).
Intraclass correlations for mtDNAcn and TL of MZ and DZ twins
Intraclass correlation coefficients enumerate the proportion of variation within the families of the twins, as such estimating co-twin similarity. Intraclass correlation coefficients for mtDNAcn and TL were computed for both MZ and DZ pairs respectively, to be able to compare their values, and thus assess the level of co-twin similarity.
In the case of telomere length, strong ICC values were measured for both MZ (ICC = 0.794) and DZ twins (ICC = 0.785). The ICC values for mtDNA copy number were also strong, with MZ twins (ICC = 0.758) presenting slightly higher results compared to DZ twins (ICC = 0.641) (Table V).
Table V
Intraclass correlations for mtDNAcn and TL by zygosity
| Variable | Corr. ICC | CI low | CI high |
|---|---|---|---|
| TL: | |||
| MZ | 0.794 | 0.672 | 0.885 |
| DZ | 0.785 | 0.568 | 0.905 |
| mtDNAcn: | |||
| MZ | 0.758 | 0.614 | 0.862 |
| DZ | 0.641 | 0.353 | 0.845 |
[i] The results of 96 MZ twin subjects (48 complete pairs) and 46 DZ twin subjects (23 complete pairs) are presented. For the estimation of co-twin similarity intraclass correlation coefficients are applied which indicate the proportion of variation in the sample across the families of the twins. The corresponding 95% confidence intervals are included. Corr. ICC – age- and sex-corrected intraclass correlation coefficient, CI – confidence interval, TL – telomere length, mtDNAcn – mitochondrial DNA copy number, MZ – monozygotic twins, DZ – dizygotic twins.
Discussion
Experimental evidence suggested that mitochondrial biogenesis could be modulated by the telomere – p53–PPARG (peroxisome proliferator-activated receptor γ) axis, and also by the telomerase enzyme, but the exact mechanisms are still unknown [7, 48, 49]. Along with in vitro and animal models aiming to reveal the molecular mechanisms underlying the associations of telomere and mitochondrial functions, recent population-based studies have started to investigate the connection between mtDNAcn and TL. Correlations of the two parameters have been observed during the healthy ageing process as well as in diverse pathologies [30, 41, 50–60]. It is argued that TL shortening, which is regarded as a contributor to replicative senescence, might affect mitochondrial dysfunction, and recent findings also implied complex interactions with several factors, including mitochondria-related mechanisms influencing telomere length in turn [31]. Common pathways and complicated telomere-mitochondria interplay during human ageing were also suggested, although the relationship is still not completely understood [31]. A recent report investigating the combined impact of telomere length and mtDNAcn on cognitive function of community-dwelling very old adults proposed that the combination of the two parameters might be useful for monitoring cognitive decline in older people [7].
The promise of using mtDNAcn and TL as combined biomarkers of health and disease in the future prompted us to investigate their association in the framework of a genetically controlled study design, while also assessing co-twin similarities of monozygotic and dizygotic twin subjects. Our results extend the until now modest amount of studies investigating mtDNAcn and TL simultaneously in humans. In addition, according to our knowledge, we are the first to examine the relationship between these parameters in MZ and DZ twins. The involvement of 142 twin subjects representing a wide age range gave us the opportunity to highlight the topic from a twin perspective.
Classical twin studies have served as a powerful tool in biomedical, psychiatric and behavioural research for decades. The method compares the phenotypic similarity of monozygotic and dizygotic twins to estimate the importance of heritable and environmental influences on complex trait variation [61]. The common environment involves all environmental factors that make a certain twin pair similar for a given trait, such as a shared womb, childhood experiences and early socialization or parental socioeconomic status. The term ‘unique environment’ includes all environmental factors and experiences to which only one member of the twin pair was exposed, making co-twins dissimilar, such as certain viral infections, accidents, individual life events, etc. [61].
Although the size of our sample was not sufficient for full heritability analysis using the classical twin design and structural equation modelling, still, as this study is the first of its kind, we could apply intraclass correlation coefficients for our estimations. In our pilot study ICC can be used as an indicator to assess the possible genetic and environmental contribution. We found that twins were similar in their ICC measures irrespective of zygosity, suggesting a possibly more important role of common (shared) environmental factors compared to non-shared (unique) environmental and to a smaller degree also individual genetic influences. It should be noted that while conclusive inferences cannot be drawn due to the uncertainty of these estimates (mainly owing to the low, especially DZ, sample size), it appears that common environmental factors might play a considerable role for both TL and mtDNAcn.
Another goal of the study was to investigate whether any of the presented baseline clinical data could explain inter-individual variation in mtDNAcn and TL in subjects with generally good health condition. Our age- and sex-corrected results confirmed a significant positive association between mtDNAcn and TL (r = 0.28, p < 0.01). Following bivariate estimates and correction with significant predictors, the independent positive associations were further verified. Our findings of a positive association between mtDNAcn and TL firstly shown in twin subjects were in line with recent population-based studies that also reported a positive relationship in healthy subjects [30, 51, 56]. There was an additional interesting finding of our bivariate analysis, showing that lower pulse rate was significantly associated (p < 0.001) with longer telomere length. Since endurance exercise decreases the average pulse rate, our results could support and further explain the conclusion of other studies suggesting the telomere protecting effect of regular endurance exercise [62, 63].
We acknowledge a number of shortcomings of this study. Firstly, our moderate sample size should be further increased (although we consider that the recruitment of our number of twin subjects can be regarded as substantial). We note that for the regression analysis, in some cases clinical data were missing for certain twin subjects due to incidental technical issues of blood laboratory assessment or missing demographic data. However, these were treated using advanced statistical methods and without discarding any information, such as the elimination of the person from the analysis. We also note that measuring mtDNAcn in DNA extracted from whole blood instead of from peripheral blood mononuclear cells may yield different results due to mtDNA present in platelets. In order to prevent inconsistency, DNA was extracted from PBMCs in the case of all our samples. Additionally, our confidence in the results could be lessened by the fact that these findings have not yet been supported by independent replications. The results of this pilot study underline the relevance of the topic and should inspire further investigations with extended sample sizes and by involving discordant twins, while longitudinal studies should also be encouraged.
In conclusion, based on the findings of the present twin study, confirming a positive association of mtDNAcn and TL, while suggesting a considerable role of common environmental factors influencing these two parameters, we propose that further studies should investigate the potential of using the combination of mtDNAcn and TL as possible biomarkers in health and in various specific disease conditions, by involving twins discordant for certain disease phenotypes in the future.