Introduction
According to the World Health Organization, cardiovascular diseases (CVDs) are the most common cause of death. In 2016, CVDs caused 31% of all global deaths (17.9 million people) and over 85% of these deaths were due to coronary artery disease (CAD) or stroke [1].
The annual incidence of acute coronary syndrome (ACS) in Europe is estimated at 90–312/100000 inhabitants/year [2]. Non-ST-segment elevation myocardial infarction (NSTEMI) accounts for up to 70% of ACS [3].
From 1980 to 2017, the percentage of the global prevalence of diabetes nearly doubled (4.7% to 8.5%; approximately from 108 to 484 million people) and is still increasing in the adult population. The International Diabetes Federation estimates that by 2040, over 642 million people will be affected. Type 2 diabetes accounts for more than 90% of all cases of diabetes [4].
A recent meta-analysis by Einarson et al. showed that cardiovascular disease affects up to 32% of patients with T2DM [5]. Type 2 diabetes mellitus (T2DM) remains one of the strongest risk factors for CAD and worsens the in-hospital and long-term prognosis of patients with ACS [3]. Due to diabetic neuropathy the diagnosis of myocardial ischemia can be difficult.
Biomarkers such as high-sensitivity troponin (hsTnT), creatine phosphokinase-MB isoenzyme (CK-MB), high-sensitivity C-reactive protein (hs-CRP), and N-terminal prohormone of brain natriuretic peptide (NT-proBNP) are well characterized, commonly used and often included in the diagnostic and therapeutic process of CAD. They provide an insight into the pathophysiologic mechanisms of cardiovascular and metabolic diseases.
One new, potentially important biomarker is angiopoietin-2 (Ang-2), an angiogenic growth factor involved in angiopoiesis. Angiopoietins (Ang-1, Ang-2, Ang-3, Ang-4) are a group of ligands that bind the Tie-2 receptor. Ang-2 regulates the vascular stability and maturation, and functions as an agonist of Tie-2 receptor in absence of Ang-1 and as an antagonist in presence of Ang-1 [6].
Conditions such as chronic inflammation or hypoxia induce Ang-2 expression in endothelial cells, binding the Tie-2 receptor, and therefore inhibiting angiopoietin-1, which cause destabilization of the endothelium and increase the arteriosclerosis process [7–11].
Nevertheless, the role of Ang-2 in ischemic heart disease is not clear. Some previous work found correlations between Ang-2 and CAD. Patients with T2DM without CAD are reported to have a higher Ang-2 serum concentration than healthy subjects [12].
To our knowledge, no studies have evaluated Ang-2 serum concentration in patients with NSTEMI and diabetes.
Our objective was to evaluate Ang-2 as a potential new biomarker of NSTEMI and to compare its sensitivity and specificity to well-characterized and established biomarkers in CVDs, including hsTnT, NT-proBNP, and hs-CRP in patients with NSTEMI with or without T2DM. We assessed Ang-2 serum concentration in patients with NSTEMI both with and without T2DM and compared it to patients with diabetes and no CAD history.
Material and methods
Study population
This was a multi-center, prospective study that included patients consecutively hospitalized in cardiology or diabetology wards between January 2017 and July 2017 due to NSTEMI (emergency admission), T2DM, arterial hypertension, or other cardiovascular reasons. We enrolled 138 patients (91 males – 66%) who fulfilled inclusion criteria, which were as follows: age > 18 and < 80 years, NSTEMI with or without T2DM, or T2DM without CAD.
The subjects were divided into four study groups depending on the presence of diabetes and/or NSTEMI. Group A: 28 patients with NSTEMI and T2DM; group B: 47 patients with NSTEMI without T2DM; group C: 31 patients with T2DM, without a history of CAD; group D: 32 a control group (patients without CAD and without diabetes).
The exclusion criteria used for all patients included:
– age > 80 years,
– anti-inflammatory drug usage (defined as use of these drugs for longer than a week),
– heart failure with reduced ejection (HFrEF),
– peripheral vascular diseases,
– acute or chronic kidney/liver disease (estimated glomerular filtration rate assessed with CKD-EPI (eGFR) < 60 ml/min/1.73 m2),
– aspartate aminotransferase (AST) and/or alanine aminotransferase (ALT) elevated > 2× reference value,
– cancer,
– history of myocardial and/or cerebral infarction (in 6 months prior to enrollment in the study),
– autoimmune diseases.
At the time of admission, a 12-lead electrocardiogram (device: GE MAC 1200) and echocardiography (with measurement of left ventricular ejection fraction, evaluation of left ventricular valve apparatus, device: GE VIVID E9 with M5S-D transducer) were performed.
The blood analysis included: Ang-2, hsTnT, NT-proBNP, hsCRP, glycated hemoglobin (HbA1c), lipoprotein profile, insulin, glucose, creatinine concentration (with eGFR calculated using the Chronic Kidney Disease Epidemiology Collaboration equation). If a percutaneous coronary intervention (PCI) was performed, the same blood serum analysis was repeated at discharge.
The study was approved by the Medical University of Silesia Ethics Committee and conformed to the Declaration of Helsinki. Informed written consent was obtained from every patient enrolled in the study.
Blood serum collection and analysis
Serum Ang-2 concentration was measured using enzyme-linked immunosorbent assay (ELISA; RayBio ANGPT2 ELISA Kit, RayBiotech inc. Norcross USA, Catalog #: ELH-Angiopoietin2). Serum hsCRP concentration was measured using the immunoturbidimetric method with the Advia 1800 clinical chemistry system (Siemens). Plasma NT-proBNP was assessed with a chemiluminometric method using Advia Centaur XP (Siemens). HbA1c value was analyzed with a high-performance liquid chromatography method. Serum high-sensitivity troponin concentration was measured using the chemiluminescence method.
Percutaneous coronary intervention
GRACE 2.0 score was assessed using the GRACE 2.0 ACS risk calculator at admission. Patients with NSTEMI underwent urgent (< 24 h) coronarography. SYNTAX SCORE was analyzed by means of the SYNTAX Score calculator at the time of coronarography. If the SYNTAX SCORE was higher or equal to 22 points, each patient was consulted by the heart team order to qualify for coronary artery bypass graft surgery (CABG) or PCI. In other cases, PCI of the culprit vessel was performed immediately. We compared the biomarker concentration with SYNTAX SCORE and GRACE 2.0 score, number of implanted stents and type of intervention (PCI vs. CABG).
Ethics approval and consent to participate
The ethics committee of the Medical University of Silesia gave consent for the study (KNW/0022/KB1/28/16; KNW/0022/KB1/28/I/16/17). Informed written consent was obtained from every patient prior to the study.
Statistical analysis
Normally distributed values were presented as a mean with standard deviation. Continuous variables are summarized by the median, 1st and 3rd quartile, and inter-quartile range.
To keep assumptions about data distributions to a minimum, non-parametric tests were used when possible. Comparisons between two groups with a Wilcoxon rank test, and between three or more groups with a Kruskal-Wallis test were performed.
Non-parametric correlations between variables were evaluated using the Kendal tau method.
The threshold of statistical significance for all tests was set at a two-tailed p-value of 0.05.
The prognostic accuracy of NSTEMI of analyzed biomarker concentrations was assessed using the area under the receiver operating characteristic (ROC) curve. The ROC was built based on predictions from a logistic regression model fitted for relevant biomarker variables.
All calculations and plots were performed using R (version 3.4.4) and relevant open source libraries such as dplyr, data.table, stringr, pROC, and ggplot2.
Results
Baseline group characteristics are presented in Table I. Patients in groups A, B, and C were at similar age, though the control group was significantly younger (p < 0.05). The GRACE 2.0 score did not differ between the groups with NSTEMI (107.9 ±22 in patients with T2DM and 108.9 ±22.9 in patients without T2DM). Body mass index (BMI), HbA1c, and Homeostatic Model Assessment of Insulin Resistance (HOMA-IR) were the highest in patients with T2DM (p < 0.05). The ejection fraction was lowest in patients with NSTEMI and T2DM compared with other groups.
Table I
Baseline characteristics of study groups: group A – NSTEMI and T2DM, group B – NSTEMI without T2DM, group C – T2DM, group D – control subjects
The concentrations of study biomarkers (Ang-2, hsTnT, hsCRP, and NT-proBNP) are shown in Table II.
Table II
Biomarker concentrations in study groups – median, 1st and 3rd quartile.
Ang-2 serum concentration in the study groups
The serum concentration of Ang-2 was equally elevated in groups A and B (NSTEMI with and without T2DM) and group C (patients with T2DM) but differed significantly (p < 0.05) from control subjects in group D (Table III A). We did not observe any significant change in serum Ang-2 concentration after successful angioplasty (Table III B).
Table III
A – Comparison of angiopoietin-2 levels in study groups – median, 1st and 3rd quartile. B – Comparison of angiopoietin-2 levels before and after successful PCI, median, 1st and 3rd quartile. Group A – NSTEMI and T2DM, group B – NSTEMI without T2DM, group C – T2DM, group D – control subjects
| B | ||||
|---|---|---|---|---|
| Group | Ang-2 level [pg/ml] | P-value | ||
| Before PCI | After PCI | |||
| A | 2695 (1765; 2785) | vs. | 2583 (1523; 3178) | NS |
| B | 1605 (987; 2303) | vs. | 1360 (924; 1937) | NS |
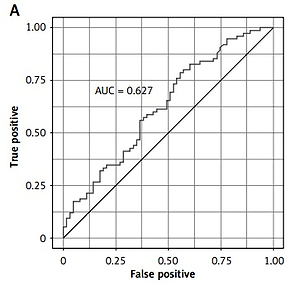
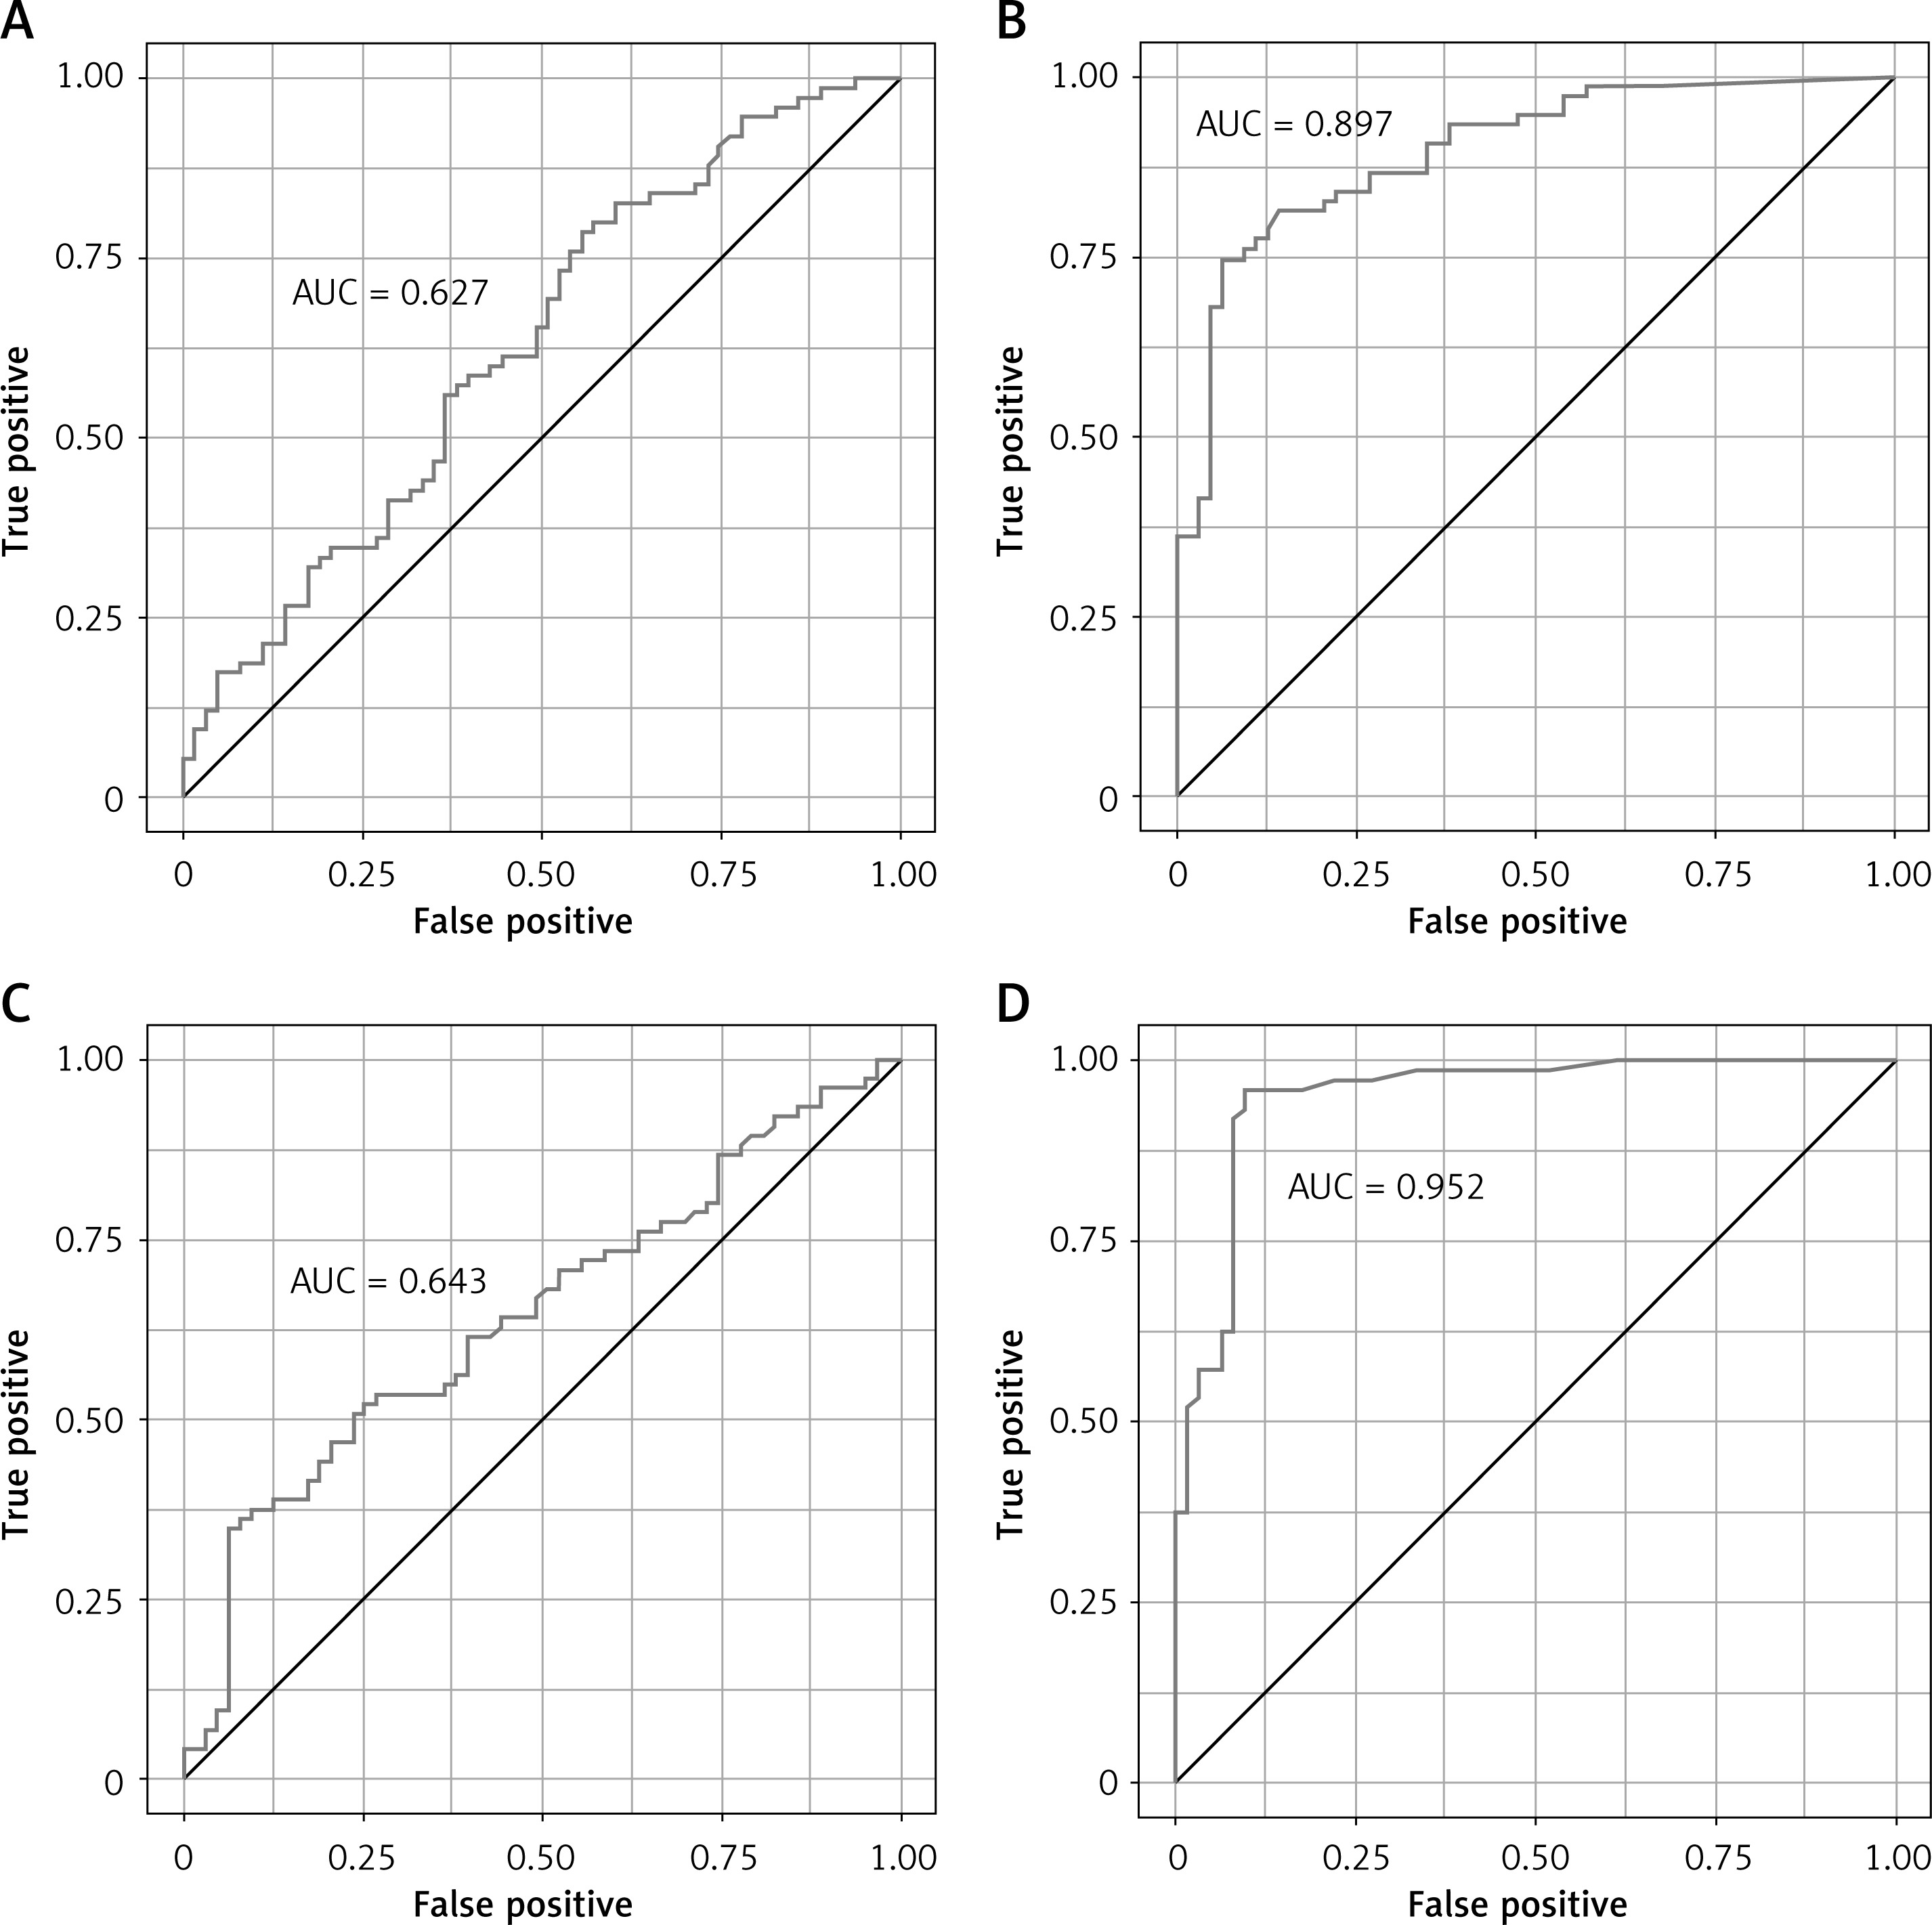
The prognostic accuracy of Ang-2 was determined with the area under curve (area under curve (AUC) = 0.63; Figure 1 A).
Figure 1
Prognostic value of biomarkers for detecting NSTEMI: A – Ang-2, B – NT-proBNP, C – hsCRP, D – hsTnT
The serum concentration of Ang-2 did not correlate with HbA1c, SYNTAX-score or type of cardiovascular intervention (PCI vs. CABG).
hsTnT serum concentration in the study groups
The hsTnT concentration differed significantly (p < 0.05) between study groups (Table II). Patients with NSTEMI (both with and without T2DM) had a significantly higher (p < 0.05) hsTnT concentration than patients with T2DM only or the control group (Table IV). In the logistic regression model hsTnT was the only biomarker that predicted the type of intervention (PCI vs. coronary artery bypass surgery) in both groups of patients with NSTEMI with and without T2DM.
Table IV
Comparison of hsTnT levels in study groups – median, 1st and 3rd quartile. Group A – NSTEMI and T2DM, group B – NSTEMI without T2DM, group C – T2DM, group D – control subjects
We also found a positive correlation between hsTnT concentration and the number of implanted stents in both groups of patients with NSTEMI. hsTnT did not correlate with the SYNTAX Score in our study population. hsTnT was found to be the most accurate biomarker for detecting NSTEMI in our study (AUC = 0.95; Figure 1 D).
hsCRP serum concentration in study groups
hsCRP had similar sensitivity of detecting NSTEMI as Ang-2 (AUC = 0.63; Figure 1 C). hsCRP concentration was significantly (p < 0.05) higher in both groups with NSTEMI and non-significantly higher in the T2DM group in comparison with the control group (Table V).
Table V
Comparison of hsCRP levels in study groups – median, 1st and 3rd quartile. Group A – NSTEMI and T2DM, group B – NSTEMI without T2DM, group C – T2DM, group D – control subjects
NT-proBNP plasma concentration in study groups
NT-proBNP concentration was also significantly different (p < 0.05) between study groups (Table II). In both NSTEMI groups, the concentration was significantly elevated in comparison with T2DM and control groups (p < 0.05; Table VI). NT-proBNP concentration was not associated with the presence of T2DM. We found that NT-proBNP measurements had the second highest prognostic accuracy for detecting NSTEMI of all biomarkers assessed in our study (AUC = 0.90; Figure 1 B).
Table VI
Comparison of NTproBNP levels in study groups – median, 1st and 3rd quartile. Group A – NSTEMI and T2DM, group B – NSTEMI without T2DM, group C – T2DM, group D – control subjects
Severity of CAD
Higher SYNTAX score was associated with the presence of T2DM – an average of 16 points in the NSTEMI and T2DM group vs. 9.5 points in the group without T2DM, p < 0.05. Also, subjects with NSTEMI and T2DM were qualified more often for CABG (25% vs. 15%; p < 0.05). PCI was performed in a similar percentage of patients in each group (group A: 46.3% vs. group B: 55.3%; p = NS). The only biomarker that correlated with GRACE Score was NT-proBNP (r = 0.49; p < 0.05).
Discussion
Biomarkers are an important part of the diagnostic process of many diseases due to their wide availability, convenient sampling, and relatively low cost. In this prospective study, we evaluated and compared serum concentrations of Ang-2 with those of widely accepted biomarkers, such as hsTnT, NT-proBNP, and hsCRP, in patients with NSTEMI and T2DM. To our best knowledge, it is the first such report in the literature.
Ang-2 serum concentration in CAD
The main finding of this study is that Ang-2 serum level is elevated in patients with NSTEMI with T2DM (1769 (1081; 2775) pg/ml), NSTEMI without T2DM (1757(1074; 2481) pg/ml) and in patients with T2DM without CAD (1993 (1161; 2608) pg/ml) in comparison with the control group (866 (552; 1214) pg/ml).
A previous study by Wang et al. suggested a link between the severity of CAD and the Ang-2 serum concentration. The Ang-2 serum concentration increased gradually with exacerbations of CAD, from stable angina (SA) (468.9 ±51.9 pg/ml), unstable angina (UA) (791.0 ±79.2 pg/ml), NSTEMI (1372.2 ±114.3 pg/ml) to STEMI (1919.1 ±88.8 pg/ml) groups, compared to the control group (198.8 ±25.1 pg/ml) [13].
In our data we found no correlation between the severity of CAD measured by SYNTAX Score and Ang-2 concentration. After the logistic regression analysis, we found that only hsTnT was a predictor of the type of intervention (PCI vs. CABG), which can be interpreted as an equivalent of severity of CAD.
Ang-2 serum concentration in T2DM
A study by Lim et al. [14], who analyzed serum concentration of Ang-2 in diabetic patients without CAD, showed that it is elevated in diabetic patients and serves as proof of endothelial damage. Ang-2 is a marker of vascular inflammation, angiopoiesis, and endothelial activation [10]. As mentioned before, our data showed a significant increase of Ang-2 serum concentration in the group of patients with T2DM without a history of CAD in comparison with the control group. The concentration increase we observed was similar as the increase in the NSTEMI group.
Ang-2 has also been linked to microvascular and macrovascular complications of diabetes. A study by Li et al. [15] proved an increase of Ang-2 concentration in patients with those diabetes complications and presented a correlation between the HbA1c and Ang-2 serum concentration. We did not observe a statistically significant correlation of any studied biomarker with HbA1c.
In our study, the patients with T2DM (group C) had a significantly higher HbA1c level than patients with NSTEMI and T2DM (8.9 mg/dl vs. 6.36 mg/dl; p < 0.05). Therefore, the worse glycemic control of patients with T2DM (group C) may explain the lack of significant difference in Ang-2 concentrations between patients with NSTEMI with/without T2DM (groups A and B) and T2DM only (group C).
According to Patel et al., Ang-2 may be suitable for assessing vascular damage and long-term outcomes in patients with CAD and T2DM. In the cited study, an elevated Ang-2 serum concentration was an independent predictor of myocardial infarction [16].
Ang-2 serum concentration before and after PCI
Zeng et al. observed a reduction of Ang-2 serum concentration after a successful percutaneous intervention (3042.63 ±1845.33 pg/ml vs. 4625.06 ±1838.06 pg/ml, p < 0.01). In our study the difference of Ang-2 serum concentration before and after PCI was not significant. It may have been caused by a smaller group sample [17].
Inhibition of Ang-2 serum concentration
A recent animal model study by Lee et al. links increased Ang-2 secretion in the infarct zone with adverse vascular remodeling and increased inflammation. The researchers stated that gene or antibody-mediated pharmacological Ang-2 inhibition reduced cardiac hypoxia, vascular inflammation, and the consequent progression of ischemic heart failure [18].
Theelen et al. reported that Ang-2 blocking antibodies reduce artherosclerotic plaque development in mice [19].
Concentrations of other studied biomarkers
The increased concentrations of other studied biomarkers (hsTnT, hsCRP, NT-proBNP) in patients with NSTEMI with or without T2DM underline the endothelial damage caused by hypoxia, vascular inflammation and angiopoiesis [14, 20].
More extensive studies are needed to evaluate Ang-2 prognostic efficacy and fully understand its role in the pathophysiology of myocardial infarction and arteriosclerosis. A study conducted on a larger group may be able to assess the potential use of Ang-2 in detecting patients with higher cardiovascular risk and receiving adequate treatment earlier.
This publication supports our hypothesis of the crucial role of Ang-2 in CAD. Ang-2 may not be an ideal marker suitable for early diagnosis of NSTEMI, but it could identify those individuals who have greater risk of CAD, such as diabetic patients. Also the inhibition of Ang-2 seems to be a new way of improving long-term outcome of patients with myocardial infarction and further studies are necessary to address this potential method of treatment [18].
Limitations
Among the limitations of this study are the relatively small size of the cohort and number of events, which are likely to have confounded our assessment of the specificity and sensitivity of the ROC analysis of NSTEMI.
In conclusion, angiopoietin-2 serum concentration is elevated in the presence of NSTEMI in patients with and without type 2 diabetes. Ang-2 remains elevated also in patients with T2DM without a history of CAD. These findings and the previous published studies demonstrate the crucial role of Ang-2 in CAD and myocardial infarction and also suggest a new direction of research in which Ang-2 inhibition could be pursued in order to improve the long-term outcome of patients with CAD.