Introduction
Hybrid cardiac telerehabilitation is a novel component of heart failure (HF) management but its effect on ventricular arrhythmias (VA) is not well understood [1].
Ventricular arrhythmia is a common problem in patients with HF regardless of etiology. A number of studies have reported that 70–95% of HF patients have frequent premature ventricular complexes (PVCs), and 40–80% will manifest runs of non-sustained ventricular tachycardia (nsVT) [2]. The increase in VA represents a significant cause of morbidity and mortality.
According to the latest European Society of Cardiology (ESC) guidelines, all stable HF patients should participate in cardiac rehabilitation programs [3]. Cardiac rehabilitation is shown to improve physical capacity, quality of life and psychological well-being, which affect the prognosis by reducing mortality and hospitalization rate. One of the most important core components of rehabilitation is regular and tailored exercise training [3].
The problem of VA in the context of cardiac rehabilitation in HF patients should be considered in two aspects:
– occurrence of arrhythmias triggered by the exercise training, which acutely impacts the rehabilitation safety,
– potentially antiarrhythmic effect of the total rehabilitation process and its prognostic significance.
The first aspect has been discussed in some publications [4, 5], including previously published TELEREH-HF study results [6–8]. In the current study, we focus on the second aspect.
To date, studies on the influence of exercise training on VA in HF patients have been limited to small sample sized, non-randomized, mostly retrospective and single-center studies [4, 5, 9]. Moreover, there are still no papers that evaluate whether the reduction of VA after several weeks of the rehabilitation cycle affects the long-term prognosis.
Therefore the aim of the present study was to assess the antiarrhythmic effect of a 9-week hybrid comprehensive telerehabilitation (HCTR) program and its influence on long-term cardiovascular mortality in the population of HF patients from the TELEREHabilitation in Heart Failure Patients (TELEREH-HF) randomized clinical trial.
Material and methods
The design and primary results of the TELEREH-HF study (Clinical Trials.gov NCT 02523560) have been published elsewhere [6, 7]. Briefly, the TELEREH-HF study was a randomized, prospective, multicenter (5 centers in Poland), open-label, parallel group-controlled trial comparing HCTR and UC in HF patients. This study enrolled 850 clinically stable HF patients New York Heart Association (NYHA) class I–III and left ventricular ejection fraction (LVEF) ≤ 40%) after a cardiovascular hospitalization within 6 months prior to randomization. Eligible patients were randomized in a 1 : 1 ratio to either HCTR plus UC or to UC only, using a web-based randomization system.
The study conduct was guided by good clinical practice, in accordance with the Declaration of Helsinki and the regulations applicable in Poland. The trial was approved by the local ethics committee. Each patient provided written informed consent. TELEREH-HF inclusion and exclusion criteria were previously described elsewhere [6, 7].
Intervention
The HCTR intervention encompassed telecare, telerehabilitation and remote monitoring of cardiovascular implantable electronic devices. The HCTR group patients underwent a 9-week HCTR program consisting of two stages: an initial stage (1 week) conducted in hospital and a basic stage (8 weeks) of home-based HCTR 5 times weekly. The telerehabilitation program encompassed three training modalities: endurance aerobic Nordic walking training, respiratory muscle training, and light resistance and strength exercises. A more detailed description of the intervention has been published previously [6, 7].
Holter electrocardiography
24-hour Holter ECG monitoring (12-channel, Holter digital recorder Lifecard CF, Del Mar Reynolds Medical UK/USA) was performed as part of the patients’ assessments at entry and after completing the 9-week training program (HCTR group) or completing the 9-week observation (UC group). 24-hour Holter recordings (Holter ECG) were assessed using the analysis system Pathfinder SL, Spacelabs Healthcare.
The essential condition for including the patient in this analysis was to obtain good quality Holter ECG for each patient. Rigorous quality control was performed on all Holter ECG studies by a trained physician.
Holter analysis methods
In our study we focused on the occurrence of prognostically significant VA. We considered the presence of non-sustained ventricular tachycardia (nsVT) and frequent premature ventricular complexes ≥ 10 beats per hour (PVCs ≥ 10) on Holter ECG as factors linked to an increased risk for cardiac mortality in HF patients [10, 11]. We conducted quantitative (number of PVCs) and qualitative (presence or absence of nsVT) analysis of VA at baseline (H-0) and after 9 weeks (H-9) in both HCTR and UC groups. We assessed the differences in VA incidence before and after the 9-week telerehabilitation (HCTR group) or before and after the 9-week observation (UC group) in each group (withingroup analysis) and between the groups.
After Holter ECG monitoring assessment at H-0 and H-9 for nsVT and PVCs ≥ 10, we divided HCTR and UC group patients into three subgroups: improvement, no change and worsening based on presence or absent of nsVT or PVCs ≥ 10 in H-0 and H-9.
The improvement effect on nsVT was defined as presence of nsVT at baseline Holter ECG (H-0: nsVT+) and absence in Holter ECG after 9 weeks of HCTR or after a 9-week observation in UC (H-9: nsVT-).
Patients with absence of nsVT at baseline Holter ECG (H-0: nsVT-) and presence after 9 weeks (H-9: nsVT+) were assigned to the worsening subgroup.
Analogously, we defined patient subgroups for quantitative analysis of VA: improvement as the presence of PVCs ≥ 10 at baseline Holter (H-0: PVCs ≥ 10 (+)) and absence after 9 weeks (H-9: PVCs ≥ 10 (–)), and worsening as H-0: PVCs ≥ 10 (–) and H-9: PVCs ≥ 10 (+), respectively.
Functional response for HCTR was assessed by changes – delta (Δ) – in peak oxygen consumption (pVO2) in the cardiopulmonary exercise test (CPET) as a result of comparing pVO2 from the beginning and the end of the program.
In uni- and multivariable analyses 14 demographic and clinical factors (gender, age, HF etiology, LVEF, pVO2, ∆pVO2, ∆ percent predicted pVO2 (%pVO2), N-terminal fragments of B-type natriuretic peptide level (NT-proBNP), estimated glomerular filtration rate, basic cardiac rhythm, presence/absence of diabetes mellitus, NYHA functional class, presence/absence of cardiac resynchronization therapy or implantable cardioverter defibrillator) were considered.
Statistical analysis
Descriptive statistics were used to report the characteristics of the patients at baseline. The continuous variables are presented as means ± SD or as medians and inter-quartile ranges for normally and non-normally distributed data. The categorical variables are presented as counts and percentages. For between-group comparisons Student’s t-test, the Wilcoxon rank-sum test, the χ2 test of independence or Fisher’s exact test was used, as appropriate. The ordinal variable (NYHA) was compared using Cochran-Mantel-Haenszel modified ridit scores (row mean scores statistic). In the main analysis for improvement or deterioration estimated on the basis of nsVT or PVC, patients were first stratified into 2 categories according to their demographic or clinical characteristics. For this purpose, continuous variables (age, LVEF, pVO2) were dichotomized (NT-proBNP according to the worst tertile vs. the other two tertiles). Subsequently, the relative benefit of improvement (RB) or relative risk of worsening (RR) with their 95% confidence limit (CL) of the subgroups was calculated and the homogeneity of RR or RB was assessed by the Breslow-Day test. After that, multivariable logistic regression analysis was used to identify independent improvement or deterioration predictors. Variables were selected in the stepwise selection manner. Cardiovascular survival curves were constructed using Kaplan-Meier methods and compared by the log-rank test with Bonferroni correction to the raw p-values of the paired tests. A significance level of 0.05 was required to allow a variable into the model and for a variable to stay in the model. Areas under the receiver operating characteristics curves (C-statistic) were calculated with 95% confidence intervals (95% CI). Two-tailed p-values of 0.05 or less were considered to indicate statistical significance. SAS software, version 9.4, was used for all analyses.
Results
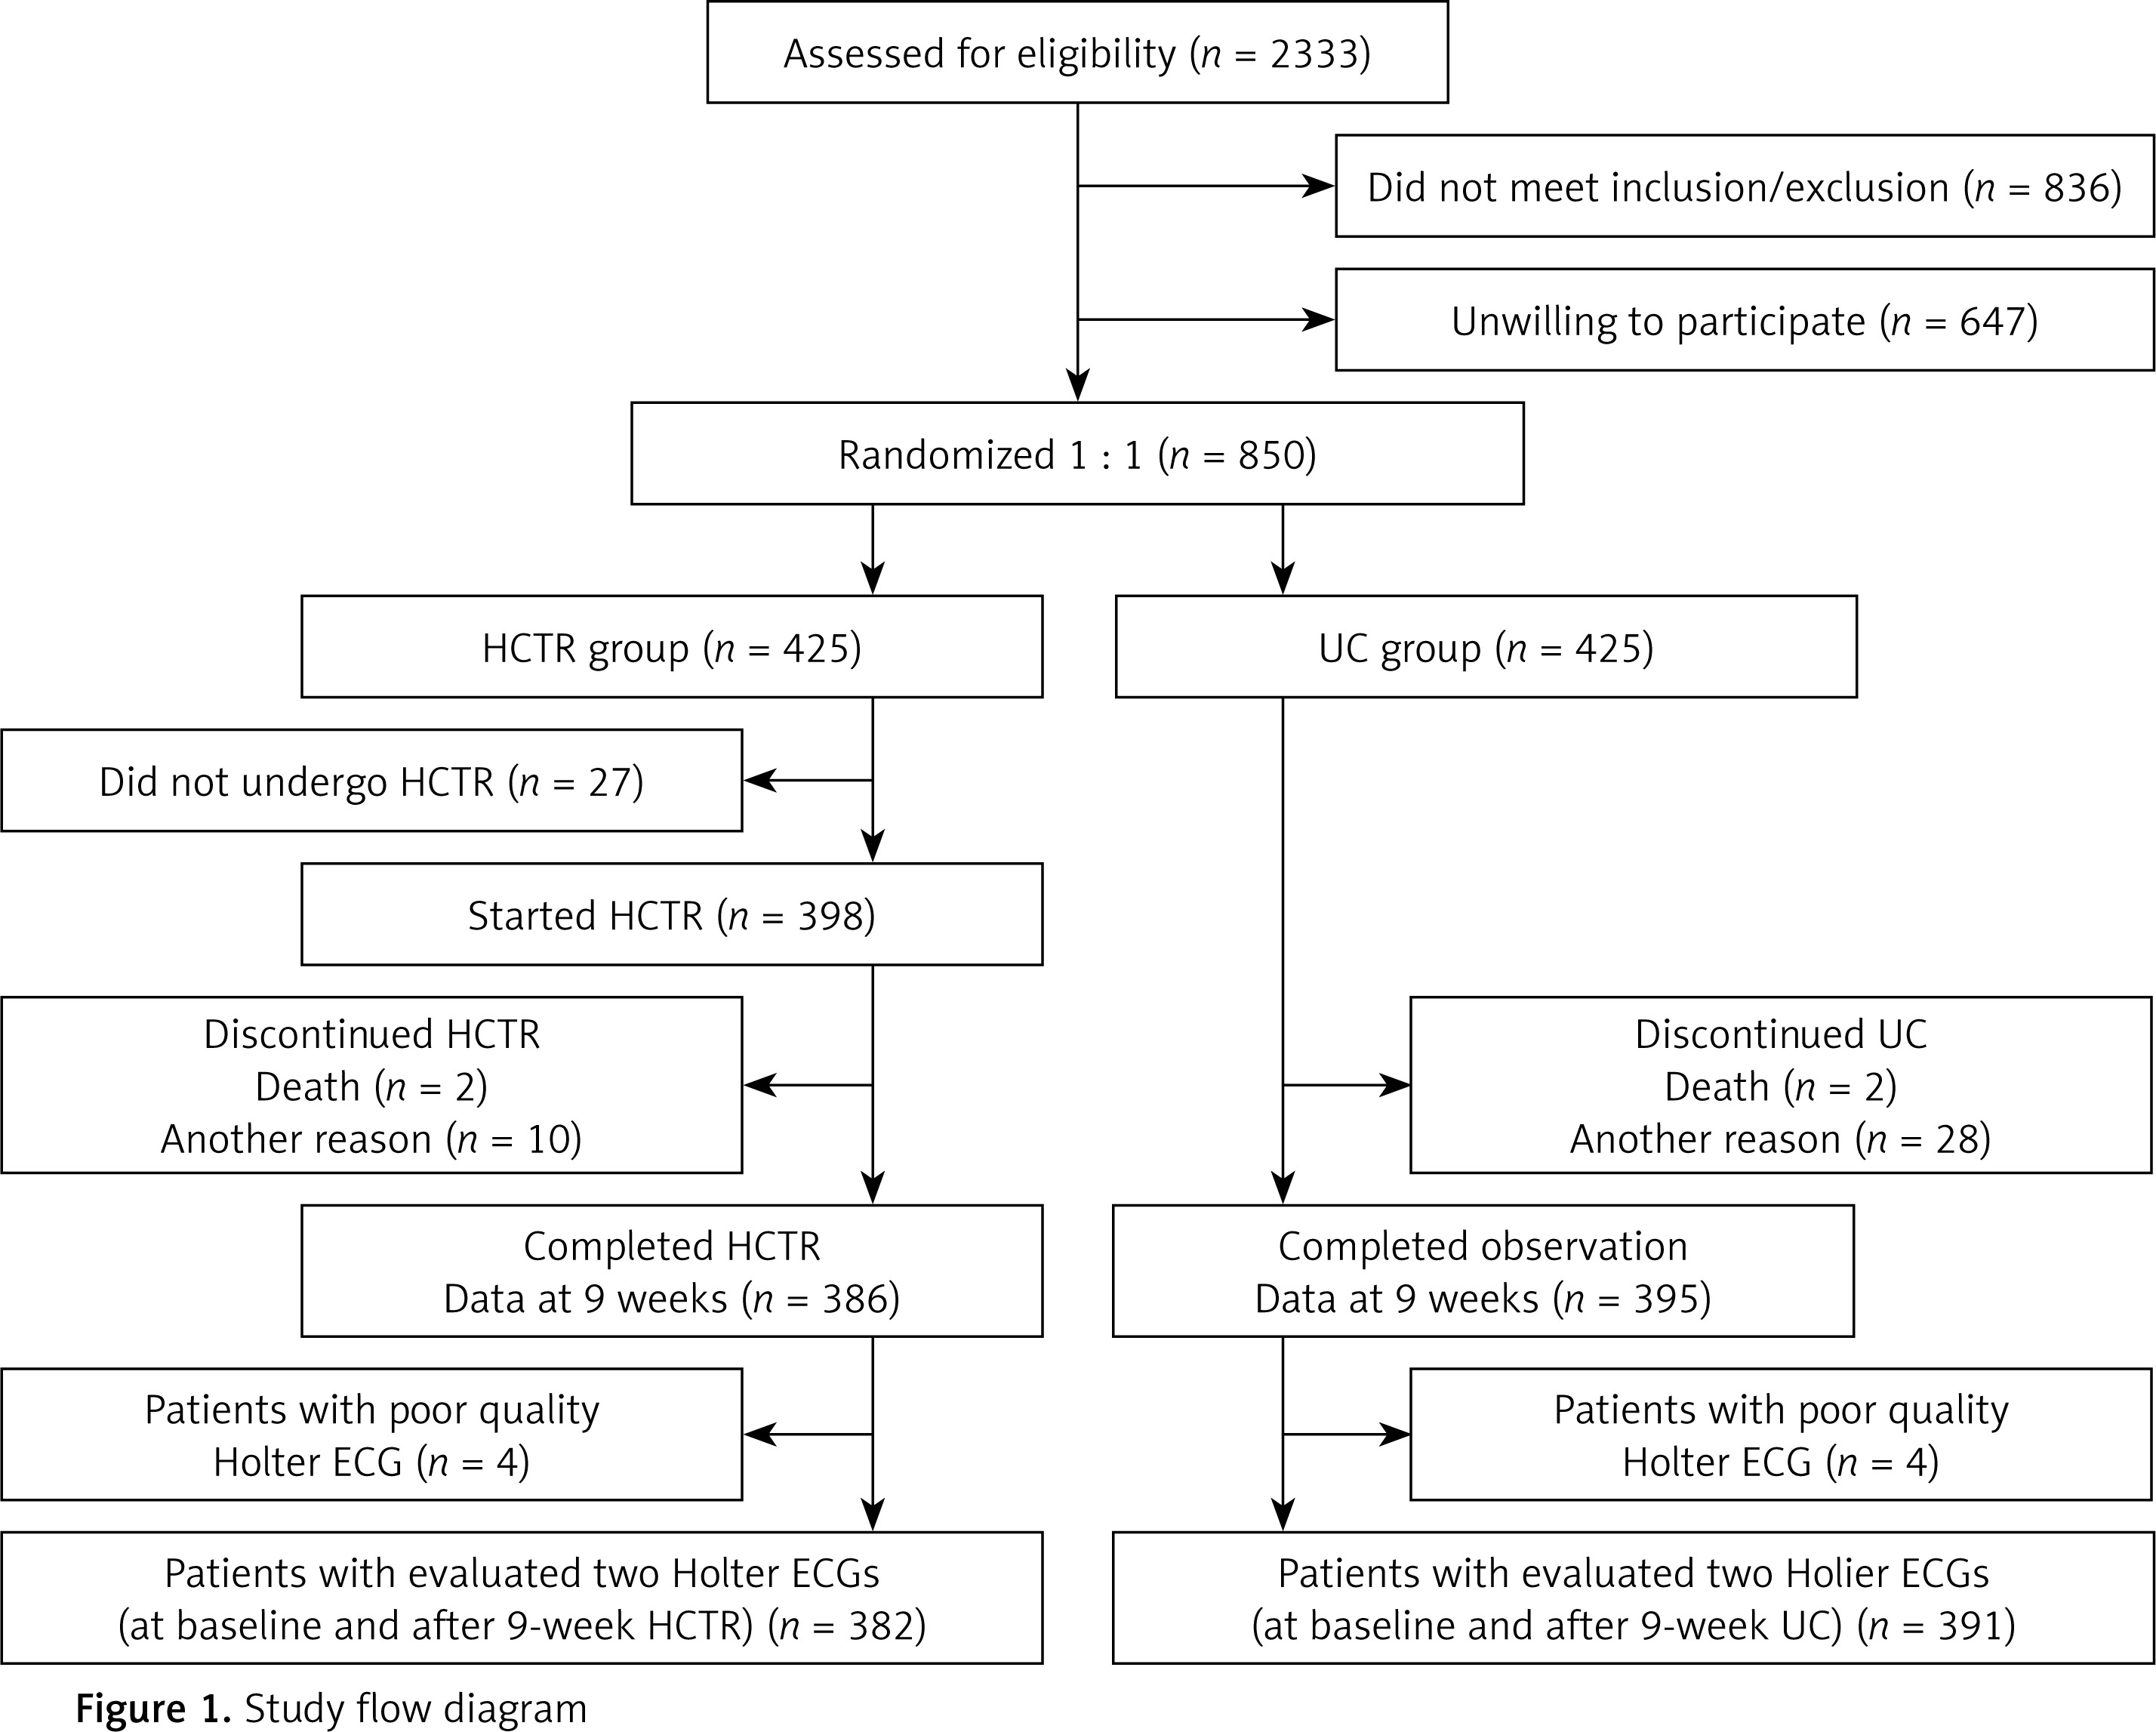
We evaluated 1562 Holter ECG recordings of 781 patients (two recordings for each patient). Seven hundred seventy-two Holter ECG recordings were from the HCTR arm and 790 from the UC arm. Due to the poor quality Holter ECG recording, we excluded 4 patients from each group. Finally, 764 Holter ECG recordings from the HCTR arm and 782 from the UC arm were included in our subanalysis (Figure 1).
Figure 1
Study flow diagram
HCTR – hybrid comprehensive telerehabilitation, UC – usual care, ECG – electrocardiography.
Study arms were not significantly different in terms of demographic data, baseline clinical parameters and treatment. Patients’ characteristics and clinical data at baseline are presented in Table I.
Table I
Baseline characteristics
| Characteristic | HCTR (n = 382) | UC (n = 391) | P-value |
|---|---|---|---|
| Males, n (%) | 342 (89.5) | 347 (88.7) | 0.727 |
| Age, mean ± SD [years] | 62.1 ±10.8 | 61.9 ±10.3 | 0.701 |
| Left ventricular ejection fraction, mean ± SD [%] | 31.0 ±6.9 | 30.3 ±7.0 | 0.168 |
| Atrial fibrillation or atrial flutter, n (%) | 76 (19.9) | 73 (18.7) | 0.666 |
| BMI, mean ± SD [kg/m2] | 28.8 ±5.1 | 29.1 ±4.7 | 0.397 |
| Heart failure etiology, n (%): | |||
| Ischemic | 253 (66.2) | 249 (63.7) | 0,458 |
| Nonischemic | 129 (33.8) | 142 (36.3) | |
| Medical history, n (%): | |||
| Myocardial infarction | 226 (59.2) | 217 (55.5) | 0.303 |
| Angioplasty | 185 (48.4) | 178 (45.5) | 0.418 |
| Coronary artery bypass grafting | 58 (15.2) | 63 (16.1) | 0.722 |
| Hypertension | 226 (59.2) | 250 (63.9) | 0.172 |
| Diabetes mellitus | 129 (33.8) | 134 (34.3) | 0.883 |
| Stroke | 21 (5.5) | 28 (7.2) | 0.343 |
| Chronic kidney disease | 71 (18.6) | 63 (16.1) | 0.364 |
| Hyperlipidemia | 189 (49.5) | 170 (43.5) | 0.095 |
| Depression* | 74 (22.9) | 87 (26.6) | 0.275 |
| Functional status according to New York Heart Association class, n (%): | |||
| I | 51 (13.4) | 48 (12.3) | 0.387 |
| II | 271 (70.9) | 267 (68.3) | |
| III | 60 (15.7) | 76 (19.4) | |
| Treatment, n (%): | |||
| β-Blocker | 367 (96.1) | 383 (97.9) | 0.124 |
| Angiotensin-converting enzyme inhibitors/angiotensin-receptor blockers | 357 (93.5) | 367 (93.9) | 0.817 |
| Digoxin | 47 (12.3) | 50 (12.8) | 0.839 |
| Loop diuretics | 279 (73.0) | 306 (78.3) | 0.091 |
| Spironolactone/eplerenone | 316 (82.7) | 320 (81.8) | 0.748 |
| Aspirin/clopidogrel | 218 (57.1) | 222 (56.8) | 0.735 |
| Anticoagulants | 113 (29.6) | 119 (30.4) | 0.796 |
| Novel oral anticoagulants | 61 (16.0) | 54 (13.8) | 0.399 |
| Statins | 318 (81.9) | 321 (82.1) | 0,954 |
| Cardiovascular implantable electronic devices | 301 (78.8) | 319 (81.6) | 0,330 |
| Implantable cardioverter-defibrillator | 190 (63.1) | 206 (64.6) | 0.964 |
| Cardiac resynchronization therapy with pacemaker function | 4 (1.3) | 4 (1.3) | |
| Cardiac resynchronization therapy and cardioverter-defibrillator | 104 (34.5) | 105 (32.9) | |
Non-sustained ventricular tachycardia and PVCs ≥ 10 in HCTR vs. UC group
An improvement effect in nsVT was found in 44 (30.8%) patients in the HCTR group and 57 (34.5%) patients in the UC group and the difference between groups was not statistically significant (p = 0.481). A worsening effect on nsVT was observed in 23% and 20.3% patients (p = 0.487), respectively.
There were also no statistically significant differences between HCTR and UC groups in the improvement (p = 0.41) or worsening (p = 0.964) effect on PVCs ≥ 10 (Table II).
Table II
Hybrid comprehensive telerehabilitation vs usual care: impact (improvement, no change, worsening) on non-sustained ventricular tachycardia (nsVT) and premature ventricular complexes ≥ 10 beats per hour (PVCs ≥ 10)
[i] H-0 – Holter at baseline, H-9 – Holter after 9 weeks, HCTR – hybrid comprehensive telerehabilitation, Improvement – (+) in H-0 and (–) in H-9, nsVT – non-sustained ventricular tachycardia, nsVT (+) – presence of nsVT in ECG Holter, nsVT (–) – absence of nsVT in ECG Holter, PVCs – premature ventricular complexes, PVC ≥ 10 (+) – presence PVCs ≥ 10 beats per hour in ECG Holter, PVC ≥10 (–) – absence of PVCs ≥ 10 beats per hour in ECG Holter; UC, usual care, Worsening – (–) in H-0 and (+) in H-9.
Demographic/clinical characteristics and effect on nsVT in HCTR vs. UC group
Comparison of the improvement in nsVT in the HCTR and UC groups depending on the 14 demographic and clinical characteristics did not show significant differences between groups (Table III).
Table III
Comparison of improvement effect on nsVT (nsVT (+) in H-0 and nsVT(–) in H-9) in the HCTR and UC groups depending on the demographic and clinical characteristics – univariable analysis and group heterogeneity in terms of relative benefit analysis
[i] H-0 – Holter at baseline, H-9 – Holter after 9 weeks, HCTR – hybrid comprehensive telerehabilitation; heterogeneity of relative benefits, p-value for null hypothesis testing equality of relative benefits in subgroups, pVO2 – peak oxygen consumption, nsVT – non-sustained ventricular tachycardia, nsVT (+) – presence of nsVT in ECG Holter, nsVT (–) – absence of nsVT in ECG Holter, NT-proBNP – N-terminal fragments of B-type natriuretic peptide; Relative benefit, the ratio of benefits of the HCTR group and the UC group, UC – usual care.
Comparison of the worsening in nsVT in the HCTR and UC groups depending on the 14 demographic and clinical characteristics also did not show significant differences between groups (Table IV).
Table IV
Comparison of worsening on nsVT [nsVT (–) in H-0 and nsVT(+) in H-9] in the HCTR and UC groups depending on the demographic and clinical characteristics – univariable analysis and group heterogeneity in terms of relative risk analysis
[i] H-0 – Holter at baseline, H-9 – Holter after 9 weeks, HCTR – hybrid comprehensive telerehabilitation; heterogeneity of relative risks, P-value for null hypothesis testing equality of relative risks in subgroups, pVO2 – peak oxygen consumption, nsVT – non-sustained ventricular tachycardia, nsVT (+) – presence of nsVT in ECG Holter, nsVT (–) – absence of nsVT in ECG Holter, NT-proBNP – N-terminal fragments of B-type natriuretic peptide, relative risk – the ratio of risks of the HCTR group and the UC group, UC – usual care.
Demographic/clinical characteristics and effect on PVCs ≥ 10 in HCTR vs. UC group
Comparison of the improvement in PVCs ≥ 10 in the HCTR and UC groups depending on 14 demographic and clinical characteristics did not show significant differences between groups.
The univariable analysis revealed LVEF > 35% in the UC group as a statistically significant predictor of the improvement effect on PVCs ≥ 10. Furthermore, LVEF > 35% was significantly more predictive in the UC group than HCTR group (12.9% vs. 29.1%, p = 0.03) (Table V).
Table V
Comparison of improvement in PVC ≥ 10 (PVC ≥ 10 (+) in H-0 and PVC ≥ 10 (–) in H-9) in the HCTR and UC groups depending on the demographic and clinical characteristics – univariable analysis and group heterogeneity in terms of relative benefit analysis
[i] H-0 – Holter at baseline, H-9 – Holter after 9 weeks, HCTR – hybrid comprehensive telerehabilitation, heterogeneity of relative benefits – p-value for null hypothesis testing equality of relative benefits in subgroups, pVO2 – peak oxygen consumption, NT-proBNP – N-terminal fragments of B-type natriuretic peptide, PVCs – premature ventricular complexes, PVC ≥ 10 (+) – presence of PVCs ≥ 10 beats per hour in ECG Holter, PVC ≥ 10 (–) – absence of PVCs ≥ 10 beats per hour in ECG Holter, relative benefit – the ratio of benefits of the HCTR group and the UC group, UC – usual care.
Comparison of the worsening in PVCs ≥ 10 in the HCTR and UC groups depending on the 14 demographic and clinical characteristics did not show significant differences between groups. The statistically significant predictor of the worsening effect on PVCs ≥ 10 in univariable analysis was the presence of CRT in the UC group (16.35 vs. 42.9%, p = 0.009) (Table VI).
Table VI
Comparison of worsening in PVCs ≥ 10 [PVC ≥ 10 (–) in H-0 and PVC ≥ 10 (+) in H-9] in the HCTR and UC groups depending on the demographic and clinical characteristics – univariable analysis and group heterogeneity in terms of relative risk analysis
[i] H-0 – Holter at baseline, H-9 – Holter after 9 weeks, HCTR – hybrid comprehensive telerehabilitation, heterogeneity of relative risks – p-value for null hypothesis testing equality of relative risks in subgroups, pVO2 – peak oxygen consumption, NT-proBNP – N-terminal fragments of B-type natriuretic peptide, PVCs – premature ventricular complexes, PVC ≥ 10 (+) – presence of PVCs ≥ 10 beats per hour in ECG Holter, PVC ≥ 10 (–) – absence of PVCs ≥ 10 beats per hour in ECG Holter, relative risk – the ratio of risks of the HCTR group and the UC group, UC – usual care.
Improvement/worsening effect on nsVT or PVCs ≥ 10 in the entire population
Finally, multivariable analysis of the entire population (both HCTR and UC groups) that included HCTR and UC as explanatory variables was performed (Table VII). In relation to nsVT, female gender (OR = 2.39, 95% CI: 1.07–5.34, p = 0.034) and LVEF > 35% (OR = 2.95, 95% CI: 1.72–5.06, p < 0.0001) were the only independent factors of the improvement effect and NYHA III was the only independent factor of the worsening effect (OR = 1.81, 95% CI: 1.05–3.12, p = 0.032). In relation to PVCs ≥ 10, age < 62 years (OR = 2.13, 95% CI: 1.28–3.52, p = 0.03) and NYHA I or II (OR = 2.23, 95% CI: 1.03–4.86, p = 0.042) were the only independent factors of the improvement effect and diabetes mellitus was the only independent factor of the worsening effect (OR = 3.41, 95% CI: 1.95–5.97, p < 0.001).
Table VII
Independent factors determining improvement/worsening effect in nsVT /PVCs ≥ 10 in HCTR + UC groups – multivariable analysis
[i] 95% CI – 95% confidence interval, DM (+) – presence of diabetes mellitus, DM (–) – absence of diabetes mellitus, LVEF – left ventricular injection fraction, nsVT – non-sustained ventricular tachycardia, nsVT (+) – presence of nsVT in ECG Holter, nsVT (–) – absence of nsVT in ECG Holter, NYHA – New York Heart Association, PVCs – premature ventricular complexes, PVC ≥ 10 (+) – presence of PVCs ≥ 10 beats per hour in ECG Holter, PVC ≥ (–) – absence of PVCs ≥ 10 beats per hour in ECG Holter.
It is worth emphasizing that the overall prognostic association of clinical and demographic variables with the improvement/worsening of nsVT or PVCs ≥ 10 was weak to moderate as indicated by the model C statistics in the 0.54 to 0.64 range (Table VII).
Functional effectiveness of HCTR versus improvement/worsening effect in relation to nsVT or PVCs ≥ 10
In all the analyses presented above, we took into account the importance of the physical capacity improvement/lack of improvement after 9 weeks of telerehabilitation (Δ pVO2) in CPET ≥ 2.0 ml/kg/min and Δ% pVO2 ≥ 6%. Functional response after 9 weeks of HCTR did not affect the occurrence of nsVT or PVCs ≥ 10 (Tables III–VII).
Improvement effect on nsVT and long-term prognosis
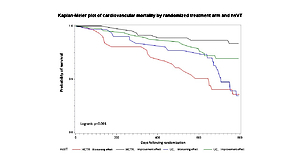
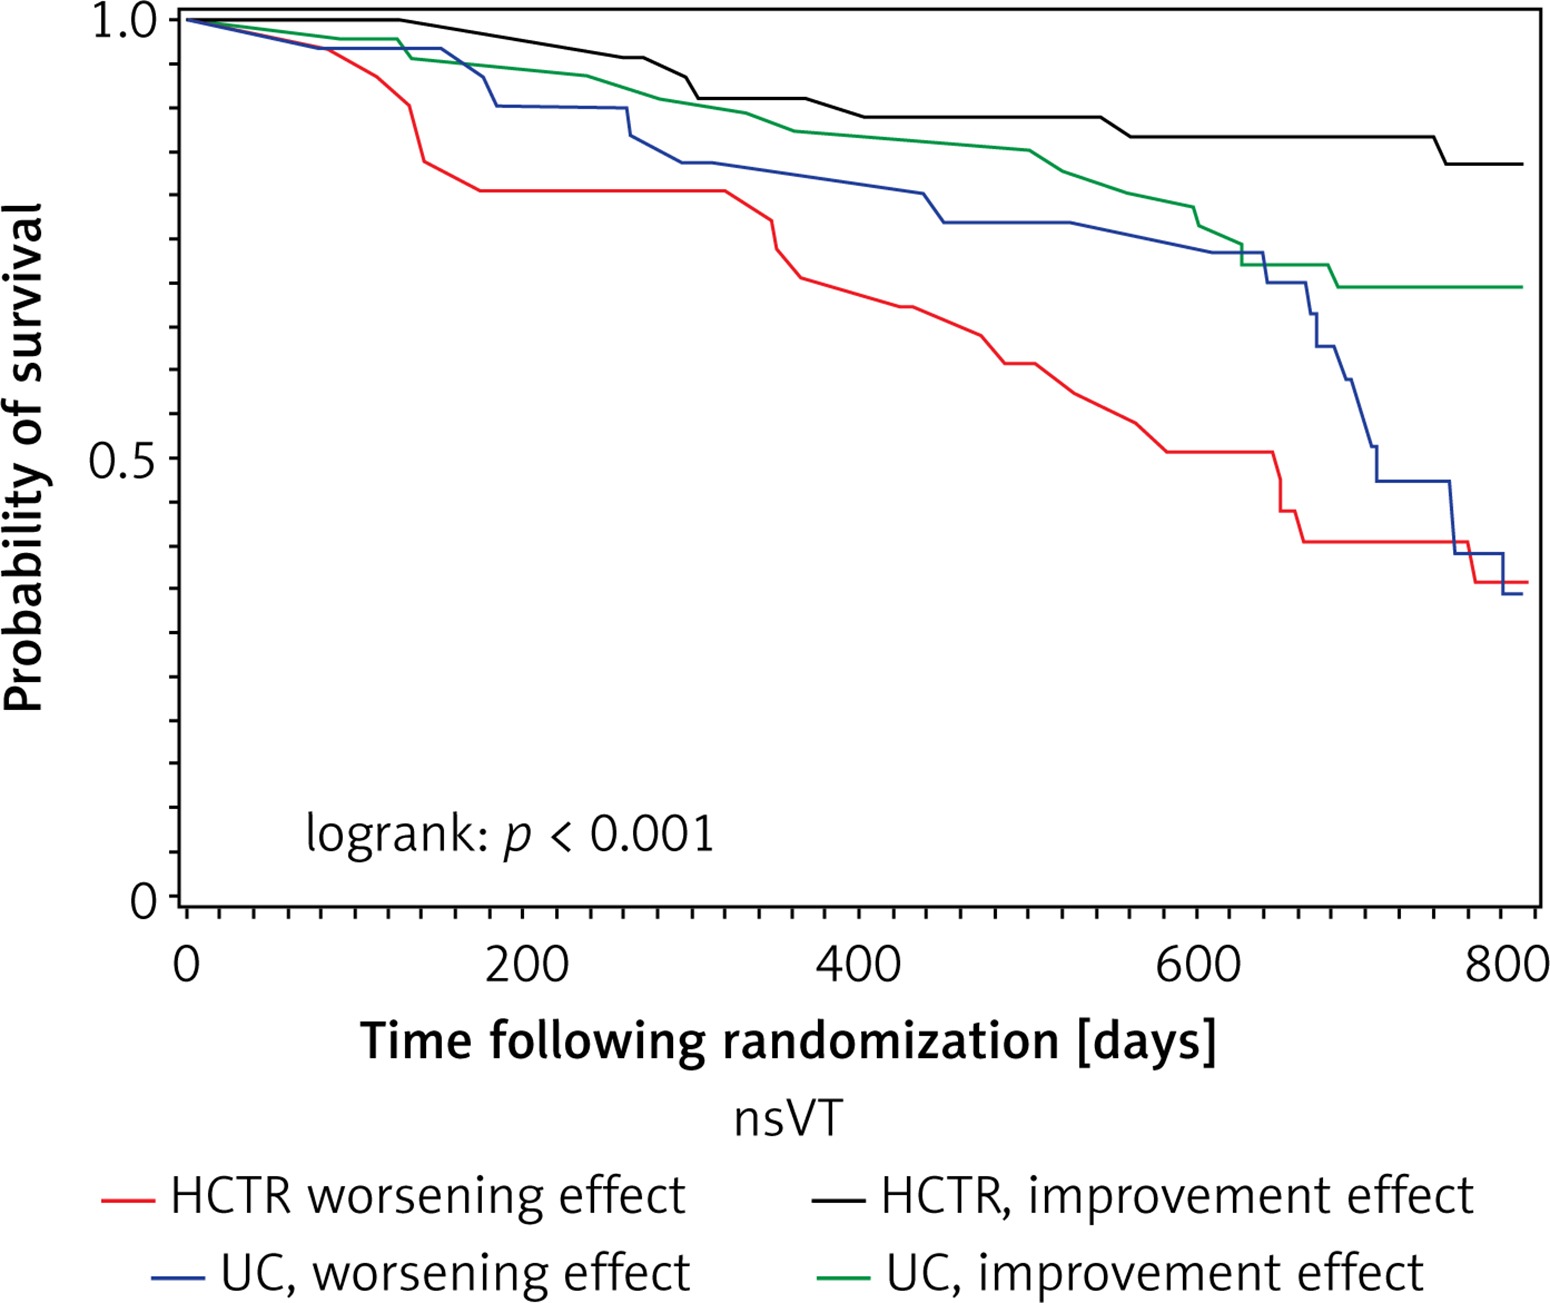
In the HCTR group, the achievement of an antiarrhythmic effect significantly reduced the cardiovascular mortality in 2-year follow-up; logrank p < 0.001 (Figure 2, Table VIII). In the UC group, favorable effects in terms of prognosis were not observed.
Table VIII
Cardiovascular death; multiple comparisons of the pairs of survival curves using the Bonferroni correction of the raw p-values
Discussion
Our study is the first large, randomized trial with a control group that attempts to analyze the impact of home-based cardiac telerehabilitation on the incidence of prognostically significant VA in HF patients with reduced LVEF.
To the best of our knowledge, this is the first study to evaluate the impact of 9-week telerehabilitation on VA and its influence on long-term cardiovascular mortality in a large group of HF patients. Previously published results of the TELEREH-HF study demonstrated improvements in functional outcomes evaluated by pVO2 in CPET, after 9 weeks of HCTR [6]. The main finding of the current subanalysis is that when compared to 9-week UC, the 9-week HCTR was not associated with changes in VA that would raise safety concerns: changes in the occurrence of nsVT and frequent PVCs ≥ 10 were similar after 9 weeks after both types of management in HF patients. There was no significant difference between HCTR and UC groups regarding the improvement/worsening of the above-mentioned arrhythmias after 9 weeks of performing both procedures.
The fact that arrhythmias did not worsen confirms previously published data on the safety of the tested modalities. However, the lack of improvement in arrhythmias in the HCTR group may raise questions and requires consideration. It should be explained why, on the one hand, prognostically significant improvement in physical capacity after 9 weeks of HCTR did not correlate with the antiarrhythmic effect in terms of incidence of nsVT. On the other hand, the antiarrhythmic effect after the 9-week HCTR significantly reduced cardiovascular mortality in long-term follow-up.
Heart failure, VA and safety of exercise training
Changes in the electrical and mechanical function of the failing heart, including left ventricular remodeling, fibrosis, regional hypertrophy and increased vascular resistances, can predispose a HF patient to VA [1, 12].
One of the factors responsible for VA in HF patients is the activation of neurohormonal mechanisms. Sympathetic stimulation and down-regulation of the parasympathetic system contribute not only to the proarrhythmic environment, but also to changes in the mechanical function of the heart muscle that lead to myocardial remodeling and fibrosis, which in turn increase the risk of arrhythmias [1].
Considering the above, it should be noted that physical effort during exercise training can lead to an acute increase in the susceptibility to VA by activating the sympathetic nervous system, decreasing vagal activity and increasing hemodynamic overload of the cardiovascular system [13, 14].
These considerations underscore the importance of the exercise training plan in terms of its type (endurance, resistance and strength), intensity (aerobic versus anaerobic); method (continuous versus intermittent/interval); setting (center-based versus home-based); application (systemic, regional and respiratory muscle) and control (supervised versus non-supervised) [15]. This highly systematic approach to training makes it safe as a therapeutic strategy in HF patients.
Previously published results of the TELEREH-HF study confirmed the safety of HCTR when it is individually tailored to the patient’s clinical presentation and needs [6]. In comparison with UC, HCTR is safe due to not being associated with exacerbation of VA.
These findings should further encourage the implementation of telerehabilitations at the patient’s home.
In this substudy, we analyzed another issue; namely, we sought to determine whether a 9-week safe and functionally effective exercise training program activates mechanisms affecting the frequency of occurrence of potentially prognostically significant VA.
Heart failure, exercise training and the incidence of prognostically significant VA
The beneficial effects of long-term moderate exercise on preventing arrhythmias include the improvement in autonomic balance in favor of the vagal component, the improvement in baroreflex sensitivity, the improvement in left ventricular dysfunction through the enhancement of myocardial perfusion and contractility, and the improvement in the endothelium-dependent dilation of coronary arteries [16].
Despite this pathophysiological evidence, there are very few available studies assessing whether the improvement effect of exercise training on functional outcomes results in a positive effect on VA in HF patients. Moreover, in published trials evaluating the effect of the rehabilitation process on VA, we found a small number of patients with a reduced LVEF ≤ 40% [4, 9].
The available studies are further limited by their methodology as they are mostly single centered retrospective studies, hindered by small numbers of subjects and lack of randomization or a control group.
Hertzeanu et al. concluded that a long-term (36 or 60 months) rehabilitation program decreases neuroadrenergic activity, the arrhythmogenic effect of catecholamines and consequently the incidence of VA in post-myocardial infarction patients with left ventricular dysfunction (LVEF < 40%), compared with similar patients who were not in any rehabilitation program [9]. Comparing the above results to ours, we should point out that, on the one hand, we were concentrated only on potentially prognostically significant arrhythmias (nsVT and PVC frequency), and, on the other hand, the period of exercise training in the TELEREH-HF study was shorter (9 weeks). Perhaps it was too short to achieve the advantageous impact on the neuroadrenergic activity and trigger the beneficial effect on preventing VA.
Boukhris et al. assessed the impacts of out-patient rehabilitation on ventricular repolarization indexes (QTc, QTc dispersion) and VA in patients suffering from coronary artery disease with type 2 diabetes (8% of them had LVEF less than 30%) [4]. They concluded that rehabilitation resulted in improvement in the majority of ventricular repolarization indexes in the studied population, decreasing the frequency of VA. The relatively small and heterogeneous sample of the study (122 patients), the fact that the ECG Holter analysis focused only on Lown classes and the lack of a control group for the intervention make it difficult to directly compare these results to our study. Moreover, different protocols and models of rehabilitation and their different intensity, duration, comprehensiveness make them difficult to compare to the results obtained in our study.
Predictors determining improvement and the worsening effect of HCTR in VA
The multivariable analysis of the entire population (both HCTR and UC groups) did not identify HCTR as an independent factor determining both improvement and the worsening effect in terms of nsVT or PVCs ≥ 10, after 9 weeks of both therapeutic strategies. It should be mentioned, however, that it identified independent factors associated with an improvement effect such as female sex, age < 62 years, LVEF > 35% and NYHA class I or II. These variables are not unexpected and were previously identified in other reports [5]. Unfortunately, none of these studies focused on the occurrence of prognostically significant VA evaluated as in our study (nsVT, PVCs ≥ 10). This also supports the notion that healthier HF subjects (relatively young, with better functional class and higher LVEF) have lower risk of arrhythmic events [5].
We found no previous reports indicating the worsening effect of rehabilitation on VA. However, it should be noted that the multivariable analysis of the entire population (both HCTR and UC groups) identified independent factors associated with the worsening effect, namely, NYHA class III at baseline and diabetes mellitus. This is in line with the notion that high NYHA functional class is a marker of high-risk patients and was independently related to an increased risk of death from cardiovascular origin [5, 17]. Briongos-Figuero et al. found that cardiovascular mortality risk was highest in NYHA class III compared with NYHA I and NYHA II patients [17].
Also, it is becoming increasingly apparent that diabetes mellitus impacts the electrical conduction system of the heart, leading to brady- and tachyarrhythmias, including life-threatening VA. The relationship between diabetes and arrhythmias is complex and multifactorial, including autonomic dysfunction, atrial and ventricular remodeling and molecular alterations [18].
Movahed et al. concluded that diabetes could be an independent risk marker of VA and using multivariate analysis, diabetes remained independently associated with ventricular fibrillation [19]. The presence of diabetes negates the beneficial effects of rehabilitation on QT dispersion as an independent predictor for VA and sudden cardiac death [7].
Prognostically significant improvement of physical capacity and long-term cardiovascular mortality
Considering the physical capacity assessed on the basis of CPET results as a prognostic significance parameter of the effect of HCTR, we compared it with the effect of HCTR on nsVT or PVCs ≥ 10 treated also as a prognostic significance parameter. According to Tabet et al. we assumed ΔpVO2 ≥ 2.0 ml/kg/min and Δ% pVO2 ≥ 6% after 9 weeks of telerehabilitation as the prognostically significant improvement of physical capacity in CPET [20]. In our study, being assigned to the HCTR group, and achieving prognostically significant improvement of physical capacity in CPET, did not correlate with the antiarrhythmic effect in terms of incidence of nsVT or PVCs ≥ 10. On the other hand, in the HCTR group alone, the antiarrhythmic effect in terms of incidence of nsVT significantly reduced cardiovascular mortality in long-term follow-up. It means that significant improvement in physical capacity after 9 weeks of HCTR is insufficient to reduce cardiovascular mortality in long-term follow-up. The achievement of an antiarrhythmic effect in the HCTR group is the necessary condition to significantly reduce cardiovascular mortality in long-term follow-up in HF patients.
The question is why in our study the functional improvement after telerehabilitation did not affect the occurrence of nsVT or PVCs ≥ 10. Perhaps the period of 9 weeks of telerehabilitation is sufficient to improve physical capacity but too short to trigger the beneficial effect of long-term moderate exercise on preventing arrhythmias, particularly the improvement in autonomic balance in favor of the vagal component and the improvement in baroreflex sensitivity [15, 16].
In conclusion, significant improvement in physical capacity after 9 weeks of HCTR did not correlate with the antiarrhythmic effect in terms of incidence of nsVT or PVCs ≥ 10, and this improvement is insufficient to reduce cardiovascular mortality in long-term follow-up. Only through the achievement of the antiarrhythmic effect in terms of incidence of nsVT after the 9-week HCTR is cardiovascular mortality significantly reduced in long-term follow-up in HF patients.