Heart failure (HF) is a common and cost-intensive syndrome and a challenge for health care worldwide. The mortality of HF is dramatically high, reaching 50% at 5 years, despite all the recent advances in its therapy [1–4]. Fluid accumulation and/or fluid redistribution are the most fundamental pathways in HF decompensation. Therefore, reduction of congestion is a primary objective during acute HF episode. Fluid removal and changes in intravascular volume may lead to haemoconcentration (HC), which increases the concentration of red blood cells and plasma protein caused by intravascular volume contraction. Intravascular decongestion, reflected by the HC, is associated with clinical benefits [5] and a better haemodynamic response [6]. Notably, the timing of the HC, complementary to the amount of the removed fluid, has been shown to affect the outcome [6]. However, the optimal desired time of the HC remains unclear. The reported benefit from the late HC contrasts with the described favourable effect of the early diuretic response [7].
In this study, we evaluated the associations between the timing of reaching HC and patients’ survival.
Methods
We performed the analysis of data collected in the prospective registry of patients hospitalized for acute heart failure (AHF) at the cardiology department of the 4th Military Hospital, Wrocław, Poland, between January 2016 and September 2017. The patients were included in the registry at the time of admission and then followed for 1 year after discharge. AHF was defined as the sudden onset or exacerbation of symptoms and signs characteristic of heart failure. The study enrolled adult patients (aged ≥ 18 years) who were admitted to the hospital with acute heart failure (AHF) as the primary cause of hospitalization and received intravenous furosemide upon admission. Only those individuals who expressed willingness to participate in the study and provided informed consent by signing the required documentation were included.
Patients were excluded from the study if they presented with cardiogenic shock, had a diagnosis of acute coronary syndrome, exhibited signs of known severe liver disease, required renal replacement therapy due to end-stage renal disease, or showed evidence of an active infection. We analysed the entire cohort of patients included in the registry. Detailed inclusion and exclusion criteria are described in our previous articles [8, 9]. The diagnosis of AHF was stated following the then-current European Society of Cardiology guidelines [10]. The patients were included in the registry regardless of their AHF phenotype, and further divided based on ejection fraction, into two groups: patients with reduced ejection fraction (EF < 40%) (Table I), and the rest were considered as patients with preserved ejection fraction. Every patient has undergone clinical assessment, and blood and urine samples were obtained at 3 time points: admission, after 48 h and at discharge. Heart rate was measured during the blood pressure assessment. Subsequently, patients were regularly contacted by phone for 12 months. The endpoints were determined as all-cause mortality, AHF rehospitalization and the composite of them.
Table I
Baseline characteristics in the overall cohort and subgroups
Based on previous articles, where HC was defined as a simultaneous increase in both haemoglobin (HGB) and haematocrit (HCT) levels above values at admission, we decided to stick to this definition [6]. The haemoconcentration was defined as any increase between the value at a specific timepoint and admission value. There was no specified threshold; any increase in these parameters was considered significant, but to confirm the HC, the increase had to occur in both HGB and HCT simultaneously. Decongestion was considered a reduction of clinical signs of volume overload such as oedema, rales, and jugular venous filling. For this study, patients were divided into three groups: early HC (those who matched HC criteria between admission and the 48th h of hospitalization, regardless of the possible HC between further time points), late HC (those who matched HC criteria between admission and discharge – but not between admission and the 48th h – or between 48 h and discharge), and no HC groups.
Patients whose HGB and HCT were not assessed at any of the 3 time points during the observation were excluded from the analysis, including patients whose stay at the hospital was terminated by death.
Statistical analysis
The normality of the distribution was assessed using the Kolmogorov-Smirnov test. Variables with a normal distribution are shown as mean ± standard deviation, while data with a skewed distribution are shown as median (interquartile range). The differences were assessed using Pearson’s γ2, variance analysis, log-rank and Kruskal-Wallis ANOVA tests; the post hoc analyses were performed using NIR and Scheffe tests. Kaplan-Meier curves were used to show the differences in survival. A value of p below 0.05 was considered significant. All the statistical analyses were performed in Statistica 12 (TIBCO, USA).
Results
The study included 189 patients; 69 (37%) were in the early HC group, 67 (35%) in the late HC and 53 (28%) in the no HC group.
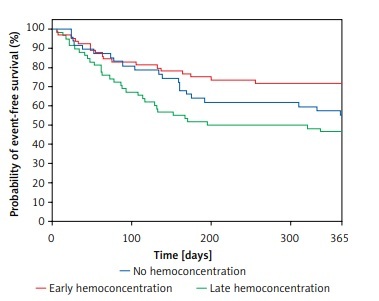
The median age in the whole cohort was 70.2 ±12.8, and 139 (74%) patients were male. The baseline characteristics of the overall cohort and the specific subgroups are displayed in Table I. The groups did not differ regarding many clinically important aspects, e.g. proportion of the de novo HF presentation, NT-proBNP, serum creatinine, eGFR (calculated MDRD formula) and sodium levels. Systolic blood pressure between the groups did not differ at any time point. The groups differed in terms of serum HGB and HCT levels at admission. However, the difference in the post-hoc analysis was significant only between the no HC and the other 2 groups (both p < 0.05). The early HC group had the lowest incidence of composite mortality or AHF rehospitalization (26%), followed by the no HC group 21 (40%). The composite endpoint was most frequent in the late HC group: 31 (46%) (Figure 1). The patients in the early HC group stayed in the hospital for the shortest time (median 5 days vs. 7 days vs. 8 days for early HC, late and no HC groups, respectively, p = 0.004).
There was no association between HC and all-cause post-discharge mortality. The outcomes in the subgroups are displayed in Table II.
Figure 1
Differences in occurence of composite of mortality or AHF rehospitalization between the groups
Table II
Outcomes in the overall cohort and subgroups
Discussion
Our study shows that early HC, in the first 48 h of hospitalization, is associated with the lowest occurrence of the composite of mortality and AHF hospitalization. These results seem intuitive – the patients who experience prompt decongestion should have a better prognosis. However, the results contradict the previous studies, reporting better outcomes in the late HC group6. Some essential differences between the studies, which may partly explain the distinctions, should be pointed out. First, the early and late HC in our study have been defined differently. In different authors’ studies [6], half of the average percentage of the length of hospital stay since the peak HC has been used to dichotomize the groups. In both studies, the overall cohorts’ median length of hospitalization differs considerably (5 days vs. 7 days). Given these, the reference points for the HC classification vary significantly and are, therefore, difficult to compare. Further, the patient’s data were gathered in different years – 2009 vs. 2016, which may also be a potential confounder.
Interestingly, the group which experienced the worst outcome was the late HC group. It can be somehow explained by the fact that the group presented the poorest natriuretic response, which impedes diuresis and has been considered an ominous prognostic factor [11].
Moreover, it should be emphasized that the prognostic significance of many markers differs between early vs. late in-hospital assessment [6, 7]. Spot urine sodium has proved its predictive efficacy when assessed at admission and in the first 2 days of hospitalization but not at discharge [12]. Conversely, the discharge versus admission BNP levels plus clinical model presented the more accurate predictive value [13]. Further, the various patterns of serum creatinine changes during hospitalization have shown distinct prognostic value [14]. Some differences between the prognostic value of anaemia at admission and discharge have also been reported [15].
Interestingly, the three groups did not differ in terms of many well-known markers of poor outcome, i.e. NT-proBNP or serum creatinine. The groups did not differ in terms of the NT-proBNP level – a known marker of elevated intracardiac pressure [16, 17]; therefore we presume that the groups were relatively balanced in terms of the intravascular pressure. Importantly, there was no difference in NT-proBNP levels regardless of the concurrent atrial fibrillation occurrence. Regardless of the lack of significance, the early HC group reached the lowest HGB and HCT. We may only speculate that the early HC group had significantly higher intravascular fluid accumulation and a better early diuretic response. Our speculation may be supported by the facts that the early HC group had the lowest creatinine concentration and the highest natriuresis, which are well-defined markers of good diuresis. Certainly, the patients with the lowest baseline HGB/HCT had the highest chances of experiencing an increase of HC, due to the regression to the mean phenomenon, which cannot be excluded.
The groups were also relatively balanced regarding the comorbidities, clinical presentation and prior-admission treatment.
Our study has several limitations. The data come from a relatively small, single-centre population. The patients were treated according to outdated guidelines, which may disrupt the generalization of the results. Data about the post-discharge treatment were also not collected. No data about AHF phenotype were collected. Moreover, there was not an established protocol of the diuretic therapy during the study – it was left to the discretion of the physician. Regrettably, data about the dosing and the type of diuretics were not collected, so the possibility that differences in outcome may be caused by the distinctions in the diuretic treatment protocol cannot be excluded. Further, the daily amount of diuresis and weight change – critical parameters during the decongestive therapy – were not stored. The analyses are derived from the pre-existing data; thus, some important parameters, e.g. uric acid [18] or sarcopenia status [19], were not assessed and their impact was not evaluated. Importantly, the haemoconcentration would reflect the changes in the intravascular volume, being a rather poor indicator of the tissue volume overload fluctuations.
Due to the concise format of the research letter and the constraints imposed on the article’s length, certain analyses such as regressions or the assessment of changes in laboratory parameters over subsequent days could not be included in the final version of the manuscript. Finally, the evidence is derived from observational data. Randomized prospective studies should be performed to assess the effect of the different HC-timing strategies on patients’ survival.
In conclusion, early HC seems to present the best prognosis regarding the composite of mortality and AHF hospitalization and also the length of the hospitalization.