
Excessive fat deposits in pre-gestational maternal body mass index may lead to adverse pregnancy outcomes, including preterm birth (PB), abnormal birthweight and may influence offspring’s future growth and development, contributing to obesity later in life [1]. Hyperglycemia and dyslipidemia observed in obese mothers may result in fetal hyperinsulinism leading to fetal overgrowth and delivery of large for gestational age (LGA) neonates, while chronic inflammation and oxidative stress increase the probability of small for gestational age (SGA) neonates and PB. External factors, including maternal socioeconomic status (SES), concomitant diseases and lifestyle, can also affect the offspring’s birthweight and modulate the risk of PB [2–4]. We explore how maternal pre-pregnancy body mass index (BMI), health and SES are associated with neonatal birthweight and the risk of PB and we analyze their relation to onset of delivery.
Methods
This prospective case-control study was conducted from March 2023 to February 2024 among mothers hospitalized in the postpartum wards of two hospitals: a university tertiary perinatal care center and a secondary care unit. Maternal and neonatal data were obtained from two combined sources: a questionnaire completed by mothers and hospital records. The questionnaire was printed on a paper form in the Polish language, included questions about pre-pregnancy weight and height, previous obstetric history, parity, fertilization, maternal smoking, alcohol consumption, education level, employment, SES and place of residence.
Study participants
The inclusion criteria were: residence in our region, singleton delivery, Polish language proficiency, and signing an informed consent form. Incomplete questionnaires with missing pre-pregnancy body weight, medical and obstetric history were excluded. Of 285 mothers who delivered prematurely and were eligible to complete the questionnaire, 36 were excluded: twelve refused to participate in the study or data were incomplete, two lived in another province, 16 did not speak the Polish language and six neonates presented with severe congenital defects. Results from 249 questionnaires were analyzed. The control group of 311 full-term newborns was selected from patients hospitalized at the same time. The study was approved by the Bioethics Committee for Scientific Research, protocol number KB/360/2023. Acceptance was also obtained from the chief medical officers of both hospitals. All maternal participants provided written informed consent forms for participation in the study and data processing. After obtaining the consent and creating the study population database, all maternal and neonatal data were anonymized.
Independent variables
Maternal pre-pregnancy BMI (kg/m2) was calculated according to weight (kg) and height (cm) self-reported by mothers. BMI categories were: underweight (< 18.5), normal (18.5–24.9), overweight (25.0–29.9), obesity (BMI 30.0–39.9) and severe obesity (BMI ≥ 40).
Maternal social factors
Education >12 years was categorized as higher education, ≤ 12 years as lower education; employment during pregnancy was reported as “yes” if mothers worked during pregnancy at any time, as “no” if they were unemployed during pregnancy. Smoking was divided into three categories: never smoked, smoked only before pregnancy, smoked during current pregnancy. Mothers’ alcohol use was divided into two categories: no alcohol use in current pregnancy, any alcohol consumption during pregnancy regardless of quantity. Maternal health status: chronic hypertension, gestational hypertension (GH), pre-gestational diabetes mellitus (DM), gestational diabetes mellitus (GDM) were self-reported by mothers as “yes” and “no”, and cross-checked with hospital records. Gestational age (GA) at birth was calculated based on the date of the last menstrual period and the first trimester ultrasound and was obtained from the mother’s hospital records.
Co-variates
Maternal age at delivery, obstetrical history, fertilization, parity, previous miscarriages. Miscarriages: possible answers included: “never” and “yes” no matter how many times. Fertilization method was divided into two groups: “spontaneous” or “assisted reproductive technology” (including ovulation stimulation and in vitro fertilization).
Outcome; Prematurity
Newborns born < 37 weeks’ gestation were classified as premature, born ≥ 37 weeks’ gestation as term. Birthweight: Neonates were divided into categories depending on birthweight as: appropriate for gestational age (AGA): birthweight between 10th–90th percentile for GA, SGA: birthweight < 10th percentile, LGA: birthweight ≥ 90th percentile [5]. Description of the onset of labor and indications for induction of labor were obtained from hospital records. Patients were divided into groups: spontaneous or non-spontaneous PB.
Statistical analysis
The relationships between the outcome variables and BMI and other potential predictors were evaluated using either logistic regression (for binary outcomes), multinomial logistic regression (for categorical outcomes with more than two categories) or linear regression (for the model predicting gestational age). For every predictor in every model, an adjusted odds ratio (OR) was calculated along with a 95% confidence interval (95% CI) and a p-value. P-values below 0.05 were considered statistically significant. Adjusted OR provides control for other predictors. For some categorical predictors (i.e. DM, smoking), the model estimates were either extremely high or 0, due to the problem of complete separation (no valid cases in the dataset for rare categories). We have decided to leave these predictors in the models as-is, to provide control for the main predictors of interest (BMI). Age differences between BMI categories were compared with a one-way ANOVA. Post-hoc, pairwise comparisons were performed with p-value adjustment using the Tukey method. Fisher’s exact test or χ2 tests were used to compare categorical variables. The data were preprocessed in Python (v.3.10) and Pandas (v.2.1). Plots were made using Seaborn (v.0.12). Analysis was performed using R (v.4.3.2) and the packages dplyr(v.1.1.4), broom(v.1.0.5), nnet(v.7.3-19).
Results
The study included 560 mother-child pairs: 249 preterm and 311 term. There were 290 (51.8%) boys: 158 (55.5%) full-term, 132 (45.5%) preterm, and 270 (48.2%) girls: 153 (56.7%) full-term, 117 (43.3%) preterm. The mean GA was 36.6 weeks, standard deviation (SD) = 3.24 (range: 23 0/7 – 41 3/7), for term neonates 38.8, SD = 1.28, for preterm 33.9, SD = 2.86. The mean birthweight (grams) of all neonates was 2837.00, SD = 810.00 (range: 510–4715), for term neonates 3279.00, SD = 569.00, for preterm 2284.20, SD = 723.86. Overall, 35.2% of mothers were overweight or obese; 3% of all mothers were severely obese.
The mean age of all mothers was 32.0 years, SD = 4.89 (range: 17-46), for term mothers 32.1, SD = 4.55, for preterm mothers 31.9 years, SD = 5.3. Characteristics of the study group are shown in Table I.
Table I
Characteristics of the study population
Table II presents the newborn size categories (AGA, LGA, SGA) by maternal pre-pregnancy BMI.
Table II
Newborn size categories (AGA, LGA, SGA) by maternal pre-pregnancy BMI
Significant differences in age were found between BMI groups (F(3) = 6.16, p < 0.001), underweight mothers were significantly younger than normal weight (p = 0.001), underweight (p = 0.004) and overweight mothers (p < 0.001). No significant differences were found between other groups (p > 0.05). The mean age of underweight mothers was 28.6 years (SD = 5.56), for normal weight 32 years (SD = 4.64), for overweight 32.8 years (SD = 4.57) and for obese 32.1 years (SD = 5.63).
Preterm birth
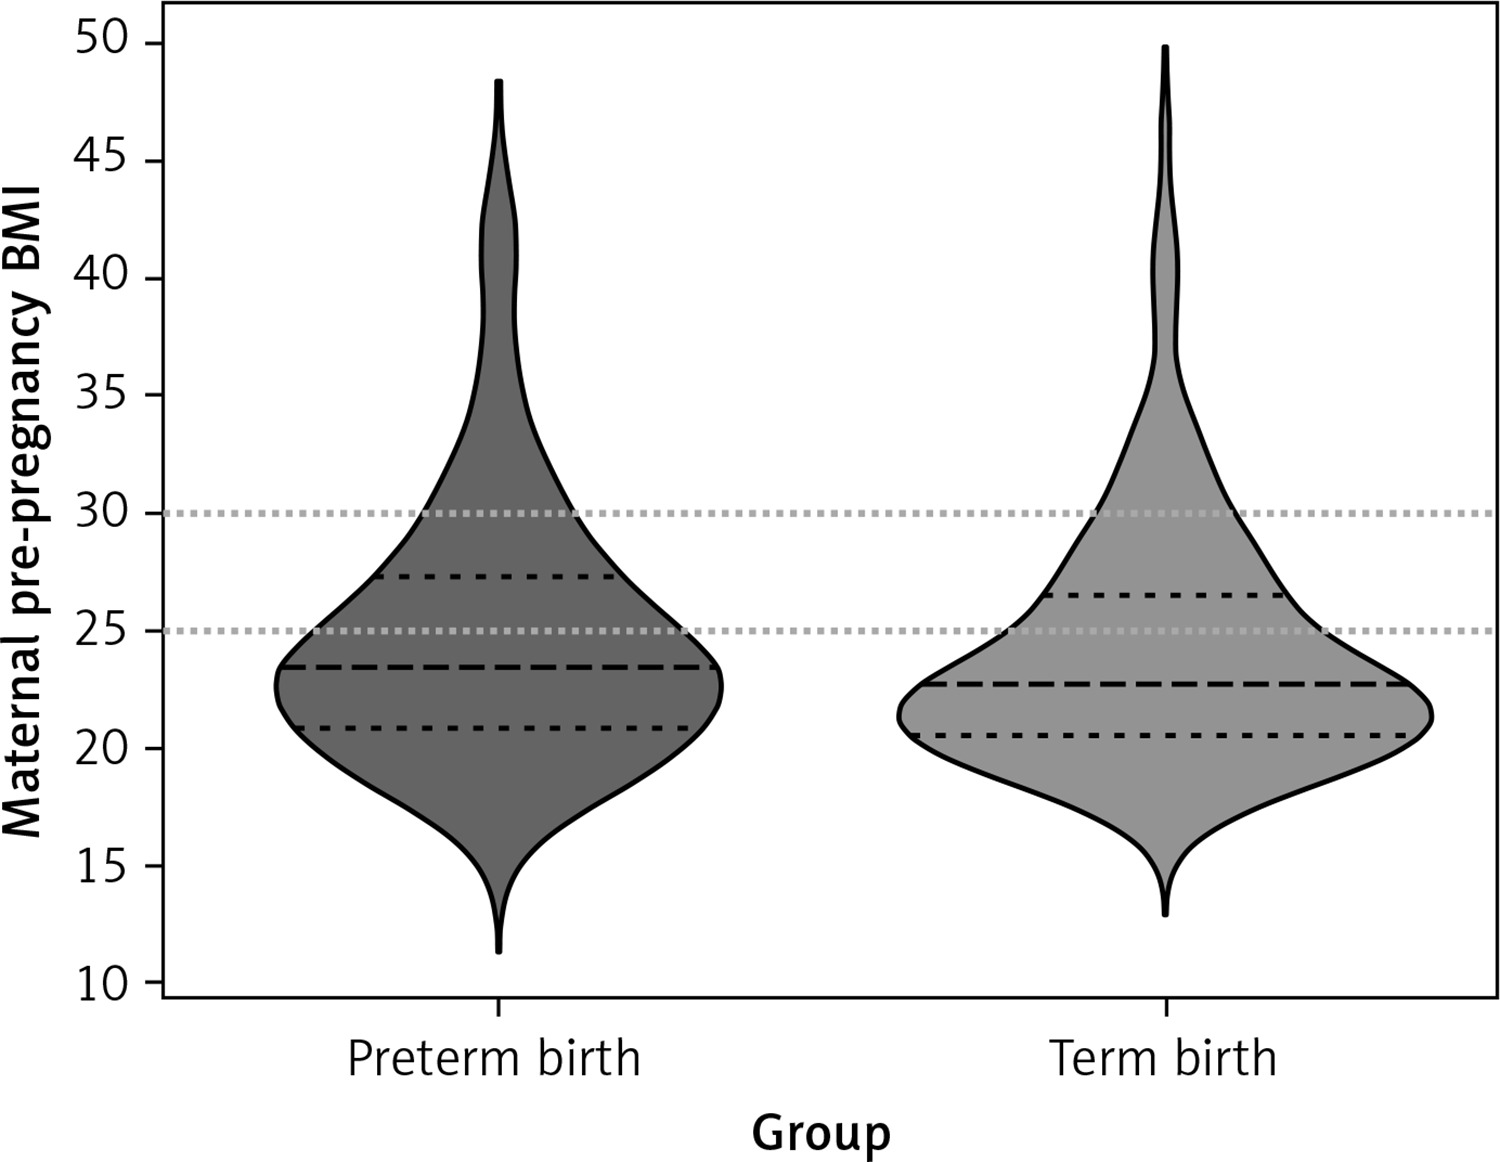
In the logistic regression model, significant predictors of PB were GH (OR = 2.33, 95% CI: 1.07–5.05, p = 0.033), lower maternal education (OR = 0.54, 95% CI: 0.30–0.97, p = 0.040), living in a smaller town/rural areas (OR = 3.00, 95% CI: 1.87–4.80, p < 0.001), and unemployment during pregnancy (OR = 0.48, 95% CI: 0.28–0.97, p = 0.006). The BMI distributions for the pre-term and term groups were similar and are illustrated in Figure 1.
Figure 1
Maternal pre-pregnancy body mass index (BMI) categories and birth outcome. Violin plot showing distributions of maternal pre-pregnancy BMI for pre-term and term births. Wider curves represent more observations at a given value. Dashed lines represent quartile ranges. Dotted lines represent cutoff points for overweight (BMI 25–29.9 kg/m2) and obesity (BMI ≥ 30 kg/m2)
The following factors did not increase the risk of PB: obesity (OR = 1.10, 95% CI: 0.53–2.27, p = 0.798), overweight (OR = 1.80, 95% CI: 0.97–3.31, p = 0.061), underweight (OR = 1.11, 95% CI: 0.35–3.49, p = 0.864), DM (OR = 3.58, 95% CI: 0.35–36.28, p = 0.281), GDM (OR = 1.01, 95% CI: 0.5–2.05, p = 0.975), chronic hypertension (OR = 2.36, 95% CI: 0.39–14.13, p = 0.347), parity (OR = 1.09, 95% CI: 0.84–1.42, p = 0.516), assisted fertilization (OR = 1.47, 95% CI: 0.67–3.24, p = 0.336), miscarriages (OR = 0.8, 95% CI: 0.42–1.5, p = 0.481), maternal age (OR = 1.02, 95% CI: 0.97–1.08, p = 0.408), low/middle SES (OR = 1.09, 95% CI: 0.27–4.41, p = 0.906), pregnancy smoking (OR = 0.58, 95% CI: 0.28–8.24, p = 0.142), quitting smoking before pregnancy (OR = 1.72, 95% CI: 0.92–3.23, p = 0.092), and pregnancy alcohol consumption (OR = 1.53, 95% CI: 0.28–8.24, p = 0.623). In the linear model, maternal obesity reduced GA by 1.55 weeks (OR = –1.55, 95% CI: –2.78- –0.31, p = 0.015), smoking during pregnancy by 1.42 weeks (OR = –1.42, 95% CI: –2.8- –0.04, p = 0.044), living in a small town/rural areas by 1.42 weeks (OR = –1.18, 95%CI –2.08- –0.28, p = 0.011). Other analyzed factors had no effect on GA (p < 0.05). Severe obesity (BMI ≥ 40) as a separate subgroup was not associated with preterm birth, χ2 test results χ² = 0.82, p = 0.663 (Supplementary Table SI).
Onset of delivery
Statistically significant predictors for medically induced PB was GH (OR = 5.46, 95% CI: 1.49–20.06, p = 0.011), maternal lower education (OR = 0.21, 95% CI: 0.06–0.83, p = 0.025), though BMI had no effect (p > 0.05).
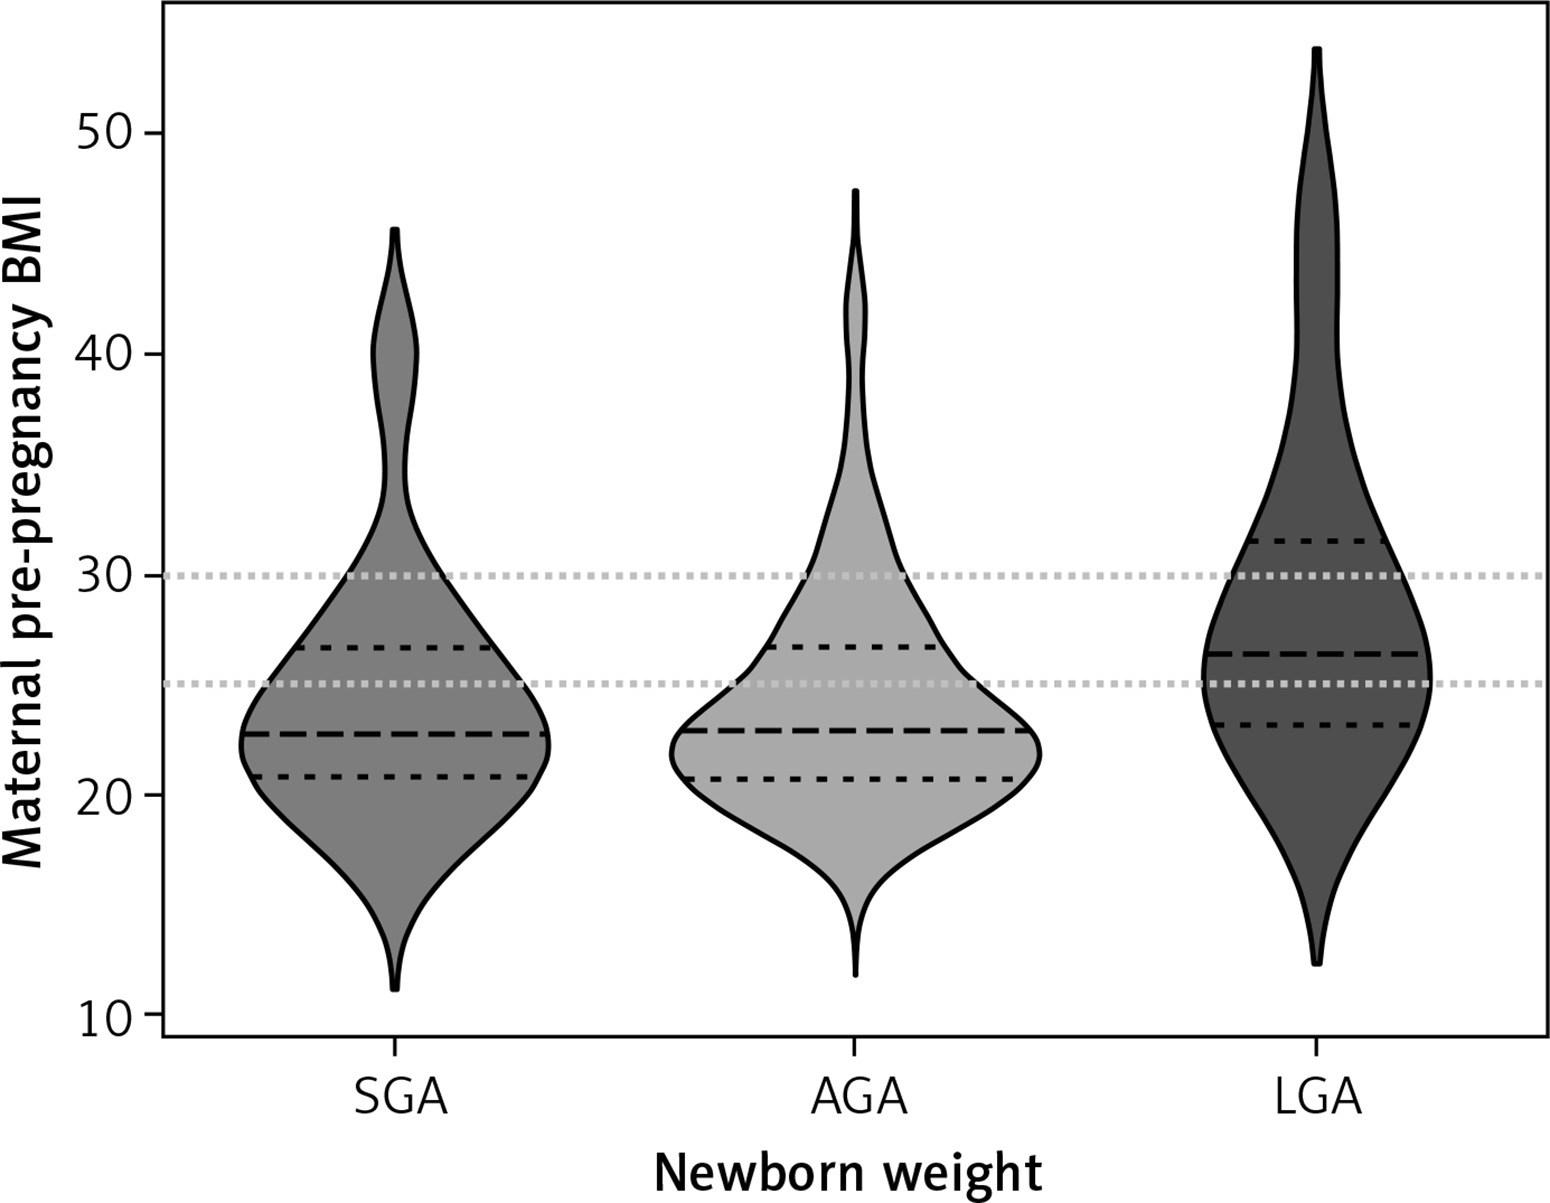
LGA and SGA newborns by maternal variables (Figure 2)
Strong predictors for LGA were maternal overweight/obesity, though DM had no effect. Maternal underweight and GH increased the risk of SGA neonate (Table III).
Table III
Association between maternal variables and LGA and SGA neonates
Figure 2
Maternal pre-pregnancy BMI categories and newborns’ birthweight. Violin plot showing distributions of maternal pre-pregnancy BMI and neonatal birthweight. Wider curves represent more observations at a given value. Dashed lines represent quartile ranges. Dotted lines represent cutoff points for overweight (BMI 25–29.9 kg/m2) and obesity (BMI ≥ 30 kg/m2)
The results of the Fisher’s exact test suggested no significant differences between the group of mothers with BMI 30–39.9 and the group with BMI ≥ 40 in terms of the number of SGA, LGA and AGA neonates (p = 0.22), perhaps due to the low sample size of mothers with severe obesity.
Discussion
The main finding was a correlation between maternal pre-pregnancy BMI and neonatal birthweight. Maternal overweight/obesity increased the risk of LGA neonates and this effect was maintained even after taking into account maternal diabetes. Underweight mothers were more likely to give birth to SGA neonates. Similar results have been previously reported [6–8]. Being born LGA is considered as a risk factor of obesity and noncommunicable disease later in life [1]. Our results present a new significance from the perspective of health outcomes of the next generations. In recent decades, due to changes of lifestyle and dietary habits, developed countries have been more likely to struggle with overnutrition than undernutrition, and the associated increased rates of overweight and obesity, which are already evident among children and adolescents, including women of reproductive age [1, 9–11]. As confirmed by our study, approximately one-third of women had an excessive BMI. It has been shown that weight loss before puberty can reduce the risk of cardiometabolic diseases later in life. Therefore, the prevention of obesity among the young population should begin at the stage of pregnancy planning. Education about maintaining a healthy bodyweight during this critical period should be on the forefront of pediatrics, obstetrics and midwife care to prevent weight-related adverse pregnancy outcomes.
Data from previous studies describing the association between pre-pregnancy obesity/overweight and PB are inconsistent, and results vary depending on maternal age, race, and ethnicity [6, 12]. Some European studies did not confirm those relationships [13]. While others have shown that obesity increased the risk of spontaneous deliveries before 27 weeks’ gestation, but this was not confirmed for deliveries at 32–36 weeks’ gestation [6]. Our study revealed slight shortening of pregnancy in obese mothers. Some studies showed pre-pregnancy obesity increased the risk of medically induced PB [6, 14]. We did not find an association between obesity and iatrogenic PB. As previously reported [13, 15], we found that GH prompted both iatrogenic and spontaneous PB and remained a risk factor for giving birth to SGA neonates. A crucial finding is that modifiable risk factors of PB, such as cigarette smoking, lower maternal education, living outside large cities, unemployment, remain the determinants of prematurity.
Introduction of an appropriately constructed strategy to promote healthy behavioral changes, avoiding stimulants is crucial to raise awareness of the impact of parental health behaviors on offspring wellbeing, especially in under-resourced communities. Our results suggest that to prevent overweight and obesity among young people, child-, adolescent- and family-centered approach should be provided. This should involve healthcare professionals, schools, communities, and health policy. Young women should be encouraged to maintain a healthy BMI and adopt healthy eating and lifestyle habits to prevent poor neonatal outcomes. Further research is needed on intergenerational obesity and whether LGA neonates are actually affected by obesity later in life.
In conclusion, maternal pre-pregnancy obesity/overweight are strong predictors of giving birth to LGA neonates, whereas maternal underweight is a predictor of SGA babies. Obesity may also decrease the length of pregnancy. GH, lower education and smoking remain determinants of PB.