

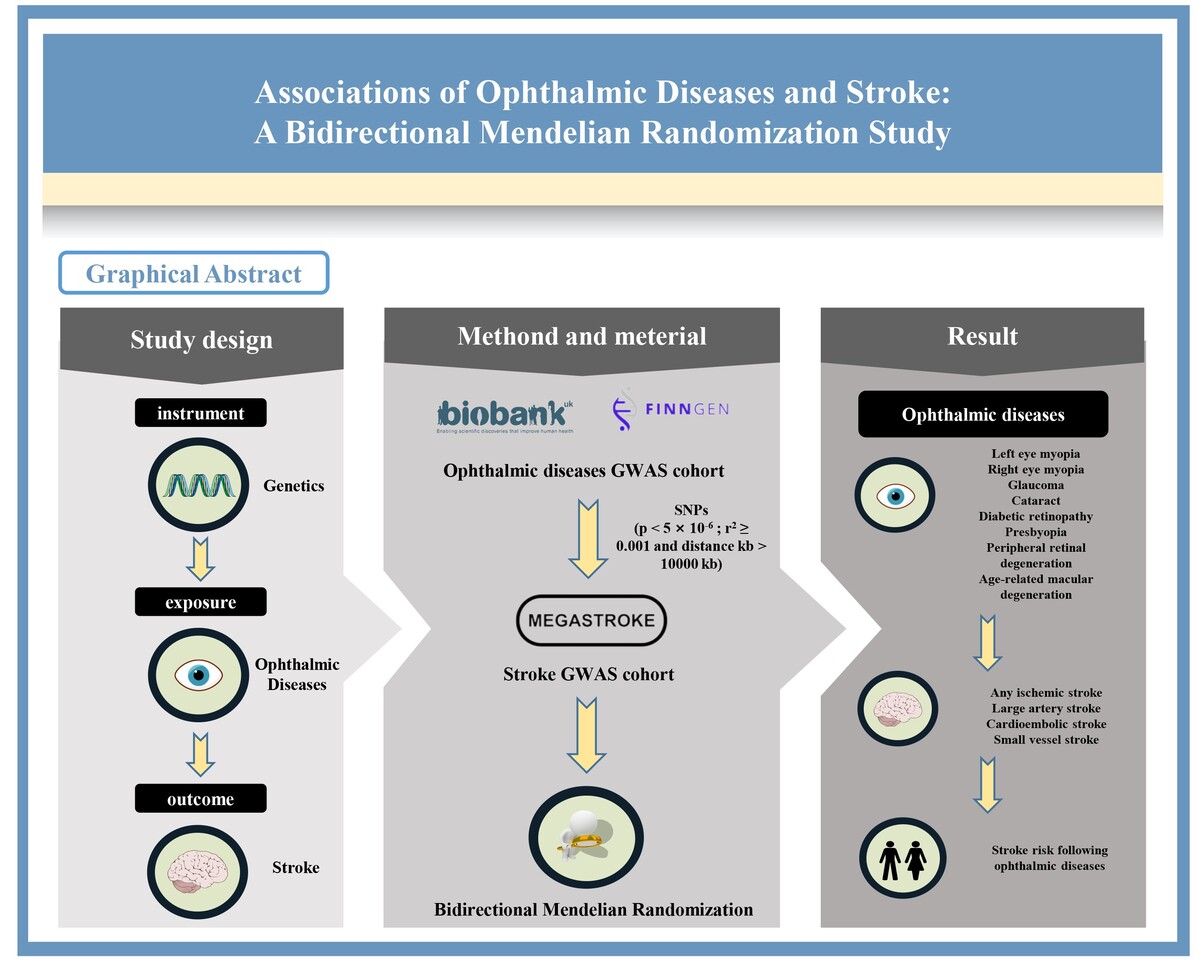
Stroke ranks as the second leading global cause of death and third major cause of disability, with its incidence and mortality rising sharply between 1990 and 2021, particularly in low- and middle-income countries [1–3]. Identifying modifiable risk factors remains critical for mitigating this burden, as existing preventive measures are not fully effective [4]. Emerging evidence links ophthalmic diseases to stroke risk via vascular or structural ocular alterations [5–7]. However, traditional observational studies are limited by confounders and reverse causality, and most focus on broad stroke categories rather than subtypes [8]. Mendelian randomization (MR) offers a robust approach to address these limitations by using genetic variants to infer causality [9–11]. To address these gaps, the present study aimed to systematically evaluate the bidirectional associations between major stroke subtypes and common ophthalmic diseases by integrating data from the China Health and Retirement Longitudinal Study (CHARLS) with two-sample MR analyses.
Methods
Data were first sourced from the CHARLS [12], a nationally representative survey covering 28 Chinese provinces, targeting adults aged over 45 years. Initiated in 2011 (17,708 baseline participants) with follow-ups in 2013, 2015, and 2018, CHARLS used a computer-assisted personal interviewing system for data collection. Eligible participants (n = 2,759) met the following criteria
complete visual ability and stroke history data, plus continuous follow-up (valid observations: 2,433 in 2013, 2,157 in 2015, 1,413 in 2018). Visual ability (myopia, hyperopia) was assessed via self-reported 5-point scales (reverse-coded; higher scores = poorer function), stroke status via binary self- or informant-reported physician diagnosis. Covariates included sociodemographics (gender, age, residence) and health behaviors (alcohol, smoking, activity). For two-sample bidirectional MR, data were restricted to European descent to minimize population stratification. Stroke subtype genetic data (AIS: 17,265 cases; CES: 7,193 cases; LAS: 4,373 cases; SVS: 5,386 cases) came from the MEGASTROKE consortium (34,217 cases and 406,111 controls); ophthalmic trait data (myopia, glaucoma, etc.) from UK Biobank and FinnGen. Missing single-nucleotide polymorphism (SNP) data were imputed per original GWAS methods; rare variants (MAF < 1%) were excluded. SNPs (instrumental variables) met genome-wide significance (p ≤ 5 × 10⁻⁶, adjusted to 5 × 10⁻⁵ if limited) and no high linkage disequilibrium (r2 ≥ 0.001, distance > 10,000 kb). MR adhered to three assumptions: SNP-exposure association, no SNP-confounder correlation, and exposure-mediated outcome effect. Eight ophthalmic traits and four stroke subtypes were analyzed.
Statistical analysis
For CHARLS-based analysis, time-varying Cox regression estimated HR (95% CI) for visual ability-stroke association (follow-up as time scale). Sensitivity analyses excluded sociodemographic/health behavior covariates to test robustness. Analyses were conducted using STATA 17; two-tailed p < 0.05 was significant. For MR-based analysis, the primary approach was inverse-variance weighted (IVW); supplementary methods included weighted median and MR-Egger. Sensitivity analyses (funnel plots, leave-one-out, Cochran’s Q, MR-Egger intercept) were performed to assess bias and pleiotropy. Analyses were conducted using the R packages Two-Sample MR (v0.4.25) and MRPRESSO (v1.0); a SNP threshold of p ≤ 5 × 10⁻⁶ was applied to minimize false positives.
Results
A total of 6,787 participants from the 2011 CHARLS baseline were included in the final analysis, with a mean age of 63.86 years (SD = 11.00); 45.85% were male (1,494 participants) and 54.15% were female (1,265 participants). Time-varying Cox regression models were used to analyze the relationship between visual ability and stroke risk, and the results showed a significant positive association between both myopia and hyperopia and stroke risk. Specifically, each one-point increase in myopia severity was associated with a 41.9% higher risk of stroke (HR = 1.419, 95% CI: 1.199–1.680), while each one-point increase in hyperopia severity was linked to a 26.0% increased stroke risk (HR = 1.260, 95% CI: 1.067–1.487). Sensitivity analyses were conducted by excluding different categories of covariates. When sociodemographic variables were excluded, myopia (HR = 1.360, 95% CI: 1.184–1.564) and hyperopia (HR = 1.312, 95% CI: 1.140–1.510) remained significantly associated with elevated stroke risk. When health behavior variables were excluded, the associations persisted, with myopia increasing stroke risk by 29.2% (HR = 1.292, 95% CI: 1.145–1.457) and hyperopia by 21.7% (HR = 1.217, 95% CI: 1.080–1.371). These sensitivity analyses confirmed that declining visual function – whether myopia or hyperopia – was strongly and positively associated with higher stroke risk.
For arterial ischemic stroke (AIS), IVW analysis showed that right-eye myopia (OR = 2.28, 95% CI: 1.256–3.950, p = 0.006) and genetically predicted peripheral retinal degeneration (PRD; OR = 1.014, 95% CI: 1.005–1.023, p = 0.003) were causally associated with increased AIS risk, with consistent results from MR-Egger and weighted median methods. No causal relationships were found between AIS and left-eye myopia, glaucoma, cataracts, presbyopia, or age-related macular degeneration (AMD). For cardioembolic stroke (CES), IVW analysis revealed that right-eye myopia (OR = 5.102, 95% CI: 1.613–16.142, p = 0.006) and PRD (OR = 1.022, 95% CI: 1.004–1.041, p = 0.017) were causally linked to higher CES risk, while other ophthalmic traits showed no significant associations. For large artery stroke (LAS), IVW analysis indicated causal associations between left-eye myopia (OR = 7.772, 95% CI: 1.160–52.066, p = 0.035), right-eye myopia (OR = 9.605, 95% CI: 2.281–40.453, p = 0.002) and increased LAS risk, with other MR methods yielding consistent significant results. For small vessel stroke (SVS), IVW analysis found that right-eye myopia (OR = 5.993, 95% CI: 1.466–24.505, p = 0.013) and PRD (OR = 1.022, 95% CI: 1.002–1.043, p = 0.029) were causally associated with higher SVS risk. In addition, MR-Egger also confirmed a significant association for right-eye myopia (OR = 118.736, 95% CI: 6.924–2036.160, p = 0.005) (Figure 1). Sensitivity analyses (MR-Egger intercept test, Cochran’s Q statistic, leave-one-out analysis) for all stroke subtypes showed no horizontal pleiotropy or significant heterogeneity in SNP effects, and symmetric funnel plots indicated no estimation bias, confirming the robustness of the findings (Table I).
Figure 1
Causal effects of ophthalmic diseases on stroke subtypes and of stroke on ophthalmic diseases (A–D). Causal effects of ophthalmic diseases on different stroke subtypes: (A) arterial ischemic stroke (AIS), (B) cardioembolic stroke (CES) (C) large artery stroke (LAS), and (D) small vessel stroke (SVS) E–L – Causal effects of stroke (AIS, CES, LAS, SVS) on different ophthalmic diseases: (E) left-eye myopia, (F) right-eye myopia E–L – Causal effects of stroke (AIS, CES, LAS, SVS) on different ophthalmic diseases: (G) glaucoma, (H) cataract E–L – Causal effects of stroke (AIS, CES, LAS, SVS) on different ophthalmic diseases: (I) diabetic retinopathy, (J) presbyopia E–L – Causal effects of stroke (AIS, CES, LAS, SVS) on different ophthalmic diseases: (K) peripheral retinal degeneration, and (L) age-related macular degeneration

Table I
Sensitivity analysis examing the causal association of stroke on ophthamic diseases
Reverse MR analysis showed that genetically increased AIS risk was causally associated with a higher likelihood of diabetic retinopathy (DR; IVW: OR = 1.136, 95% CI: 1.053–1.227, p = 0.001), with the weighted median method also supporting this association (OR = 1.122, 95% CI: 1.011–1.245, p = 0.030), though MR-Egger and weighted mode results were not significant. Sensitivity analyses for this association revealed no horizontal pleiotropy (MR-Egger intercept = 0.001, p = 0.873) or significant heterogeneity (Cochran’s Q = 48.928, p = 0.157), and leave-one-out analysis confirmed that no single SNP disproportionately influenced the causal estimate. No substantial causal relationships were identified between other stroke subtypes (CES, LAS, SVS) and any ophthalmic disease phenotypes (myopia, glaucoma, cataracts, presbyopia, PRD, AMD) (Table II).
Table II
Sensitivity analysis examing the causal association of ophthamic diseases on stroke
Discussion
This study integrated the CHARLS epidemiological survey and bidirectional two-sample MR analysis to explore the association between visual ability and stroke risk. CHARLS revealed that myopia and hyperopia were positively associated with stroke incidence in Chinese adults aged over 45 years, highlighting the value of visual assessment in public health screening. MR analysis provided genetic-level causal evidence, linking peripheral retinal degeneration and myopia to increased risks of acute ischemic stroke and other subtypes. The two approaches complemented each other CHARLS reflected real-world associations, while MR reduced confounding bias. Potential mechanisms involve vascular and inflammatory pathways [13–15]. Clinically, visual ability evaluation should be incorporated into stroke risk assessment, especially in aging populations with high myopia prevalence. Limitations include self-report bias in CHARLS and the European-centric genetic data in MR, calling for future studies in diverse cohorts with objective ophthalmic measures.
In conclusion, this study combined CHARLS data and bidirectional MR analysis to explore visual ability-stroke associations. Results from CHARLS indicated that both myopia and hyperopia were positively correlated with an increased risk of stroke among Chinese adults. Complementarily, MR analysis revealed genetic evidence linking PRD and myopia to specific stroke subtypes, while also identifying a reverse causal relationship between AIS and DR. Together, these findings suggest that assessing visual function may aid in stroke risk stratification, particularly in regions with high myopia prevalence, and highlight the importance of enhanced DR screening among AIS patients with diabetes. Nonetheless, potential recall bias in the CHARLS data and the limited generalizability of the MR findings should be acknowledged. Future studies should incorporate more diverse populations and objective measurements to further elucidate underlying causal pathways.

