Introduction
Essential hypertension, also known as primary hypertension, refers to a condition of high blood pressure without any secondary cause, and it may result in cardiovascular disease. The aetiology of essential hypertension is multifactorial, with inflammation being an important factor in its pathogenesis [1]. Studies have shown the significant role that inflammation plays in the onset and progression of cardiovascular and renal diseases [2–6].
An increased count of leukocytes (and their subtypes) is a hallmark of the inflammatory process, and it is closely associated with cardiovascular risk [7]. The neutrophil/lymphocyte ratio (NLR), which is derived from the leukocyte count, has been investigated with regard to cardiovascular risk, and it was found to be an important inflammation marker [8–11]. Similarly, the platelet/lymphocyte ratio (PLR) has been shown to be associated with important cardiovascular outcomes. This is attributed to the increased platelet activation observed in the onset and progression of atherosclerosis [12]. Additionally, serum uric acid and albuminuria, which are independent determinants of a future increase in the systolic blood pressure, may be considered among the independent risk factors for hypertension, as well as cardiovascular and renal damage [13–18].
Although the NLR and PLR have been evaluated as cardiovascular risk factors in many studies, research regarding their associations with renal damage and the estimated glomerular filtration rate (eGFR) is limited [19]. Moreover, to the best of our knowledge, there have been no studies performed in patients with chronic kidney disease (CKD) who do not require renal replacement therapy.
Therefore, in the present study, we investigated the associations between the NLR, PLR, albuminuria and serum uric acid and the eGFR. In addition, we investigated whether the NLR and PLR were independent predictors of renal damage in patients with essential hypertension and CKD stages 1–3.
Material and methods
Design and patients
This prospective study included 271 patients over 40 years old with essential hypertension and eGFRs ≥ 30 ml/min/1.73 m2 who were admitted to our internal medicine outpatient clinic between June 2017 and January 2018. All the patients were evaluated for the presence of risk factors, including secondary hypertension, hyperlipidaemia, diabetes mellitus, renal, cardiovascular and cerebrovascular diseases and smoking.
Blood pressure measurements
Hypertension was defined as systolic blood pressure (SBP) ≥ 140 mm Hg and/or diastolic blood pressure (DBP) ≥ 90 mm Hg, previously diagnosed hypertension, or use of any antihypertensive medications. The arterial BP of each patient was measured using a standardized protocol. Each patient remained at rest for at least 10 min in a seated position, and their arms were supported at the level of the heart. All of the patients wore light clothing (no tight clothing constricting the arms), and they were kept in optimal room conditions. At least two blood pressure measurements (mean: 2.2 ±0.5 measurements) at 5-min intervals were taken from each patient from both the arms in mild flexion using an aneroid sphygmomanometer (Perfect Aneroid sphygmomanometer; ERKA, Bad Tölz, Germany). The mean of the two readings from the higher arm side was accepted as the BP. If there was more than a 5 mm Hg difference between the first and second readings, additional (one or two) readings were obtained, and the average of these multiple readings was used. The SBP was accepted as the first Korotkoff sound phase, while the DBP was the fifth phase (disappearance of sounds) to the nearest 2 mm Hg. Three different cuff sizes were used in these patients according to their arm circumferences (small adult = 12 × 18 cm, standard adult = 12 × 26 cm and large adult = 12 × 40 cm) [20]. The aneroid sphygmomanometers were calibrated using a standardized mercury column manometer.
Exclusion criteria
Patients with diabetes mellitus, hematopoietic system disorders, histories of malignancy and/or chemotherapy treatment, signs of accompanying infectious diseases, leukocyte disorders (such as an acute infection or chronic inflammatory status), histories of secondary hypertension, cardiac failure and chronic liver disease, and those who had used glucocorticoid therapy within the last 3 months were excluded from the study. Comprehensive medical history was taken from the patients to exclude secondary hypertension. All of the patients underwent renal artery Doppler ultrasonography (USG), and the renal resistive indexes were measured to exclude secondary hypertension. We also scanned all of the patients for adrenal adenomas during the USG.
Each of the patients signed an informed consent form, and the study protocol was approved by the local ethics committee.
Laboratory assessments
Upon admittance, a complete blood count, including the leukocytes, neutrophils, lymphocytes and platelets, and the blood urea nitrogen, creatinine and uric acid were evaluated using venous blood. Diabetes mellitus was defined as fasting plasma glucose levels more than 126 mg/dl in multiple measurements. Venous blood was taken from the patients in the morning after 8 h of fasting. Previously diagnosed diabetes mellitus and/or use of antidiabetic medications such as oral anti-diabetic agents or insulin were considered to be DM as well. The microalbumin was evaluated in the spot urine collected from the patients. The NLR was calculated from the ratio of the neutrophil to lymphocyte counts and the PLR was calculated from the ratio of the platelet to lymphocyte counts. The eGFR was calculated using the Chronic Kidney Disease Epidemiology Collaboration (CKD-EPI) equation [21]. The patients were divided into two groups: those with an eGFR ≥ 60 ml/min/1.73 m2 (CKD stages 1 and 2) and those with 60 > eGFR ≥ 30 ml/min/1.73 m2 (CKD stage 3).
Statistical analysis
The Number Cruncher Statistical System 2007 (NCSS Statistical Software, Kaysville, UT, USA) was used for the statistical analyses. We used descriptive statistical methods (mean, standard deviation, frequency, percentage, minimum and maximum) to assess the study data. Additionally, the normality of distribution of the quantitative data was tested using the Shapiro-Wilk test and graphical examinations. For the normally distributed quantitative variables, a one-way analysis of variance was used for the comparison of more than two groups. Bonferroni-corrected post-hoc tests were used for the paired comparisons. Pearson’s correlation test was used to reveal a linear association between eGFRs, albuminuria and serum uric acid levels. A logistic regression analysis was used to assess the risk factors affecting the eGFR. To determine the cut-offs for the parameters, diagnostic tests (sensitivity, specificity, positive predictive value (PPV), negative predictive value (NPV) and accuracy) and receiver operating characteristic (ROC) curve analyses were used. The comparisons of the areas under the ROC curve were performed using the DeLong method. The statistical significance was set at p < 0.05.
Results
The present study included 185 (68.3%) females and 86 (31.7%) males, and their mean age was 63.94 ±11.19 years old. Demographic data of the two studied groups are shown in Table I.
Table I
Demographic characteristics of the two studied groups of patients according to eGFR
| Variables | All patients (n = 271) | eGFR ≥ 60 (n = 242) | 60 > eGFR ≥ 30 (n = 29) | P-value |
|---|---|---|---|---|
| Female, n (%) | 185 (68.3) | 164 (67.8) | 21 (72.4) | 0.612 |
| Male, n (%) | 86 (31.7) | 78 (32.2) | 8 (27.6) | |
| Age, mean ± SD [years] | 63.94 ±11.19 | 62.39 ±10.49 | 76.90 ±8.14 | 0.001c |
| Height, mean ± SD [cm] | 161.26 ±7.67 | 161.35 ±7.84 | 160.48 ±6.22 | 0.566c |
| Weight, mean ± SD [kg] | 78.55 ±13.94 | 79.00 ±14.01 | 74.76 ±12.91 | 0.122c |
| BMI, mean ± SD [kg/m2] | 30.22 ±5.18 | 30.35 ±5.16 | 29.10 ±5.30 | 0.221c |
| Systolic BP, mean ± SD [mm Hg] | 134.38 ±18.73 | 133.95 ±18.33 | 137.93 ±21.85 | 0.280c |
| Diastolic BP, mean ± SD [mm Hg] | 83.41 ±10.16 | 83.07 ±10.01 | 86.21 ±11.15 | 0.116c |
| Smoker, n (%) | 55 (20.3) | 48 (19.8) | 7 (24.1) | 0.586a |
| CVD, n (%) | 12 (4.4) | 9 (3.7) | 3 (10.3) | 0.125b |
| CKD, n (%) | 21 (7.7) | 11 (4.5) | 10 (34.5) | 0.001b |
| CAD, n (%) | 69 (25.5) | 55 (22.7) | 14 (48.3) | 0.003a |
| CABG, n (%) | 12 (4.4) | 10 (4.1) | 2 (6.9) | 0.624b |
| Coronary stent, n (%) | 18 (6.6) | 16 (6.6) | 2 (6.9) | 1.000b |
| Use of ACE and ARB, n (%) | 195 (72.2) | 173 (71.5) | 22 (78.6) | 0.428a |
| Use of BB, n (%) | 67 (24.8) | 59 (24.4) | 8 (28.6) | 0.627a |
| Use of CCB, n (%) | 77 (28.6) | 64 (26.6) | 13 (46.4) | 0.028a |
eGFR – estimated glomerular filtration rate (ml/min/1.73 m2), BMI – body mass index, BP – blood pressure, CVD – cerebrovascular disease, CKD – chronic kidney disease, CAD – coronary artery disease, CABG – coronary artery bypass graft, ACE – angiotensin converting enzyme, ARB – angiotensin receptor blockers, BB – β-blockers, CCB – calcium channel blockers.
The NLR, albuminuria and uric acid levels of the patients with stage 3 CKD were higher than those with stages 1 and 2 (p = 0.013, p = 0.001 and p = 0.001, respectively). However, no statistically significant difference was detected for the PLR. The results of the laboratory tests are shown in Table II.
Table II
Laboratory assessments of different measured variables in the two studied groups
| Variables | All patients (n = 271) | eGFR ≥ 60 (n = 242) | 60 > eGFR ≥ 30 (n = 29) | P-valuec |
|---|---|---|---|---|
| Glucose, mean ± SD [mg/dl] | 104.57 ±22.77 | 104.27 ±20.92 | 107.03 ±35.02 | 0.538 |
| Creatinine, mean ± SD [mg/dl] | 0.83 ±0.19 | 0.80 ±0.17 | 1.12 ±0.10 | 0.001 |
| T. cholesterol, median (min.–max.) [mg/dl] | 191 (97–395) | 191 (97–395) | 180 (106–264) | 0.236 |
| Triglyceride, median (min.–max.) [mg/dl] | 133 (43–576) | 137 (43–576) | 122 (51–277) | 0.102 |
| HDL, mean ± SD [mg/dl] | 45.41 ±9.19 | 45.33 ±8.96 | 46.07 ±11.08 | 0.684 |
| LDL, median (min.–max.) [mg/dl] | 113 (45–294) | 113 (46–294) | 106 (45–196) | 0.668 |
| Albuminuria, median (min.–max.) [mg/dl] | 22 (3.16–2446) | 20 (3.2–694) | 39 (5–2446) | 0.001 |
| Uric acid, median (min.–max.) [mg/dl] | 5.6 (1.3–10.8) | 5.4 (1.3–10.8) | 7.1 (1.3–8.9) | 0.001 |
| Leukocytes, median (min.–max.) [× 103/μl] | 7.2 (3.42–13) | 7.2 (3.4–13) | 7.5 (4.3–12.1) | 0.161 |
| Platelets, median (min.–max.) [× 103/μl] | 229.4 (94.39–454.6) | 230.1 (94.4–454.6) | 214.2 (104.1–352.1) | 0.164 |
| Neutrophils, median (min.–max.) [× 103/μl] | 4.8 (1.16–10.6) | 4.1 (1.2–10.7) | 4.6 (2.2–9.3) | 0.103 |
| Lymphocytes, median (min.–max.) [× 103/μl] | 2.2 (1.02–5.28) | 2.2 (1–5.3) | 2.1 (1.1–3.5) | 0.078 |
| NLR, median (min.–max.) | 1.9 (0.49–8.53) | 1.8 (0.5–8.5) | 2.3 (0.9–6.4) | 0.010 |
| PLR, median (min.–max.) | 105.1 (43.19–288.63) | 103.4 (43.2–288.6) | 109.3 (64.3–200.9) | 0.773 |
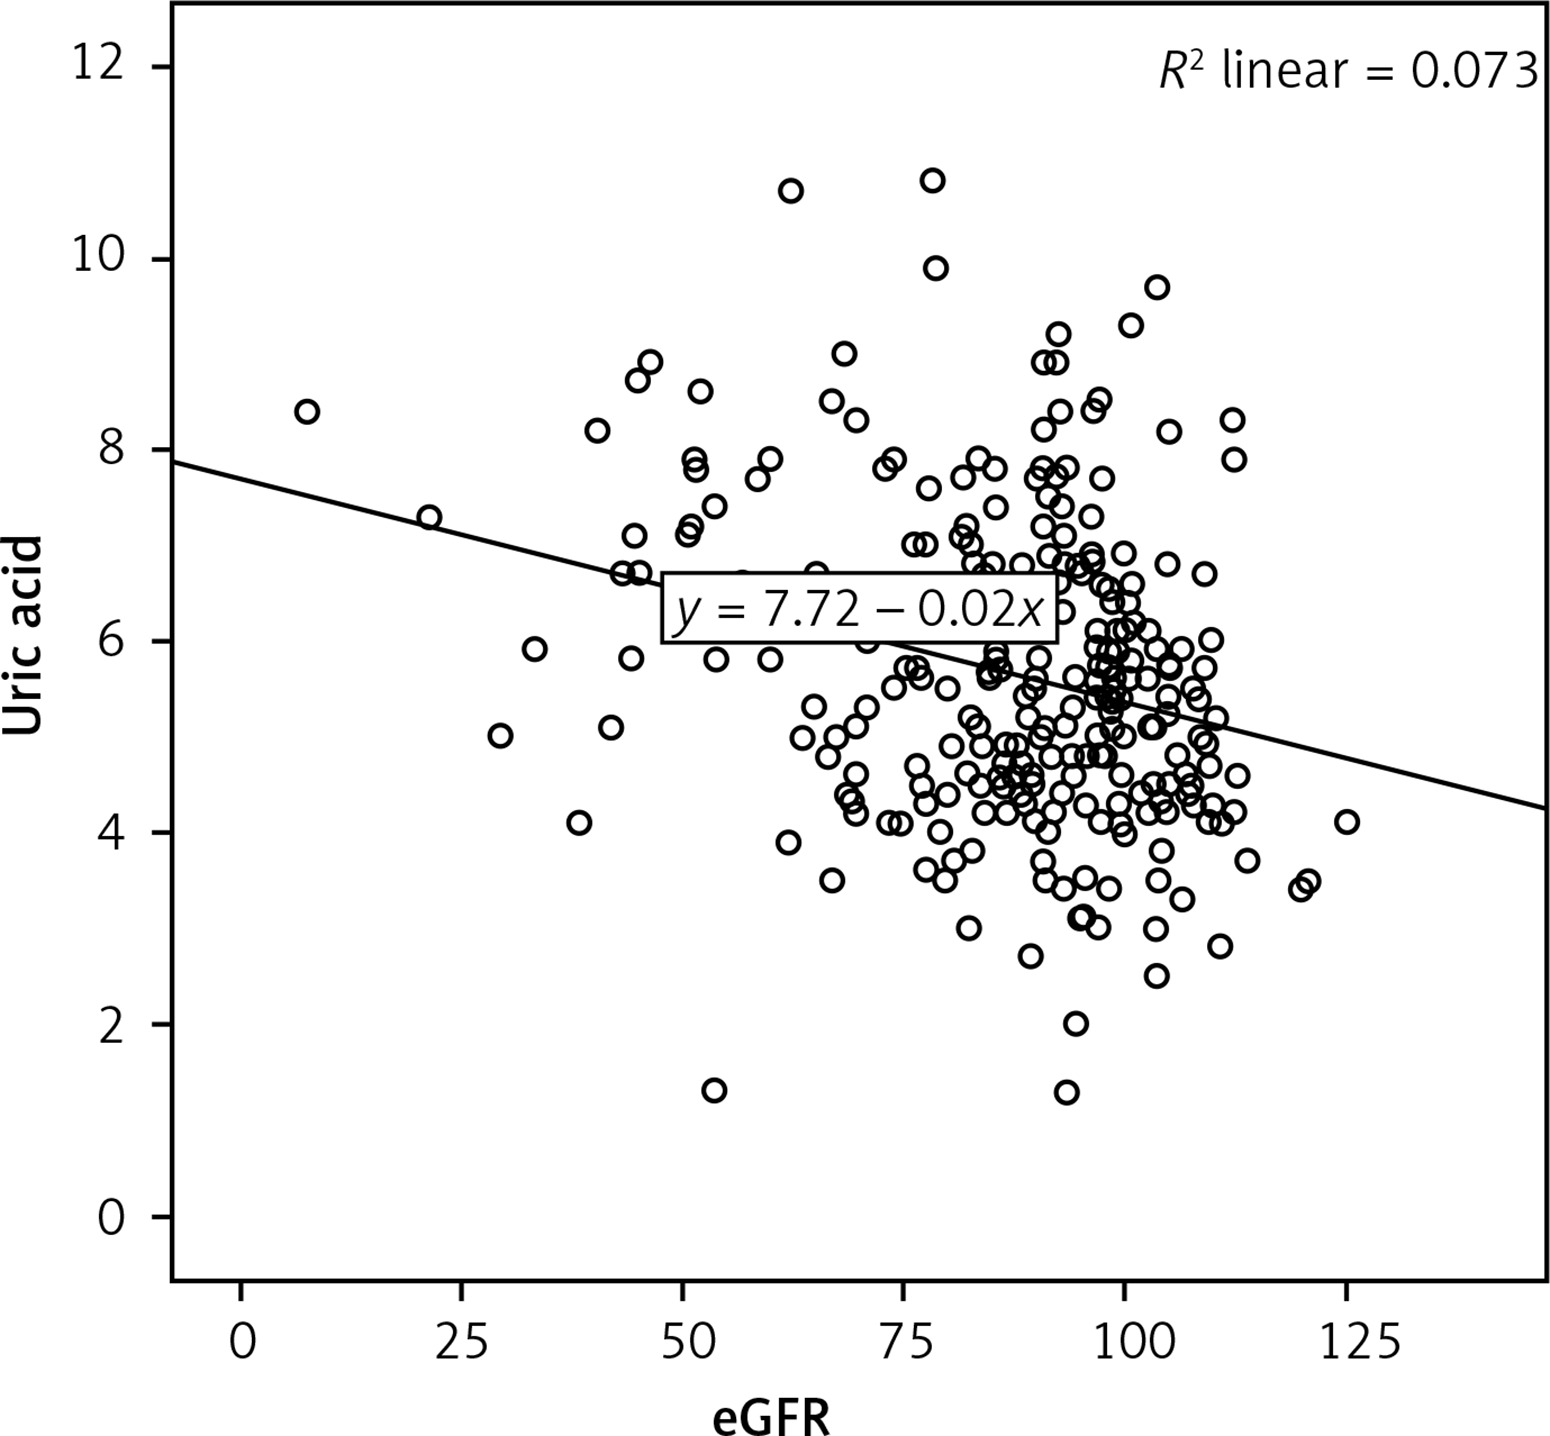
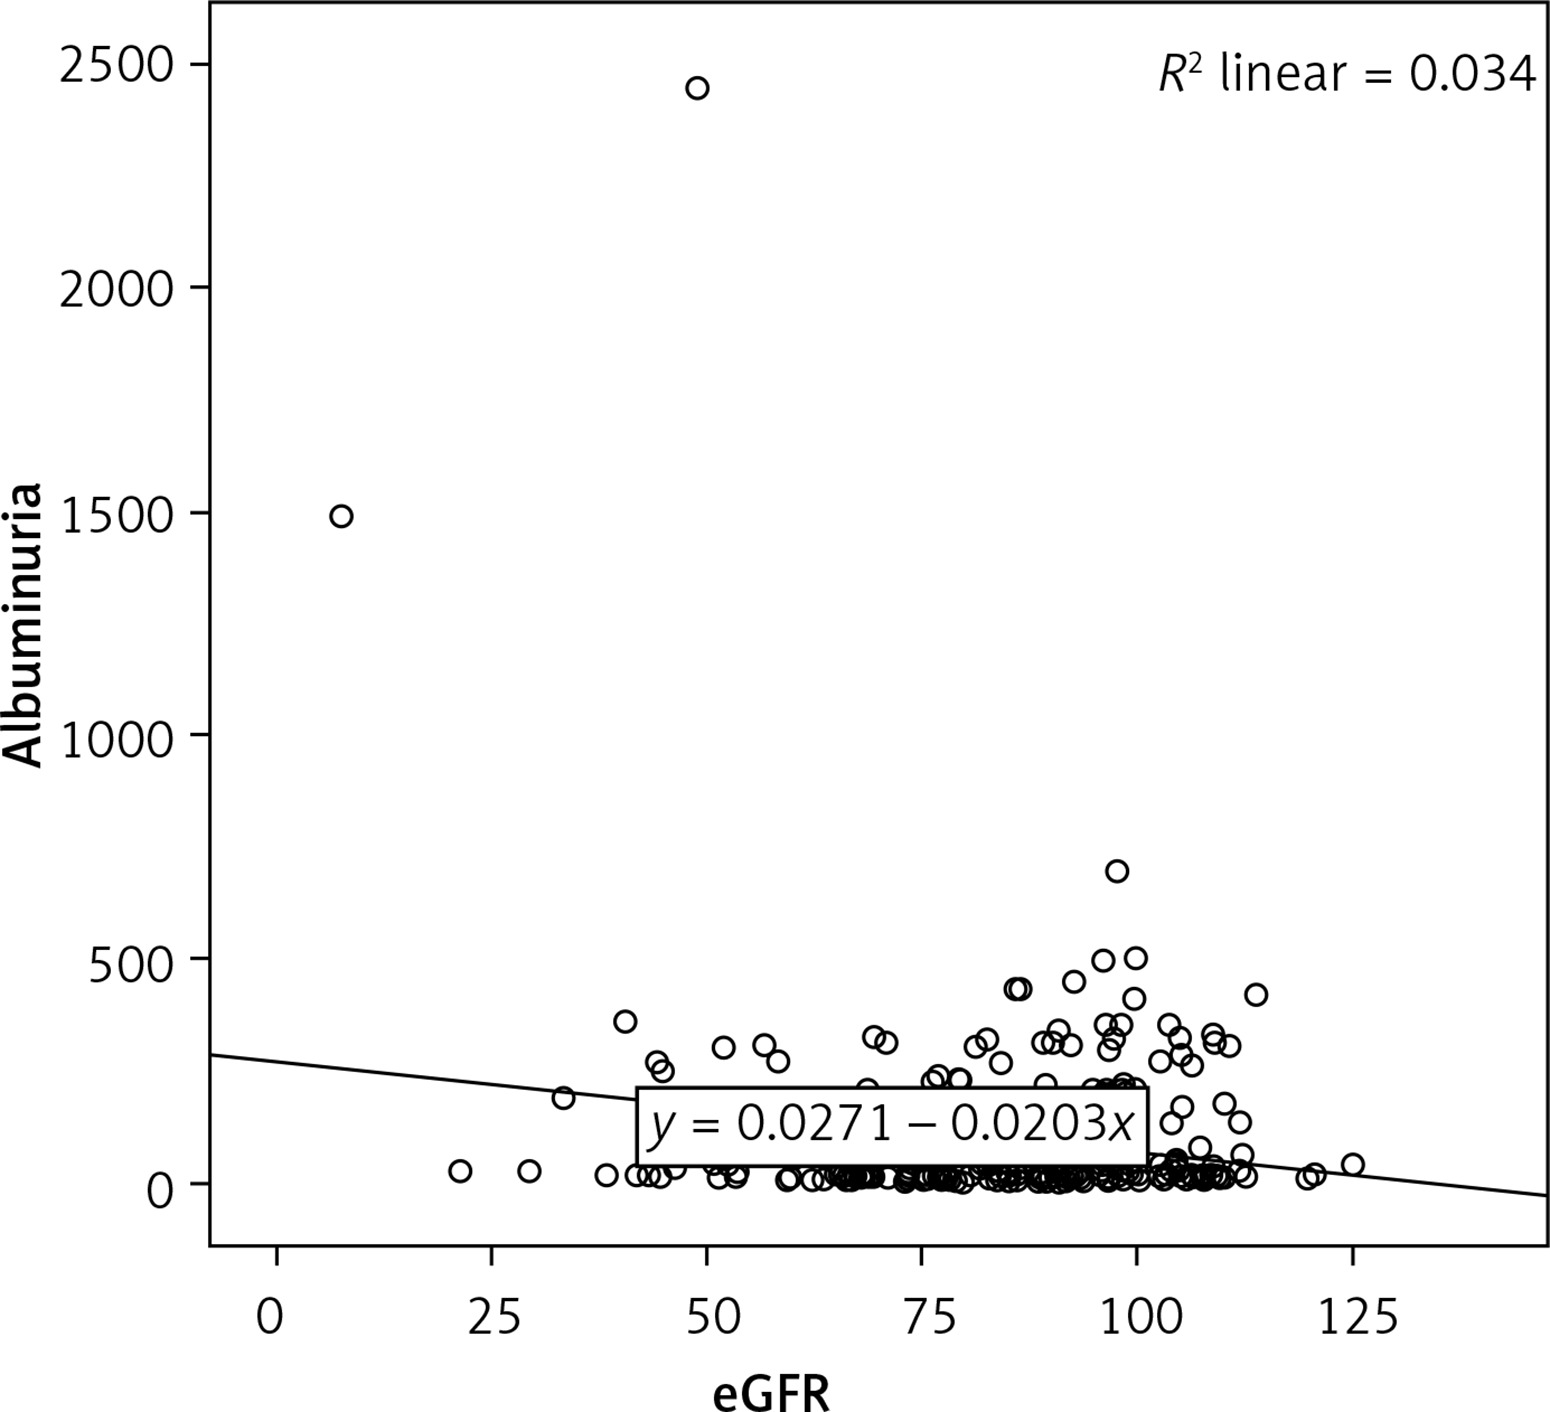
There was a negative, weak (low r), but statistically significant correlation between the eGFR and the uric acid level (r = –0.270, p < 0.001) (Figure 1). There was a negative, weak (low r), but statistically significant correlation between the eGFR and the albuminuria level (r = –0.185, p= 0.002) (Figure 2).
The results of the diagnostic tests and ROC curves for the stage 3 patients are shown in Table III.
Table III
Diagnostic tests and ROC curve results for CKD stage 3
The areas under the ROC curves were 64.3% for the NLR, 63.4% for the albuminuria and 74.3% for the uric acid. The areas under the ROC curves for the NLR and albuminuria were very similar to each other, whereas the area for uric acid was larger. However, no statistically significant differences were detected between the NLR and albuminuria, between the NLR and uric acid, and between albuminuria and uric acid for the areas under the ROC curves. The evaluations regarding the ROC curves are depicted in Table IV and Figure 3.
Table IV
Evaluations of NLR, PLR, albuminuria and uric acid regarding areas under ROC curves
| Variables | Area under the curve | ||||
|---|---|---|---|---|---|
| Area | Std. error (a) | P-value | 95% CI | ||
| Lower | Upper | ||||
| NLR | 0.643 | 0.058 | 0.013 | 0.583 | 0.700 |
| PLR | 0.526 | 0.056 | 0.644 | 0.465 | 0.587 |
| Albuminuria | 0.634 | 0.052 | 0.009 | 0.574 | 0.692 |
| Uric acid | 0.743 | 0.047 | < 0.001 | 0.687 | 0.794 |
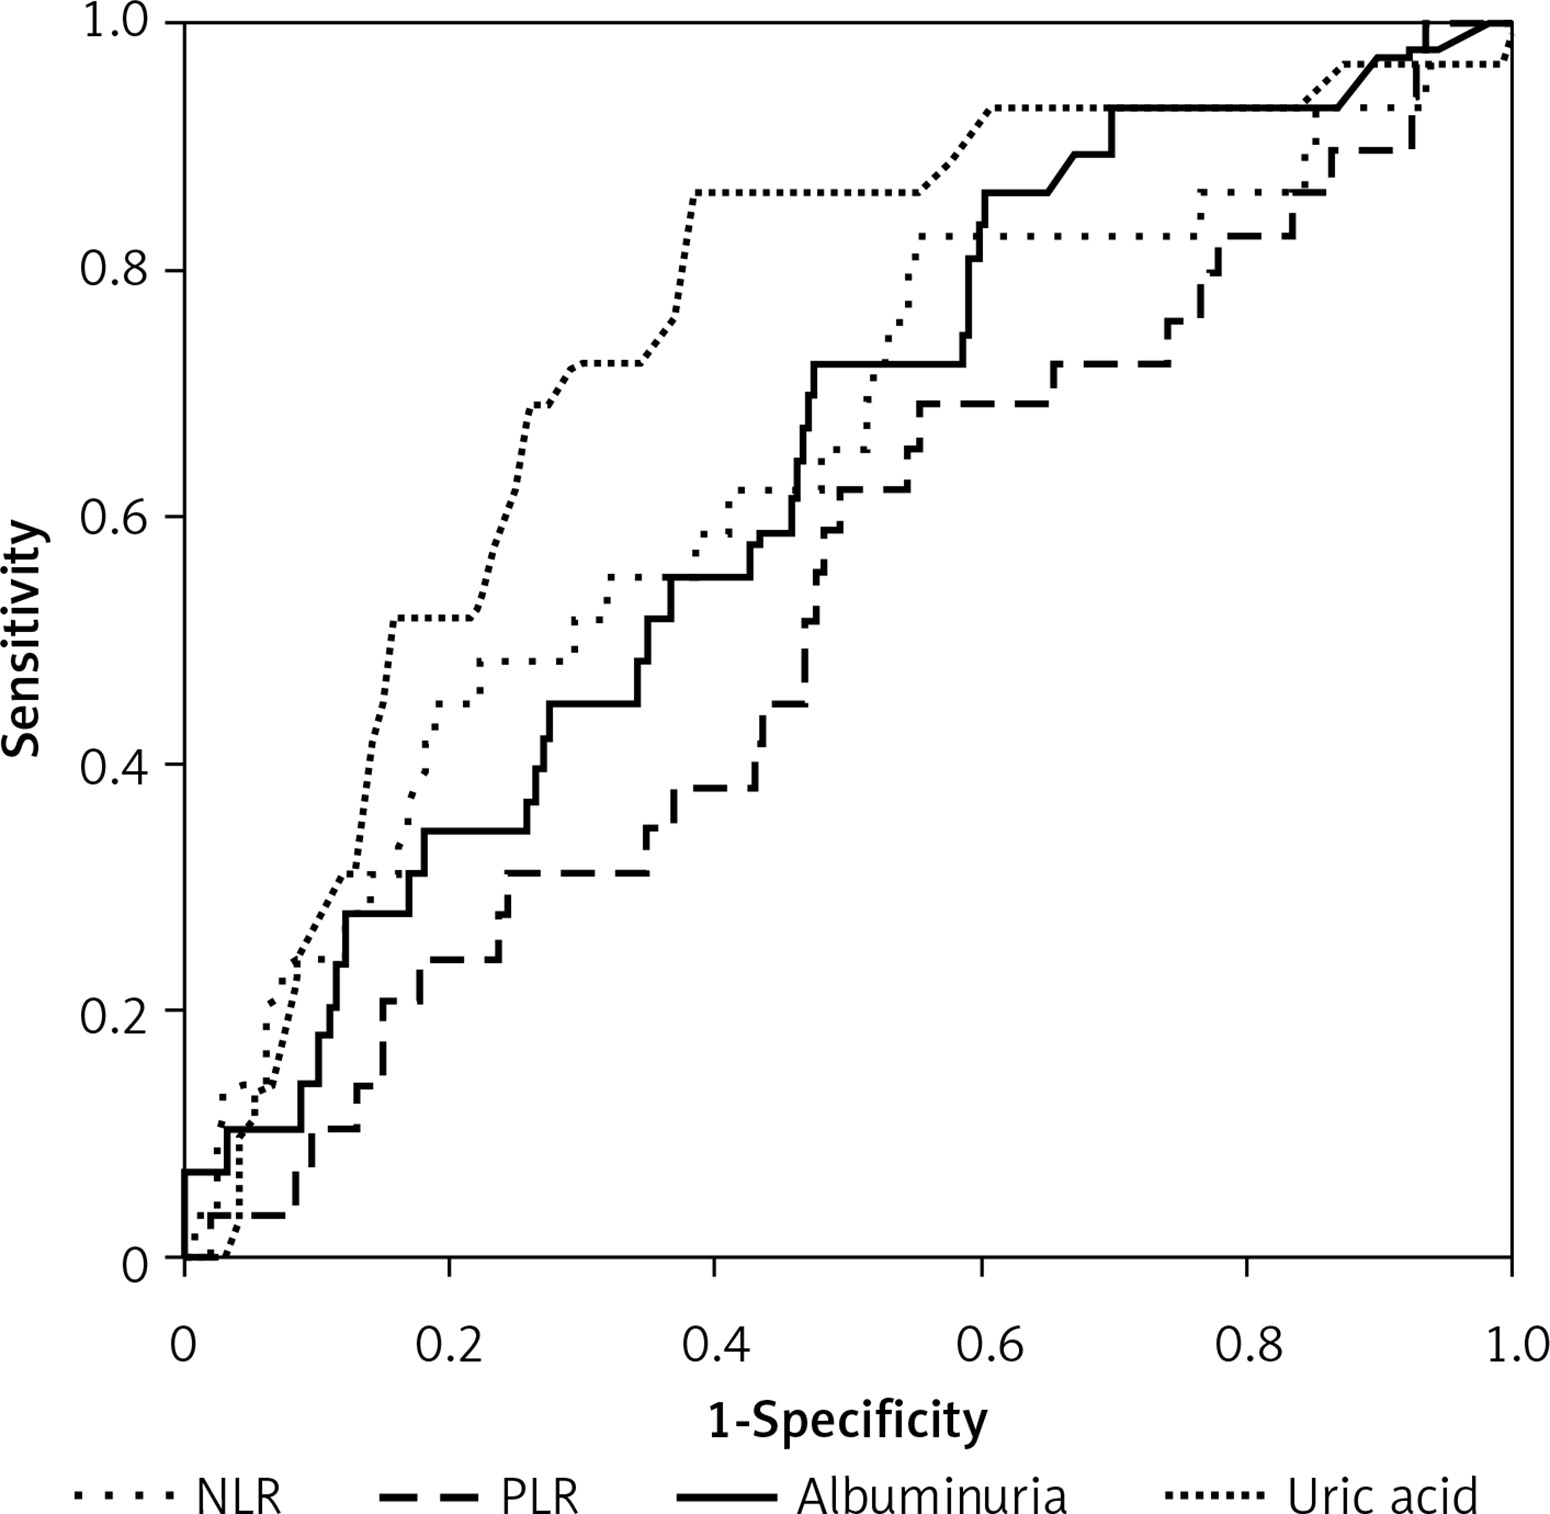
An evaluation of the risk factors affecting the eGFR, including the NLR, PLR, albuminuria and uric acid, using a stepwise logistic regression analysis revealed the model to be significant, with an explanatory coefficient of 89.7%. At the end of step 3, albuminuria and uric acid were found to be significant variables in the model and independent risk factors affecting the eGFR (p < 0.05). However, the NLR and PLR did not affect the eGFR statistically significantly. The results of the logistic regression analysis of the risk factors affecting the eGFR are shown in Table V.
Discussion
The current study investigated the associations between the NLR and PLR and the eGFR, and their ability to serve as independent risk factors for renal damage. To the best of our knowledge, this is the first study in the literature to assess the potentials of the NLR and PLR as predictors of essential hypertension in patients with CKD stages 1–3.
This study demonstrated higher NLR, albuminuria, and uric acid levels in the patients with stage 3 CKD than in those with stages 1 and 2. However, no statistically significant difference was detected in the PLR. In the stage 3 patients, the albuminuria and uric acid were found to be independent risk factors affecting the eGFR, but the effects of the NLR and PLR on the eGFR were not statistically significant.
Derived from the leukocyte count, the NLR is an inexpensive, routinely used and reproducible test that has been revealed by many studies to be an indicator of the systemic inflammatory response. In addition, many studies have shown it to be associated with poor clinical outcomes in cardiac disease and several malignancies [8–11, 22, 23]. The NLR is a parameter that provides information not only about the inflammation, but also about the stress response of the patient. A high neutrophil count primarily reflects infection, while a low lymphocyte count indicates poor general health and physiological stress [10]. The blood NLR is an indicator of the general inflammatory condition and stress status of the body. A recent study reported that the NLR was associated with an increased mortality rate and poor prognosis in acute coronary syndrome, especially when ST-segment elevation is present [11]. In light of the above findings, the NLR may be a beneficial and cost-effective method to evaluate the inflammatory status. Because the inflammatory parameters and NLR are increased in diabetic patients [24, 25], we excluded diabetic patients from our study. We aimed to assess whether the NLR, an inflammatory marker in non-diabetic CKD patients, was increased or not.
A high platelet and low lymphocyte count are associated with adverse cardiovascular outcomes. For instance, Azab et al. found that a high PLR could serve as an indicator of long-term mortality in patients with acute coronary syndrome without ST-segment elevation [26]. Elevated NLR or PLR levels have been demonstrated to be associated with various adverse clinicopathological conditions in patients with certain malignancies, including ovarian cancer, colorectal cancer and pancreatic ductal adenocarcinoma [22, 23, 27]. Moreover, associations between the NLR and PLR and cardiovascular disease have been demonstrated in many studies [26, 28, 29]. For example, Sunbul et al. showed them to be significantly higher in non-dipper hypertension patients when compared to dipper hypertension patients. Furthermore, the PLR (not NLR) has been shown to be an independent predictor of non-dipper hypertension [29]. Another recent study reported the NLR to be a predictor of all-cause mortality in geriatric patients with CKD stages 3–5 [19]. Similarly, in the present study, an increased NLR was observed in the patients with CKD stage 3. The NLR level, especially in patients with values of 1.9 or more, demonstrated a high specificity in predicting a low eGFR (similar to albuminuria and uric acid). Additionally, at a cut-off of 5.8, the NLR showed a specificity of more than 99%. In their study, Tatar et al. did not find a statistically significant association between the PLR and eGFR in patients with CKD stages 3–5 [19]. Similarly, we did not detect a significant association between the eGFR and PLR in patients with CKD stages 1–3.
Both microalbuminuria and macroalbuminuria are considered to be indicators of the progression of renal dysfunction, and they are still in use. They also serve as predictors of cardiovascular disease [17, 18, 30]. Especially in the geriatric population with normal renal function, the detection of microalbuminuria is indicative of silent and asymptomatic systemic vascular progression [18]. In addition, the data in the current study demonstrated that albuminuria was an independent predictor of renal damage in patients with CKD stage 3.
A serum uric acid elevation is a common manifestation of essential hypertension, and it is associated with high blood pressure [15, 31, 32]. Moreover, it is a potential factor in the development and/or progression of end-organ damage as a result of its association with the hypertensive status through several direct and indirect mechanisms [31–33]. One recent study proved that the serum uric acid was an independent factor, with a direct role in the development of CKD [34]. Similarly, we found that a serum uric acid level above 6.2 mg/dl showed high specificity as an independent predictor of renal damage.
The present study evaluated the independent predictors of eGFR in patients with CKD stage 3. At an NLR > 1.998, the sensitivity was 62.07% and the specificity was 59.09%; the PPV was 15.4% and the NPV was 92.9%. The areas under the ROC curves were 64.3% for the NLR, 63.4% for albuminuria and 74.3% for uric acid. The similarity of the areas under the ROC curves for the NLR and albuminuria is striking, although the area for the uric acid was higher. Moreover, albuminuria and uric acid were independent risk factors affecting the eGFR. However, the effects of the NLR and PLR on the eGFR were not statistically significant.
We included all patients with essential hypertension who were referred to the internal medicine clinic of our hospital. However, the number of enrolled females in the present study was higher than that of males (68.3% vs. 31.7%). This may be due to greater negligence and non-compliance of males as regards seeking medical advice and consumption of medication. Moreover, women consider their illnesses to be more important than men do, and they regularly follow-up with their doctor visits more carefully than men. Furthermore, according to our hospital statistics, women are 3 times more likely to be examined than men. Thus, there was a gender bias in our study. In addition, it is known that oestrogen levels provide protection against inflammation and cardiovascular diseases. While higher oestrogen levels are associated with lower inflammation and a lower probability of ischemic stroke, cognitive functions are also found to be better in these patients [35, 36]. This selection bias may have affected our results. We included all essential hypertensive patients with eGFRs ≥ 30 ml/min/1.73 m2 in our study. However, angiotensin receptor blockers (ARB), such as losartan, which protects patients against nephropathy, could have been listed in the exclusion criteria.
In conclusion, the NLR and PLR were not independent predictors of the eGFR and renal damage (in CKD patients who do not require renal replacement therapy). Based on the current data, future studies including more patients and different populations are warranted to evaluate the applicability of this NLR model.