Introduction
Uric acid (UA) is produced as the end product of oxidation of purine compounds [1]. Elevated levels of UA in the blood, known as hyperuricaemia, can lead to conditions like arthritis and gout. The incidence of hyperuricaemia worldwide has been on the rise [1]. Typically, hyperuricaemia is diagnosed when UA levels in males exceed 420 µmol/l and in females surpass 360 µmol/l [2]. Several research studies have confirmed a significant link between high levels of UA and cerebrovascular conditions, such as strokes in adults (both ischaemic and haemorrhagic), increasing the risk of cerebrovascular incidents and brain infarction [3]. Moreover, hyperuricaemia is a standalone indicator of unfavourable results after an ischaemic stroke (mortality or disability) and subsequent cerebrovascular incidents post-stroke [4]. Elevated levels of UA are also identified as a risk factor for repeated ischaemic strokes in elderly individuals, with a connection noted between UA levels and the recurrence of strokes [5]. However, existing experimental data do not fully elucidate how high levels of UA induce cerebrovascular disorders. Prior research has shown a connection between these illnesses and abnormal hyperreactivity of the blood vessels in the brain, leading to heightened narrowing of the cerebral blood vessels. This may contribute to delayed reduction in blood flow to the brain following a lack of blood supply [6]. Upregulation of cerebral vasoconstrictor receptors can significantly enhance cerebral vasoconstriction. Therefore, it is imperative to investigate whether elevated levels of UA upregulate contractile receptors on cerebral arteries, subsequently leading to an increase in cerebrovascular hyperresponsiveness.
Endothelin-1 (ET-1), the most powerful endogenous vasoconstrictor, is chiefly secreted by endothelial cells. It binds to 2 G protein-coupled receptors, ETA and ETB [7]. The ETA receptor, located on vascular smooth muscle cells, is linked to potent vasoconstriction [8]. Meanwhile, ETB receptors, with ETB2 on VSMCs causing contraction and ETB1 on the endothelium promoting vasodilation through nitric oxide and other vasodilators, play a dual role in vascular function [8]. It is important to mention that ET receptors can be altered by different factors like illnesses and medications [9]. Under normal physiological conditions [10], the ETB receptor mediates vasodilation; however, under pathological influences such as cerebral ischaemia [11], atherosclerosis [12, 13], hypertension [14] in humans, and subarachnoid haemorrhage [15], cerebral ischaemia [16–18], and hypertension [19–21] in rats, there is an upregulation of ETB2 receptor in VSMCs resulting in significant contractions. Elevated levels of UA also pose a significant risk for cerebrovascular diseases; however, its effect on ET receptors is still unclear.
In this investigation, we study the effect of high levels of UA on ET receptors of cerebral arteries primarily to elucidate whether high levels of UA enhance the contraction mediated by ET receptors in cerebral artery and its potential mechanism. The findings from this investigation may offer novel perspectives on hyperuricaemia-associated cerebrovascular disorders.
Material and methods
Animals and reagents
Male Sprague-Dawley rats weighing 200–250 g were acquired from Beijing Vital River Laboratory Animal Technology Co., Ltd. in China. Approval for the experimental procedure was granted by the Laboratory Animal Ethics Committee at Wenzhou Medical University (No. wydw2019-0858). The study followed the National Institutes of Health Guide for Laboratory Animals (NIH Publications No. 80-23, revised 1978).
Endothelin-1 (ET-1) and sarafotoxin 6c (S6c) were acquired from China Peptides and then dissolved in a solution composed of 0.9% saline and 0.1% bovine serum albumin. MAPK pathway inhibitor SB203580 (for p38 pathway), SP600125 (for JNK pathway), U0126 (for ERK1/2 pathway), and ETB receptor antagonist BQ 788 were obtained from Selleck (Houston, Texas, USA) and Sigma (St. Louis, Missouri, USA). These compounds were dissolved in dimethyl sulfoxide (DMSO) for experimental use. Each inhibitor was added in a volume of 1 µl to the corresponding culture wells, while an equal amount of DMSO was used as a control. Final molar concentrations in the tissue baths were displayed.
Artery culture
Rats were anaesthetised with CO2 and sacrificed. Middle cerebral arteries were carefully separated, sliced into ring segments measuring 1~2 mm, and then transferred to the wells of a 24-well plate containing Dulbecco’s modified Eagle’s medium without serum. Artery segments were divided into various experimental categories including a Fresh group, Control group (using DMSO as the solvent), UA group (200, 400, and 800 µmol/l), UA 400 µmol/l + inhibitor groups, and DMSO + inhibitor groups (n = 12 experiments per group, and only one sample was taken from each rat). The plates were incubated at 37°C in humidified 5% CO2 and 95% air for 24 h.
Contractile function studies
A wire myograph was used to record artery contractile function. Two thin wires (40 mm in diameter) were used to thread each artery segment, which was then mounted in myograph baths containing 5 ml of Krebs solution. The segments were permitted to reach a stable state at 1.5 mN for a minimum of 1 h. Arterial activity was tested by K+-rich Krebs solution (containing 60 mmol/l KCl). Only segments that elicited reproducible responses > 1 mN to K+ were used. The selective ETB receptor agonist, S6c, was gradually introduced at concentrations ranging from 10–7 to 10–11 M into the tissue baths. This allowed for a concentration-response curve specific to the ETB receptors. Following the inhibition of ETB receptors with BQ788, the contractions elicited by ET-1 (10–7–10–11 M), which acts as an agonist for both ETB and ETA receptors, were assessed. These response curves were specifically attributed to the activation of ETA receptors.
RT-PCR
Total RNA was isolated from samples of cerebral arteries by using an E.Z.N.A. @MicroElute Total RNA Kit (R6831-02, Omega Biotech, Co. Ltd.). Reverse transcription-PCR Kits (Bioer Technology Co., Ltd., China) were utilised to synthesise cDNA from mRNA. RT-PCR was conducted with SYBRs Premix Ex TaqTM Kits from Takara, Japan, using the iQTM5 Multicolor Real-Time PCR Detection System by Bio-Rad, USA. Specific primer sequences for ET receptor genes were designed as follows: ETA receptor, forward: 50-GTC GAG AGG TGG CAA AGA CC-30; ETA receptor, reverse: 50-ACA GGG CGA AGA TGA CAA CC-30; ETB receptor, forward: 50-TGACGCCACCCACTAAGACC-30; ETB receptor, reverse: 50-GGCACGGAGGAGGGAAGG-30. ET receptor gene expression levels were compared using β-actin mRNA as an internal reference during the measurement process and were expressed as a fold-change relative to the fresh group (n = 6 rat for each group).
Western blot
The protein content in cerebral artery (n = 3 rat for each group) extracts was determined using a BSA assay kit. Equal portions of 40 µg protein were electrophoresed and transferred to a nitrocellulose membrane. Following a 2-h period of incubation at ambient temperature with 5% non-fat milk to prevent non-specific binding, the membranes were exposed to primary antibodies overnight at 4°C: rabbit anti-ETA receptor (Abcam, ab85163) at 1 : 300, rabbit anti-ETB receptor (Abcam, ab262700) at 1 : 500, and mouse anti-β-actin receptor (Santa Cruz Biotechnology, sc-47778) at 1 : 2000. Following this, the membranes were exposed to secondary antibodies at room temperature for 1 h. Finally, protein bands were detected by chemiluminescent HRP substrate and captured using a computerised chemiluminescent image analysis system (Bio-Rad, Hercules, CA). Band intensity was analysed using the Imaging J System (Media Cybernetics, Bethesda, MD).
Immunohistochemistry
Cerebral arterial tissues (n = 3 rat for each group) were prepared by fixation and dehydration, followed by cutting into slices of 10 µm thickness. Next, these sections were incubated in a 10% goat serum solution for 30 min at 37°C. Afterward, they were permitted to engage with primary antibodies at a temperature of 4°C for the duration of the night: mouse anti-ETA receptor (Santa Cruz Biotechnology, sc-518060) diluted at 1 : 500; sheep anti-ETB receptor (Abbexa, abx411769) diluted at 1 : 300. Ultimately, the tissue sections were exposed to secondary antibodies – either goat anti-mouse IgG H&L conjugated with FITC (Bioss, bs-0296G-FITC) or donkey anti-sheep IgG H&L (Santa Cruz Biotechnology, ab150177) – for 1 h under dark conditions. Immunoreactivity was visualised using an epifluorescence microscope (Olympus BX53, Tokyo, Japan) and photographed with a digital camera. Data analysis was performed using Image J software. Omission of primary antibodies served as a negative control.
Statistical analysis
Data are presented as the average value with the standard error of the mean (SEM). Statistical analyses were conducted using GraphPad Prism software version 8.2. Emax refers to the highest level of contraction observed, whereas pEC50 represents the logarithm of the concentration of the agonist that produces half of the maximum response. Statistical comparisons were conducted using unpaired t-tests with Welch’s correction for 2-group comparisons, or 2-way ANOVA with Bonferroni’s post-test for multiple comparisons. For the analysis of multiple data sets, one-way ANOVA was conducted, followed by Dunnett’s post-test. A p-value below 0.05 was deemed to show statistical significance.
Results
Elevated UA levels increased the contraction of cerebral arteries mediated by ET receptors
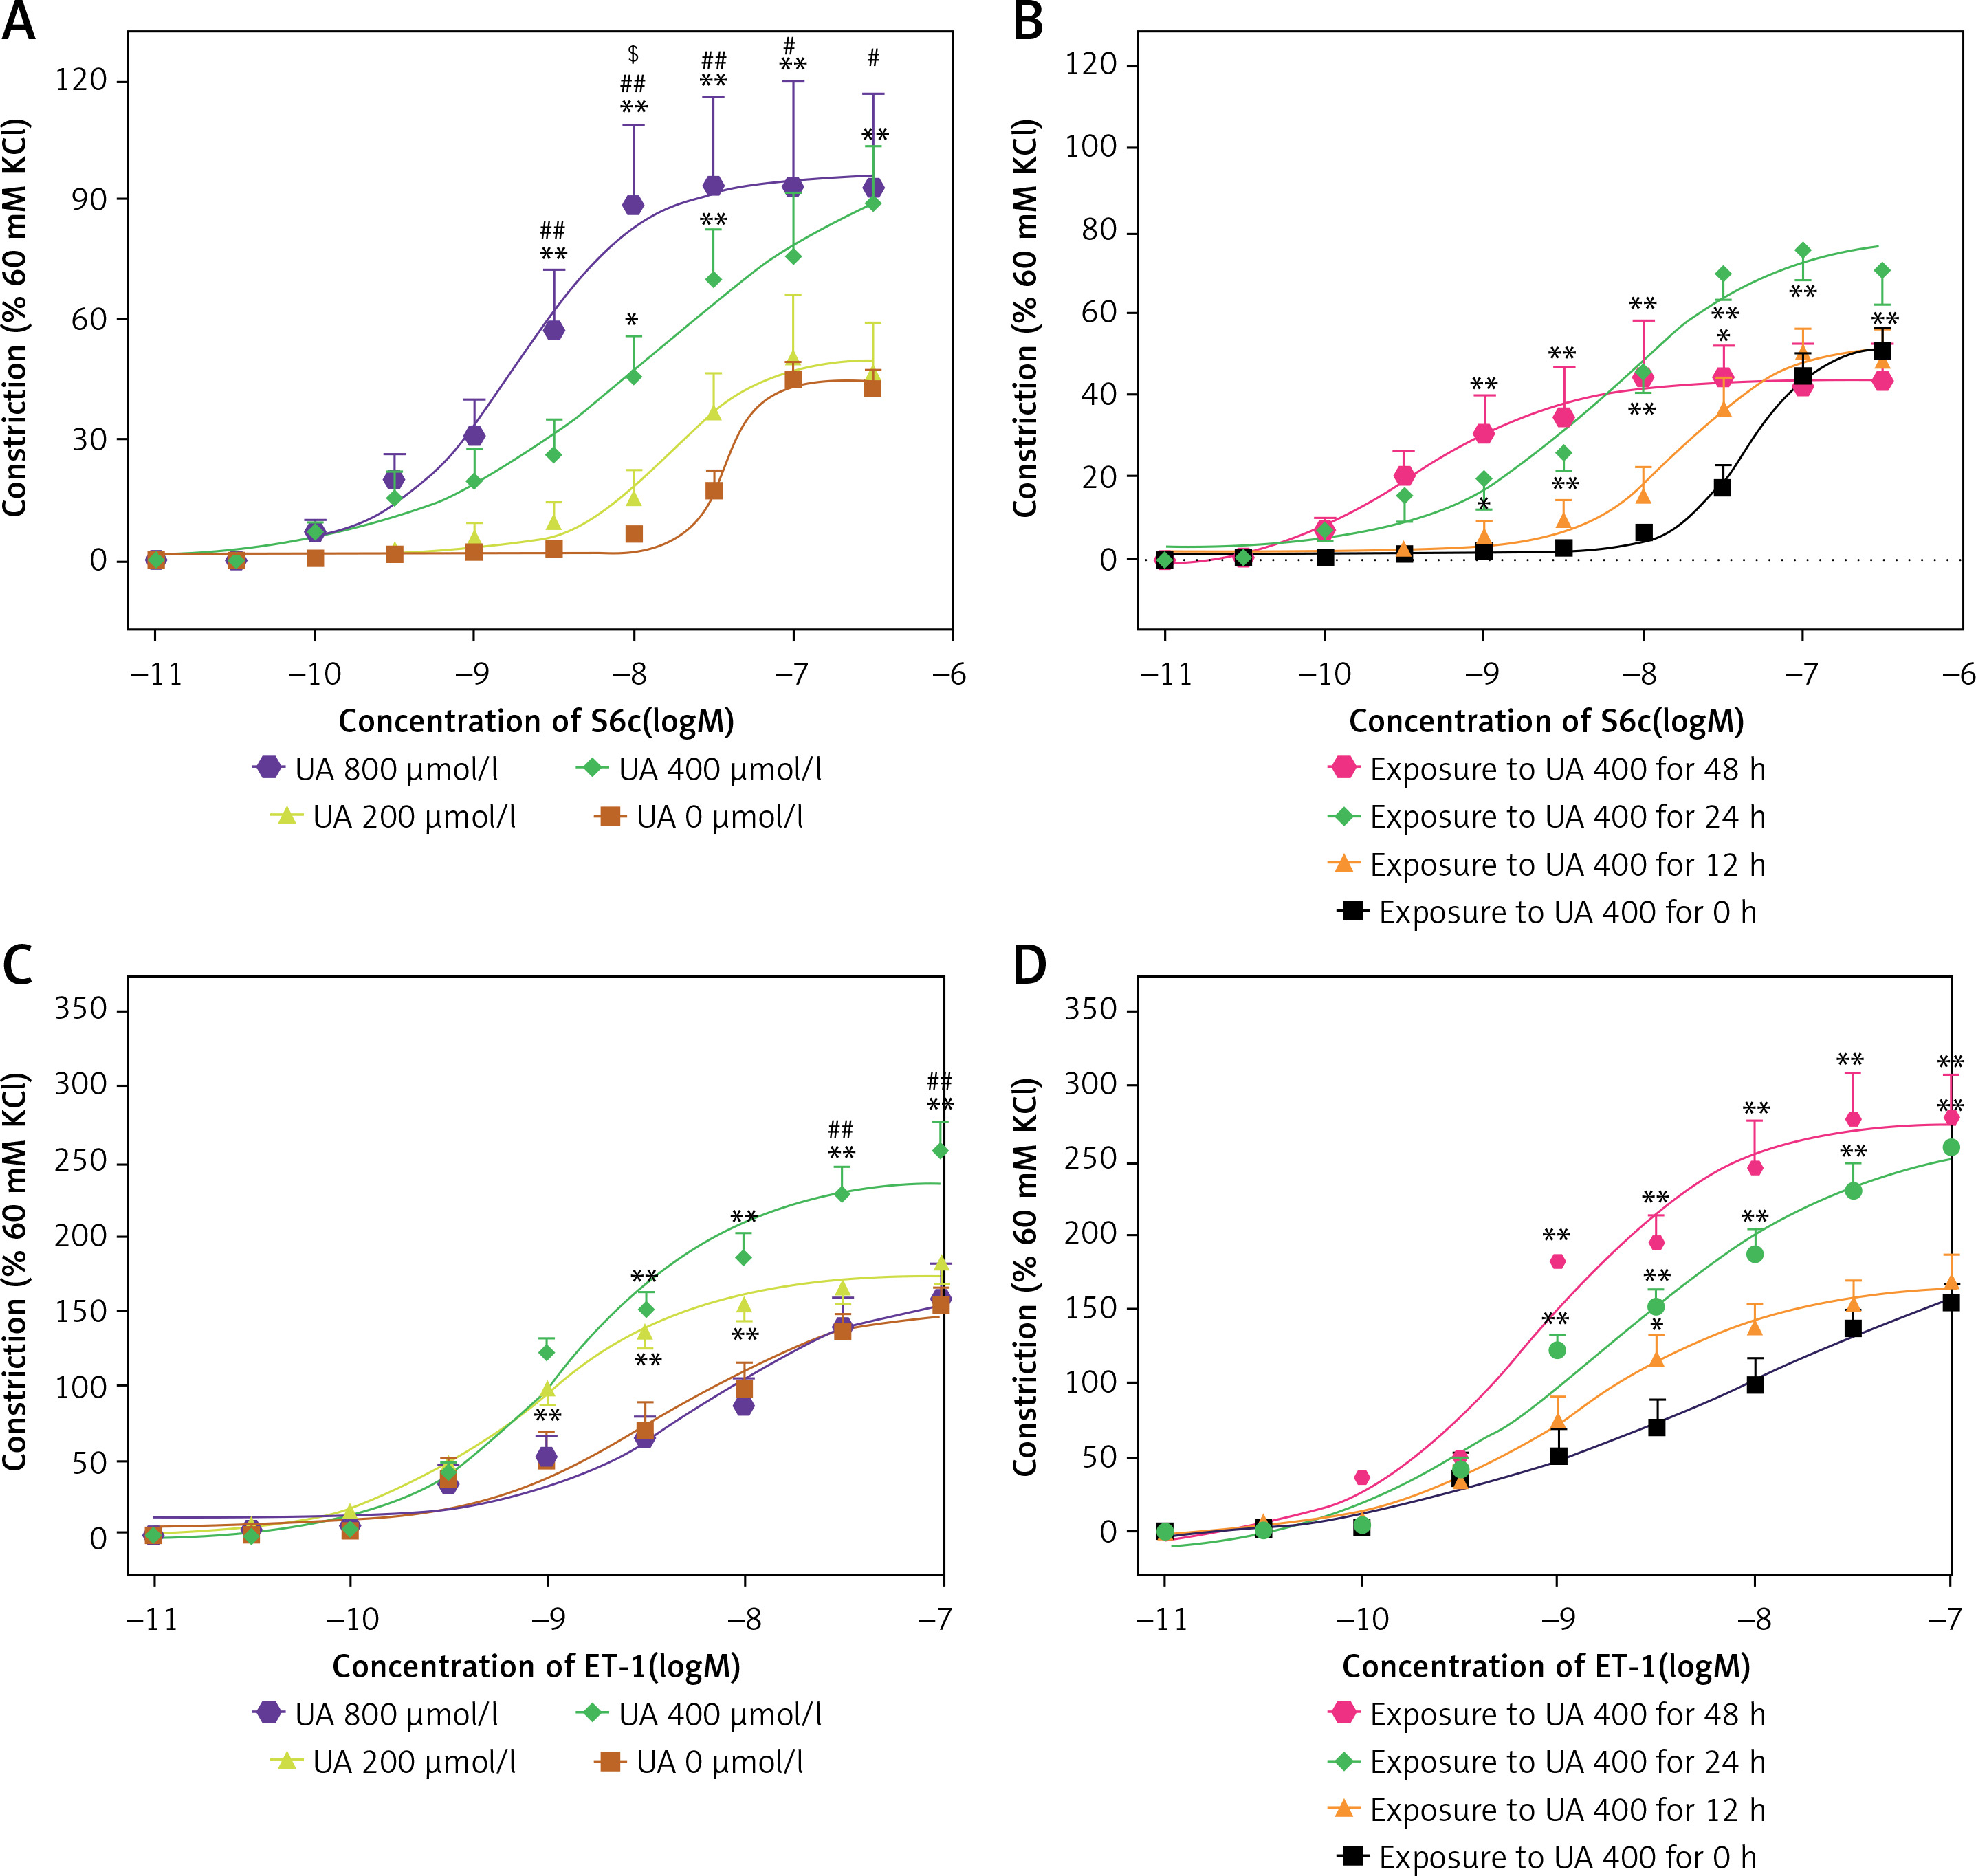
In Figure 1 A, it is shown that UA at concentrations of 400 µmol/l and 800 µmol/l notably increased the contractions induced by S6c in cerebral arteries when compared to the control group (0 µmol/l UA). The Emax values were also notably higher in the UA-treated groups. In Figure 1 B, it can be observed that being exposed to 400 µmol/l UA for 24 h led to more intense ETB receptor-induced contractions in cerebral arteries when compared to exposure durations of 12 h or 48 h. In Figure 1 C, it is shown that 400 µmol/l UA notably increased the contractions to ET-1 in cerebral arteries when compared to the control group (0 µmol/l UA), resulting in a significant rise in the Emax values. Figure 1 D shows that exposure to UA for 24 h or 48 h induced an increase in ETA receptor-mediated contractions. Therefore, a concentration of 400 µmol/l and an exposure time of 24 h were selected as the UA culture conditions for further studies.
Figure 1
The effects of high levels of UA on concentration-contractile curves for rat cerebral artery segments, as meditated by ET receptors. A – Dose-dependent curve of cerebral artery constriction induced by S6c. B – Time-dependent curve of cerebral artery constriction induced by S6c. C – Dose-dependent curve of cerebral artery constriction induced by ET-1. D – Time-dependent curve of cerebral artery constriction induced by ET-1. Data are presented as mean ± SEM. n = 12. *p < 0.05, **p < 0.01 vs. UA 0 μmol/l (A, C); #p < 0.05, ##p < 0.01 vs. UA 200 μmol/l (A, C); $p < 0.05 vs. UA 400 μmol/l (A) or *p < 0.05, **p < 0.01 vs. Exposure to UA 400 μmol/l for 0 h (B, D)
High levels of UA-enhanced contraction are associated with the MAPK pathways
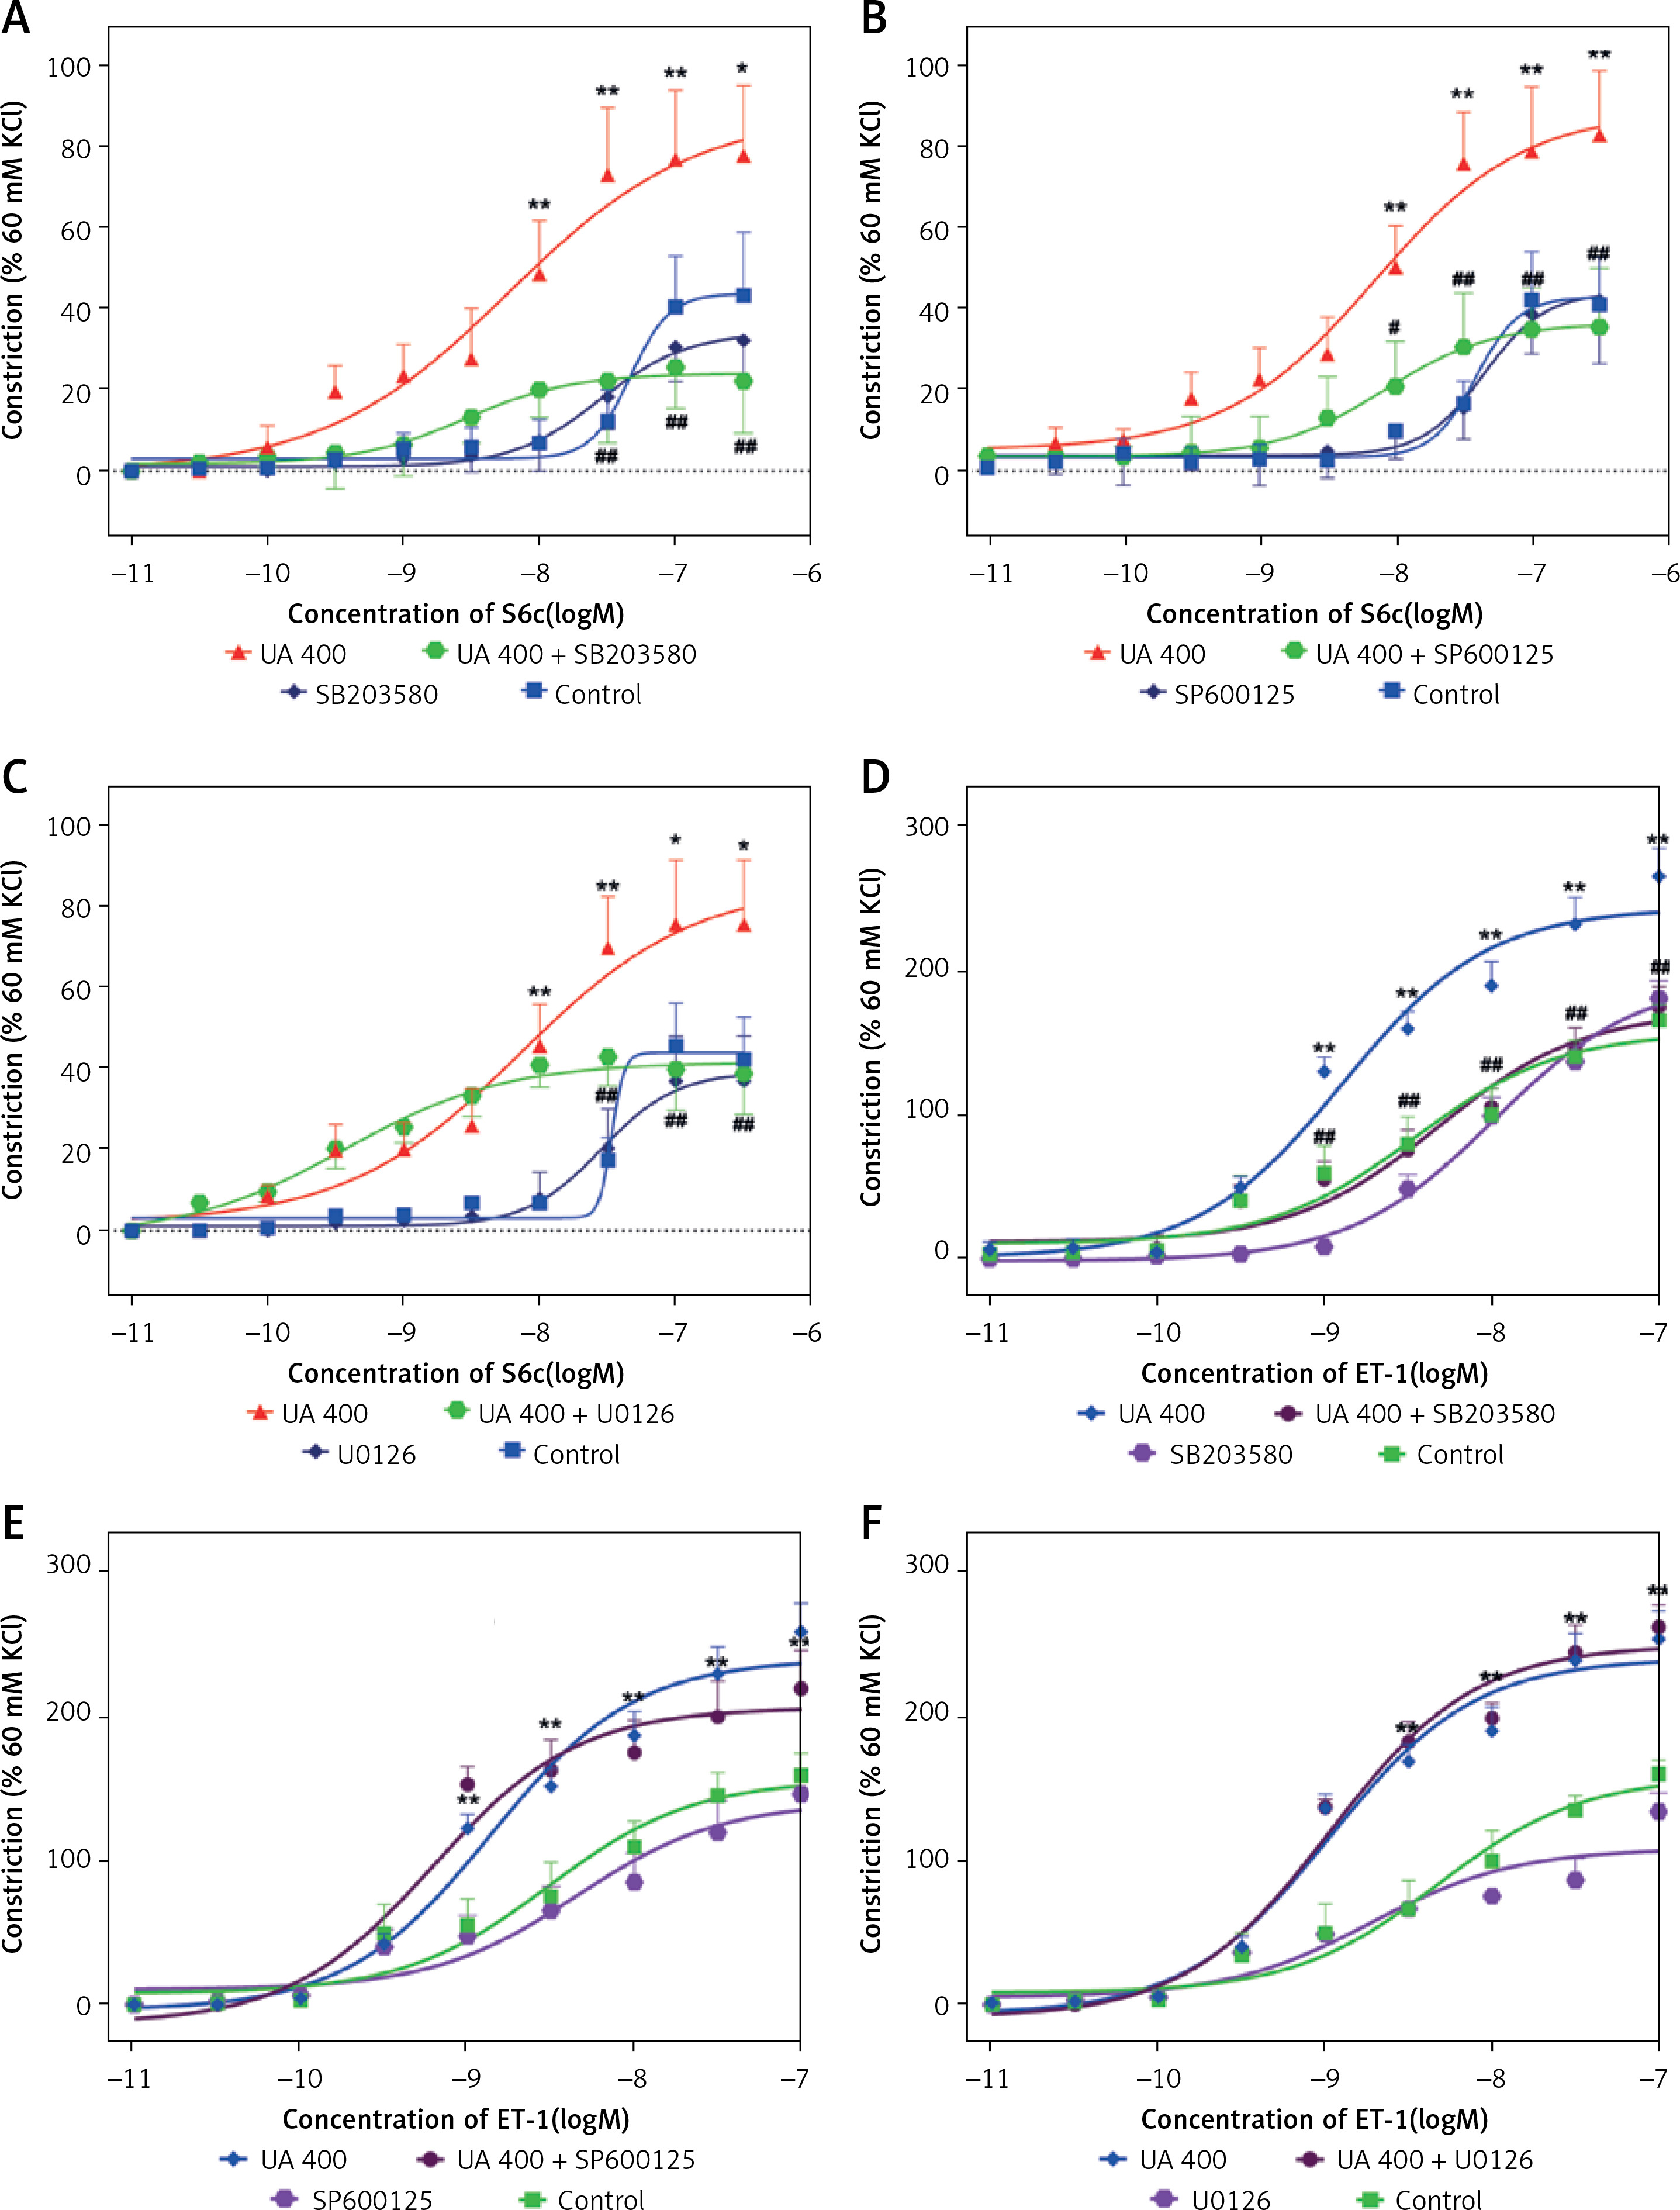
Inhibitors were utilised to study whether MAPK pathways are involved in UA-enhanced contractions. For ETB receptors, SB203580, SP600125, and U0126 significantly attenuated the UA-enhanced contractions mediated by ETB receptors, with a significant reduction in Emax values (Figures 2 A–C, p < 0.05). For ETA receptors, U0126 and SP600125 did not alter the UA-enhanced contractions significantly. However, SB203580 suppressed the contractions, causing a rightward shift in the concentration-response curves, which is indicative of a notably diminished Emax value (Figures 2 D–F, p < 0.05).
Figure 2
Effects of MAPK pathway inhibitors on UA-induced enhancement of ETB (A, B, C) and ETA (D, E, F) receptor-mediated concentration-contraction curves for rat cerebral arteries. The cerebral artery segments were cultured with or without UA 400 μmol/l for 24 h. In addition, the segments were cultured with UA 400 μmol/l and different MAPK inhibitors and DMSO for 24 h. S6c-induced and ET-1-induced contractions were recorded, and concentration- contraction curves for p38 inhibitor SB203580 (A, D), JNK inhibitor SP600125 (B, E), and ERK1/2 inhibitor U0126 (C, F) were constructed. Data are presented as mean ± SEM. n = 12. *p < 0.05, **p < 0.01 vs. Control (cultured with DMSO); #p < 0.05, ##p < 0.01 vs. UA 400 μmol/l
High levels of UA upregulate the expression of ET receptor mRNA and proteins, and are involved in the MAPK pathway
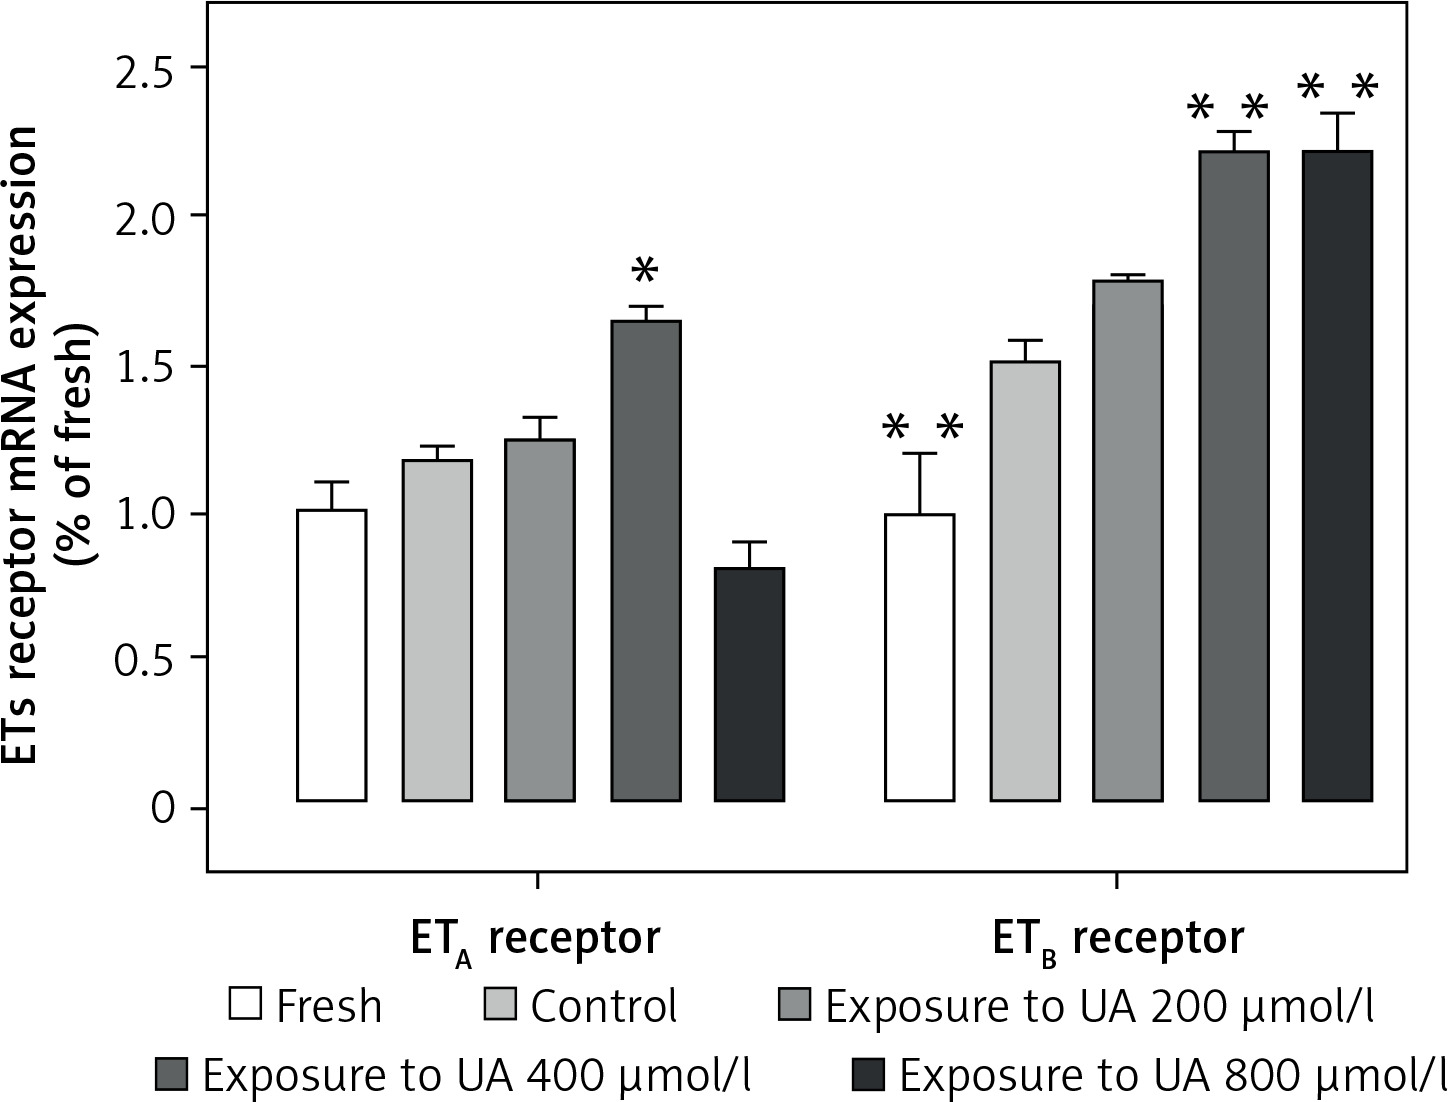
Figure 3 demonstrates that UA at concentrations of 400 µmol/l and 800 µmol/l stimulated the de novo transcription of ETB receptor mRNA. We found that exposure to UA 400 µmol/l significantly elevated the expression of ETA receptor mRNA (p < 0.05, Figure 3). However, when the UA concentration was increased to 800 µmol/l, there was a non-significant downward trend in the ETA receptor mRNA level.
Figure 3
Effects of UA 400 μmol/l on ETB and ETA receptor mRNA expression in cerebral arteries. Rat cerebral arterial segments were cultured with or without UA 200, 400, and 800 μmol/l or DMSO for 24 h. The mRNA expression levels of ETB and ETA were measured using RT-PCR and were expressed as a fold-change relative to the fresh group. Data are presented as mean ± SEM. n = 6. *p < 0.05, **p < 0.01 vs. Control (cultured with DMSO)
Furthermore, as shown in Figure 4, exposure to UA at a concentration of 400 µmol/l resulted in a notable enhancement in the protein levels of ETB receptor in comparison to the control group, displaying a statistically significant variance (p < 0.01). The increase in ETB receptor protein levels could be significantly reduced by using inhibitors of the MAPK pathway such as SB203580, SP600125, or U0126 (p < 0.01, Figure 4). Meanwhile, the protein expression of ETA receptor was observed to be higher relative to the control group (p < 0.01, Figure 4). This enhancement was notably mitigated solely by the treatment with SB203580 (p < 0.01, Figure 4). Neither SP600125 nor U0126 treatments had any significant effect on the ETA receptor protein levels in both UA-exposed and control groups.
Figure 4
Effects of UA 400 μmol/l on protein expression in cerebral arteries with the influence of MAPK inhibitors. Rat cerebral arterial segments were cultured with UA 400 μmol/l and p38 inhibitor SB203580 (A), JNK inhibitor SP600125 (B), ERK1/2 inhibitor U0126 (C), and DMSO for 24 h. The ET receptor protein expression levels were expressed relative to β-actin. Data are presented as mean ± SEM. n = 3. **p < 0.01 vs. Control (cultured with DMSO). ##p < 0.01 vs. UA 400 μmol/l
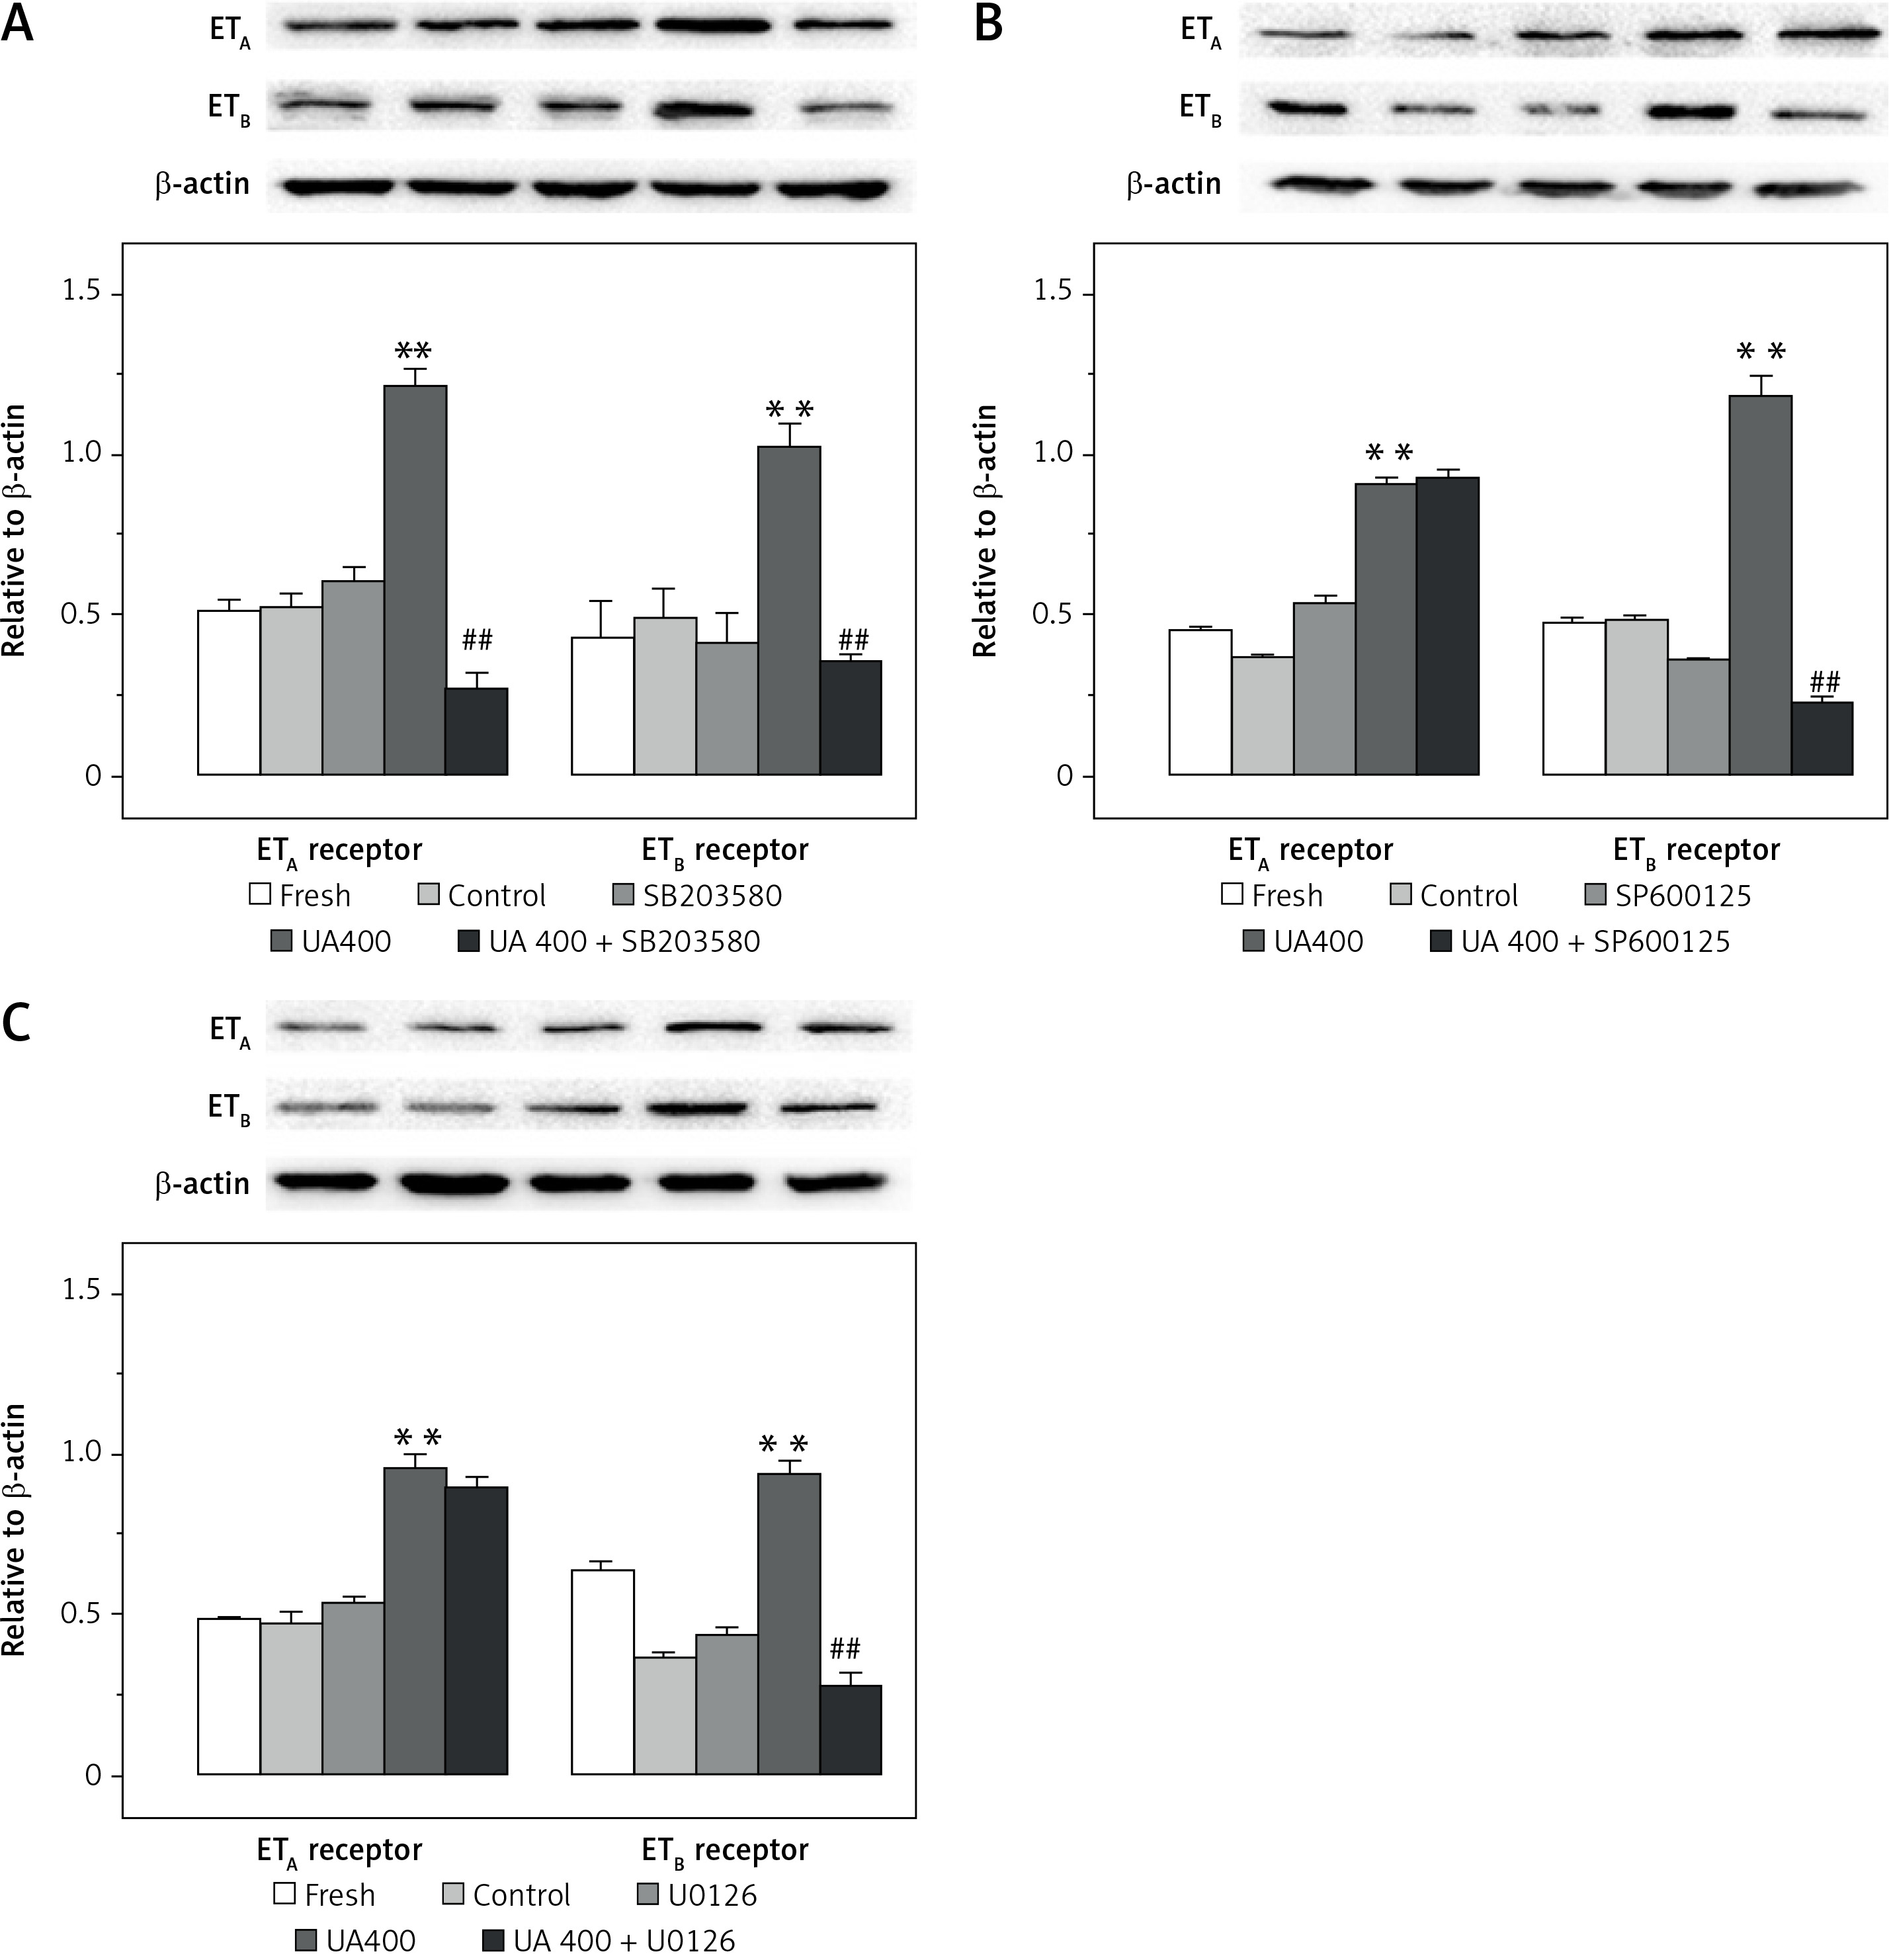
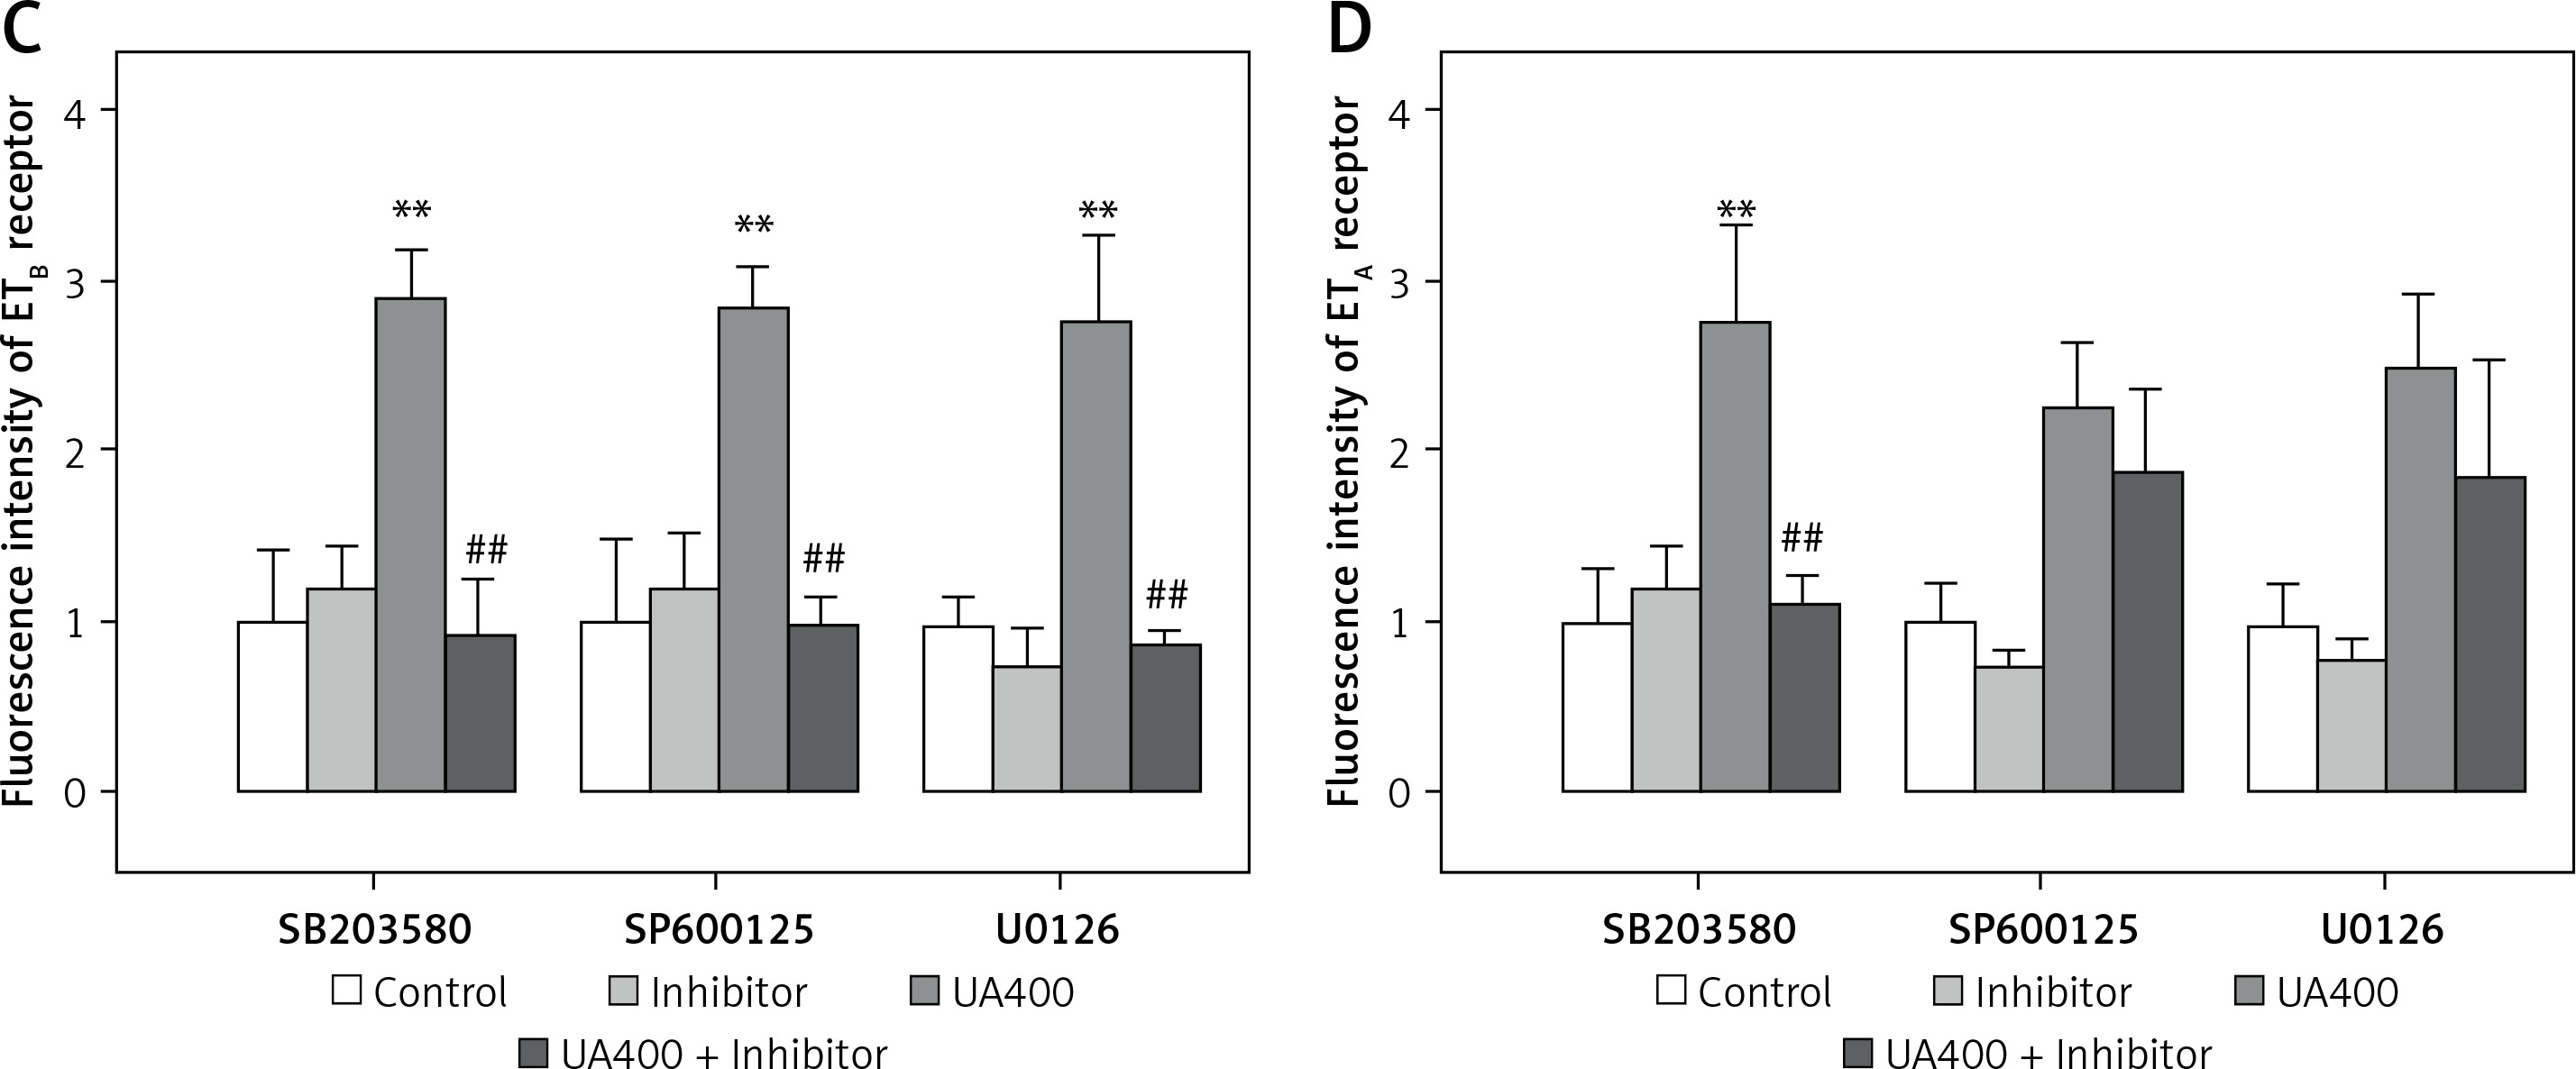
Figure 5 illustrates the application of immunohistochemistry to detect ET receptor proteins in cerebral arterial tissues, which were staining green. The negative control group were without any detectable staining for both ETB and ETA receptors (data not shown). The brightness level of ETB receptors in cerebral arteries was discovered to be notably higher in the UA-treated group than in the control group (p < 0.01), and it was decreased by the MAPK pathway blockers SB203580, SP600125, and U0126 (p < 0.01). Likewise, the UA-treated group exhibited higher fluorescence intensity of ETA receptors compared to the control group (p < 0.01). While SP600125 and U0126 did not significantly alter the fluorescence intensity in the UA group, SB203580 notably suppressed the UA-enhanced in ETA receptor fluorescence intensity in cerebral arteries (p < 0.01).
Figure 5
Immunohistology analysis of the effects of high levels of UA and MAPK inhibitors on ET receptor protein expression in cerebral arteries. Rat cerebral arterial segments were cultured with UA 400 μmol/l and MAPK inhibitors or DMSO for 24 h. Representative images for each group (A – ETB receptor, B – ETA receptor). Scale bar 100 μm, magnification × 20. Data are presented as mean ± SEM. n = 3. **p < 0.01 vs. Control. ##p < 0.01 vs. UA 400 μmol/l Representative images for each group the results of analyses (C – ETB receptor, D – ETA receptor). Scale bar 100 μm, magnification. 20. Data are presented as mean ± SEM. n = 3. **p < 0.01 vs. Control. ##p < 0.01 vs. UA 400 μmol/l
Discussion
The exact mechanisms by which hyperuricaemia causes cerebrovascular diseases remain unclear. Early researchers believed that high levels of UA could exacerbate risk factors such as dyslipidaemia, diabetes, and hypertension, contributing to the development of cerebrovascular diseases [22]. However, recent studies have proposed several mechanisms of its direct damage [23]. Herein are described the 2 main explanations for the effect of high levels of UA – one that operates without the presence of urate crystals and another that is contingent upon them [24]. In the crystal-independent pathway, UA in its soluble form could permeate the vascular endothelium through transporters such as GLUT 9 or URATv1, thereby triggering a cascade of intracellular inflammation and oxidative stress reactions [25]. The crystallisation of UA in the body initiates once the serum UA levels surpass the solubility threshold of around 400 µmol/l [24]. In the crystal-dependent pathway, urate crystals can form, leading to the activation of NOD-like receptor family protein 3 (NLRP3) inflammasome by vascular macrophages, causing increased inflammation and collagen deposition in arteries [26]. The damage caused by elevated UA levels in patients are primarily involved in the latter mechanism. Additionally, high levels of UA can increase the expression of various factors, inducing VSMCs proliferation [27]. These mechanisms directly affect blood vessel cells and alter their function, but still fail to fully explain cerebrovascular disease associated with high levels of UA.
Researchers have observed in recent years that increasing the activity of contractile ET receptors on cells in the cerebrovascular system could be a crucial focus for cerebrovascular events [11, 14]. Furthermore, animal models like obesity [28], subarachnoid haemorrhage [15], cerebral ischaemia [16–18], and hypertension [19–21] have shown increased expression of ET receptors. In this research, we discovered that elevated levels of UA substantially enhanced the ET receptor-induced contractions in cerebral arteries. Moreover, the expression of both mRNA and protein for ET receptors was significantly elevated in the exposure of high levels of UA. These findings indicate that elevated UA levels stimulate the upregulation of both ETB and ETA receptors within the cerebral arterial system. Furthermore, the literature clearly indicates that activation of the ETB2 receptor subtype in VSMCs leads to arterial constriction, whereas activation of the ETB1 receptor subtype in endothelial cells induces vasorelaxation [28]. This study revealed that increasing UA levels during culturing enhanced the contractions triggered by ET receptors (both ETB1 and ETB2 being activated by S6c). Meanwhile, the protein expression and fluorescence intensity of the ETB receptors were also found to be enhanced. Taken together, these findings confirm that high levels of UA can significantly increase the number or density of ETB2 receptors in VSMCs.
The upregulation of ET receptors is related to several signalling pathways. In this study, we observed the relationship between the upregulation of ET receptors by high levels of UA and the MAPK signalling pathway. The MAPK signalling, composed of a series of serine/threonine kinases, is pivotal for intracellular communication triggered by external signals and governs a multitude of cellular functions [29]. This pathway is divided into 3 principal branches: p38 MAPK, JNK, and ERK1/2 pathways, each contributing to the regulation of diverse cellular responses [29]. In this study, MAPK inhibitors were observed to have no effect on ETA receptor-mediated contractions or ETA receptor protein expression in the control group. However, SB203580 inhibited the UA-enhanced contractions mediated by ETA receptors and reduced the protein expression of ETA receptors in cerebral arteries. This suggests an association between the upregulation of ETA receptors and the MAPK/p38 pathway. However, U0126 or SP600125 had no effect on ETA receptor-induced contraction or ETA receptor protein levels in cerebral arteries, suggesting that the ERK1/2 or JNK pathways do not play a role in this increase. Further, SB386023, SB203580, and U0126 did not affect contractions mediated by ETB receptors or ETB receptor protein expression in control groups. Also, the protein expression of ETB receptor in cerebral arteries was reduced by all 3 inhibitors, leading to a decrease in UA-enhanced contractions mediated by ETB receptors. These data imply a connection between the increase in ETB receptors and the activation of all 3 MAPK pathways. Clearly, there is still much to explore regarding how high levels of UA play a role in impacting the MAPK/ET receptor pathways upstream and downstream.
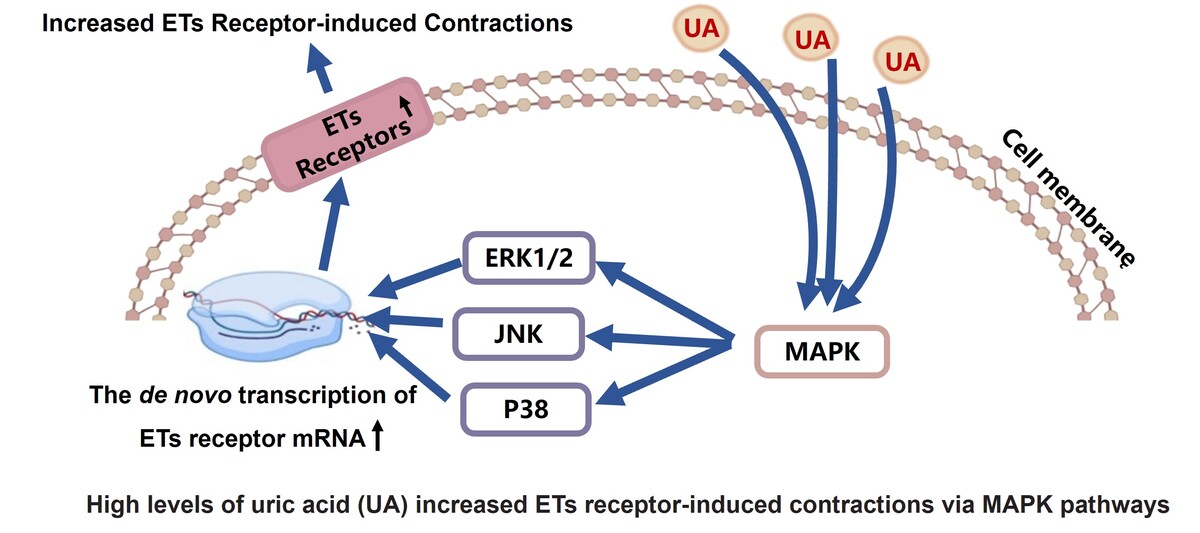
In conclusion, high levels of UA up-regulate ET receptors in in vitro rat cerebral arteries. The upregulation of ETB receptors is associated with the ERK1/2, JNK, and p38 MAPK pathways, while the upregulation of ETA receptors is linked to the p38 pathway. Although further in vivo experiments are necessary, this study offers novel perspectives on hyperuricaemia-associated cerebrovascular diseases.