Introduction
Cardiovascular diseases (CVDs) remain the leading cause of death and a significant global health burden, particularly in the United States, where they are responsible for substantial mortality and economic costs [1]. To address this growing challenge, there has been a shift in focus from managing CVD outcomes to promoting cardiovascular health (CVH) as a preventative strategy. The concept of CVH encompasses not only the absence of disease but also the optimization of health behaviors and biological factors that reduce CVD risk. Recognizing this, the American Heart Association recently updated its framework for CVH assessment by introducing the Life’s Essential 8 (LE8) scoring system, which builds upon and expands the former Life’s Simple 7 (LS7) system. Studies have established a strong association between LS7 scores and CVD incidence and mortality [2, 3]. The LE8 system enhances this framework by incorporating additional elements critical for CVH, including diet, physical activity, nicotine exposure, body mass index (BMI), blood lipids, blood glucose, blood pressure, and sleep health [4]. Notably, the inclusion of BMI as a core component highlights the pivotal role of weight management in maintaining and improving CVH.
Obesity is a well-established major risk factor for both CVD and impaired CVH. In the U.S., the prevalence of obesity among adults has reached an alarming 42.4% [5]. Research consistently shows that obesity not only contributes to type 2 diabetes, certain cancers, and premature death but also significantly increases the likelihood of cardiovascular events and mortality [6–8]. In addition to its static association with cardiovascular risk, obesity also impacts CVH dynamically through weight fluctuations across different life stages. Recent studies indicate that sustained obesity throughout adulthood, weight gain from early to middle adulthood, and weight reduction from middle to late adulthood are associated with increased risks of mortality and adverse cardiovascular outcomes [9, 10]. These findings underscore the need to investigate how specific patterns of weight changes at different life stages influence CVH, as such insights may inform targeted interventions for improving long-term cardiovascular outcomes.
Recent evidence suggests that weight changes across adulthood not only impact CVH directly but also may exert their effects through metabolic intermediaries, such as uric acid [11, 12]. Uric acid, the end product of purine metabolism, has been identified as a significant contributor to cardiovascular risk [13]. Elevated uric acid levels are associated with oxidative stress, endothelial dysfunction, and inflammation, all of which are critical pathways in the development of cardiovascular diseases [14]. Additionally, obesity, a key driver of weight changes, has been closely linked to increased uric acid levels due to impaired renal clearance and heightened systemic inflammation [15, 16]. Despite these established associations, limited attention has been given to the role of uric acid as a mediator in the relationship between weight changes and CVH across different life stages.
Therefore, this study investigated the impact of weight changes and weight change patterns during early, middle, and late adulthood on CVH scores. Additionally, we examined the potential mediating role of uric acid in the relationship between BMI at different life stages and CVH. By exploring how uric acid mediates this association, we aimed to elucidate the metabolic pathways linking weight dynamics to cardiovascular risk across adulthood.
Material and methods
Study population
NHANES, initiated by the Centers for Disease Control and Prevention (CDC), is a pivotal survey program designed to collect data regularly on the health and nutritional status of the U.S. population. This program employs a set of standardized and validated tools, including comprehensive health interviews, physical examinations, and laboratory tests, all of which have been previously developed and are widely recognized in the literature for their reliability and validity [17]. The data collection procedures strictly adhered to the ethical standards authorized by the Institutional Review Board of the National Center for Health Statistics (NCHS) in accordance with the revised Declaration of Helsinki guidelines. Prior to any health examination, participants were provided with an informed consent form and were required to sign it.
In our study, we focused on individuals with complete records of weight and height after the age of 25 years who were 50 years or older at the time of the key survey; a total of 8,674 participants were included from three consecutive NHANES cycles between 2013 and 2018. To ensure data integrity and accuracy, we excluded individuals with missing CVH score-related information (n = 7,370). Additionally, individuals lacking complete weight and height data from cardiovascular surveys at ages 25 and 10 years before the baseline survey were also excluded (n = 47). We subsequently excluded individuals lacking uric acid data (n = 0). Ultimately, 1,257 participants were included in our final analysis after these selection criteria were applied (Supplementary Figure S1).
Assessments of absolute weight change and weight change patterns
In this study, participant weight and height were measured at three different life phases: early adulthood (at 25 years of age), mid-adulthood (10 years before the baseline survey), and late adulthood (baseline survey period). These data were either collected or directly measured during physical examinations. To evaluate trends in weight fluctuations, we divided the fluctuations into five categories: a decrease exceeding 2.5 kg, a variation within 2.5 kg (serving as the reference group), an increase from 2.5 to just below 10.0 kg, an increase between 10 and just under 20.0 kg, and an increase surpassing 20.0 kg. Additionally, we calculated BMI by dividing weight (in kg) by the square of height (in meters). We determined the BMI at 25 years (BMI25), 10 years prior to the baseline survey (BMI10prior, average age: 54.4 ±8.8 years), and at the baseline survey (BMIbaseline, average age: 64.4 ±8.8 years) and classified BMI into four categories: underweight (BMI value of less than 18.5), normal weight (BMI value between 18.5 and 25), overweight (BMI value between 25 and 30), and obese (BMI value of 30 or above). Moreover, we identified three periods for patterns of weight change: between age 25 and baseline, between 25 years of age and 10 years before baseline, and between 10 years before baseline and baseline. By comparing the BMI values at two distinct time points, we characterized four distinct patterns of weight change: stable nonobesity (both BMI values less than 30.0), weight loss (first BMI value 30.0 or greater and second BMI value less than 30.0), weight gain (first BMI value less than 30.0 and second BMI value 30.0 or greater), and stable obesity (both BMI values 30.0 or greater).
Assessment of CVH scores
The CVH score, an all-encompassing metric, integrates four critical health factors – BMI, blood pressure, blood lipid levels, and blood glucose levels – with four key health behaviors – diet, physical activity, nicotine exposure, and sleep duration. The methods for calculating the CVH score for each indicator are detailed in the supplementary materials and the AHA Presidential Advisory(4). Supplementary Table SI presents the definitions and scoring criteria for each CVH component. The participants are scored on a scale from 0 to 100, which is based on these eight components, with scores categorized as high (80–100), moderate (50–79), or low (0–49). This scoring system provides a detailed understanding of individual CVH, where a higher score indicates better CVH, and a lower score indicates poorer CVH.
Assessment of serum uric acid
Serum samples were collected from the participants and maintained at –70°C until analysis. The samples were shipped to the Advanced Research and Diagnostic Laboratory (ARDL) at the University of Minnesota for serum uric acid (SUA) measurement. The Roche Cobas 6000 analyzer uses a two-point endpoint method to quantify SUA.
Covariates
In our study, we carefully selected covariates on the basis of prior literature and hypotheses related to CVH [18–20]. This selection involved multiple factors. First, the following demographic variables were considered: age, sex (female or male), and race/ethnicity (Mexican American, non-Hispanic Black, non-Hispanic White, or other races). Second, socioeconomic status, as indicated by educational attainment (categories including less than high school, high school graduate, and college or above), and the poverty income ratio (PIR), divided into two levels (< 1.3, ≥ 1.3), were considered. Additionally, marital status was considered and categorized as married/cohabiting, divorced/widowed/separated, or single. Finally, we included alcohol consumption status and divided patients into two groups on the basis of their annual drinking amount (< 12 drinks/year, ≥ 12 drinks/year). These variables were collected primarily through direct interviews and the assessment of biomarkers.
Statistical analyses
For the descriptive analysis in this study, continuous variables are presented as the means ± standard deviations or medians (interquartile ranges [IQRs]). Independent sample t tests or nonparametric tests were used to examine differences between groups. Categorical variables are presented as counts (n) and percentages (%), and χ2 tests were used to assess group differences. Multivariate linear regression models were used to evaluate the relationships among weight change patterns, absolute weight changes, uric acid levels, and CVH scores by calculating effect sizes (β) and 95% confidence intervals (CIs). Two models were designed to adjust for potential confounders: Model 1 was used as a crude model, and Model 2 was further adjusted for age, sex, race, education level, income, marital status, and drinking habits. Additionally, restricted cubic spline (RCS) functions were used to determine the dose–response relationships between absolute weight changes and CVH scores. The bootstrap method was applied to assess whether uric acid serves as a mediator between BMI across three distinct life stages and CVH and to quantify the strength and statistical significance of this mediating effect. Finally, a series of sensitivity analyses were conducted to ensure the robustness of the results, including (1) adding cardiovascular disease history as a covariate, (2) examining sex differences in the mediating effect, and (3) exploring age-specific differences in the mediating role of uric acid.
All analyses were performed via R Statistical Software (version 4.3.1, http://www.R-project.org, The R Foundation) and the Free Statistical analysis platform (version 1.9, Beijing, China). A bidirectional test was employed, and a finding was deemed to be statistically significant if the p-value was less than 0.05.
Results
Demographic characteristics of participants
Table I presents the baseline characteristics of the participants, stratified by CVH score categories. Compared with those with lower CVH scores, individuals with higher CVH scores tended to be younger, more likely to be Non-Hispanic White, have higher incomes, and have higher education levels. Additionally, participants with higher CVH scores were more likely to be married or living with a partner, consume less alcohol, have a lower BMI across three different life phases, experience smaller weight fluctuations, and have lower uric acid levels.
Table I
Baseline characteristics of participants classified by CVH category
| Characteristic | Total (n = 1257) | Low CVH (n = 119) | Moderate CVH (n = 981) | High CVH (n = 157) | P-value |
|---|---|---|---|---|---|
| Sexa | 0.502 | ||||
| Male | 780 (62.1) | 71 (59.7) | 617 (62.9) | 92 (58.6) | |
| Female | 477 (37.9) | 48 (40.3) | 364 (37.1) | 65 (41.4) | |
| Age [years]a | 64.4 ±8.8 | 66.8 ±9.8 | 64.4 ±8.7 | 61.8 ±7.2 | < 0.001 |
| Racea | 0.004 | ||||
| Mexican American | 117 (9.3) | 13 (10.9) | 96 (9.8) | 8 (5.1) | |
| Non-Hispanic White | 596 (47.4) | 42 (35.3) | 464 (47.3) | 90 (57.3) | |
| Non-Hispanic Black | 295 (23.5) | 40 (33.6) | 229 (23.3) | 26 (16.6) | |
| Other race | 249 (19.8) | 24 (20.2) | 192 (19.6) | 33 (21) | |
| Family poverty-income ratioa | < 0.001 | ||||
| < 1.3 | 287 (22.8) | 41 (34.5) | 228 (23.2) | 18 (11.5) | |
| ≥ 1.3 | 970 (77.2) | 78 (65.5) | 753 (76.8) | 139 (88.5) | |
| Educational levela | < 0.001 | ||||
| Below high school | 191 (15.2) | 27 (22.7) | 149 (15.2) | 15 (9.6) | |
| High-school graduate | 292 (23.2) | 34 (28.6) | 236 (24.1) | 22 (14) | |
| College or above | 774 (61.6) | 58 (48.7) | 596 (60.8) | 120 (76.4) | |
| MSa | 0.022 | ||||
| Married/living with partner | 747 (59.4) | 62 (52.1) | 576 (58.7) | 109 (69.4) | |
| Widowed/divorced/separated | 425 (33.8) | 44 (37) | 340 (34.7) | 41 (26.1) | |
| Never married | 85 (6.8) | 13 (10.9) | 65 (6.6) | 7 (4.5) | |
| Drinking statusa | 0.797 | ||||
| No | 856 (68.1) | 78 (65.5) | 672 (68.5) | 106 (67.5) | |
| Yes | 401 (31.9) | 41 (34.5) | 309 (31.5) | 51 (32.5) | |
| Body mass index [kg/m2]a | |||||
| At age 25 years | 23.7 ±7.0 | 24.2 ±4.0 | 23.9 ±7.7 | 22.3 ±3.3 | 0.023 |
| At 10 years before baseline | 28.5 ±6.2 | 31.5 ±8.0 | 28.5 ±5.9 | 26.0 ±5.4 | < 0.001 |
| At baseline | 29.0 ±5.9 | 33.2 ±7.6 | 29.2 ±5.6 | 25.1 ±3.6 | < 0.001 |
| Absolute weight change [kg]b | |||||
| From age 25 years to baseline | 12.4 (3.9, 21.9) | 23.6 (10.0, 34.0) | 13.1 (4.9, 21.8) | 4.7 (–0.5, 11.4) | < 0.001 |
| From age 25 years to 10 years before baseline | 1.1 (–4.9, 8.1) | 5.5 (–5.5, 16.2) | 1.4 (–4.9, 8.4) | –0.5 (–4.8, 3.8) | < 0.001 |
| From 10 years before baseline to baseline | 9.1 (2.3, 18.1) | 13.6 (6.8, 26.8) | 9.1 (2.3, 18.1) | 4.5 (0.9, 12.7) | < 0.001 |
| Depression scorea | 5.7 ±1.4 | 5.9 ±1.4 | 5.7 ±1.4 | 5.2 ±1.4 | < 0.001 |
Associations between absolute weight changes and weight change patterns and CVH scores
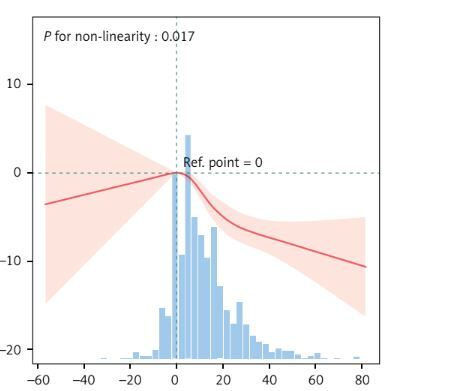
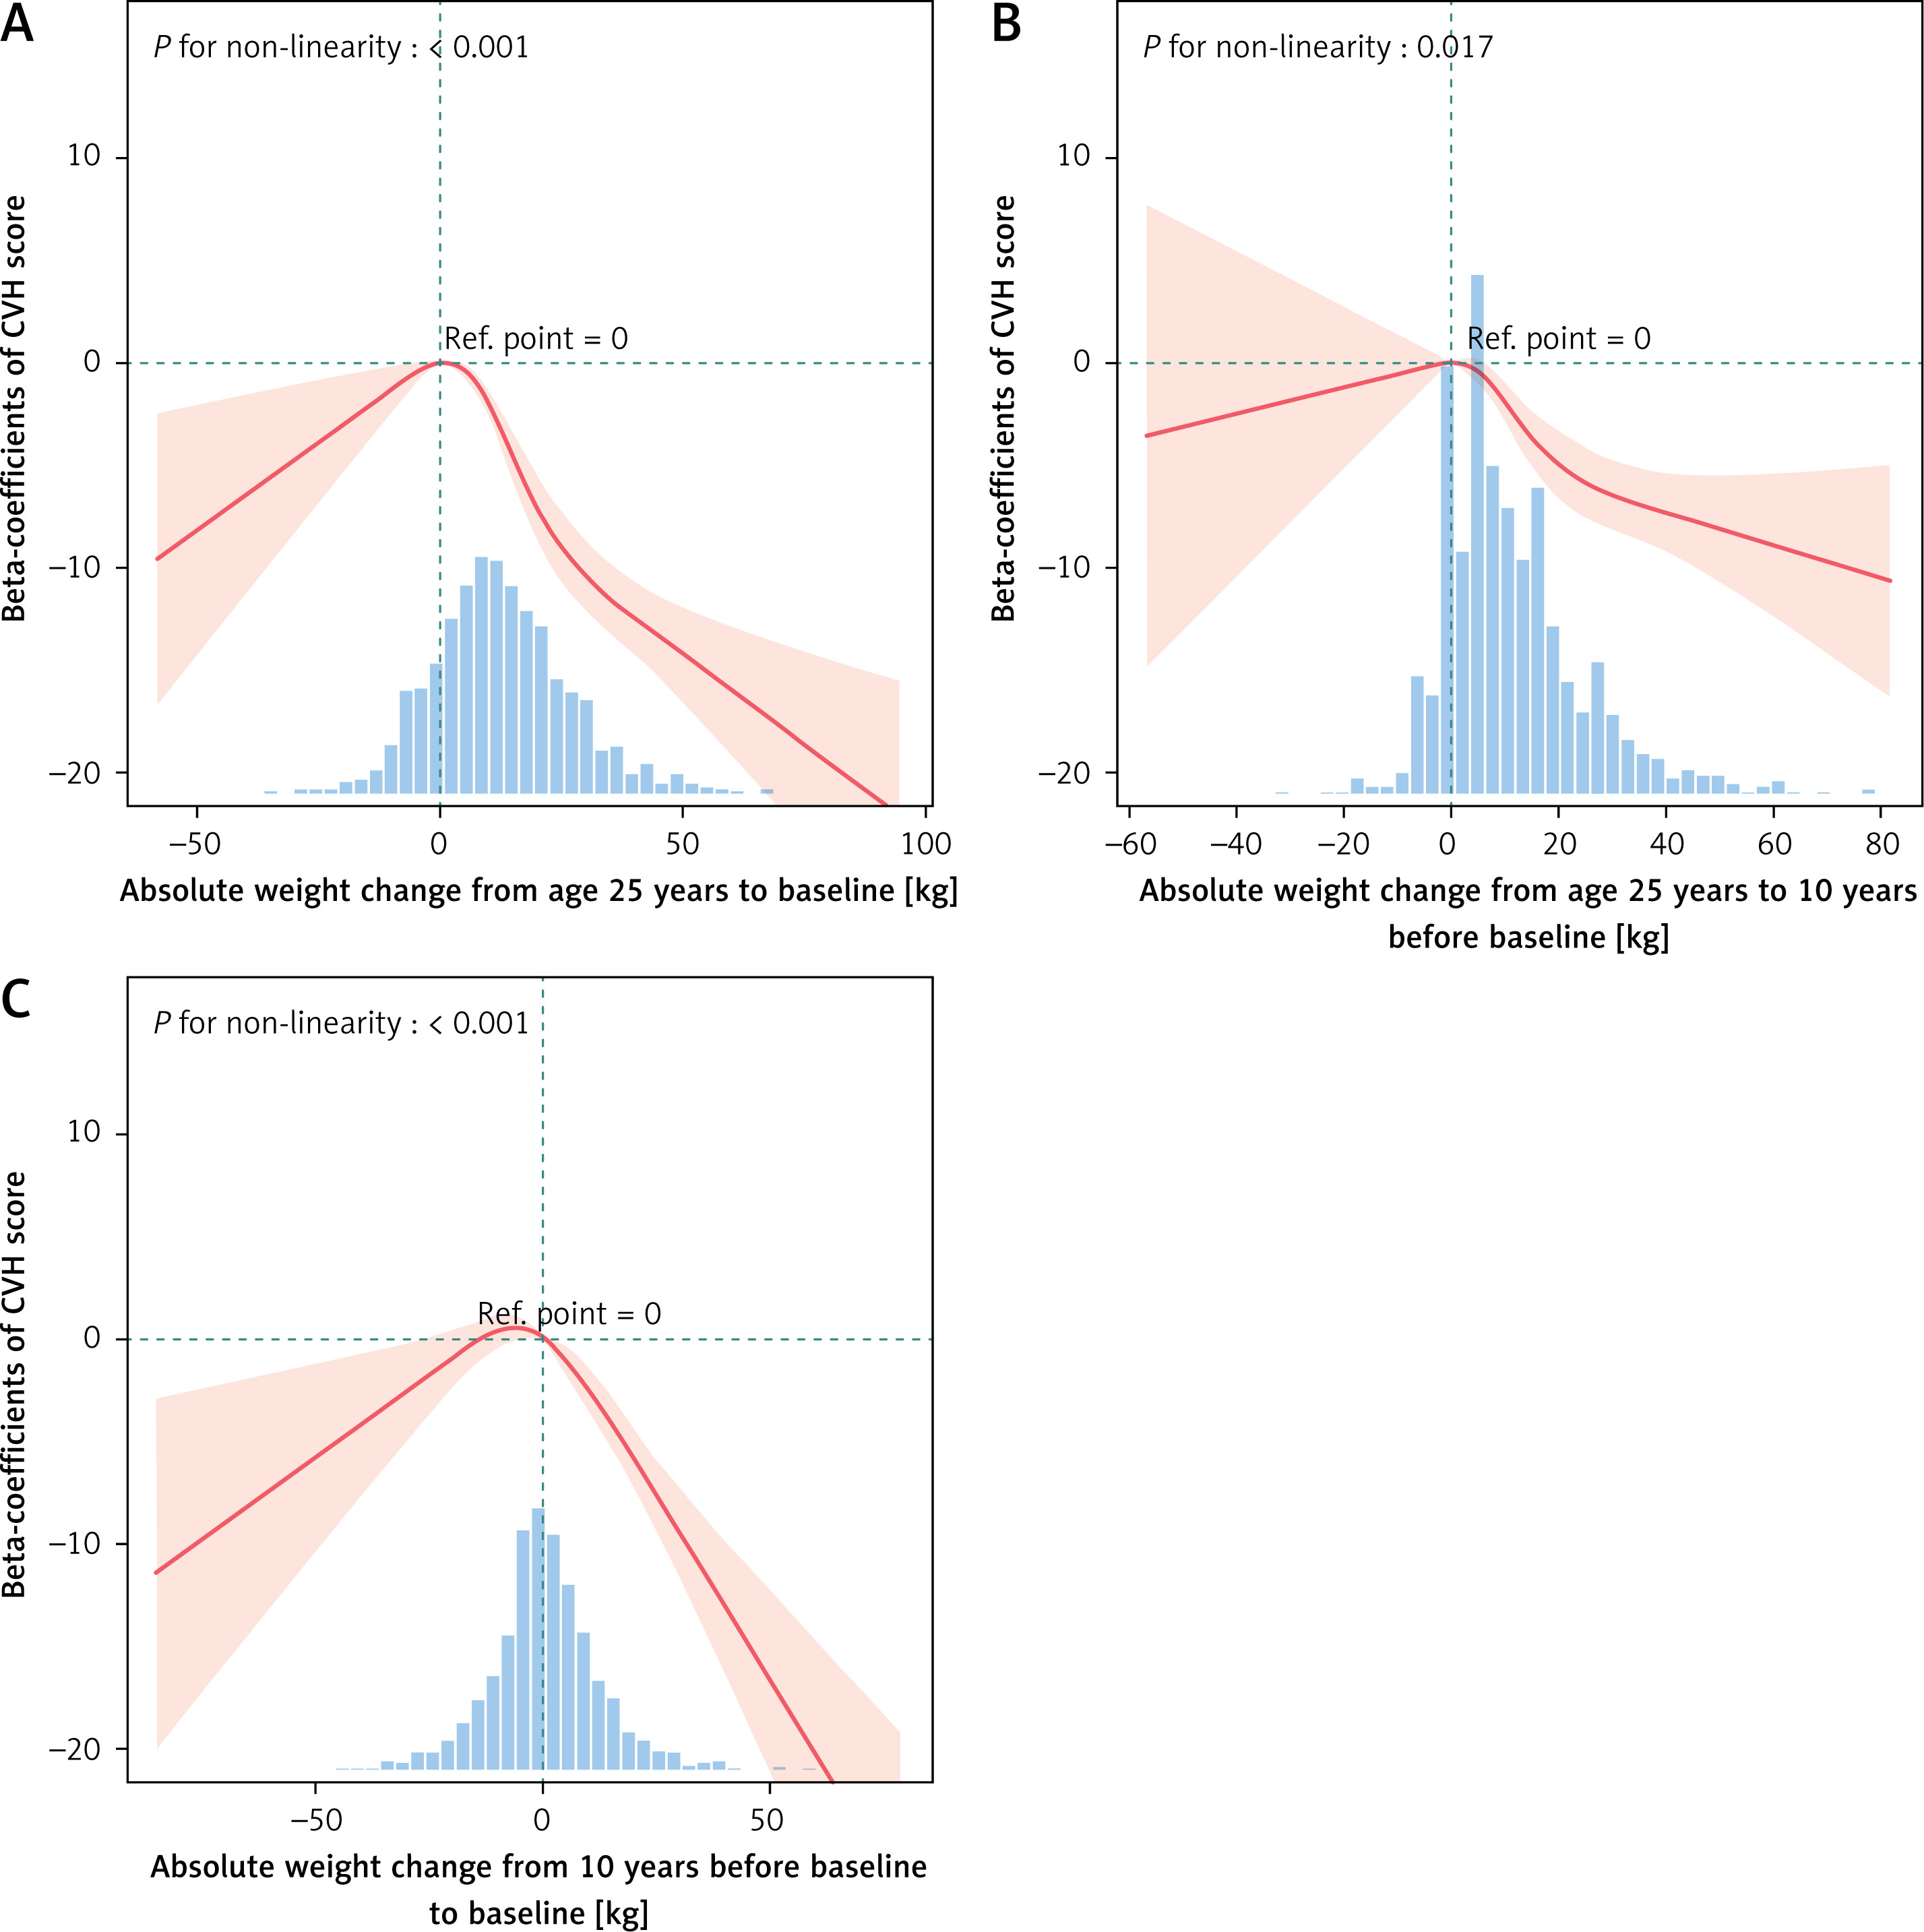
Table II shows a linear negative correlation between the absolute weight change and the CVH score across the three different periods. Notably, compared with those in the group with a weight change of < 2.5 kg, the loss of 2.5 kg or gain of more than 10 kg from age 25 to baseline had significantly negative correlations with baseline CVH scores (Figure 1). Importantly, between 25 and 10 years before baseline, a weight gain of more than 10 kg was significantly negatively correlated with the current CVH score. Conversely, from 10 years before baseline to baseline, any weight change (≥ 2.5 kg) correlated more significantly with the baseline CVH score (loss ≥ 2.5: β = –2.97, 95% CI = –4.71–-1.24; gain 2.5- < 10.0: β = –7.96, 95% CI = –10.24–-5.68; gain ≥ 20.0: β = –11.09, 95% CI = –13.89–-8.29).
Table II
Association between absolute weight change and CVH scores
Figure 1
Association between absolute weight change and CVH score beta-coefficients. Solid and dashed lines represent the predicted value and 95% confidence intervals. The models were adjusted for age, sex, race, family PIR, educational level, marital status, and drinking status. A – Absolute weight change from age 25 years to baseline, B – Absolute weight change from age 25 to 10 years before baseline, C – Absolute weight change from 10 years before baseline to baseline
Supplementary Table SII shows that obesity at age 25 and overweight/obese status 10 years before baseline were negatively correlated with baseline CVH scores (obesity at age 25: β = –4.71, 95% CI: –7.39–-2.03; overweight 10 years prior: β = –2.22, 95% CI: –3.81–-0.63; obesity: β = –6.56, 95% CI: –8.22–-4.9).
Supplementary Table SIII presents the relationships between weight change patterns over the three periods and the CVH scores. From 25 years of age to baseline, when the stable nonobesity group was used as a reference, the CVH scores of the other three groups decreased, whereas in the weight gain and stable obesity groups they significantly increased (β = –9.13, 95% CI = –10.47–-7.79; β = –8.7, 95% CI = –11.57–-5.82, respectively). Similar results were observed in the other two periods, although the risk in the weight loss group was less pronounced. Moreover, we found that during the period from 10 years before baseline to baseline, the stable obesity group faced the greatest risk of poor CVH, with β = –11.86 and 95% CI = –17.8–-5.91.
Associations between uric acid and CVH scores
Supplementary Table SIV shows the associations between serum uric acid levels and CVH scores. According to the univariate model, a continuous increase in uric acid by 1 mg/dl was significantly associated with a decrease in the CVH score (β = –1.15, 95% CI: –1.62 to –0.67, p < 0.001). After adjusting for potential confounders, including age, sex, race, education, income, marital status, and drinking habits, the multivariate model revealed a stronger negative association (β = –1.24, 95% CI: –1.73–0.74, p < 0.001).
When uric acid levels were analyzed by quartiles, the associations with CVH scores became more pronounced in higher quartiles. Compared with Quartile 1 (reference group), Quartile 3 (β = –3.36, 95% CI: –5.3 to –1.42, p = 0.001) and Quartile 4 (β = –4.2, 95% CI: –6.14 to –2.27, p < 0.001) showed significant negative correlations with CVH scores in the multivariate model. However, Quartile 2 showed no significant association (β = 0.32, 95% CI: –1.55 to 2.2, p = 0.736).
Associations between absolute weight changes and weight change patterns and uric acid
Supplementary Table SV shows a positive association between absolute weight changes and uric acid levels across all three life periods. From age 25 to baseline, for every 1 kg increase in weight, uric acid levels increased by 0.02 mg/dl (β = 0.02, 95% CI: 0.01–0.02, p < 0.001). Compared with those with weight changes < 2.5 kg, participants who gained more than 20 kg during this period presented the greatest increase in uric acid levels (β = 0.79, 95% CI: 0.53–1.05, p < 0.001). Similar trends were observed from age 25 to 10 years before baseline and from 10 years before baseline to baseline, with larger weight gains correlating with greater increases in uric acid levels. Notably, weight loss was not significantly associated with uric acid levels in most periods.
Supplementary Table SVI illustrates the associations between BMI and uric acid levels at three different life stages: 25 years, 10 years before baseline, and baseline. At age 25, obesity was associated with a significant increase in uric acid levels compared with normal weight (β = 0.46, 95% CI: 0.16–0.76, p = 0.003). Overweight also showed a positive association (β = 0.23, 95% CI: 0.05–0.41, p = 0.014). Ten years before baseline, both overweight (β = 0.49, 95% CI: 0.31–0.67, p < 0.001) and obesity (β = 0.55, 95% CI: 0.36–0.73, p < 0.001) demonstrated stronger associations with higher uric acid levels. At baseline, the associations remained significant, with overweight (β = 0.47, 95% CI: 0.28–0.65, p < 0.001) and obesity (β = 0.81, 95% CI: 0.62–0.99, p < 0.001) linked to elevated uric acid levels.
Supplementary Table SVII shows that weight change patterns over the three life periods significantly affected uric acid levels. Using the stable nonobese group as a reference, the stable obese group consistently presented the highest uric acid levels across all periods. From age 25 to baseline, stable obesity was associated with an increase in uric acid levels (β = 0.69, 95% CI: 0.35–1.03, p < 0.001). Similarly, weight gain patterns also showed significant positive associations with uric acid levels, with the effect size varying by period. Weight loss patterns were less strongly associated with uric acid, and the associations were not statistically significant in most cases.
Mediation analysis
To explore the potential mediating role of uric acid between BMI at different life stages and CVH, we conducted a mediation analysis. Figure 2 shows that uric acid significantly mediated the relationship between BMI and CVH.
Figure 2
Depression score as a mediator of the relationship between BMI across three distinct life stages and CVH. Mediation analysis by the bootstrap test: adjusted for age, sex, race, family PIR, educational level, marital status, and drinking status. *P < 0.05
IE – indirect effect, DE – direct effect, CVD – cardiovascular diseases.
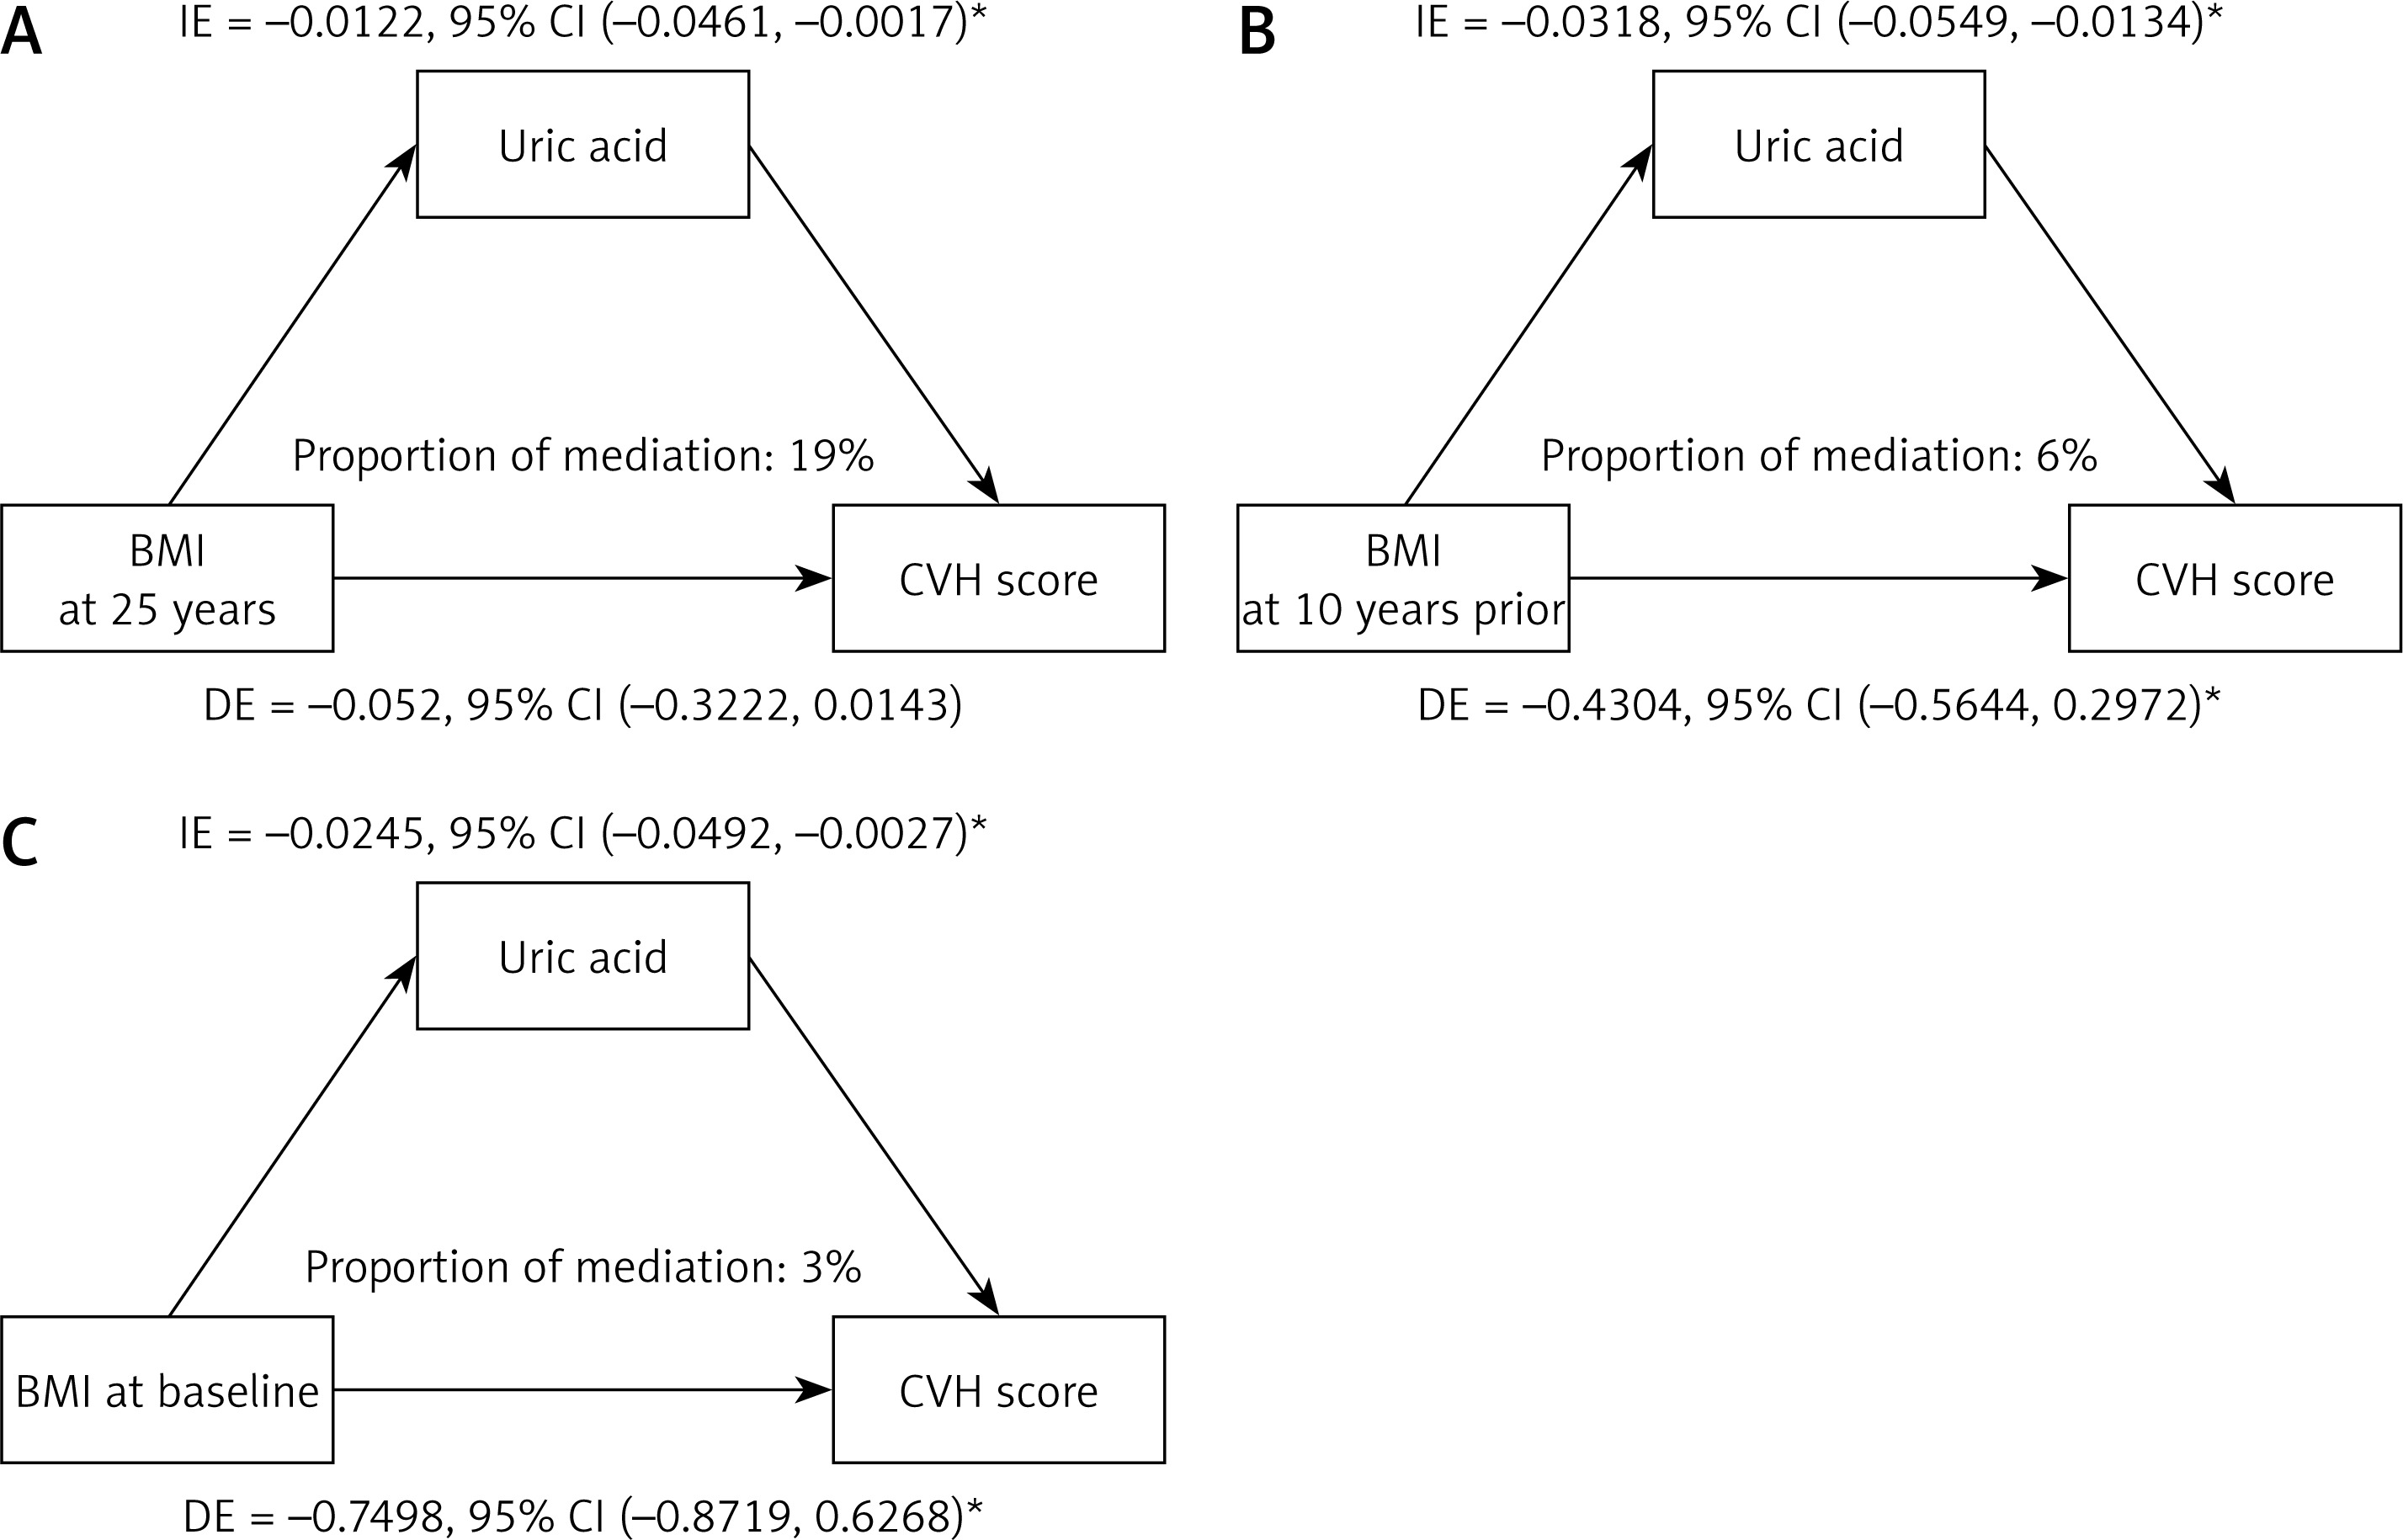
At baseline (late adulthood), the indirect effect of uric acid was β1 * β2 = –0.0245, 95% CI = –0.0492 to –0.0027, p = 0.024, with a mediation ratio of 3%. Ten years prior (mid-adulthood), the indirect effect of uric acid was β1 * β2 = –0.0318, 95% CI = –0.0549 to –0.0134, p < 0.001, with a mediation ratio of 6%. At age 25 (early adulthood), the indirect effect of uric acid was β1 * β2 = –0.0122, 95% CI = –0.0461 to –0.0017, p = 0.01, with a mediation ratio of 19%. These findings indicate that uric acid plays a mediating role in the association between BMI and CVH during early and late adulthood, with a notably greater mediation ratio in early adulthood.
Sensitivity analysis
When CVD history was included as a covariate in the mediation analysis, the results remained robust (Supplementary Figure S2). Gender-specific differences were observed: in men, uric acid mediated only the relationship between BMI in late adulthood and CVH, whereas in women, uric acid consistently mediated the relationship across all life stages (Supplementary Figures S3, S4). Additionally, in the older age group (≥ 65 years), the mediating role of uric acid remained significant, whereas in the middle-aged group (< 65 years), this mediating effect was no longer observed (Supplementary Figures S5, S6).
Discussion
This study highlights the significant relationships between weight changes, BMI, uric acid levels, and CVH across adulthood. Absolute weight changes and patterns of weight gain or stable obesity were consistently associated with poorer CVH scores and elevated uric acid levels. Uric acid emerged as a mediator between BMI and CVH, with a stronger mediating effect in early adulthood. Gender- and age-specific differences were evident, with uric acid playing a more pronounced mediating role in women and older adults (≥ 65 years). Importantly, this study is the first to explore the mediating role of uric acid in the relationship between weight changes and cardiovascular health across different life stages, which represents a novel contribution to the literature. These findings emphasize the interconnected roles of weight management, metabolic factors, and demographic characteristics in shaping cardiovascular outcomes throughout life.
Our analysis revealed the substantial impact of obesity on CVH. Shihab et al. demonstrated that obesity in young adults is closely linked to the development of hypertension in adulthood, with lifetime weight gain increasing the risk of this condition [21]. Additionally, Kjøllesdal et al. reported that obesity during both early and middle adulthood is associated with an increased mortality rate from CVD [22]. These findings are consistent with the results of our study. The inflammation, metabolic disorders, and endothelial dysfunction caused by obesity are likely key mechanisms contributing to the worsening of CVH [23, 24]. Another key finding is the close correlation between the absolute changes in participants’ weight throughout adulthood and their patterns of weight change with CVH scores. A randomized controlled trial revealed that weight fluctuations among participants with coronary artery disease were associated with higher mortality rates and a greater incidence of cardiovascular events [9]. Liu et al. reported that weight change patterns from nonobese to obese, obese to nonobese, and persistent obesity from youth to middle age are associated with an increased risk of CVD [25]. All these studies support our conclusions. Mechanistic studies have shown that severe weight fluctuations can lead to metabolic disorders, increase the cardiac burden, and may cause instability in blood pressure and blood sugar levels, thereby affecting the cardiovascular system [26–28]. These findings are consistent with our conclusions. Weight management clearly extends beyond obesity alone, encompassing absolute changes in weight and patterns of weight change across the adult lifespan.
Our research indicated that weight fluctuations during middle to late adulthood are associated with greater cardiovascular risk than fluctuations in weight during early to middle adulthood. This difference may be attributed to the physiological, chronic disease, and lifestyle specifics of older adults. With advancing age, a reduced metabolic rate and diminished adaptability of the cardiovascular system make the impact of weight fluctuations on CVH more pronounced [29, 30]. Additionally, older adults often have more chronic health issues, such as hypertension, high cholesterol, and diabetes, which may render the cardiovascular system more sensitive to weight fluctuations. Lifestyle changes, such as reduced physical activity and alterations in dietary habits, could also exacerbate this impact. Notably, weight fluctuations in older adults might involve changes in muscle mass rather than just fat [31, 32], which could have different effects on CVH [33, 34]. These findings underscore the importance of weight management and health maintenance in older age groups.
This study revealed a significant negative correlation between serum uric acid levels and CVH scores, with this association being more pronounced among participants with high uric acid levels. This finding aligns with previous studies demonstrating that hyperuricemia promotes the development and progression of cardiovascular diseases by regulating molecular signals, such as inflammation, oxidative stress, insulin resistance/diabetes, endoplasmic reticulum stress, and endothelial dysfunction [35]. Elevated uric acid levels can impact CVH through several mechanisms. First, uric acid promotes oxidative stress, leading to the production of reactive oxygen species (ROS) that impair endothelial function. Uric acid also activates the renin–angiotensin–aldosterone system (RAAS), causing vasoconstriction and elevated blood pressure, further harming CVH [14]. Second, uric acid induces inflammatory responses by increasing the release of proinflammatory cytokines, which accelerates the development of atherosclerosis [36].
This study also revealed a positive correlation between BMI and serum uric acid levels across all life stages, with the association being most pronounced among individuals with obesity. This finding is consistent with recent research demonstrating a close relationship between obesity and hyperuricemia [37]. Obesity may affect uric acid metabolism through several mechanisms. First, obesity is often accompanied by insulin resistance, which increases renal tubular reabsorption of uric acid and reduces its clearance [15]. Second, chronic low-grade inflammation associated with obesity can promote uric acid production and accumulation [16]. Additionally, this study revealed that absolute weight gain, particularly weight gain exceeding 10–20 kg, was significantly associated with elevated uric acid levels. This finding suggests that sustained weight gain has a substantial effect on uric acid metabolism, potentially exacerbating cardiovascular risks through the mechanisms mentioned above [38].
Through mediation analysis, this study revealed that uric acid partially mediated the relationship between BMI and CVH across different life stages, with the mediating effect being most prominent in early adulthood. This finding is consistent with recent research indicating a strong association between early adulthood BMI and the risk of hyperuricemia later in life [39]. Uric acid may act as a mediator through multiple mechanisms. First, obesity leads to increased uric acid production and reduced excretion, resulting in hyperuricemia. Elevated uric acid levels promote oxidative stress and inflammation, impairing endothelial function and ultimately worsening CVH. Additionally, metabolic abnormalities associated with obesity, such as insulin resistance and lipid metabolism disorders, may further exacerbate cardiovascular risks by increasing uric acid levels.
The observed sex differences in the mediating role of uric acid between BMI and CVH may be attributed to the regulatory effects of sex hormones on uric acid metabolism and endothelial function. In women, estrogen provides protective effects by promoting nitric oxide (NO) production, reducing oxidative stress, and regulating uric acid excretion (e.g., upregulating the uric acid transporter ABCG2). These protective effects during reproductive age may have long-term benefits for CVH, with the cumulative advantages persisting even after menopause despite declining estrogen levels. Consequently, women exhibit consistent uric acid-mediated effects across all life stages. In contrast, in men, androgens may limit NO production, increase oxidative stress, and impair uric acid clearance, exerting detrimental effects on endothelial function. However, in early adulthood, men may not yet have accumulated a sufficient metabolic burden for uric acid to significantly impact CVH. With aging and the worsening of metabolic disorders (e.g., obesity and insulin resistance), uric acid levels increase, and its detrimental effects on endothelial function become more pronounced, explaining the significant mediating effect of uric acid, which is primarily observed in late adulthood in men [40].
This retrospective study, which is based on the NHANES database, has several notable strengths and limitations. A primary strength is the comprehensive nature of NHANES, which includes detailed biomarker data, such as serum uric acid levels, enabling a robust analysis of its mediating role in the relationship between BMI and CVH across different life stages, a perspective not extensively explored in prior research. The dataset’s large, nationally representative sample ensures statistical power and generalizability within the U.S. population. Additionally, the availability of diverse covariates allows for extensive adjustments, whereas age-stratified analysis provides valuable insights into life-stage-specific patterns of weight changes and their cardiovascular implications. However, several limitations exist. The cross-sectional nature of certain biomarker data, including uric acid, limits causal inference, and the reliance on self-reported weight at earlier life stages introduces potential recall bias. Furthermore, the absence of genetic information and unaccounted behavioral factors, such as stress or physical activity, may contribute to residual confounding. Finally, while the findings are relevant to the U.S. population, their generalizability to other regions may be limited due to cultural and healthcare differences.
In conclusion, this study highlights the significant associations between weight changes, BMI, serum uric acid levels, and CVH across different adult life stages. Uric acid has emerged as a crucial mediator in the relationship between BMI and CVH, with notable sex- and age-specific differences. These findings emphasize the importance of weight management throughout adulthood and the need to address metabolic factors, such as uric acid, to improve cardiovascular outcomes. Clinically, these results suggest that serum uric acid could serve as an important marker for cardiovascular risk in patients with obesity, especially those with significant weight fluctuations. Monitoring uric acid levels alongside BMI could enhance the prediction and early diagnosis of cardiovascular risk, leading to more targeted and personalized management strategies. In addition, managing weight changes and controlling uric acid levels could be vital components in improving cardiovascular health for patients at high risk of CVD. Future research should explore targeted interventions that consider these sex- and age-specific patterns, as well as the interplay between metabolic and behavioral factors, to optimize CVH across diverse populations.