Introduction
Chronic kidney disease (CKD) is a progressive loss of renal function over time, ultimately leading to end-stage renal disease, which means irreversible renal failure [1]. The pathophysiological processes involved in CKD development are characterized by a background of low-grade chronic inflammation and a high level of oxidative stress [2]. Together with coagulation disorders and neutrophil-endothelium interaction, inflammation is believed to play a role in the genesis of kidney injury, potentially leading to chronically impaired kidney function [3]. According to the available data, it has been confirmed that diet might play a central role in the regulation of chronic inflammation and anti-oxidant balance, and might essentially improve kidney functions [4–6].
Caffeinated drinks are very commonly consumed mainly in Western countries [7]. It is estimated that more than 50% of US adults drink coffee on a daily basis [7]. Epidemiological studies and experimental research suggests that coffee consumption may help to prevent several chronic conditions, including type 2 diabetes (DMT2), liver disease, and cardiovascular disease (CVD) [7, 8]. With regard to the impact of coffee drinking on CKD, available results have been inconsistent [8–13]. Several studies have reported no significant relationship between coffee consumption and likelihood of CKD [8, 11, 12], while others have reported an inverse association [9, 10, 13]. The interpretation of single studies to date has been limited by sample size, research design and subject traits (gender, ethnicity, age, etc.), and they have been underpowered to be able to provide a comprehensive and reliable conclusion. Nakajima et al. in their study with 4722 participants aged 26–65 years and followed up for 15 years found that coffee consumption was associated with a modest increase in estimated glomerular filtration rate (eGFR) [11]. It has been hypothesized that various components of coffee may preserve the glomerular endothelial cells from oxidative stress and inflammation [8].
When considering the available data we are not able to rule out the chance of residual bias, confounding factors, and reverse causation. Mendelian randomization (MR) analysis is able to circumvent the limitations of observational studies, and circumvent the residual bias, confounding factors and reverse causation by using genetic variants that are associated with an exposure as instruments (= coffee) to test for associations with an outcome (= renal function) [14].
Taking all the above into account, we aimed to resolve this uncertainty by investigating the association between caffeine intake, renal function, assessed by biochemical indices, and prevalent CKD in adult Americans, by conducting MR analysis on the recognized single nucleotide polymorphisms (SNPs) of coffee consumption and their causal impact on renal function, and systematically reviewing the literature and performing a meta-analysis.
Material and methods
NHANES population data
We used data from the Nutrition and Health Examination Surveys (NHANES), which is described in detail elsewhere [15]. In brief, these are periodic cross-sectional surveys conducted by the US National Center for Health Statistics (NCHS), and during which home visits are conducted to administer questionnaires to collect data on demographics, diet, and other health behaviors. NHANES applies complex multistage probability sampling procedure to ensure selection of participants from various geographical locations and adequate racial/ethnic representation [15]. Trained interviewers collected participants’ demographic, socioeconomic, dietary, and health-related information using questionnaires administered during home visits. Clinical examination and dietary assessment are conducted by skilled personnel using a mobile examination center (MEC) [15]. All procedures were carried out in accordance with relevant approved guidelines and regulations [16–19]. Informed consent was obtained from all participants, and the NCHS Research Ethics Review Board approved the protocol.
For the present analysis, four survey cycles (between 2005 and 2010) were combined to produce estimates with greater precision and a smaller sampling error. The analytical sample was limited to adults aged ≥ 18 years. After excluding pregnant and lactating women (n = 865), as well as participants with missing information on the variables of interest (n = 2935), the final analytical sample included 18,436 respondents from NHANES 2005–2010.
Smoking was based on self-report. The poverty to income variable is an index for the ratio of family income to poverty. The Department of Health and Human Services’ (HHS) poverty guidelines were used as the poverty measure to calculate this index [19]. For the assessment of height and weight during the physical examination, participants were dressed in underwear, disposable paper gowns and foam slippers. Body mass index (BMI) was calculated as weight, in kg, divided by the square of height, in meters [19]. Three and sometimes four BP (including systolic (SBP) and diastolic blood pressure (DBP)) measurements were taken using a mercury sphygmomanometer by a physician.
Biochemical analysis
Methods for biochemical analyses are described in detail in the NHANES Laboratory/Medical Technologists Procedures Manual [16–19]. A blood specimen was drawn from the participant’s antecubital vein by a trained phlebotomist according to a standardized protocol. Fasting glucose was measured in plasma by a hexokinase method using a Roche/Hitachi 911 Analyzer and Roche Modular P Chemistry Analyzer. The DxC800 modular chemistry side uses the Jaffe reaction method (kinetic alkaline picrate) to determine the concentration of creatinine in serum. The creatinine calibration is traceable to an isotope dilution mass spectrometry reference method [20]. Urinary creatinine by the Jaffe rate reaction, and urinary albumin by solid-phase fluorescent immunoassay, from a random urine sample [21], were used to calculate the urinary albumin-creatinine ratio (ACR). The CKD Epidemiology Collaboration (CKD-EPI) equation [22] was used to estimate glomerular filtration rate (eGFR, in ml/min/1.73 m²), and an eGFR of < 60 ml/min/1.73 m² was used to define low eGFR. ACR > 30 mg/g was used to define albuminuria, and the presence of either low eGFR or albuminuria was used to define CKD in line with the Kidney Disease: Improving Global Outcomes (KDIGO) 2012 recommendations [23]. Levels of triglyceride (TG) were measured enzymatically. DMT2 was diagnosed as a self-reported history of diabetes or fasting plasma glucose ≥ 126 mg/dl. Hypertension (HTN) was diagnosed in individuals with SBP at or above 140 mm Hg and/or DBP at or above 90 mm Hg, and in persons who were on anti-hypertensive therapy [24].
Dietary data in NHANES were collected using a single 24-hour dietary recall interview at the MEC [15]. Dietary intake was assessed via 24 h recall obtained by a trained interviewer during the mobile examination center visit, using a computer-assisted dietary interview system with standardized probes, i.e. the US Department of Agriculture Automated Multiple-Pass Method (AMPM) [25, 26]. Briefly, the type and quantity of all foods and beverages consumed in a single 24 h period before the dietary interview (from midnight to midnight) were collected using the AMPM. The AMPM is designed to enhance complete and accurate data collection while reducing respondent burden [26, 27]. Caffeine concentration data reported in the survey-specific Food and Nutrient Database for Dietary Studies (FNDDS) were relied upon in the analyses. FNDDS is the database that provides the nutrient values for foods and beverages reported in What We Eat in America (WWEIA), the dietary intake component of NHANES. Sources of caffeine included coffee, tea, soda, energy drinks, and chocolate and cocoa containing products, in consideration of caffeinated and decaffeinated versions [28].
Statistical analysis
Data analyses followed the CDC guidelines for complex NHANES data analysis, accounting for the masked variance and using the recommended weighting methodology [29], implemented using SPSS complex sample module version 22.0 (IBM Corp, Armonk, NY). We used means and standard error of the mean (SEM) for continuous variables (with groups compared via analysis of variance (ANOVA)) and percentages for categorical variables (with groups compared using the χ2 test). The natural logarithm of ACR and urinary albumin were taken to approximate a normal distribution. Adjusted mean of kidney function markers (urine albumin, serum creatinine, ACR, eGFR) across caffeine quartiles were conducted using analysis of covariance (ANCOVA). These models were adjusted for age, sex, race, income to poverty, alcohol intake, energy intake, smoking, BMI, HTN, TG and T2DM. Logistic regressions models, employing a similar adjustment strategy (age, sex, race, income to poverty, alcohol intake, energy intake, smoking, BMI, HTN, TG and T2DM), were then used to derive the odds ratio (OR) and 95% confidence interval (CI) for the association of caffeine (by quartile) with prevalent CKD, always using the lowest quartile as a reference. A two-sided p < 0.05 was used as the nominal cut-point to indicate statistically significant results.
Mendelian randomization
Study design
A two-sample MR study design was used, in which summary statistics from different genomewide association studies (GWAS) were analyzed, for the exposures and outcomes, to estimate the effects of exposure on outcome. Essentially, we applied genetic predictors of coffee consumption to extensively genotyped case-control studies of kidney function (CKD, eGFR (separately in patients with and without DM)) to obtain estimates of the association of exposure with our clinical outcomes.
Genetic predictors of exposures
We retrieved summary data for the association between SNPs and coffee consumption from the biggest meta-GWAS (91,462, European descent, Coffee and Caffeine Genetics Consortium) [28] (Supplementary Table SI). 10 single nucleotide polymorphisms (SNPs), at eight loci, were identified as associated with coffee consumption [30]; we excluded three SNPs that did not exceed the genome-wide significance threshold (p < 5 × 10⁻⁸) and two SNPs in linkage disequilibrium (r 2 > 0.6), leaving five independent SNPs for the main analyses. The MR studies assume that the SNPs (instrumental variables) are associated with the outcome only via the exposure [31], so we performed sensitivity analysis excluding SNPs with potentially pleiotropic effects. To assess the instrumental variable analysis “exclusion-restriction” assumption we used Ensembl release (http://useast.ensembl.org/index.html). Ensembl gives SNP phenotypes.
Genetic predictors of outcomes
Genetic associations with renal function were obtained from the largest available extensively genotyped study based on a meta-analysis (133,413 individuals with replication in up to 42,166 individuals) [32]. eGFR was estimated using the four-variable Modification of Diet in Renal Disease Study Equation. They defined CKD as eGFR < 60 ml/min per 1.73 m2. Diabetes was defined as fasting glucose ≥ 126 mg/dl, pharmacologic treatment for diabetes or by self-reports. In all studies, diabetes and kidney function were assessed at the same point in time. For genome-wide association analysis they followed a centralized analysis plan. Each study regressed sex and age adjusted residuals of the logarithm of eGFR on SNP dosage levels. Logistic regression of CKD status was performed on SNP dosage levels adjusting for sex and age. For all traits, adjustment for appropriate study-specific features, including study site and genetic principal components, was included in the regression and family-based studies appropriately accounted for relatedness. A SNP, highly correlated (R 2 > 0.99) with the original SNP, was used as a proxy when the original SNP was not available for outcomes.
Statistics
We also used MR-Egger to test for potential pleiotropic effects as it may generate correct estimates even when all SNPs are invalid instruments if the assumption of instrument strength independent of direct effect (InSIDE) is satisfied. MR-Egger allows free estimation of the intercept, although further assumptions, such as the independence between instrument strength and direct effects, cannot be easily verified. Average directional pleiotropy across genetic variants was assessed from the p-value of the intercept term from MR-Egger [33]. Causal estimates in MR-Egger are less precise than those obtained using inverse variance-weighted (WM) MR [34]. Analysis using MR-Egger has a lower false positive rate but a higher false negative rate than the inverse variance weighted (IVW) method [35]. The WM estimate, as the weighted median of the SNP-specific estimates, provides correct estimates if SNPs accounting for ≥ 50% of the weight are valid instruments. WM MR allows some variants to be invalid instruments provided at least half are valid instruments. It uses inverse variance weights and bootstrapping to estimate CIs [33].
Further, to assess heterogeneity between individual genetic variants’ estimates, we used the Q′ heterogeneity statistic [36] and the MR pleiotropy residual sum and outlier (MR-PRESSO) [34] test. The Q′ statistic uses modified 2nd order weights that are a derivation of a Taylor series expansion and take into account uncertainty in both numerator and denominator of the instrumental variable ratio (this eases the NO-measurement (NOME)-error assumption) [36]. The MR-PRESSO framework relies on the regression of variant-outcome associations on variant-exposure associations and implements a global heterogeneity test by comparing the observed distance (residual sums of squares) of all variants to the regression line with the distance expected under the null hypothesis of no pleiotropy [37]. In case of evidence of horizontal pleiotropy, the test compares individual variants expected and observed distributions to identify outlier variants. We consider as results causal estimates that agreed in direction and magnitude across MR methods, pass nominal significance in inverse variance-weighted MR, and did not show evidence of bias from horizontal pleiotropy using heterogeneity tests. MR-RAPS (Mendelian randomization using the robust adjusted profile score) is a method for correcting for pleiotropy using robust adjusted profile scores. We used R (version 3.4.2 R Core Team (2017). R: A language and environment for statistical computing. R Foundation for Statistical Computing, Vienna, Austria).
Ethics
This investigation uses published or publicly available summary data with no involvement of participants in the study. No original data were collected for this manuscript. Ethical approval for each of the studies included in the investigation can be found in the original publications (including informed consent from each subject). The study conforms to the ethical guidelines of the 1975 Declaration of Helsinki.
Systematic review and meta-analysis
Literature search and study selection
This meta-analysis was designed, conducted and reported according to Meta-analysis of Observational Studies in Epidemiology (MOOSE) guidelines [38]. The primary exposure of interest was coffee intake, while the primary outcome of interest was risk of CKD. Studies published up to 30th January 2019 (without language restriction) were searched using PubMed, Embase, and Scopus databases; the query syntax of searching is shown in the Supplementary Methods (Supplementary Table SII). This was complemented by hand searches of the reference list of eligible articles, and email correspondences with authors for additional data, where relevant.
After excluding duplicates and based on titles and abstracts, we excluded studies on animals. Eligible studies were selected by using predefined inclusion criteria of case-control, cross-sectional or cohort studies published as original articles to evaluate the risk of CKD among subjects with coffee consumption compared with subjects without coffee consumption. In addition, supplementary hand searching of reference lists of previous reviews or meta-analyses was conducted.
Study selection
Study selection started with the removal of duplicates, followed by screening of titles and abstracts by two reviewers (MM and JJ). To avoid bias, the reviewers were blinded to the names, qualifications, or the institutional affiliations of the study authors. Agreement between the reviewers was excellent (kappa index: 0.91; p < 0.001). Disagreements were resolved at a meeting between reviewers prior to selected articles being retrieved (a flow chart is available in Supplementary Figure S1).
We included studies if they met all the following criteria: (1) the studies of interest were on coffee intake; (2) the studies were population-based cohort studies and reported CKD data; (3) relative risk (RR), hazard ratio (HR) or OR estimates with 95% CIs adjusted for multivariable factors were available or were able to be calculated; (4) original articles with full texts in English.
Studies were excluded according to the following criteria: (1) reviews, letters, unpublished data, or comments; (2) those published in languages other than English; (3) not population-based cohort studies; (4) RR, HR or OR estimates with 95%CIs were not available or were not be able to be calculated. Narrative reviews, comments, opinion pieces, methodological papers, editorials, letters or any other publications lacking primary data and/or explicit method descriptions were also excluded.
Data extraction and management
The full texts of studies meeting the inclusion criteria were retrieved and screened to determine eligibility by 2 reviewers (MM, JJ). The study quality assessment was performed according to the Newcastle-Ottawa Scale (NOS, Supplementary Table SIII) [39]. The following perspectives were considered: representativeness of the exposed cohort; dietary survey methods of flavonoid intake; comparability of cohorts (adjustment for important confounders); assessment of outcome; duration of follow-up; and adequacy of follow-up. By evaluation of selection, comparability and outcome, the rating system scores for studies range from 0 (highest degree of bias) to 9 (lowest degree of bias). Following assessment of methodological quality, 2 reviewers (MM & JJ) extracted data using a purpose-designed data extraction form and independently summarized what they consider to be the most important results from each study. These summaries were compared, and any differences of opinion were resolved by discussion and consultation with a third reviewer (MB). Any further calculations on study data considered necessary were conducted by the first reviewer and checked by the second reviewer. Information extracted from each eligible study included the following items: author, year and reference, country, region/cohort, coffee consumption measurement, design, sample size, definition of CKD, main confounders (Supplementary Table SIV).
Data synthesis and statistical analyses
For studies that reported results from different multivariable-adjusted models, the model including the most confounding factors was extracted for the meta-analysis. The random-effect model was applied to calculate pooled RRs, 95% CI and p-value for heterogeneity. Effect estimates comparing the highest with the lowest intake category were combined across studies to generate the summary associations. The extent of heterogeneity across studies was examined using the I 2 test [40–42] and I 2 > 50% together with p < 0.05 two-sided indicated significant heterogeneity [40–42]. To examine whether the present results were affected by a single study, we conducted a sensitivity analysis by excluding one study at a time.
Publication bias
Potential publication bias was explored using visual inspection of Begg’s funnel plot asymmetry, Begg’s rank correlation and Egger’s weighted regression tests. The Duval and Tweedie trim method was used to adjust the analysis for the effects of publication bias [43].
Results
NHANES sata
Of the 18,436 participants included in the analyses, 6.9% had prevalent CKD (based on eGFR). The characteristics of participants overall and across caffeine quartiles are summarized in Table I. The caffeine intake for the general population was 131.1 ±1.1 mg and was higher for men compared to women (149.1 ±2.2 vs. 114.2 ±1.7 respectively) (p < 0.001). Mean age across the caffeine intake was in the range 44.2–50.1 years, while the proportion of men decreased from 43.8% to 57.5% across increasing quartiles of caffeine. Across increasing caffeine quartiles, the proportion of non-Hispanic White (the largest ethnic group) increased from 32.8% to 70.0%; the proportions of Non-Hispanic Black decreased from 20.7% to 11.7%; and Mexican-American followed the same trend (reduction from 33.3% to 9.1%, p < 0.001, Supplementary Table SI). The proportion of participants with prevalent low eGFR, albuminuria or CKD systematically decreased across increasing quartiles of caffeine (all p < 0.001 for linear trend, Table I). Proportions of participants with CKD, by caffeine quartile, were 9.4% in the first (lowest) quartile, 7.8% in the second, 5.8% in the third and 5.2% in the top quartile (Table I).
Table I
Descriptive characteristics of participants across quartiles of caffeine
Adjusted mean levels of renal function markers by quartile of caffeine are shown in Table II. For increasing quartiles for caffeine intake, mean urine albumin did not change significantly (2.20 to 2.17 mg/l, p = 0.239); the same was observed for eGFR (91.2 to 89.6 ml/min/1.73 m2, p = 0.415, Table II). Log ACR also remained stable with no significant change across the quartiles of caffeine (2.14 to 2.16 mg/g, p = 0.352). In age, sex and race adjusted logistic regressions, compared with the lowest quartile of caffeine, the odds ratio (95% CI) was 0.76 (0.55–1.09) for Q2, 1.03 (0.95–1.08) for Q3 and 0.97 (0.86–1.12) for Q4 (p = 0.355 for trend, CKD diagnosed by eGFR). In logistic regression models adjusted for age, sex, race, income to poverty, alcohol intake, energy intake, smoking, BMI, HTN, TG and T2DM, compared with the lowest quartile of caffeine, the odds ratio (95% CI) of low eGFR was 1.00 (0.96–1.04) for Q2, 0.99 (0.96–1.03) for Q3 and 1.02 (0.94–1.10) for Q4 (p = 0.745 for trend).
Table II
Adjusted (age, sex, race, alcohol intake, energy intake, smoking, BMI, HTN, TG and DM) mean levels of markers of CKD across quartiles of caffeine
Mendelian randomization
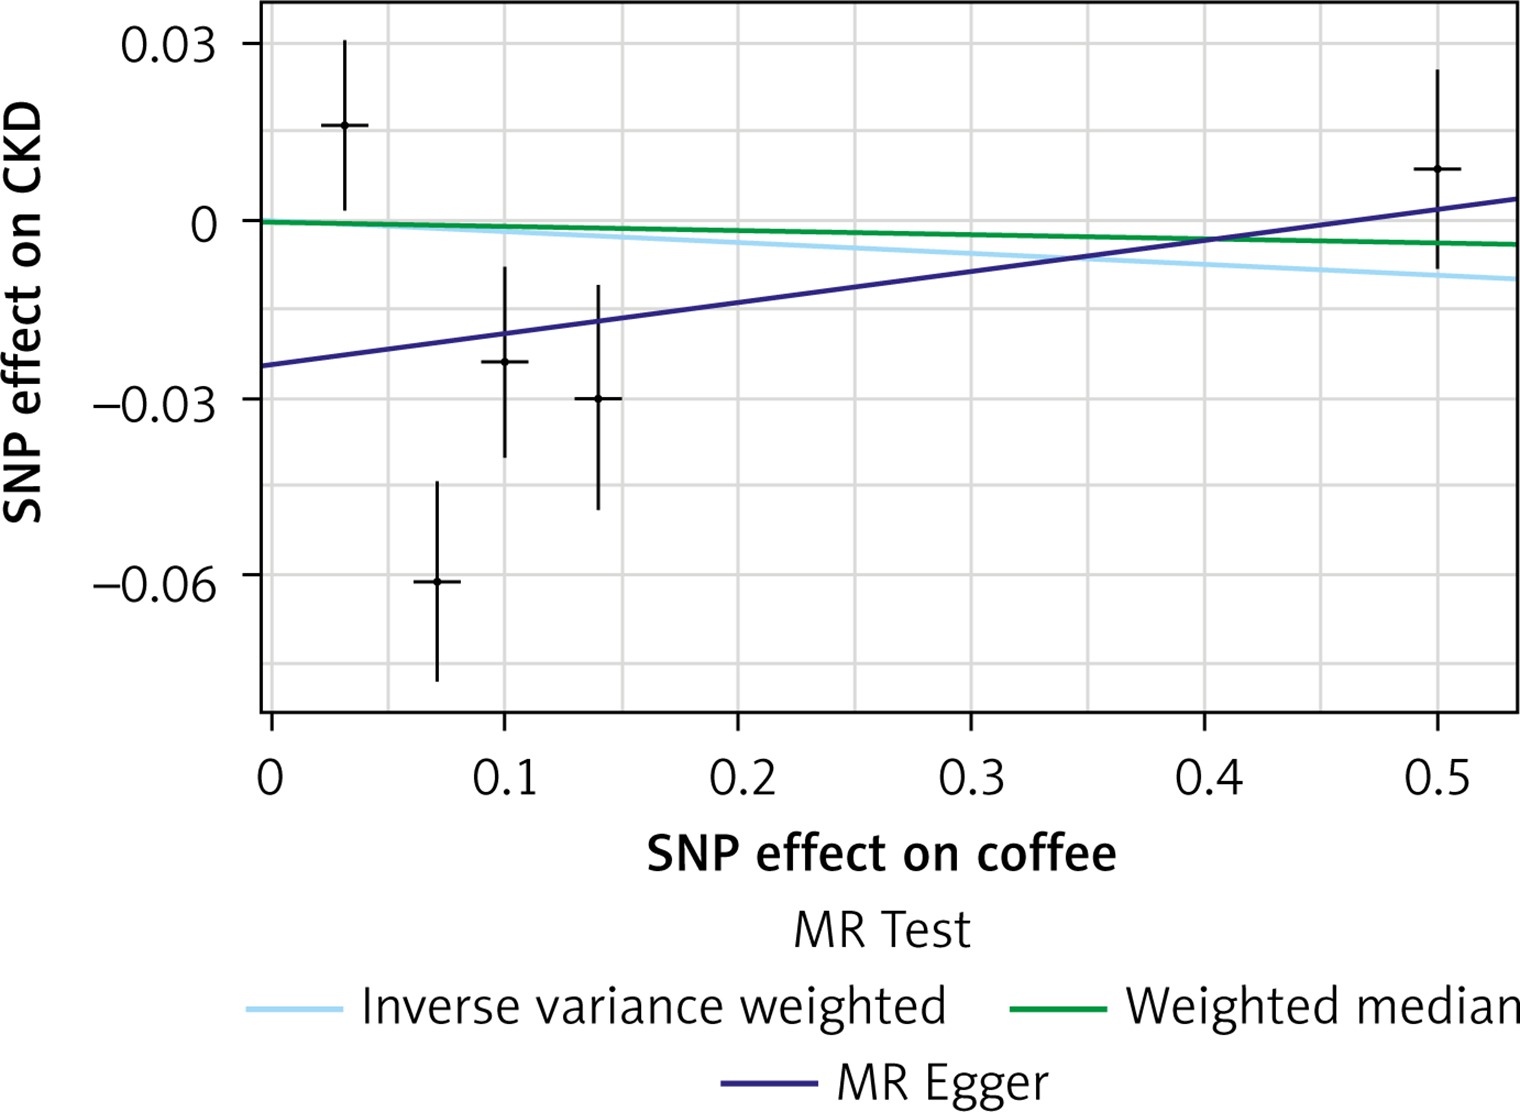
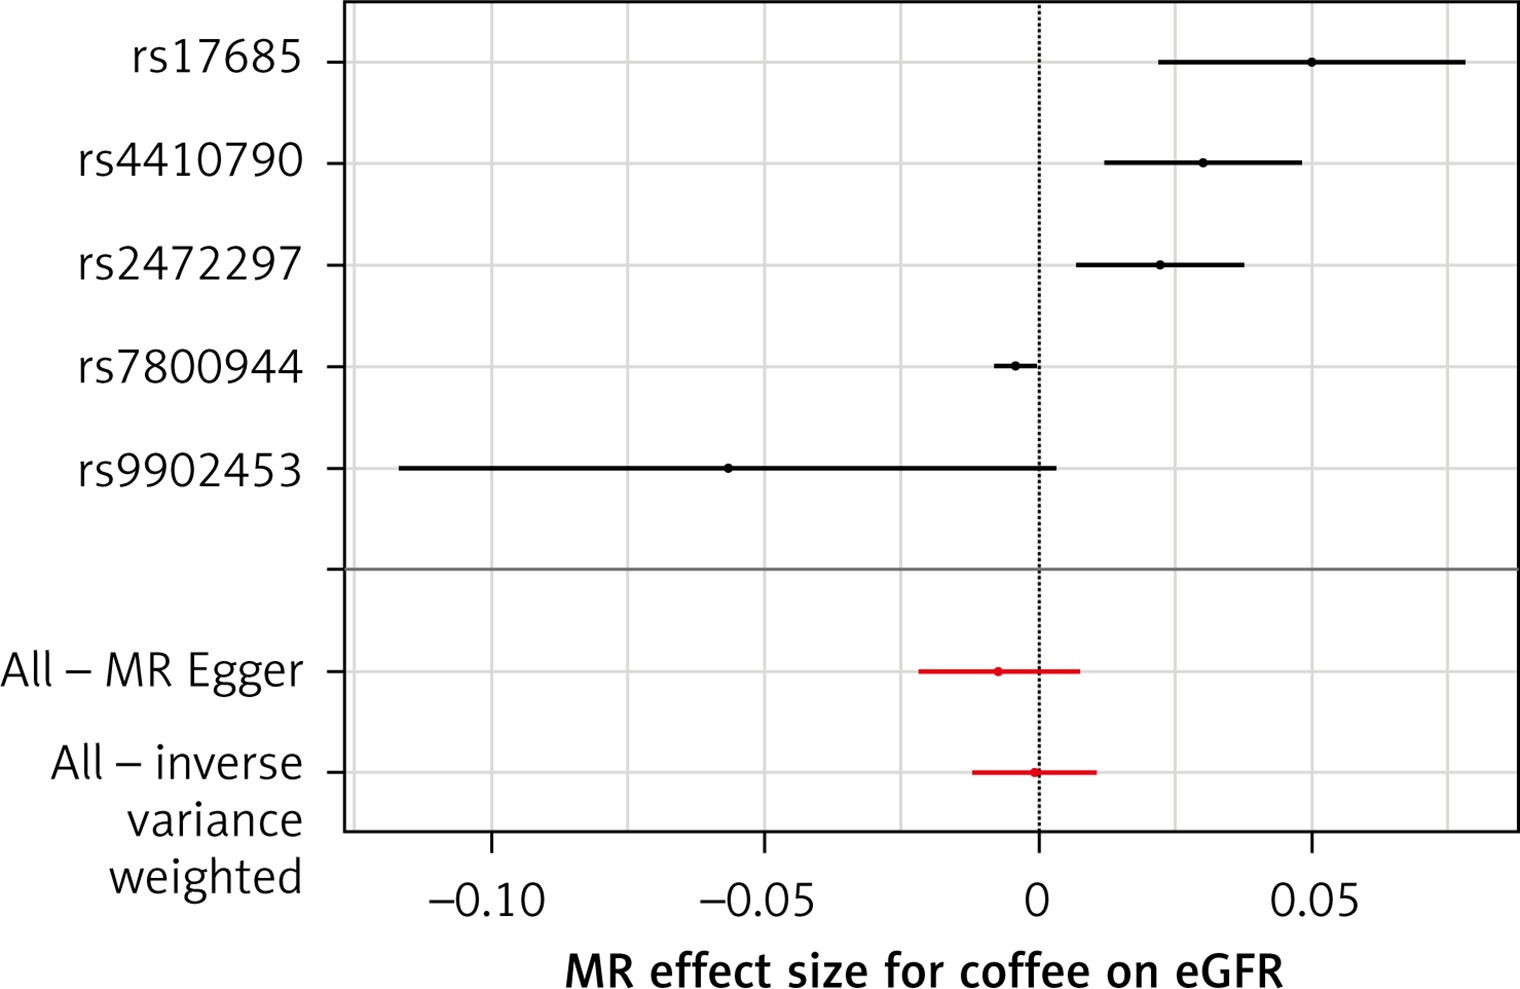
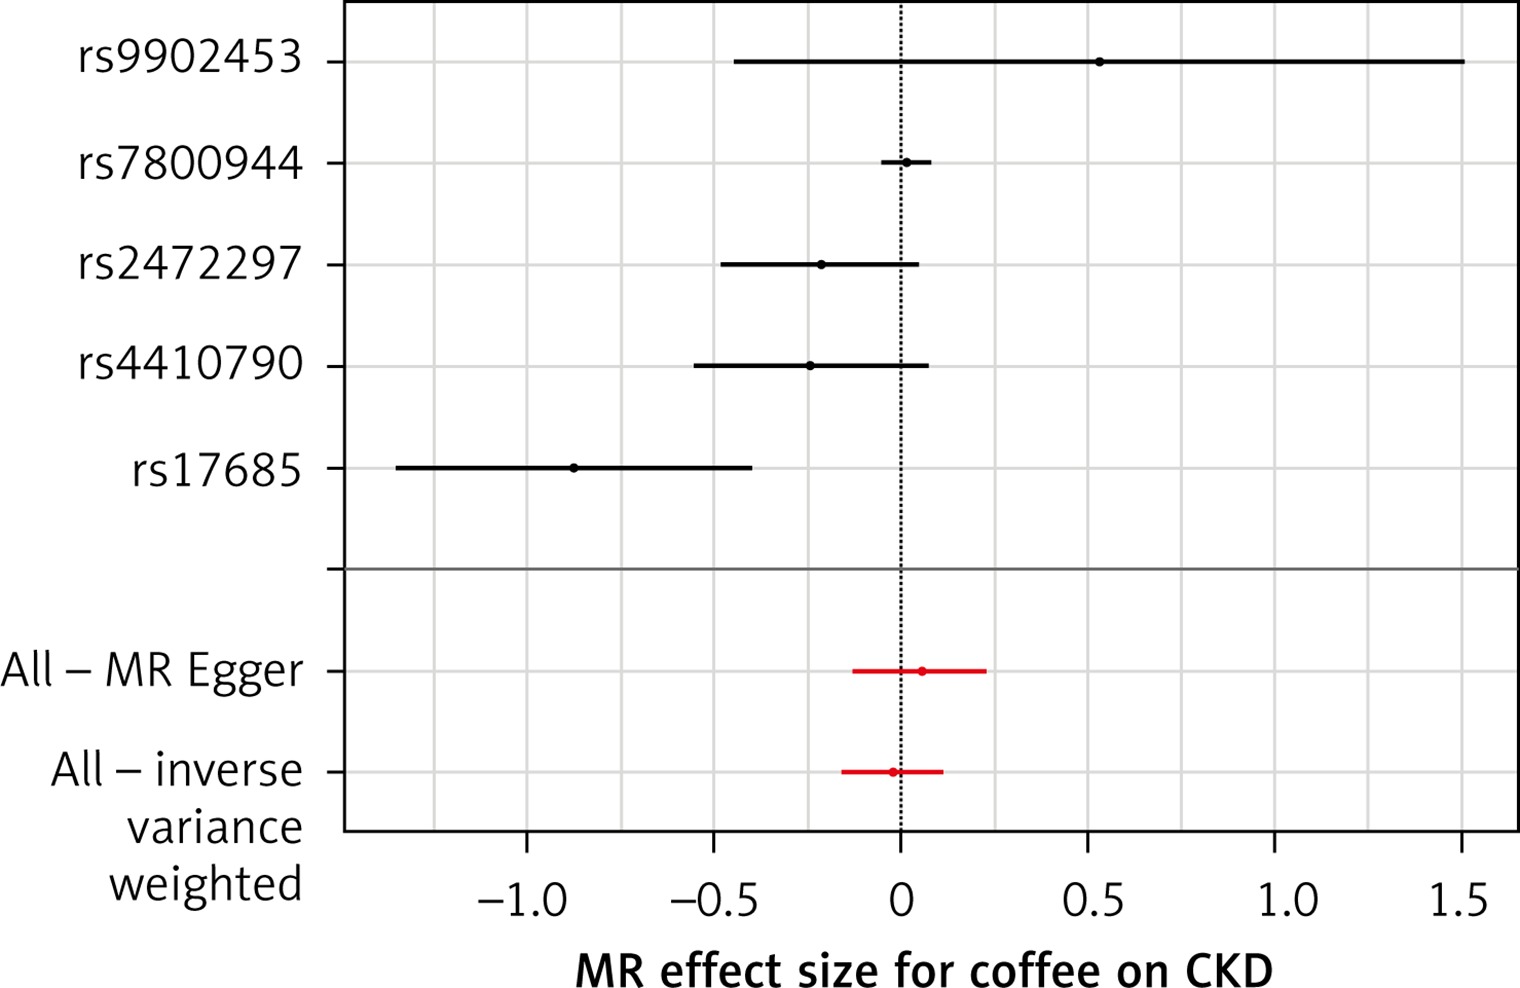
The list of all instruments associations for coffee intake is shown in Supplementary Table SI. The results, expressed as the β-coefficient for outcomes of interest per one cup per day increase in coffee consumption, demonstrate no effect on CKD (IVW: β = –0.0191, SE = 0.069, p = 0.781) or eGFR (overall = IVW: β = –0.0005, SE = 0.005, p = 0.926; both for DM: IVW: β = –0.006, SE = 0.009, p = 0.478, and non-DM subjects: IVW: β = –6.772, SE = 0.006, p = 0.991, Table III). Results of the forest and scatter plots for each outcome are shown in Figures 1 to 4; further analysis of MR-PRESSO did not identify any outlier. As can be seen in Table III, pleiotropy bias did not indicate any chance of pleiotropy for all 4 levels of our outcomes; furthermore, the results of the MR-RAPS were identical to the IVW prediction, which again indicated no chance of pleiotropy (Table III). The heterogeneity tests were significant for all levels of outcomes (Figures 1 and 2) but not for the GFR between DM populations (MR-Egger: Q = 5.579, p = 0.133, Table III). All but three of the coffee-increasing alleles of the five SNPs with a genome-wide significant association with coffee consumption were positively associated with eGFR (rs17685, rs4410790, rs2472297), and the association with rs7800944, near the gene encoding MLXIPL (promoters of triglyceride synthesis genes), was statistically significant and negatively affected eGFR (Figure 3). With regard to CKD, just a single SNP had a significant effect, and it was inversely related (rs17685, making the enzyme cytochrome P450 oxidoreductase, Figure 4).
Table III
Results of MR analysis for all exposures
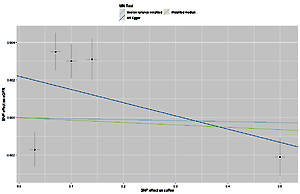
Figure 1
Scatter plots of genetic associations with coffee/caffeine level against genetic associations with eGFR. The slopes of each line represent causal associations for each method
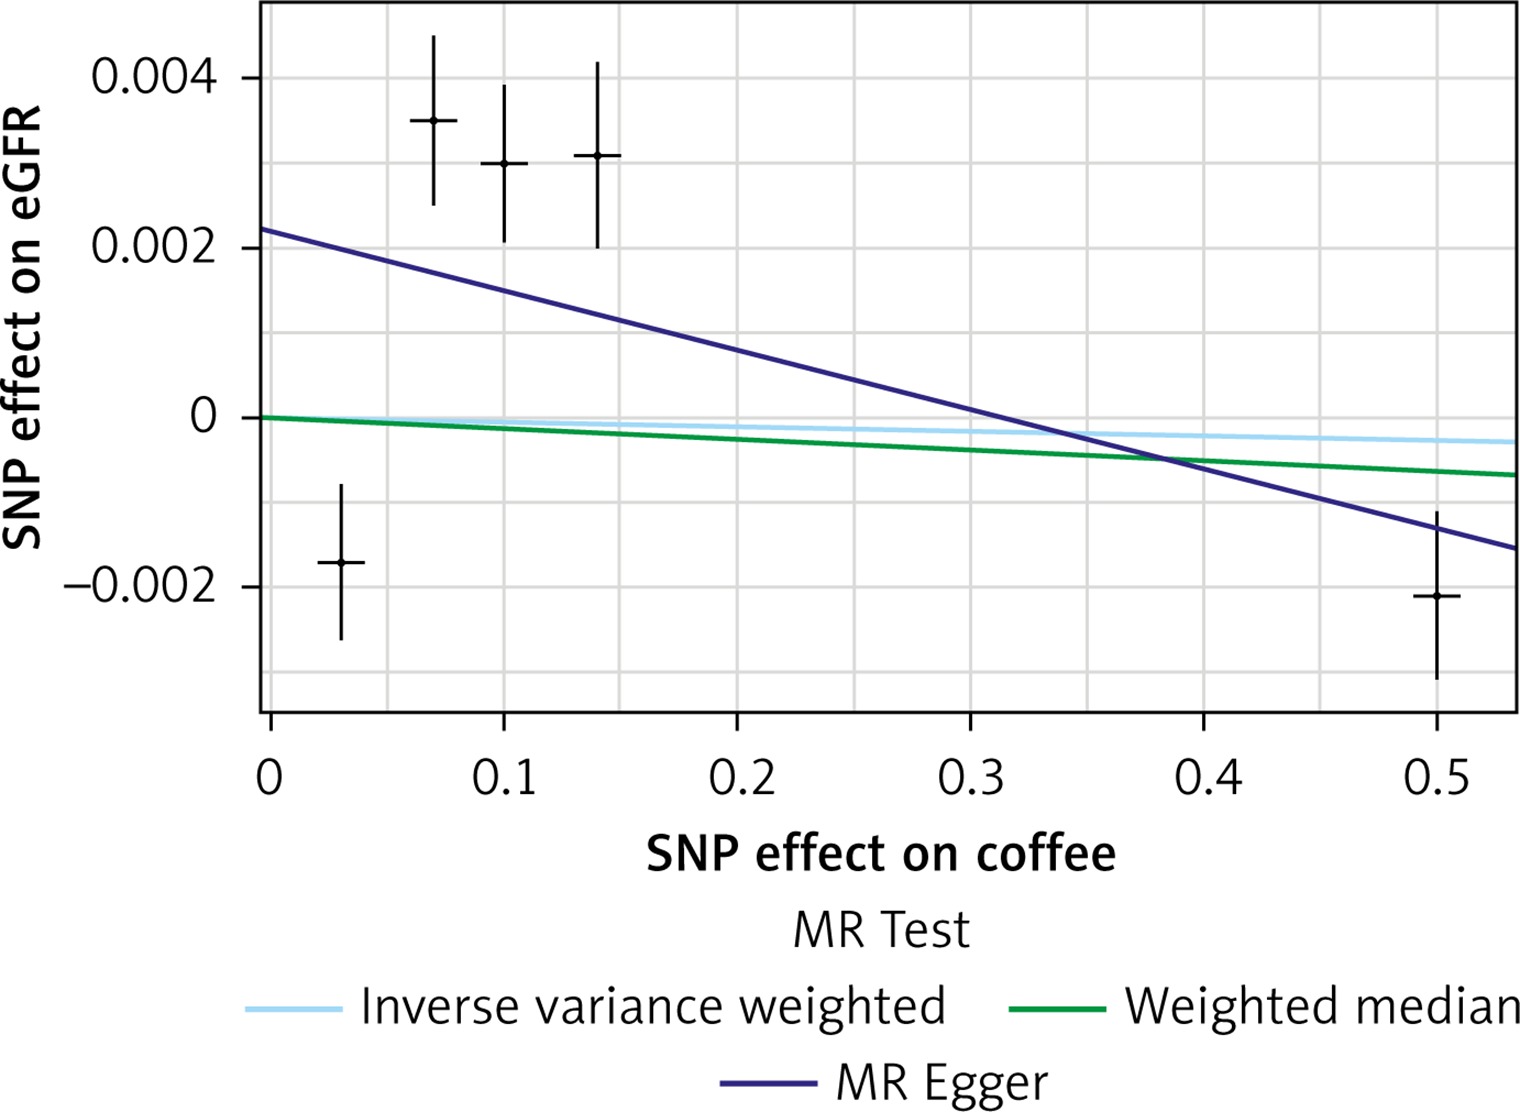
Figure 2
Scatter plots of genetic associations with coffee/caffeine level against genetic associations with CKD. The slopes of each line represent causal associations for each method
Meta-analysis and systematic review
Overviews of key characteristics of the 6 studies are shown in Supplementary Table SIV. A total of 42,051 participants were included in the analysis. All the studies involved both men and women. They were performed in various countries, including: Italy [9], Japan [11, 12], Korea [10, 13] and the USA. In five of them CKD was diagnosed as GFR < 60 ml/min/1.73 m2 [10–12] and in one of them it was renal resistive index (RRI) > 0.65 (renal color Doppler echocardiography was used to evaluate RRI) [9]. Results of quality assessment are shown in Supplementary Table SIII, with all studies scoring ≥ 7.
Coffee consumption and risk of CKD
Based on the meta-analysis of available studies we showed that coffee consumption was not significantly associated with CKD (OR = 0.85, 95% CI: 0.71–1.02, p = 0.090, n = 6 studies, I 2 = 0.32, Supplementary Figure S2).
Sensitivity analysis
In leave-one-out sensitivity analyses, the pooled effect estimates remained similar for the effect on coffee consumption for CKD (OR = 0.85, 95% CI: 0.71–1.02). This stability confirms that the significant difference between the studied groups is the overall effect of all included studies.
Publication bias
Visual inspection of the funnel plot symmetry suggested no potential publication bias for the comparison of coffee consumption and CKD. Moreover, Egger’s linear regression indicated no publication bias (intercept = –1.4, two-tailed p = 0.421), as well as the Begg’s rank correlation test (Kendall’s τ with continuity correction = 1.00, two tailed p = 0.362). After adjustment of the effect size for potential publication bias using the ‘trim and fill’ correction, no potentially missing studies were imputed in the funnel plot (OR = 0.86, 95% CI: 0.70–1.07).
Discussion
The present study, by applying three different methods, examined the association between caffeine intake and prevalent CKD. We used the largest, nationally representative population of adult Americans to evaluate the link between caffeine and renal function. Further, we applied the largest available GWAS to obtain unconfounded estimates of the association between genetically instrumented coffee intake, eGFR and CKD. Further, we systematically searched and pooled the studies. Individual-level data and meta-analysis indicated that caffeine/coffee intake is not associated with likelihood of CKD and kidney function tests. MR data confirmed the main findings and revealed no causal effect of coffee intake on eGFR and CKD.
Available information on the potential association between renal function and coffee is controversial [8–12]. In a cross-sectional study in Italy (n = 221), in which coffee consumption was assessed by an interviewer-administered food frequency questionnaire, the authors reported a significant inverse association between coffee intake and risk of CKD (OR = 0.46, 95% CI: 0.24–0.89) [9]. Kim et al. in their study performed in Korea (n = 2,673), on women aged 35–64 years from the 4th Korean National Health and Nutrition Examination Surveys, also reported the positive effect of caffeine intake on CKD prevalence (OR = 0.59, 95% CI: 0.37–0.95) [10]. Two other studies have reported no association between caffeine/coffee and CKD risk [11, 12] – Pham et al., in a cross-sectional study with 11,662 participants, reported no significant association between coffee intake and likelihood of CKD (OR = 1.01, 95% CI: 0.84–1.21) [12]; similar results were observed in another Japanese cross-sectional study (n = 342; OR = 0.74, 95% CI: 0.30–1.85) [11]. In a prospective study that followed 4,722 participants aged 26–65 year for 15 years, Herber-Gast et al. found that coffee consumption was associated with a slightly higher eGFR, particularly in subjects aged ≥ 46 years. The authors concluded that the absence of an association with eGFR changes suggests that the higher eGFR among coffee consumers is unlikely to be a result of glomerular hyperfiltration [44]. A meta-analysis of 4 studies reported no significant association between coffee consumption and the risk of CKD (OR = 0.71, 95% CI: 0.47–1.08) [8]. Taking into account mostly positive data of moderate coffee consumption with the risk of cardiovascular disease, but also the link between coffee/caffeine intake and blood pressure increase, and especially very recent data suggesting a significant inverse association between caffeine intake and all-cause mortality in CKD patients [45], one might have expected a potential significant impact on CKD.
There are indeed very limited data on the association between caffeine intake and renal function parameters, which makes it difficult to compare our findings. In a cross-sectional study between 11,662 Japanese men and women aged 49–76 the authors reported that caffeine intake was weakly inversely associated with serum uric acid (SUA) in the age-adjusted model [12], while in another study on 14,758 participants aged > 20 years, the authors reported no link between caffeine intake and SUA [46]. Hence the results concerning the potential impact of caffeine intake on kidney functions tests seems to be still controversial. However, taking into account our data, it seems that, similarly to the link between caffeine intake and CKD prevalence, there is also no significant link with the parameters characterizing kidney function [47–57].
The present analysis has some strengths to be emphasized. This is the largest data analysis of the association of kidney disease with caffeine intake. Participants were a random sample of individuals drawn from the general population, and therefore the results can be extrapolated to the general US population. Because data collection was performed on all days of the week in NHANES, the potential for day-specific information bias is very low [47, 48]. We evaluated our findings by applying MR, which is known to be a powerful tool for detection of a causal impact.
Our findings, however, also have to be considered in the context of some study limitations. First, the cross-sectional nature of the data does not allow for direct inference about causality. Second, it is well known that a single 24-hour diet recall interview is not ideal for characterizing an individual’s long-term habitual intake [49, 50]. Third, individuals with renal impairment may be less likely to drink caffeinated drinks, which may have led to underestimation in our results. As with any meta-analysis, internal validity relies on the quality of individual studies. Several limitations can be identified in this regard.
In conclusion, the present study, by applying three different methods to investigate the association between caffeine intake and prevalent CKD, confirmed no impact of caffeine consumption on CKD risk and kidney function tests. MR data additionally revealed no causal effect of coffee intake on eGFR and CKD.