

Placenta accreta spectrum (PAS) complicates > 40% of pregnancies with placenta previa and prior cesarean delivery, posing risks of hemorrhage and maternal death [1]. While transvaginal ultrasound (TVS) is the first-line screening tool, its accuracy may be limited by posterior placenta or equivocal features [2]. Magnetic resonance imaging (MRI) is increasingly used as an adjunct, but systematic reviews show conflicting results regarding its added value. We conducted a retrospective cohort study comparing TVS and MRI in a high-risk cohort to determine whether MRI offers incremental diagnostic value.
This single-center retrospective study (2022–2025) included 140 women with singleton gestation, ≥ 1 prior cesarean, placenta previa at ≥ 28 weeks, and both TVS and MRI within 14 days. The study followed the Declaration of Helsinki (2020-345R).
TVS and MRI were reinterpreted by blinded experts using standardized criteria. PAS was diagnosed on TVS if ≥ 3 of 7 sonographic signs were present [3, 4]; on MRI if ≥2 features (SAR-ESUR criteria [5]) were present. Equivocal TVS was defined as 1–2 signs or technical limitations. Interobserver agreement was substantial (TVS κ = 0.74, MRI κ = 0.81).
Reference standard was intraoperative/histopathological FIGO grading. Statistical analyses used MedCalc® and SPSS®; McNemar’s test for paired sensitivity/specificity, χ2 for accuracy, DeLong test for AUC (nonparametric, no normality assumption).
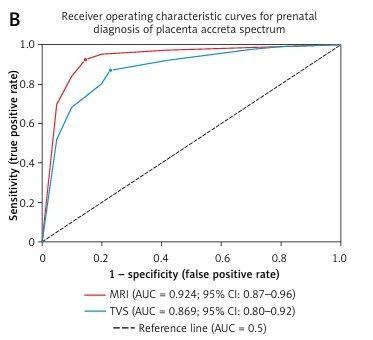
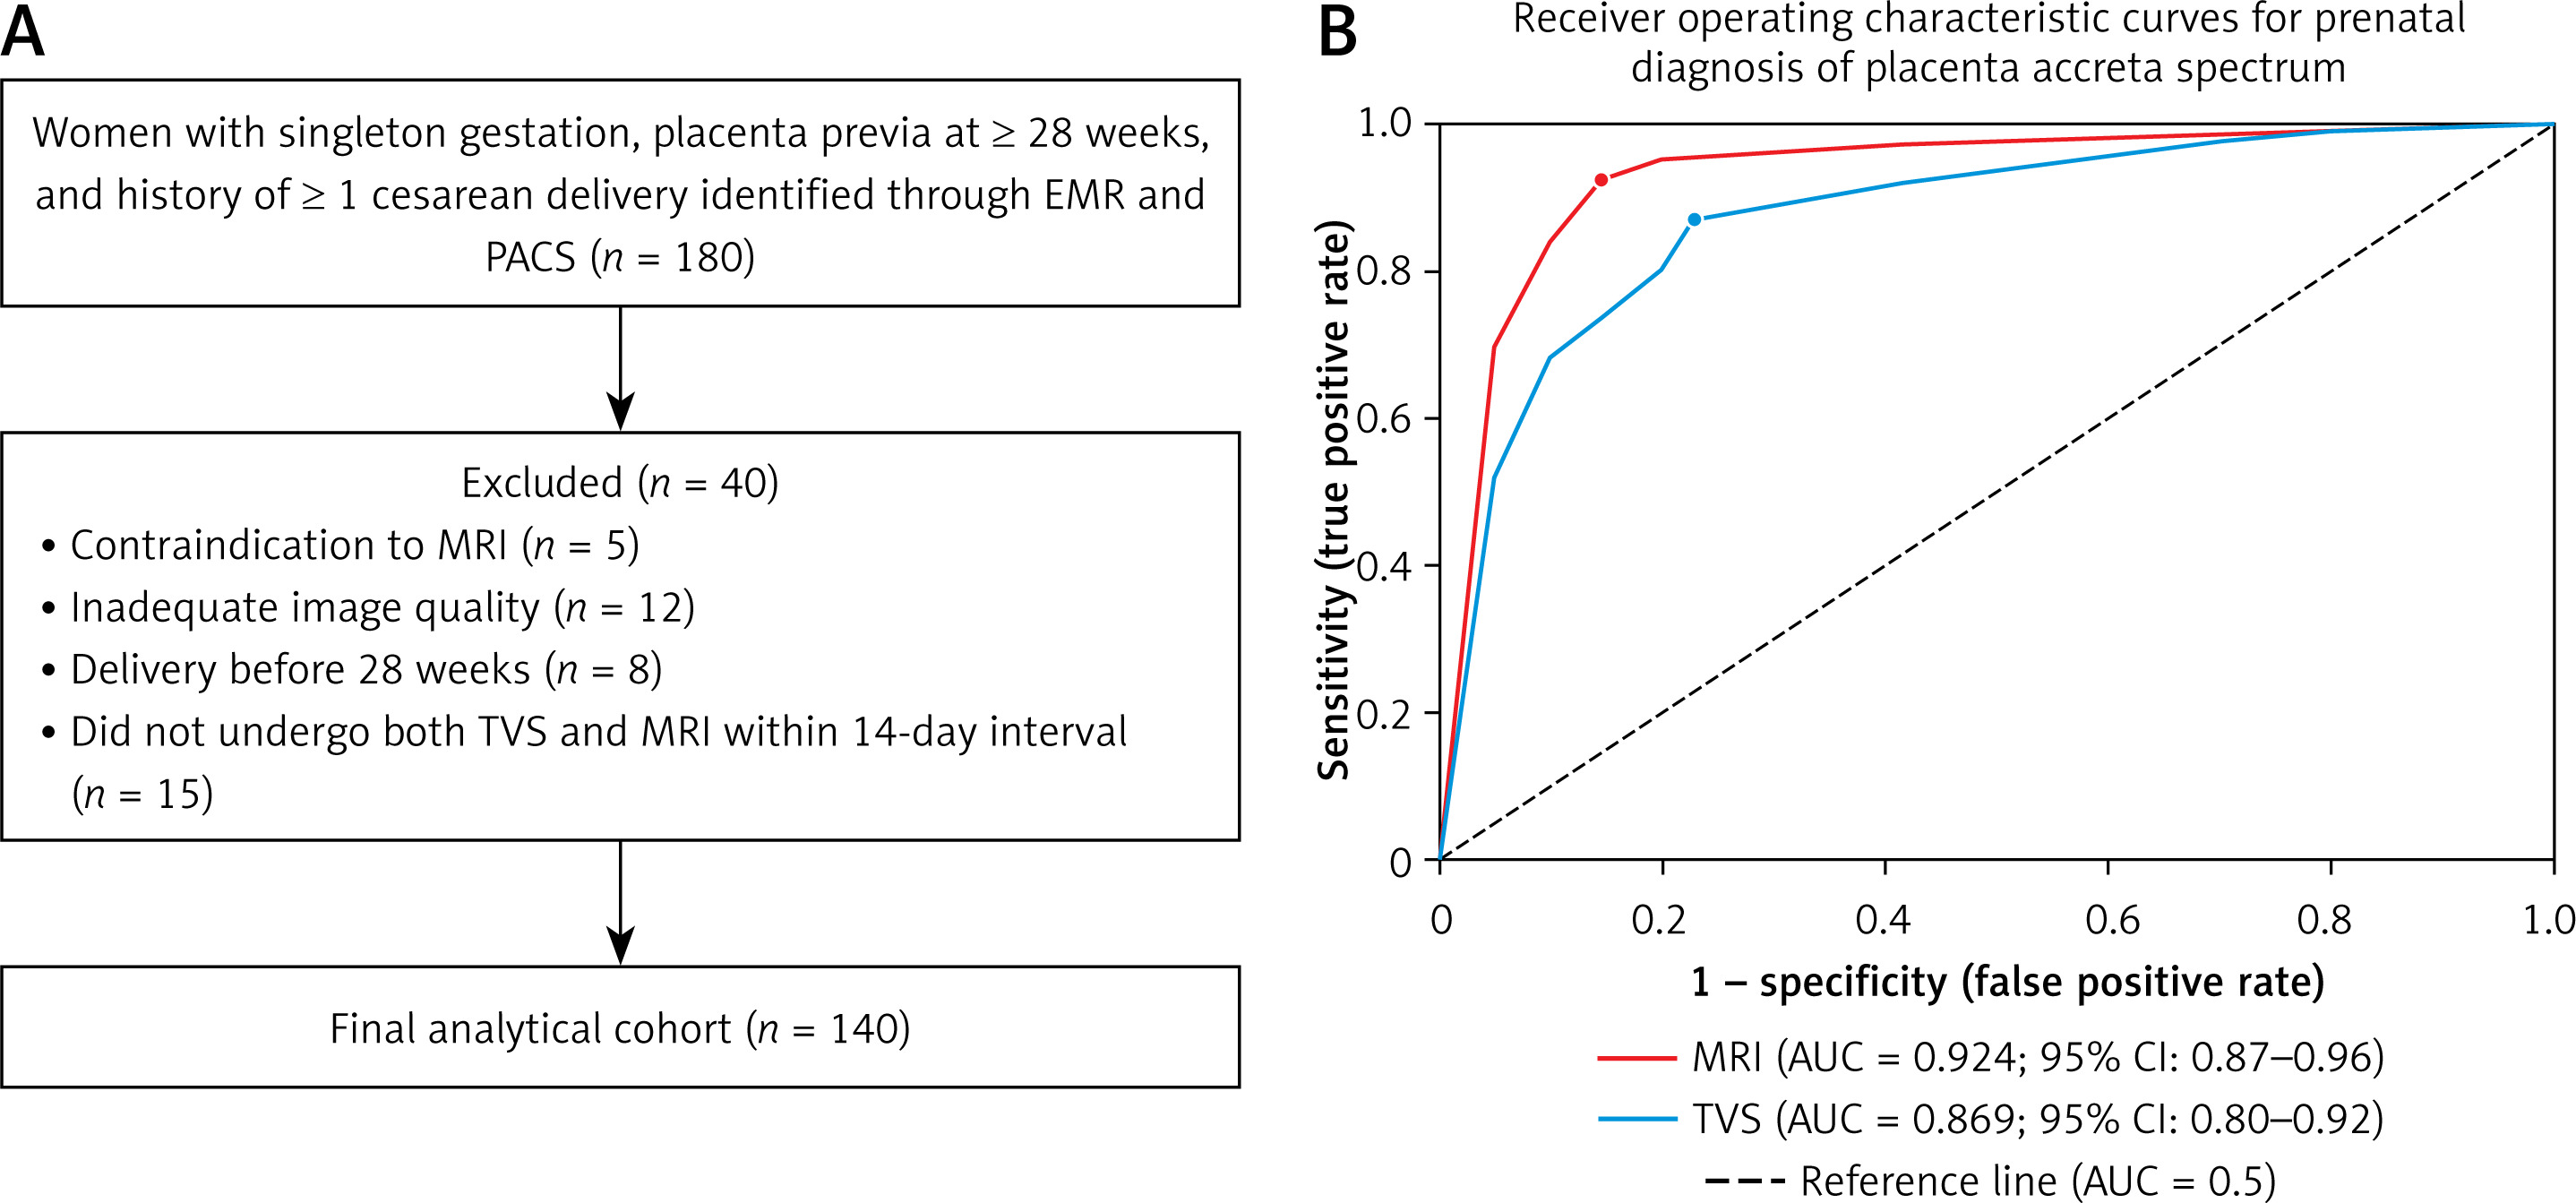
Of 180 screened individuals/cases, 40 were excluded, leaving 140 (92 PAS, 65.7%). Baseline characteristics and diagnostic performance are summarized in Table I. Both modalities showed high sensitivity (TVS 87.0% vs. MRI 92.4%; p = 0.125), but MRI had superior specificity (85.4% vs. 77.1%; p = 0.046) and accuracy (90.0% vs. 83.6%; p = 0.045). AUC was significantly higher for MRI (0.924 vs. 0.869; p = 0.038). PPV was high for both (≥ 88%); NPV favored MRI (85.4% vs. 75.5%). For PAS severity, MRI sensitivity was higher for increta (93.3% vs. 88.9%) and percreta (100% vs. 94.4%), with comparable performance for accreta (82.8% vs. 79.3%). TVS had more false-positives (11 vs. 7), mostly low-grade accreta. Baseline demographic and clinical characteristics of the study cohort are summarized in Table I. Interobserver agreement was substantial for both TVS (κ = 0.74, 95% CI: 0.65–0.83) and MRI (κ = 0.81, 95% CI: 0.73–0.89). The diagnostic performance metrics for TVS and MRI are summarized in Table I, and the receiver operating characteristic (ROC) curves are displayed in Figure 1.
Table I
Baseline characteristics and diagnostic performance of TVS and MRI for PAS detection
| Project | |||
|---|---|---|---|
| Baseline characteristic | Value | ||
| Maternal age [years] (mean ± SD) | 33.4 ±4.9 | ||
| Gestational age at delivery [weeks] (median, range) | 35.0 (30–38) | ||
| Prior cesarean deliveries, n (median, range) | 2 (1–4) | ||
| Placental location, n (%) | |||
| Anterior | 89 (63.6) | ||
| Posterior | 37 (26.4) | ||
| Other (fundal/lateral) | 14 (10.0) | ||
| PAS confirmed, n (%) | 92 (65.7) | ||
| FIGO grade among PAS cases, n (%) | |||
| Accreta (Grade 1) | 29 (31.5) | ||
| Increta (Grade 2) | 45 (48.9) | ||
| Percreta (Grade 3) | 18 (19.6) | ||
| Management, n (%) | |||
| Cesarean hysterectomy | 55 (39.3 | ||
| Focal myometrial resection | 37 (26.4 | ||
| Other (e.g., uterine conservation without resection) | 48 (34.3) | ||
| Diagnostic efficacy | |||
| Sensitivity, % (n/N) | TVS n = 140 | MRI n = 140 | P-value |
| Specificity, % (n/N) | 87.0 (80/92) | 92.4 (85/92) | 0.125* |
| Positive predictive value (PPV), % | 77.1 (37/48) | 85.4 (41/48) | 0.046* |
| Negative predictive value (NPV), % | 87.9 | 92.4 | NA |
| Accuracy, % | 75.5 | 85.4 | NA |
| Area under the ROC curve (AUC) | 83.6 | 90.0 | 0.045** |
| Subgroup sensitivity | |||
| PAS grade | n | TVS Sensitivity, % (n/N) | MRI Sensitivity, % (n/N) |
| Accreta (Grade 1) | 29 | 79.3 (23/29) | 82.8 (24/29) |
| Increta (Grade 2) | 45 | 88.9 (40/45) | 93.3 (42/45) |
| Percreta (Grade 3) | 18 | 94.4 (17/18) | 100 (18/18) |
Figure 1
A – Study flow diagram for patient selection. Numbers of patients screened, excluded with reasons, and ultimately included in the final analytical cohort are shown. B – Receiver operating characteristic (ROC) curves for transvaginal ultrasound (TVS) and magnetic resonance imaging (MRI) in the prenatal detection of placenta accreta spectrum. The area under the curve (AUC) for MRI was 0.924 (95% CI: 0.87–0.96), significantly greater than that for TVS, 0.869 (95% CI: 0.80–0.92; p = 0.038, DeLong test). The diagonal reference line indicates an AUC of 0.5
MRI’s superior specificity and AUC align with prior meta-analyses, suggesting added value beyond TVS. However, limitations apply. First, requiring both examinations may have enriched complex cases, potentially exaggerating MRI’s relative advantage. Second, absence of histopathology in conservatively managed cases may introduce misclassification, though sensitivity analysis on confirmed cases upheld MRI’s specificity advantage. Third, static image review may underestimate TVS performance. Fourth, single-center design with experienced operators limits generalizability.
Clinically, we propose a two-step strategy: TVS for all, with MRI reserved for equivocal cases (1–2 signs or technical limitations), posterior placenta, or high suspicion of severe invasion. In our exploratory analysis of 43 equivocal TVS cases, MRI achieved 89.1% sensitivity and 92.1% specificity, versus TVS 76.1% and 71.4%, supporting this approach.
MRI offers superior diagnostic performance over TVS for PAS in scarred uteri, primarily through higher specificity. A two-step strategy – TVS screening with selective MRI for equivocal cases – may reduce overdiagnosis. Prospective multicenter validation is needed given the retrospective, single-center design.

