Introduction
Coronary artery disease (CAD) is a major cause of death worldwide [1]. Stent placement following percutaneous coronary intervention (PCI) is a typical treatment for chronic heart disease (CHD), while in-stent restenosis (ISR) after PCI is a major clinical problem occurring in these patients [2, 3]. The use of drug-eluting stents (DES) and drugs such as statins, antiplatelet agents, and calcium channel blockers has only been partially effective in reducing ISR in patients who have undergone stent implantation [2–4]. Since the number of such patients continues to increase, it is crucially important to distinguish patients who are at elevated risk of ISR. Furthermore, recognition of markers of ISR could be helpful for choosing a proper strategy in order to treat each patient [2].
Complex pathophysiological mechanisms including lipid deposition, dysfunction of endothelial, chronic vascular inflammation, and vascular smooth muscle cell proliferation causing intimal hyperplasia are involved in the progression of restenosis [5, 6]. The inverse association between the risk of restenosis following vascular intervention and high-density lipoprotein cholesterol (HDL-C) concentration, a pivotal cardiovascular disease (CVD) risk factor, has been reported [6, 7]. However, recent studies have indicated that HDL-C concentration alone is insufficient to correctly assess the risk of CVD [8–10]. Considering the complexity of HDL particles, alterations of their composition and function have been suggested to be more informative than HDL-C levels [11–13]. The principal anti-atherosclerotic effect of HDL is thought to be related to cellular cholesterol efflux through which accumulated cholesterol is transported to HDL or its major protein component, apolipoprotein (apo) A-I, from macrophages and arterial wall cells in an early step of reverse cholesterol transport (RCT) [6]. In addition, HDL, by virtue of cholesterol acquirement from atherogenic triglyceride-rich lipoprotein (TGRL) remnants upon their lipolysis, is involved in reverse remnant-cholesterol transport (RRT) and thereby linked to TG metabolism [10, 14].
There are limited data regarding the contribution of compositional changes and impaired function of HDL (such as its role in RCT and RRT pathways) in coronary ISR, and to our knowledge, the relationship between alterations of HDL composition and function with ISR has not previously been assessed in a case-control study. Therefore, this study was undertaken to explore the compositional characteristics of HDL as well as the capacity of HDL to efflux cholesterol from lipid-loaded macrophages and to take up free cholesterol (FC) upon lipolysis of TGRL in patients with ISR.
Material and methods
Study populations
This is a case-control study (December 2014 and April 2017), and 47 Iranian subjects (18–75 years old) were included with a history of coronary stent implantation at least 30 days earlier and thereafter due to chest pain or equivalent symptoms they were referred for re-angiography. According to the angiographic results, patients with more and less than 50% stenosis within the stent were divided into the in-stent restenosis (ISR; N = 21) and non-ISR (NISR; N = 26) groups, respectively. Furthermore, angiography-negative patients (N = 16), whose first angiographic results showed stenosis < 50%, and healthy subjects (N = 18) were considered as controls. The Ethics Committee of the Mashhad University of Medical Sciences gave approval of the study protocol and all participants provided written informed consent. Demographic data were collected from medical records. The exclusion criteria were positive troponin, autoimmune disease, restenosis occurring within one month after angioplasty due to thrombosis, chronic kidney disease or thrombophilia, and active cancer. A blood sample was collected in a tube with no anticoagulant just before starting the angiographic procedure. Serum was separated following centrifugation at a relative centrifugal force of 1000 (recommended by the manufacturer) for 20 min and then stored at –80°C prior to analysis.
Reagents
Phosphate-buffered saline (PBS, 10X, including KCl (10 g), KH2PO4 (10 g), Na2HPO4 × 2 H2O (71.7 g), NaCl (400 g) (VWR, France); TopFluor cholesterol (TopF) (Avanti Polar Lipids, USA); lipoprotein lipase (LPL) from Pseudomonas sp. (Sigma, France), phosphotungstic acid (Merck, VWR) , MgCl2 (VWR, France), deionized water, potassium bromide (KBr; 99+%, ACS reagent, Thermo Fisher Scientific, USA), D-(+)-Glucose (Sigma, France), bovine serum albumin (BSA; Merck, USA), ([1,2-3H(N)] (3H-cholesterol) (PerkinElmer, USA), RPMI 1640 (Sigma, France), PBS (Sigma. France), fetal bovine serum (FBS; Sigma. France), phorbol 12-myristate 13-acetate (PMA; Sigma, France).
Fasting blood glucose (FBG), triglycerides (TG), total cholesterol (TC), and HDL-C were analyzed by Pars Azmoon kits (Iran) on a BT-3000 auto-analyzer (Italy). Low-density lipoprotein cholesterol (LDL-C) was calculated using the Friedewald formula. TC, phospholipid (PL), FC, and TG were measured in HDL subfractions by microplate reader (DYNEX Technologies, USA).
Preparation of density solutions
For isolation and subfractionation of HDL density solutions (d: 1.006, 1.21, and 1.24 g/ml) were prepared. At first, a solution (A; d 1.006 g/ml) containing 8.76 g of NaCl in 1 l of water and a solution of NaCl/KBr (B; d 1.357 g/ml) containing 354 g KBr and 153 g of NaCl in 1 l of water were prepared, then, from these two, solutions of a desired density were prepared, according to the formula: dX = ((VA × dA) + (VB × dB))/(VA+ VB), where dX = desired density, dA = density of solution A, dB = density of solution B, VA = volume of solution A, VB = volume of solution B.
The densities of solutions were checked by measuring with a Digital Density Meter (DMA 45; Mettler/Paar, Austria) at 15°C [10, 15].
Isolation of HDL subfractions
Two subfractions of HDL (HDL2 (d: 1.063–1.125 g/ml) and HDL3 (d: 1.125–1.210 g/ml)) were isolated by sequential ultracentrifugation from 800 μl of serum [10, 16]. Separation was achieved after a three-step ultracentrifugation using a TLA120 rotor at 120,000 rpm in an Optima MAX-TL ultracentrifuge (Beckman Coulter, USA) at 15°C, with two NaCl/KBr solutions (d: 1.21 g/ml and 1.24 g/ml). First, by adjusting the serum density to 1.063 g/ml with 260 μl of a d = 1.24 g/ml solution, very low-density lipoproteins (VLDL), intermediate density lipoproteins (IDL) and LDL were separated after 3 h. Then, the density of the bottom fraction containing HDL was adjusted to 1.125 g/ml with 270 μl of a d: 1.24 g/ml solution, and HDL2 was collected from the top after 4 h ultracentrifugation. In the final step, by adjusting the bottom density to 1.21 g/ml with 240 μl of the d: 1.24 g/ml and 200 μl of d: 1.21 g/ml solutions, HDL3 was collected from the top after 5 h ultracentrifugation.
Thereafter, HDL subfractions (HDL2 and HDL3) were largely dialyzed in PBS 1X (pH: 7.4) using SERVAPOR dialysis tubing (MWCO 12000–14000 RC, 6 mm, Germany) in the dark at 4°C.
Compositional analysis of HDL subfractions
HDL2 and HDL3 subfractions were assessed for the quantity of main HDL lipid ingredients, such as PL, TC, TG, and FC, via commercially enzymatic colorimetric kits (Diasys, France). Cholesteryl ester (CE) content was computed by multiplying the difference between TC and FC by 1.67 (15). Total protein (TP) was quantified in subfractions of HDL via the bicinchoninic acid (BCA) assay. Total lipoprotein mass was calculated as the sum of PL, TG, FC, CE, and TP.
Cholesterol efflux assay
The capacity of HDL subfractions in cellular cholesterol efflux (CEC) was evaluated in a human THP-1 monocytic cell system (ATCC) at 30 μg HDL protein/ml according to the Rached et al. protocol [17]. Briefly, cells were cultured on 24-well plates (Perkin Elmer, USA) in RPMI 1640 media with FBS (10%) and 50 ng/ml of PMA for differentiation of monocytes to macrophage-like cells. After 48 h of incubation, the cells were loaded with [3H] cholesterol-labeled acetylated LDL (1 μCi/ml) in RGGB media containing serum-free RPMI 1640, 2 mM glutamine, 50 mM glucose, 0.2% BSA, and 100 μg/ml antibiotic for 24 h for equilibration of cell cholesterol pools. The efflux of cellular cholesterol to subfractions of HDL was evaluated after 4 h incubation of cells in serum-free media. Finally, the CEC% was computed through the following calculation: CEC% = (Medium cpm/(medium cpm + cell cpm)) × 100.
Specific CEC% was characterized by subtracting nonspecific CEC% that occurs in the cells without cholesterol acceptors.
ApoB precipitation
Phosphotungstic acid/MgCl2 precipitation was used to remove apoB-containing lipoproteins from fasted serum for the cholesterol transfer assay. Phosphotungstic acid/MgCl2 (pH: 6.2; 5 μl) was added to serum samples (50 μl) at a ratio of 1 : 10 by volume, incubated for 10 min at room temperature (RT) and centrifuged at 13,000 rpm at 4°C for 30 min (5415 R, Eppendorf, USA) (10).
TopF transfer to HDL
For the evaluation of HDL capacity to take up FC through LPL-mediated TGRL lipolysis, TGRLs (d < 1.019 g/ml) were obtained from a reference healthy normolipidemic subject with a single-step ultracentrifugation (40,000 rpm, 24 h, 15°C) and dialyzed against PBS (pH: 7.4) using a SERVAPOR dialysis tube (MWCO 12000-14000 RC, 29 mm, Germany) at 4°C in the dark, and labelled with TopFluor cholesterol (TopF). For labelling, lipoprotein-deficient plasma (LPDP) was added to the TGRL at a 1/100 ratio (LPDP/TGRL) by volume and thereafter was filtered using a 0.8 μm filter and a chloroformic solution of TopF was added at a TopF/TGRL PL ratio of 1/13 by mass; the mixture was incubated overnight at 37°C under gentle stirring. Then unbound fluorescent lipid was separated from labelled TGRL by filtration through a PD-10 Sephadex column (GE Healthcare, Sephadex G-25M, USA). Purified labelled TGRL was assessed for TG concentration by photometry, and, to verify the labelling, TopF fluorescence was recorded at 500/525 nm (Ex/Em) using a microplate reader (Gemini, Molecular Devices, USA). To evaluate the TopF transfer, 30 mg TG/dl of TopF-labelled TGRL, Tris buffer (0.4 M) (pH: 8), final dilution of HDL (as apoB-depleted serum) 30-fold v/v, and LPL (7600 U/l) was mixed on ice and in order to start lipolysis incubated at 37°C. After 2 h, the reaction mixture was placed on ice and an apoB precipitant reagent (phosphotungstic acid/MgCl2) was added and the mixture incubated for 10 min at RT, followed by centrifugation at 4°C for 10 min at a maximal speed (5415 R, Eppendorf). At the end, the extracted supernatant containing HDL was filtered (0.45 μm) and transferred to a black microplate (Corning, USA) to read the fluorescence. The fluorescence measured in HDL was represented as a percentage of fluorescence in the standard sample containing TGRL (30 mg TG/dl), Tris buffer, and PBS alone.
In addition, all values were normalized to that detected in the reference serum obtained from the healthy normolipidemic control subjects [10].
Statistical analysis
For statistical analysis, SPSS software, version 11.5 (Chicago, IL, USA) was used. P-values less than 0.05 were considered statistically significant. Normal distributed variables are shown as mean ± SE and differences in variables were evaluated by one-way analysis of variance (ANOVA) tests across 4 groups (healthy, angiography-negative, NISR and ISR) or a t-test for independent samples between 2 groups (ISR and NISR). Categorical variables are presented as percentages and between-group differences in variables were evaluated by a χ2 analysis or Fisher’s exact test.
The association of CEC with HDL composition was evaluated using Pearson’s correlation coefficients. Binary logistic regression was used to estimate the association between CEC and TopF transfer to HDL with ISR after adjustment for age, sex, DM, dyslipidemia, hypertension (HTN), stent type, hs-CRP, use of statins, aspirin and clopidogrel.
Results
Baseline characteristics and patient disposition
Of the total of 81 unrelated Iranian participants, 21, 26, 16, and 18 were categorized into ISR, NISR, angiography-negative, and healthy groups, respectively (Table I). The healthy group included younger subjects than the ISR and NISR groups. The number of diabetic, dyslipidemic, and hypertensive patients revealed significant differences between the groups. Moreover, the groups were significantly different in terms of medications used such as diabetic drugs, statin, aspirin and clopidogrel. In addition, TC, HDL-C, and LDL-C were significantly higher in healthy subjects than in other groups. TG concentration was higher in the ISR group than in the angiography-negative group. Furthermore, FBS level was higher in the ISR group compared with the healthy and angiography-negative groups (Table I). Finally, the percentage of patients who had DES was significantly greater in the NISR group in comparison with the ISR group (Table II).
Table I
Baseline characteristics of study groups
| Variables | ISR (n = 21) | NISR (n = 26) | Angiography-negative (n = 16) | Healthy (n = 18) | P-value |
|---|---|---|---|---|---|
| Sex %: | |||||
| Male | 52.4 | 50.0 | 31.3 | 50.0 | 0.573 |
| Female | 47.6 | 50.0 | 68.8 | 50.0 | |
| Age [years] | 59.5 ±2.6 | 60.4 ±2.1 | 54.1 ±2.8 | 48.5 ±2.1a,b | 0.003* |
| Height [cm] | 161.5 ±2.6 | 162.8 ±2.0 | 158.3 ±2.2 | 168.1 ±2.2c | 0.037* |
| Weight [kg] | 69.9 ±2.8 | 73.2 ±3.5 | 66.7 ±3.1 | 74.6 ±2.7 | 0.341 |
| BMI [kg/m2] | 27.0 ±0.9 | 27.5 ±1.0 | 26.8 ±1.0 | 26.5 ±0.9 | 0.891 |
| BMI %: | |||||
| Normal | 33.3 | 32.0 | 37.5 | 38.9 | 0.999 |
| Overweight | 38.9 | 44.0 | 37.5 | 38.9 | |
| Obese | 27.8 | 24.0 | 25.0 | 22.2 | |
| Smoker % | 5.9 | 23.1 | 14.3 | 22.2 | 0.489 |
| Dyslipidemia % | 71.4 | 46.2 | 37.5 | 0.0 | < 0.001* |
| DM % | 61.9 | 46.2 | 12.5 | 0.0 | < 0.001* |
| HTN % | 71.4 | 65.4 | 50.0 | 0.0 | < 0.001* |
| Drug consumption %: | |||||
| Statin | 100.0 | 88.0 | 56.3 | 0.0 | < 0.001* |
| Aspirin | 90.5 | 84.0 | 68.8 | 11.1 | < 0.001* |
| Clopidogrel | 68.4 | 92.0 | 12.5 | 0.0 | < 0.001* |
| Insulin | 19.0 | 19.2 | 0.0 | 0 | 0.001* |
| Oral diabetic drugs | 38.1 | 19.2 | 12.5 | 0 | |
| FBS [mg/dl] | 155.6 ±16.9 | 138.9 ±15.7 | 98.2 ±9.1a | 90.4 ±2.0a | 0.003* |
| TC [mg/dl] | 145.6 ±7.9 | 124.4 ±8.7 | 140.2 ±6.9 | 190.7 ±7.2a,b,c | < 0.001* |
| TG [mg/dl] | 144.8 ±21.2 | 97.3 ±11.8 | 86.2 ±8.6a | 117.8 ±13.5 | 0.042* |
| HDL-C [mg/dl] | 36.6 ±1.6 | 34.1 ±2.2 | 38.3 ±3.1 | 51.1 ±3.0a,b,c | < 0.001* |
| LDL-C [mg/dl] | 81.7 ±6.7 | 70.8 ±6.4 | 84.7 ±5.9 | 116.0 ±4.8a,b,c | < 0.001* |
| SBP [mm Hg] | 125.7 ±3.6 | 121.8 ±2.9 | 117.3 ±3.6 | 114.4 ±3.6 | 0.111 |
| DBP [mm Hg] | 78.1 ±2.4 | 74.8 ±1.6 | 73.3 ±2.7 | 75.7 ±2.1 | 0.482 |
| HDL2: | |||||
| PL/TP | 0.70 ±0.03 | 0.73 ±0.03 | 0.70 ±0.03 | 0.60 ±0.02a,b | 0.004* |
| TC/TP | 0.30 ±0.02 | 0.40 ±0.02 | 0.40 ±0.02 | 0.40 ±0.01a | 0.011* |
| Total mass | 95.6 ±7.2 | 91.8 ±6.3 | 101.4 ±4.8 | 96.6 ±7.2 | 0.794 |
| HDL3: | |||||
| PL/TP | 0.50 ±0.03 | 0.50 ±0.02 | 0.50 ±0.03 | 0.43 ±0.02 | 0.084 |
| TC/TP | 0.20 ±0.01 | 0.30 ±0.01 | 0.30 ±0.02 | 0.30 ±0.02 | 0.325 |
| Total mass | 43.3 ±2.9 | 46.0 ±2.9 | 48.6 ±3.8 | 45.3 ±3.3 | 0.731 |
| HDL2/HDL3 | 2.4 ±0.3 | 2.1 ±0.2 | 2.2 ±0.2 | 2.3 ±0.2 | 0.731 |
Table II
Clinical characteristics of ISR and NISR groups
| Variables | ISR (n = 21) | NISR (n = 26) | P-value |
|---|---|---|---|
| Stent type %: | |||
| Bare | 50.0 | 11.1 | 0.015* |
| Drug | 50.0 | 88.9 | |
| Stent number %: | |||
| 1 | 66.7 | 65.4 | 0.927 |
| > 1 | 33.3 | 34.6 | |
| De novo stenosis % | 57.1 | 60.9 | 0.802 |
| Duration of stent implantation [months] | 32.8 ±5.9 | 22.4 ±5.4 | 0.200 |
| Ejection fraction (%) | 46.2± 2.9 | 45.2 ±2.5 | 0.806 |
| Serum apoA-I [mg/dl] | 125.3 ±3.9 | 108.4 ±7.2 | 0.057 |
| hs-CRP [mg/l] | 3.90 ±0.80 | 4.62 ±0.80 | 0.509 |
| HDL2 CEC/apoA-I | 0.030 ±0.01 | 0.044 ±0.01 | 0.054 |
| HDL3 CEC/apoA-I | 0.04 ±0.01 | 0.05 ±0.01 | 0.058 |
| TopF transfer/apoA-I | 0.80 ±0.03 | 0.93 ±0.10 | 0.136 |
Compositional characterization of HDL subfractions
There were no differences in the content of FC and TP, either in HDL2 or in HDL3, among the studied groups. However, the HDL2 subfraction revealed TG enrichment in healthy subjects compared to NISR and angiography-negative patients, while its PL content was lower in the healthy group compared to ISR, NISR and angiography-negative patients. Moreover, high CE content was observed in HDL2 of healthy subjects when compared to the ISR and NISR groups (Figure 1). In addition, TG enrichment was also observed in HDL3 of healthy individuals when compared to NISR and angiography-negative patients, and the PL content of the HDL3 subfraction was statistically significantly lower in the healthy group compared to the NISR group (Figure 1).
Figure 1
Comparison of % lipid and protein content of HDL subtractions between the groups: A – HDL2 composition, B – HDL3 composition; ap < 0.05 vs. ISR; bp < 0.05 vs. NISR; cp < 0.05 vs. angiography-negative group
The PL/TP ratio in HDL2 was significantly lower in healthy subjects relative to the ISR and NISR groups, while the TC/TP ratio in HDL2 was significantly higher in healthy subjects relative to the ISR group (Table I).
Cellular cholesterol efflux to HDL subfractions
There were no differences in the capacity of HDL2 and HDL3 subfractions to efflux cellular cholesterol from lipid-loaded macrophages between the studied groups (Table III). However, when CEC was normalized to HDL-C levels, significantly higher CEC/HDL-C ratios were found for both HDL2 and HDL3 in the NISR group in comparison with healthy subjects. Moreover, significantly higher HDL2 CEC/HDL-C ratios were found in the ISR and angiography-negative groups in comparison with healthy subjects (Table III). In addition, subgroup analysis revealed that subjects with diabetes in the ISR group displayed a lower HDL2 CEC/HDL-C ratio compared to those in the NISR group (Figure 2 C). Moreover, individuals with age above 50 had a higher CEC/HDL-C ratio of HDL2 and HDL3 in the NISR group when compared with that in the healthy group (Figure 2 C).
Table III
Comparison of CEC and TopF transfer to HDL between groups of study
| Variables | ISR (n = 21) | NISR (n = 26) | Angiography-negative (n = 16) | Healthy (n = 18) | P-value |
|---|---|---|---|---|---|
| HDL2 CEC (%) | 3.6 ±0.3 | 4.5 ±0.4 | 3.7 ±0.4 | 3.4 ±0.2 | 0.137 |
| HDL3 CEC (%) | 4.8 ±0.4 | 5.2 ±0.4 | 4.9 ±0.3 | 4.3 ±0.2 | 0.213 |
| TopF transfer to HDL (%) | 98.6 ±3.4 | 99.6 ±6.5 | 90.4 ±3.8 | 93.9 ±4.6 | 0.548 |
| HDL2 CEC/HDL-C | 0.10 ±0.01 | 0.13 ±0.01 | 0.10 ±0.01 | 0.10 ±0.01b | 0.002* |
| HDL3 CEC/HDL-C | 0.14 ±0.01 | 0.20 ±0.02 | 0.14 ±0.01 | 0.10 ±0.01a,b,c | < 0.001* |
| TopF transfer/HDL-C | 2.8 ±0.12 | 3.1 ±0.34 | 2.6 ±0.2 | 1.9 ±0.11a,b | 0.003* |
Figure 2
Comparison of CEC (A), TopF transfer (B), CEC to HDL-C ratio (C), and TopF transfer to HDL-C ratio (D) between study subgroups with diabetes, hypertension, dyslipidemia, and age > 50 years as cardiovascular risk factors. *P < 0.05 vs. ISR; **p < 0.05 vs. NISR
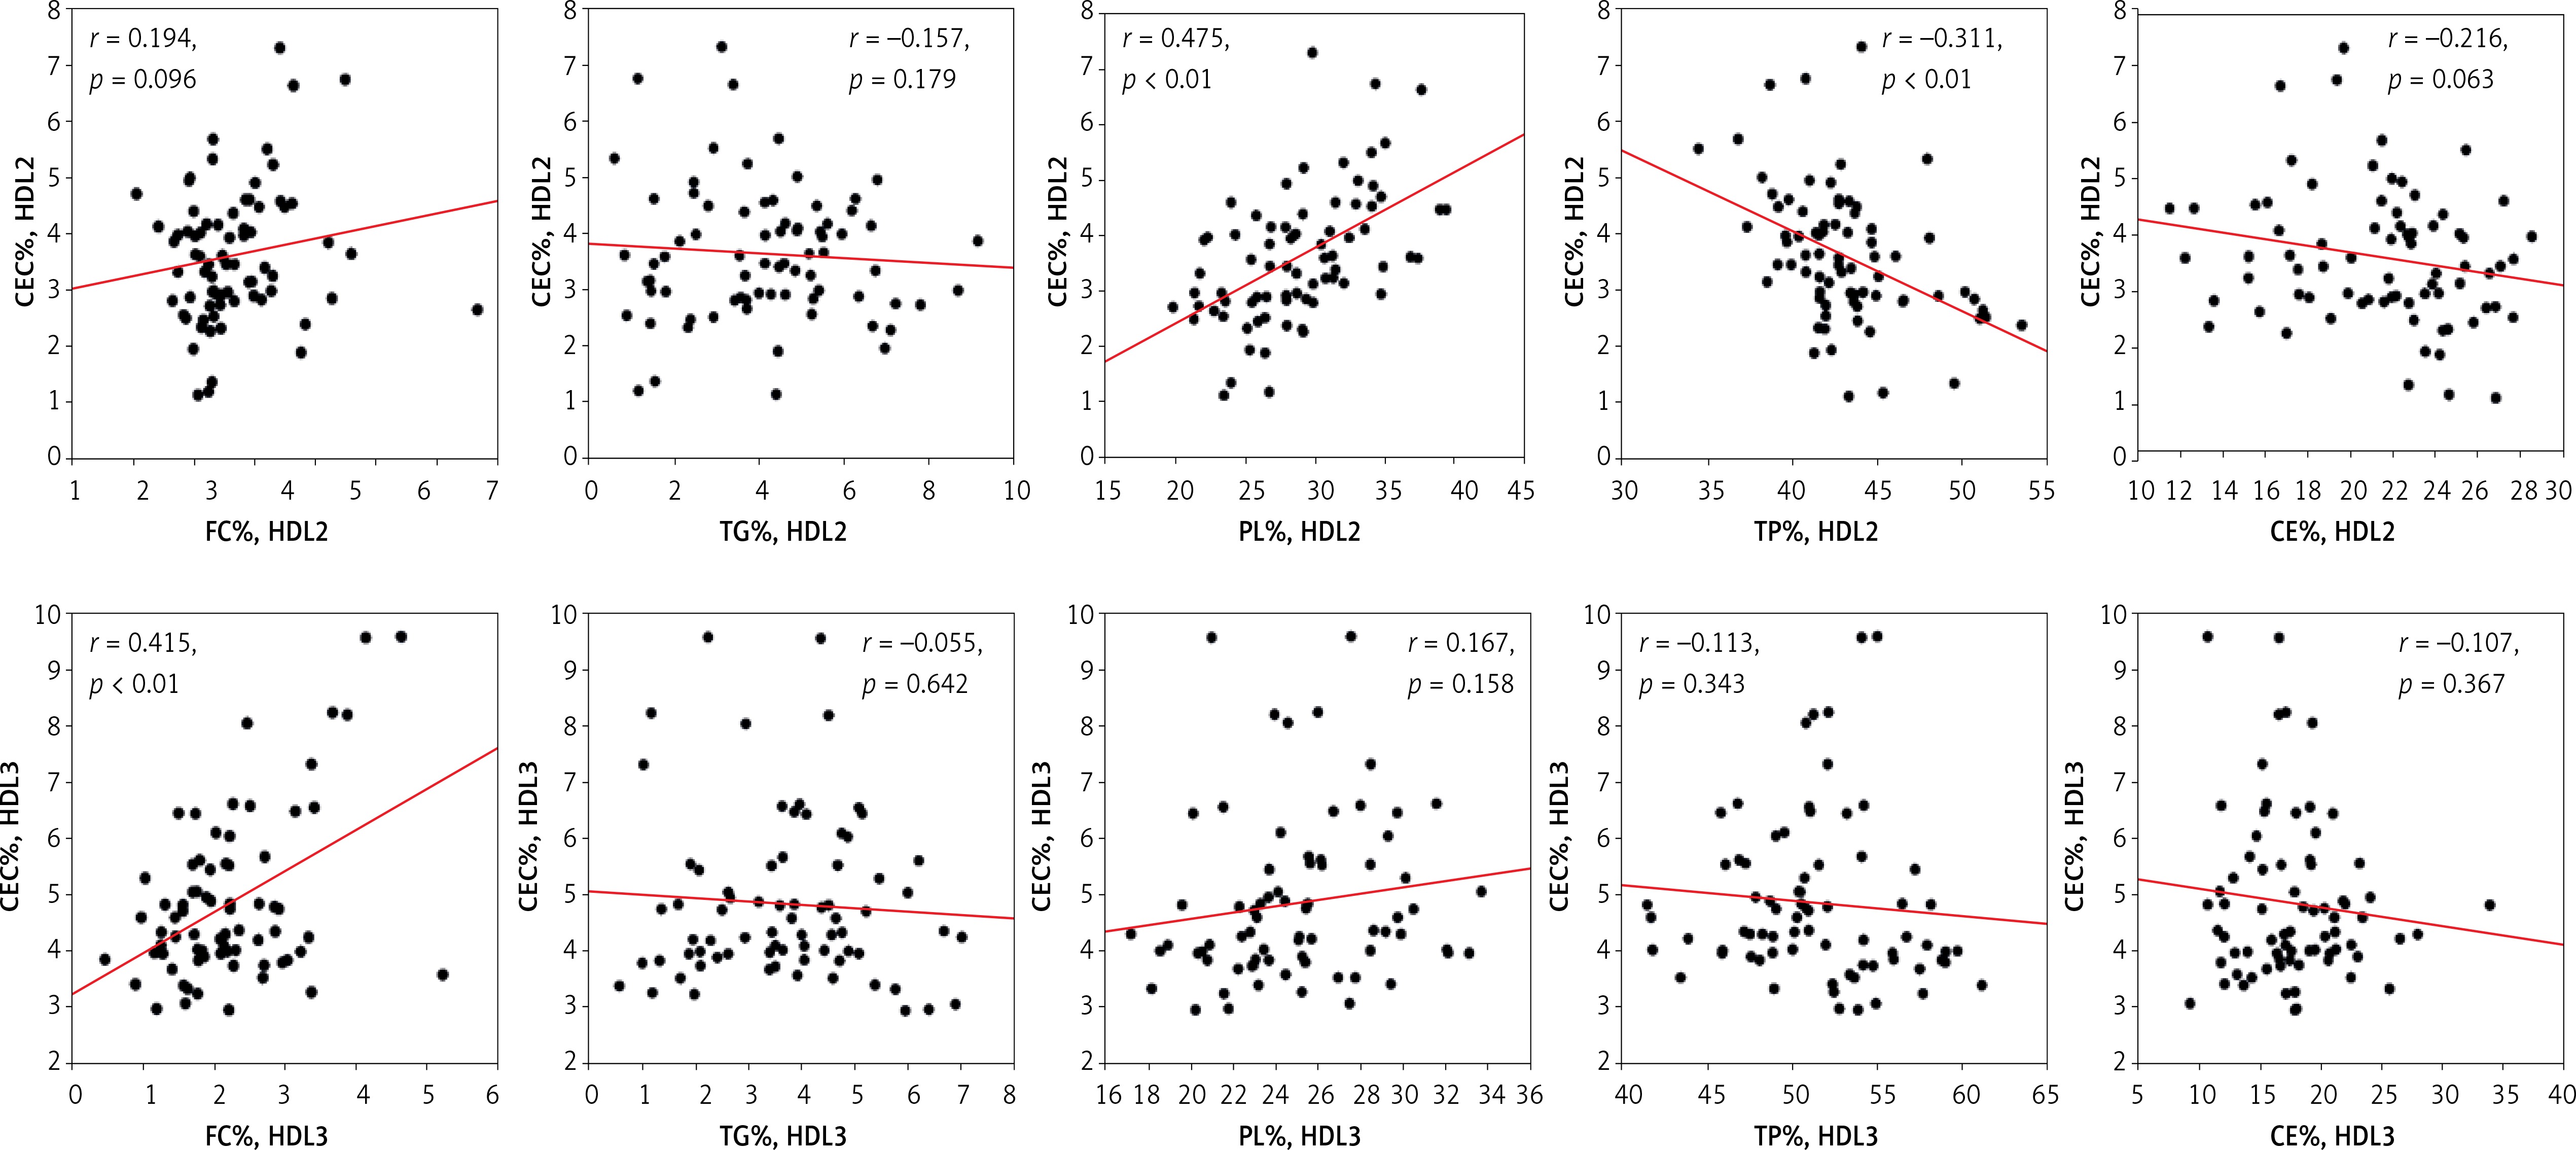
Furthermore, significant positive correlations were detected between CEC of HDL2 and its PL content in the healthy (r = 0.50), angiography-negative (r = 0.55) and ISR (r = 0.52) groups (Figure 3) as well as in the whole study population (r = 0.48; Figure 4). Similarly, HDL2 CEC was correlated with its FC content in the NISR group (r = 0.5; Figure 3). A significant positive correlation of HDL3 CEC with its FC content was also observed in the ISR (r = 0.63) and NISR (r = 0.627) groups (Figure 3) as well as in the whole study population (r = 0.42; Figure 4). Similarly, HDL3 CEC was correlated with its TG content in the angiography-negative group (r = 0.52; Figure 3). In addition, TP content of HDL2 and FC content of HDL3 showed negative and positive correlations with CEC, respectively, in the whole study population (Figure 4).
Figure 3
Correlations between CEC of HDL subfractions and composition of HDL2 and HDL3 in ISR (A), NISR (B), angiography-negative (C) and healthy groups (D)
Figure 4
Correlations between CEC of HDL subfractions and composition of HDL2 and HDL3 in the whole study population
The results of binary logistic regression also failed to show any association of HDL2 and HDL3 CEC with the risk of ISR in this study (Table IV).
Table IV
Binary logistic regression for CEC and TopF transfer to HDL in relation with ISR (Ref: NISR)
| Variables | Unadjusted | Adjusted# | ||
|---|---|---|---|---|
| OR (95% CI) | P-value | OR (95% CI) | P-value | |
| HDL2 CEC (%) | 0.70 (0.43–1.13) | 0.138 | 0.268 (0.013–5.713) | 0.399 |
| HDL3 CEC (%) | 0.83 (0.60–1.30) | 0.372 | 0.567 (0.095–3.397) | 0.535 |
| TopF transfer to HDL (%) | 1.00 (0.97–1.03) | 0.894 | 1.094 (0.953–1.255) | 0.201 |
TopF transfer to HDL
No significant difference in the capacity of apoB-depleted serum to take up FC from TGRL upon LPL lipolysis was found among the studied groups. However, when TopF transfer to HDL was normalized to HDL-C levels, significantly higher TopF transfer/HDL-C ratios were observed in the ISR and NISR groups in comparison with healthy subjects (Table III). In addition, subgroup analysis revealed that diabetes, dyslipidemia, HTN, and age > 50 did not influence either TopF transfer to HDL or TopF transfer/HDL-C ratio in the studied groups (Figure 2).
The results of binary logistic regression failed to show any association of TopF transfer to HDL with the risk of ISR in this study (Table IV).
Discussion
HDL as a protein-lipid particle has been traditionally characterized by its cholesterol concentration (HDL-C). However, the inverse association between HDL-C and CV events has been questioned by the observation of a U-shaped association in large epidemiological studies [18–21]. Hence, the use of more precise indices of HDL composition and function has been proposed [22].
In this case-control study, the compositional and functional alterations of HDL in patients with ISR were investigated for the first time. The results illustrated that both patients with ISR and the NISR group displayed some compositional alterations of both HDL2 and HDL3, including lower CE and higher PL content in HDL2 as well as lower TG content in HDL3 in comparison to healthy subjects. Moreover, the NISR group showed lower TG content of HDL2 and higher PL content of HDL3 relative to healthy subjects. A strong positive correlation between HDL2, PL% and CEC was found in the studied groups. Nevertheless, despite the increased PL% of HDL2 in ISR and NISR patients, the capacity of HDL2 to efflux cellular cholesterol from lipid-loaded macrophages was not statistically significantly different between the studied groups. Although a strong inverse association of CEC with the risk of incident CVD was reported previously [23, 24], one study reported that in a cohort of generally healthy men, CEC ability to predict CHD may not be independent of HDL-C [25], and it was found that low HDL-C (< 40 mg/dl) was related to dysfunctional HDL particles [26]. Furthermore, in patients with very high HDL-C, transport of cholesterol through the RCT pathway is unlikely to be impaired [14]. Therefore, CEC was normalized with HDL-C level (CEC/HDL-C ratio) and it was observed that the HDL2, CEC/HDL-C and HDL3 CEC/HDL-C ratios were significantly greater in the NISR group in comparison with healthy subjects and there were significantly higher HDL2 CEC/HDL-C ratios in the ISR and angiography-negative groups in comparison with healthy subjects, which might reflect elevated levels of HDL-C in healthy subjects, or increased CEC in the ISR, NISR and angiography-negative groups. Li et al. also found an association between raised CEC and elevated CVD over follow-up (3 years) even after adjustment for multiple parameters, including HDL-C levels [27]. In prospective longitudinal studies in relatively healthy subjects, samples were provided prior to the CHD event and HDL values might be more functional than those obtained in cross-sectional studies, but lipid profile alterations and plaque development could influence CEC over time in longitudinal studies [25]. Hence, reverse causation can occur in cross-sectional studies. Indeed, a cross-sectional study illustrated an inverse association of HDL CEC with prevalent carotid intima-media thickness [9].
Diabetes, dyslipidemia, and hypertension are three major CVD risk factors. In this regard, subpopulation analysis revealed that individuals with diabetes in the ISR group featured a notably lower HDL2 CEC/HDL-C ratio compared to those in the NISR group. In addition, diminished HDL2 CEC/HDL-C and HDL3 CEC/HDL-C ratios were also found in healthy subjects aged over 50 relative to those in the NISR group. Posadas-Sánchez et al. reported that dyslipidemic subjects are characterized by decreased CEC in statin-treated male coronary patients [26]).
Although efflux of cholesterol from macrophages, a key step of RCT, is considered as a primary function of HDL, other functions may also play a part in cardioprotection [28]. The capacity of HDL to take up FC from TGRLs upon lipolysis in the RRT pathway is another function of HDL that was proposed to describe the U-shape relationship between HDL-C and CVD and to predict CVD better than HDL-C [10, 14]. In this study, the rate of transfer of FC to HDL from TGRLs upon lipolysis was not statistically significantly different among the studied groups. After normalization of TopF transfer to HDL-C levels, the TopF transfer/HDL-C ratio was significantly higher in both NISR and ISR groups in comparison with healthy subjects, probably reflecting the low HDL-C in the patients. FC-enriched HDL particles reportedly possess a reduced capacity to acquire FC upon lipolysis of TGRLs [10, 29]. In this study, no difference was found in the FC content of HDL subfractions across the studied groups, which is consistent with the lack of differences in TopF transfer to HDL in the study. Moreover, both cholesteryl ester transfer protein and lecithin-cholesterol acyltransferase play important roles in cholesterol accumulation in HDL upon lipolysis [10, 30]; their activities were however not evaluated in this study.
The results of binary logistic regression failed to show any association of HDL2 and HDL3 CEC, as well as TopF transfer to HDL, with the risk of ISR in this study even after adjustment for CVD risk factors including sex, age, diabetes, hypertension, dyslipidemia, hs-CRP, and use of statin, aspirin and clopidogrel as well as stent type, which showed significant differences between ISR and NISR groups (Table IV). Cahill et al. similarly found that CEC could not predict CHD risk even after adjustment for HDL-C [25].
This study showed for the first time that the assessment of HDL function in combination with HDL-C levels and other important cardiovascular risk factors including diabetes, hypertension, and dyslipidemia could not predict ISR risk after stenting. This observation might be due to the small sample size in our study. In addition, restenosis in more than one stent and de novo stenosis in other vessels were not considered in this study. Finally, while CEC is an important index of HDL functionality, it remains unclear whether other indices of HDL function are associated with ISR risk.
In conclusion, the current study revealed that despite compositional alterations in HDL, HDL capacity to efflux cellular cholesterol from lipid-loaded macrophages, as well as to take up FC from TGRLs upon lipolysis, could not predict ISR risk in patients who experienced stent implantation. Nevertheless, further confirmation of these findings in future large-scale studies is warranted.