Introduction
For patients with papillary thyroid cancer (PTC), cervical lymph node metastasis (LNM) is one of the most important prognostic factors and occurs in nearly 30–90% of cervical lymph nodes located around the thyroid gland in the neck [1–3]. Despite the fact that LNM does not increase the overall risk of mortality of PTC patients, it actually affects the possibility of local tumor recurrence [4–6]. The high rates of recurrence of PTC suggest that many patients have cervical lymph node metastasis before initial surgery. Moreover, if these metastases could be detected and removed promptly, both recurrence and morbidity could be reduced [7]. LNM could affect surgical treatment and patient management. It is vital that clinicians evaluate cervical LNM adequately and make treatment decisions regarding indications and extent of surgery, which are the most contested issues in clinical management. Clinically, apparent cervical LNM may be preoperatively detected by palpation or imaging studies, including ultrasonography (US), computed tomography (CT), magnetic resonance imaging (MRI), and positron emission tomography (PET) [8, 9].
In the past, detection of cervical lymph node metastasis was based primarily on palpation, which may not be accurate. The enlarged cervical lymph nodes may not be palpated when they are small or located behind the sternocleidomastoid muscles, carotid artery or jugular vein. Detection by imaging of LNM is much more accurate than by clinical palpation. US is one of the most common and widely used primary imaging modalities for preoperative evaluation of differentiated thyroid cancer [10]. US can be used to guide aspiration of thyroid nodules and detect suspicious lymph nodes, and sometimes it has been regarded as the gold standard and preferred method for thyroid cancer. The American Thyroid Association guidelines recommend preoperative US for lymph nodes in patients undergoing thyroidectomy after needle aspiration biopsies demonstrate malignancy [11]. It is a simple, fast and sensitive method, and high-resolution ultrasound can detect lymph nodes as small as 5 mm, and therefore can determine the extent of surgery [12–15]. US is a commonly recommended imaging method for evaluating LNM in patients with PTC [11], but it has some limitations, including operator dependency, subjectivity, and superficial examination areas. Compared with US, CT has proved to be an accurate modality in detecting LNM of head and neck squamous cancer [16, 17]. CT may play a role in depicting lymph nodes in occult areas and evaluating tumor extension to adjacent structures, which is limited in US. It could overcome the drawbacks of US, and show the location, extent and invasion of adjacent structures, which could be used to assess metastatic probability [18].
Though several studies have explored the features and diagnostic values of US and CT of LNM in PTC patients [19–21], only a few studies have been conducted to compare these methods for detecting cervical LNM, and their comparison results of diagnostic accuracy were different. The aim of the present study was to compare the diagnostic accuracy between US and CT in the initial evaluation of cervical LNM for patients with thyroid cancer.
Material and methods
Search strategy
Studies on the diagnostic accuracy of US and CT were searched comprehensively in databases including PubMed, Springer, EMBASE, Ovid, and the Cochrane Library from inception to June 2018. The systematic review and meta-analysis was undertaken with no language restriction, and the following keywords were used in the independent and efficient searching process: 1) thyroid cancer OR thyroid carcinomas; 2) cervical lymph nodes; 3) metastatic OR metastasis; 4) ultrasonography OR ultrasound OR CT OR computed tomography. The terms were assembled with the connection symbol “AND” in searching, and to obtain the missing relevant studies, the reference lists of identified articles were also reviewed.
Citation selection
The titles and abstracts of the identified articles were screened independently by two of our members (Chen YH and Zhang YQ). Then, full texts of the studies likely to be relevant were obtained.
The studies had to meet the following inclusion criteria: 1) A diagnostic study; 2) Comparison of the accuracy of ultrasonography and CT; 3) Patients with thyroid cancer; 4) Full text available on the university network; 5) All cited studies had informed consent from each study participant and protocol approval by an ethics committee or institutional review board.
Exclusion criteria: 1) Studies on other disease; 2) Studies with incomplete outcome data (without original or comparable data); 3) No full text.
The included articles were determined by two investigators together, who checked whether the study met the abovementioned conditions. All disagreements were resolved through discussion to reach a consensus.
Data extraction
The two reviewers reviewed the full texts of the articles independently and extracted the detailed data. In this study, the characteristics extracted included the name of the first author, year of publication, year of onset, time range of diagnosis, sex distribution, age range of patients, sample size and detection site. In this study, the extracted parameters mainly included the true positive (TP), true negative (TN), false positive (FP), and false negative (FN), and the clinical utility indices (CUI) were calculated (CUI+ = TP*TP/(TP + FN)*(TP + FP), CUI– = TN*TN/(TN + FP)*(TN + FN)). The data extracted were determined by investigators together and if any dispute occurred, a third investigator was asked to solve it.
Risk of bias
We performed bias analysis to assess the quality of included articles, and the table of risk was presented with the criteria of QUADAS-2.
Statistical analysis
The meta-analyses were performed with STATA 10.0 software. As a diagnostic test, the overall sensitivity and specificity of US and CT, as well as their corresponding 95% confidence intervals (CIs), were calculated on the basis of TP, TN, FP and FN. The forest plots of the sensitivity and specificity and the summary receiver operating characteristic curves (SROC) were also generated. In our study, a p-value < 0.05 was considered as statistically significant.
Results
Search results
In total 1785 related studies (660 in PubMed, 350 in Springer, 273 in EMBASE, 393 in Ovid, and 109 in the Cochrane Library; 1743 in English, 21 in Chinese, 12 in Korean, 6 in German and 3 in French) were initially identified from the databases and reviewed in depth. Finally, 8 articles (7 in English and 1 in Chinese) [22–30] met all the inclusion criteria. The remaining 1777 articles were excluded due to duplication (416), irrelevant studies (574), incomplete outcome data (488), reviews (293), or lack of the full text (6). Figure 1 shows the flow diagram of the study search process and the reasons for exclusion. Eight studies were included in the whole detection site of cervical lymph nodes, and 5 of them studied the central site and 4 studied the lateral site.
Characteristics of included studies
Detailed data of the included articles are shown in Table I. In total, 8917 patients with thyroid cancer were included in these studies, and the nodes in the LNM group and the no-LNM groups were 4776 and 4141, respectively. Table II shows the TP, TN, FP, FN and CUI of each article.
Table I
Details of the articles included in this study
Table II
True positive (TP), true negative (TN), false positive (FP), false negative (FN), clinical utility indices (CUI)+ and CUI– of each study
Quality assessment
The risk of bias table for evaluating each study is shown in Table III.
Table III
Risk of bias table for this meta-analysis
Results of meta-analysis
Comparison of the whole cervical area
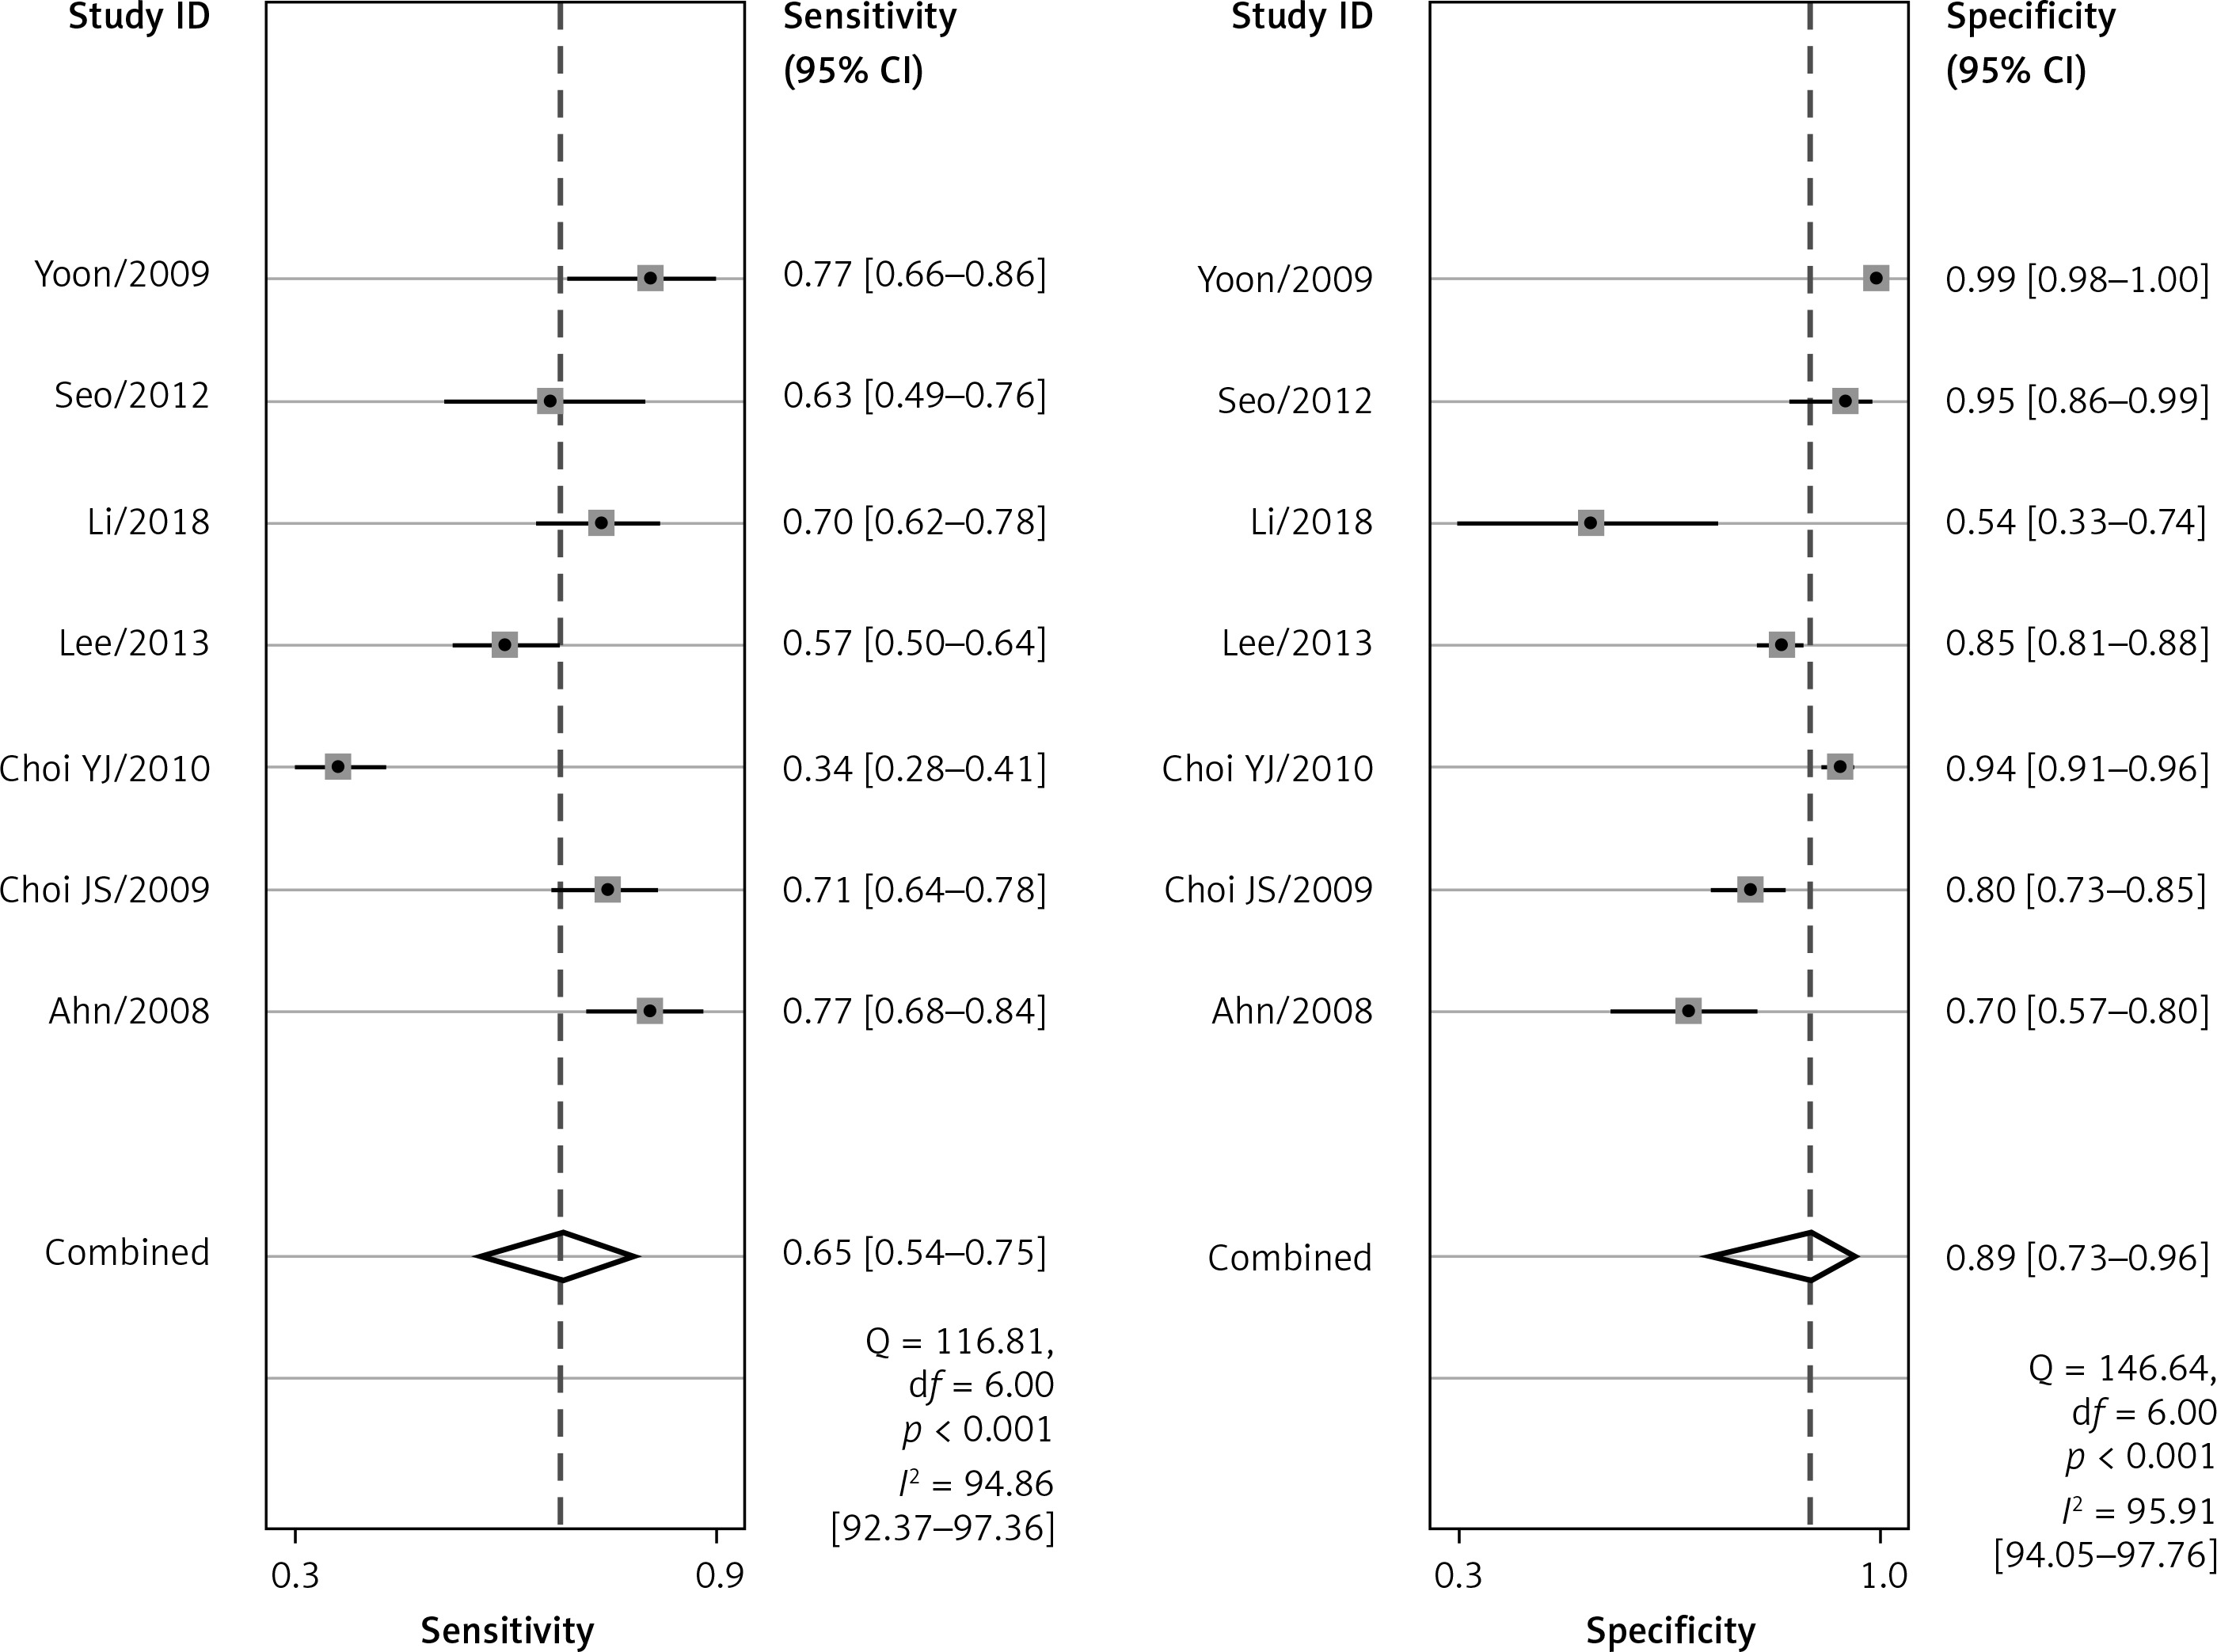
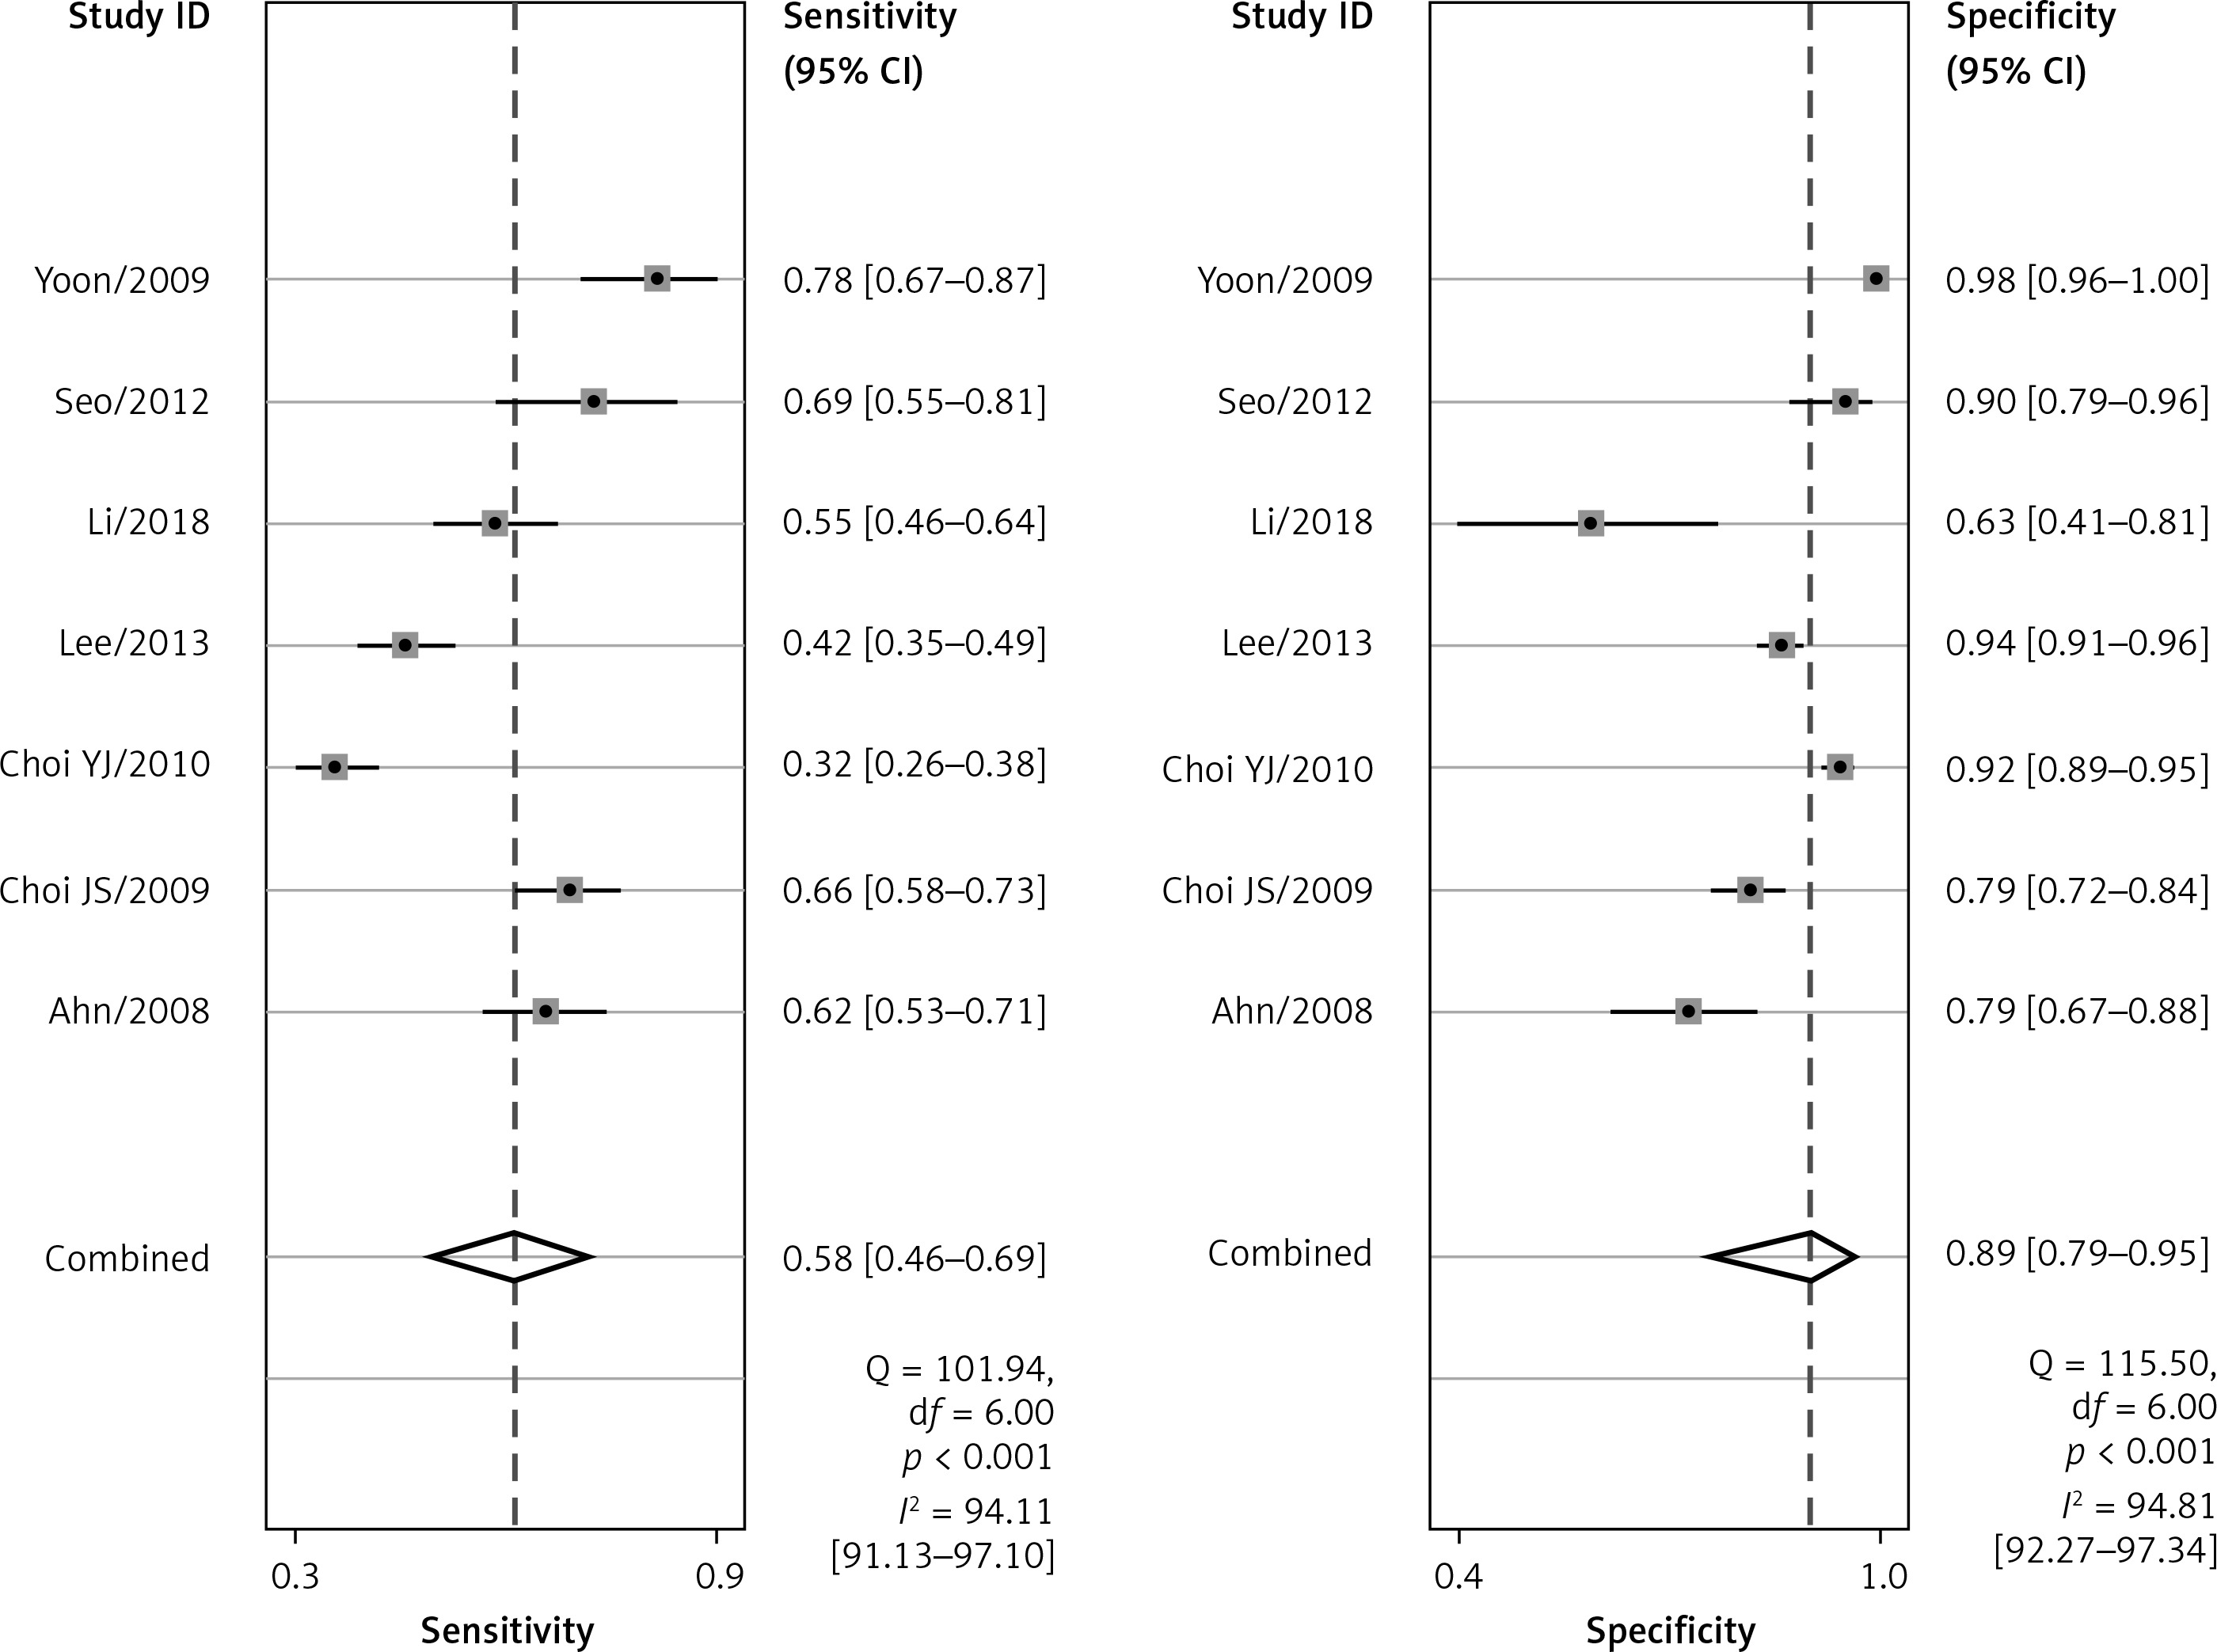
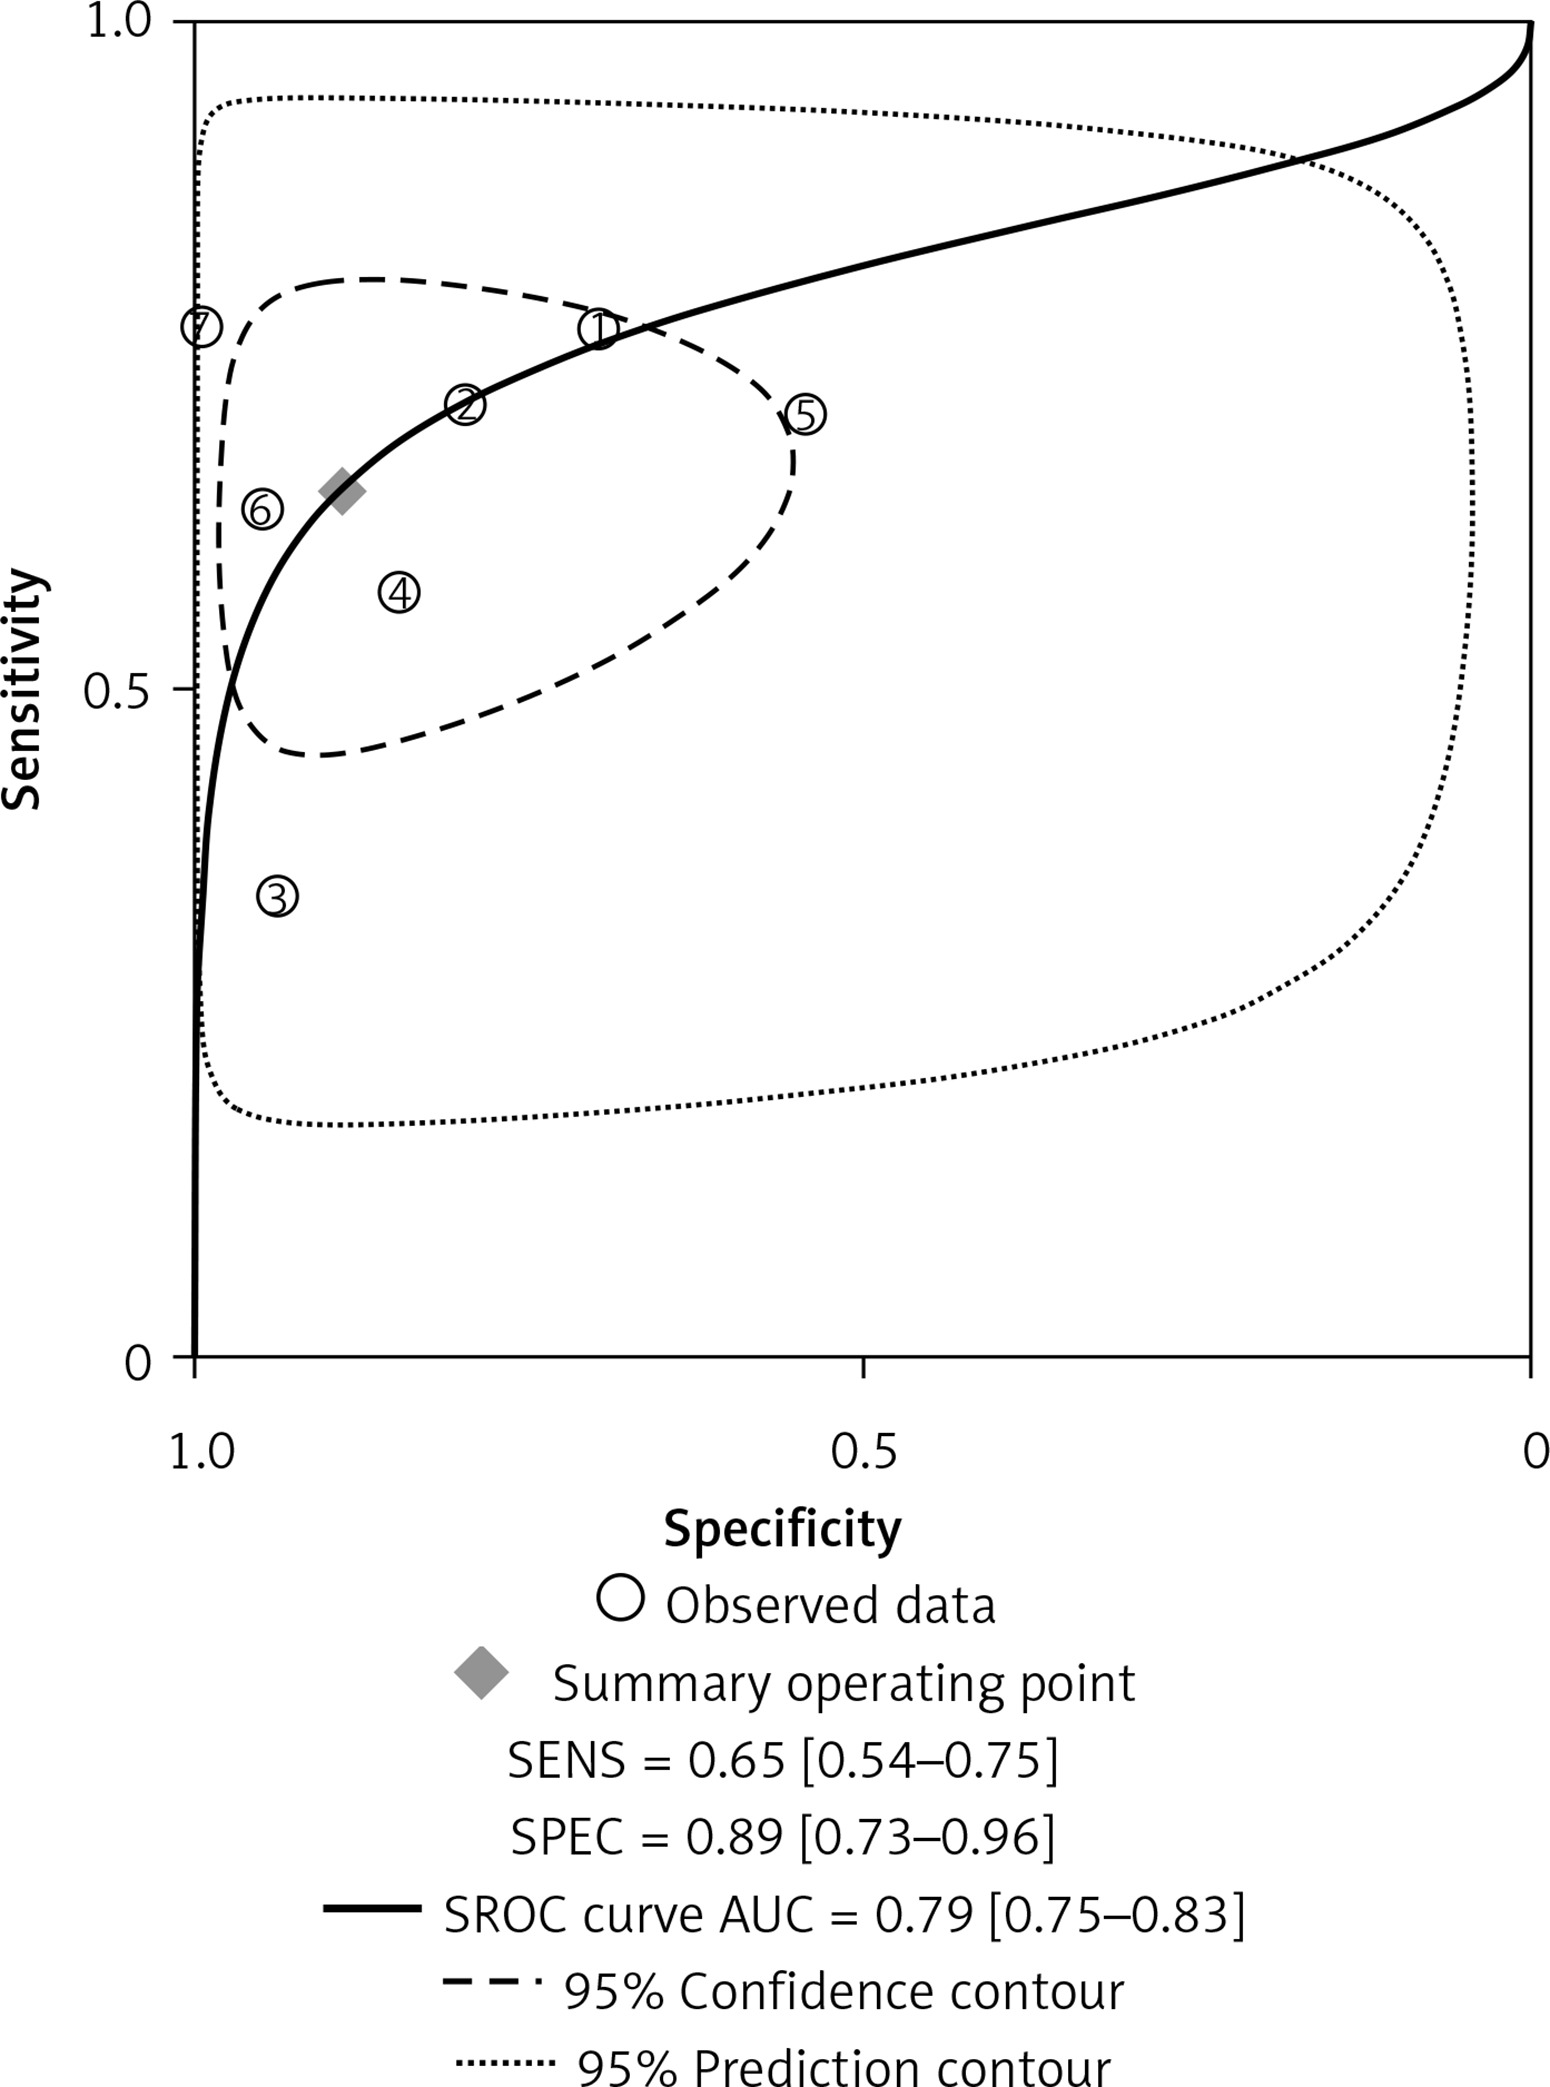
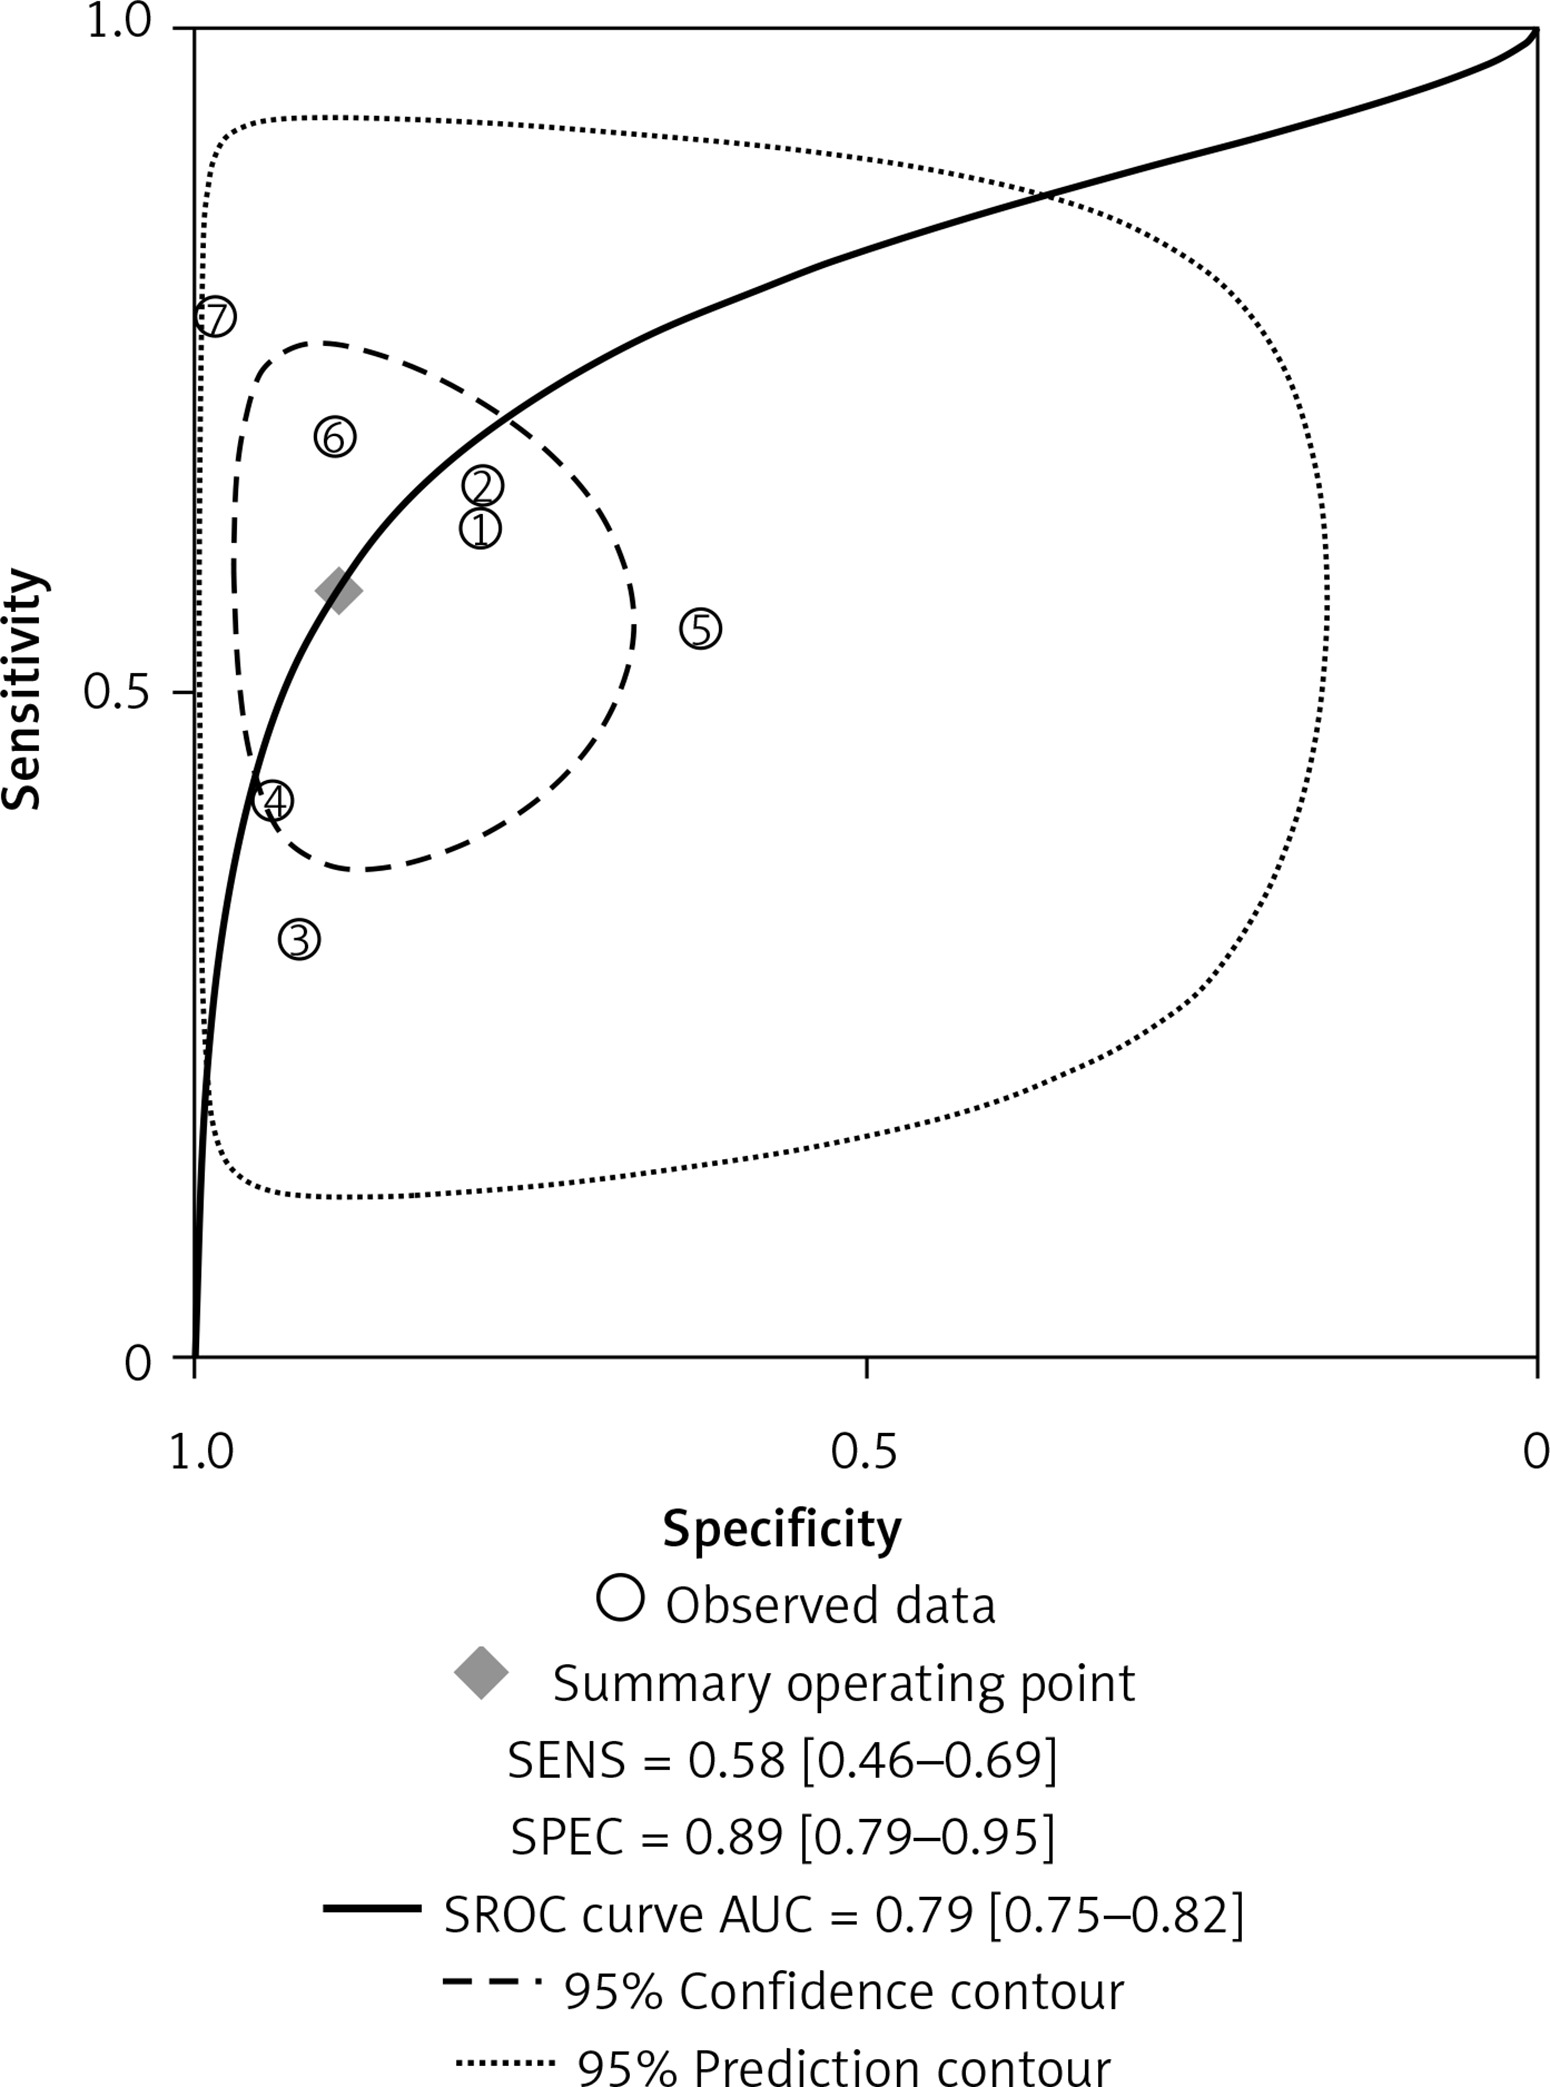
The forest plots for the combined sensitivity and specificity of CT and US in the whole cervical area are shown in Figures 2 and 3, respectively. The figures show that the sensitivity and specificity of CT were 0.65 (95% CI: 0.54–0.75) and 0.89 (95% CI: 0.73–0.96), and those of US were 0.58 (95% CI: 0.46–0.69) and 0.89 (95% CI: 0.79–0.95). Both the sensitivities and specificities of these two methods were comparable (p > 0.05). The SROC that evaluated these two promising technologies for diagnosing cervical lymph nodes from thyroid cancer are presented in Figures 4 and 5, respectively. As shown in the figures, the area under the SROC curve (AUC) was 0.79 (95% CI: 0.75–0.83) for CT, and 0.79 (95% CI: 0.75–0.82) for US. No statistically significant difference in AUC was observed between these two methods (p > 0.05).
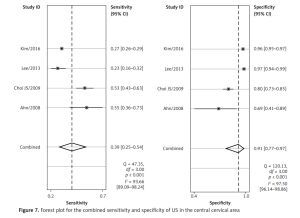
Comparison of the central cervical area
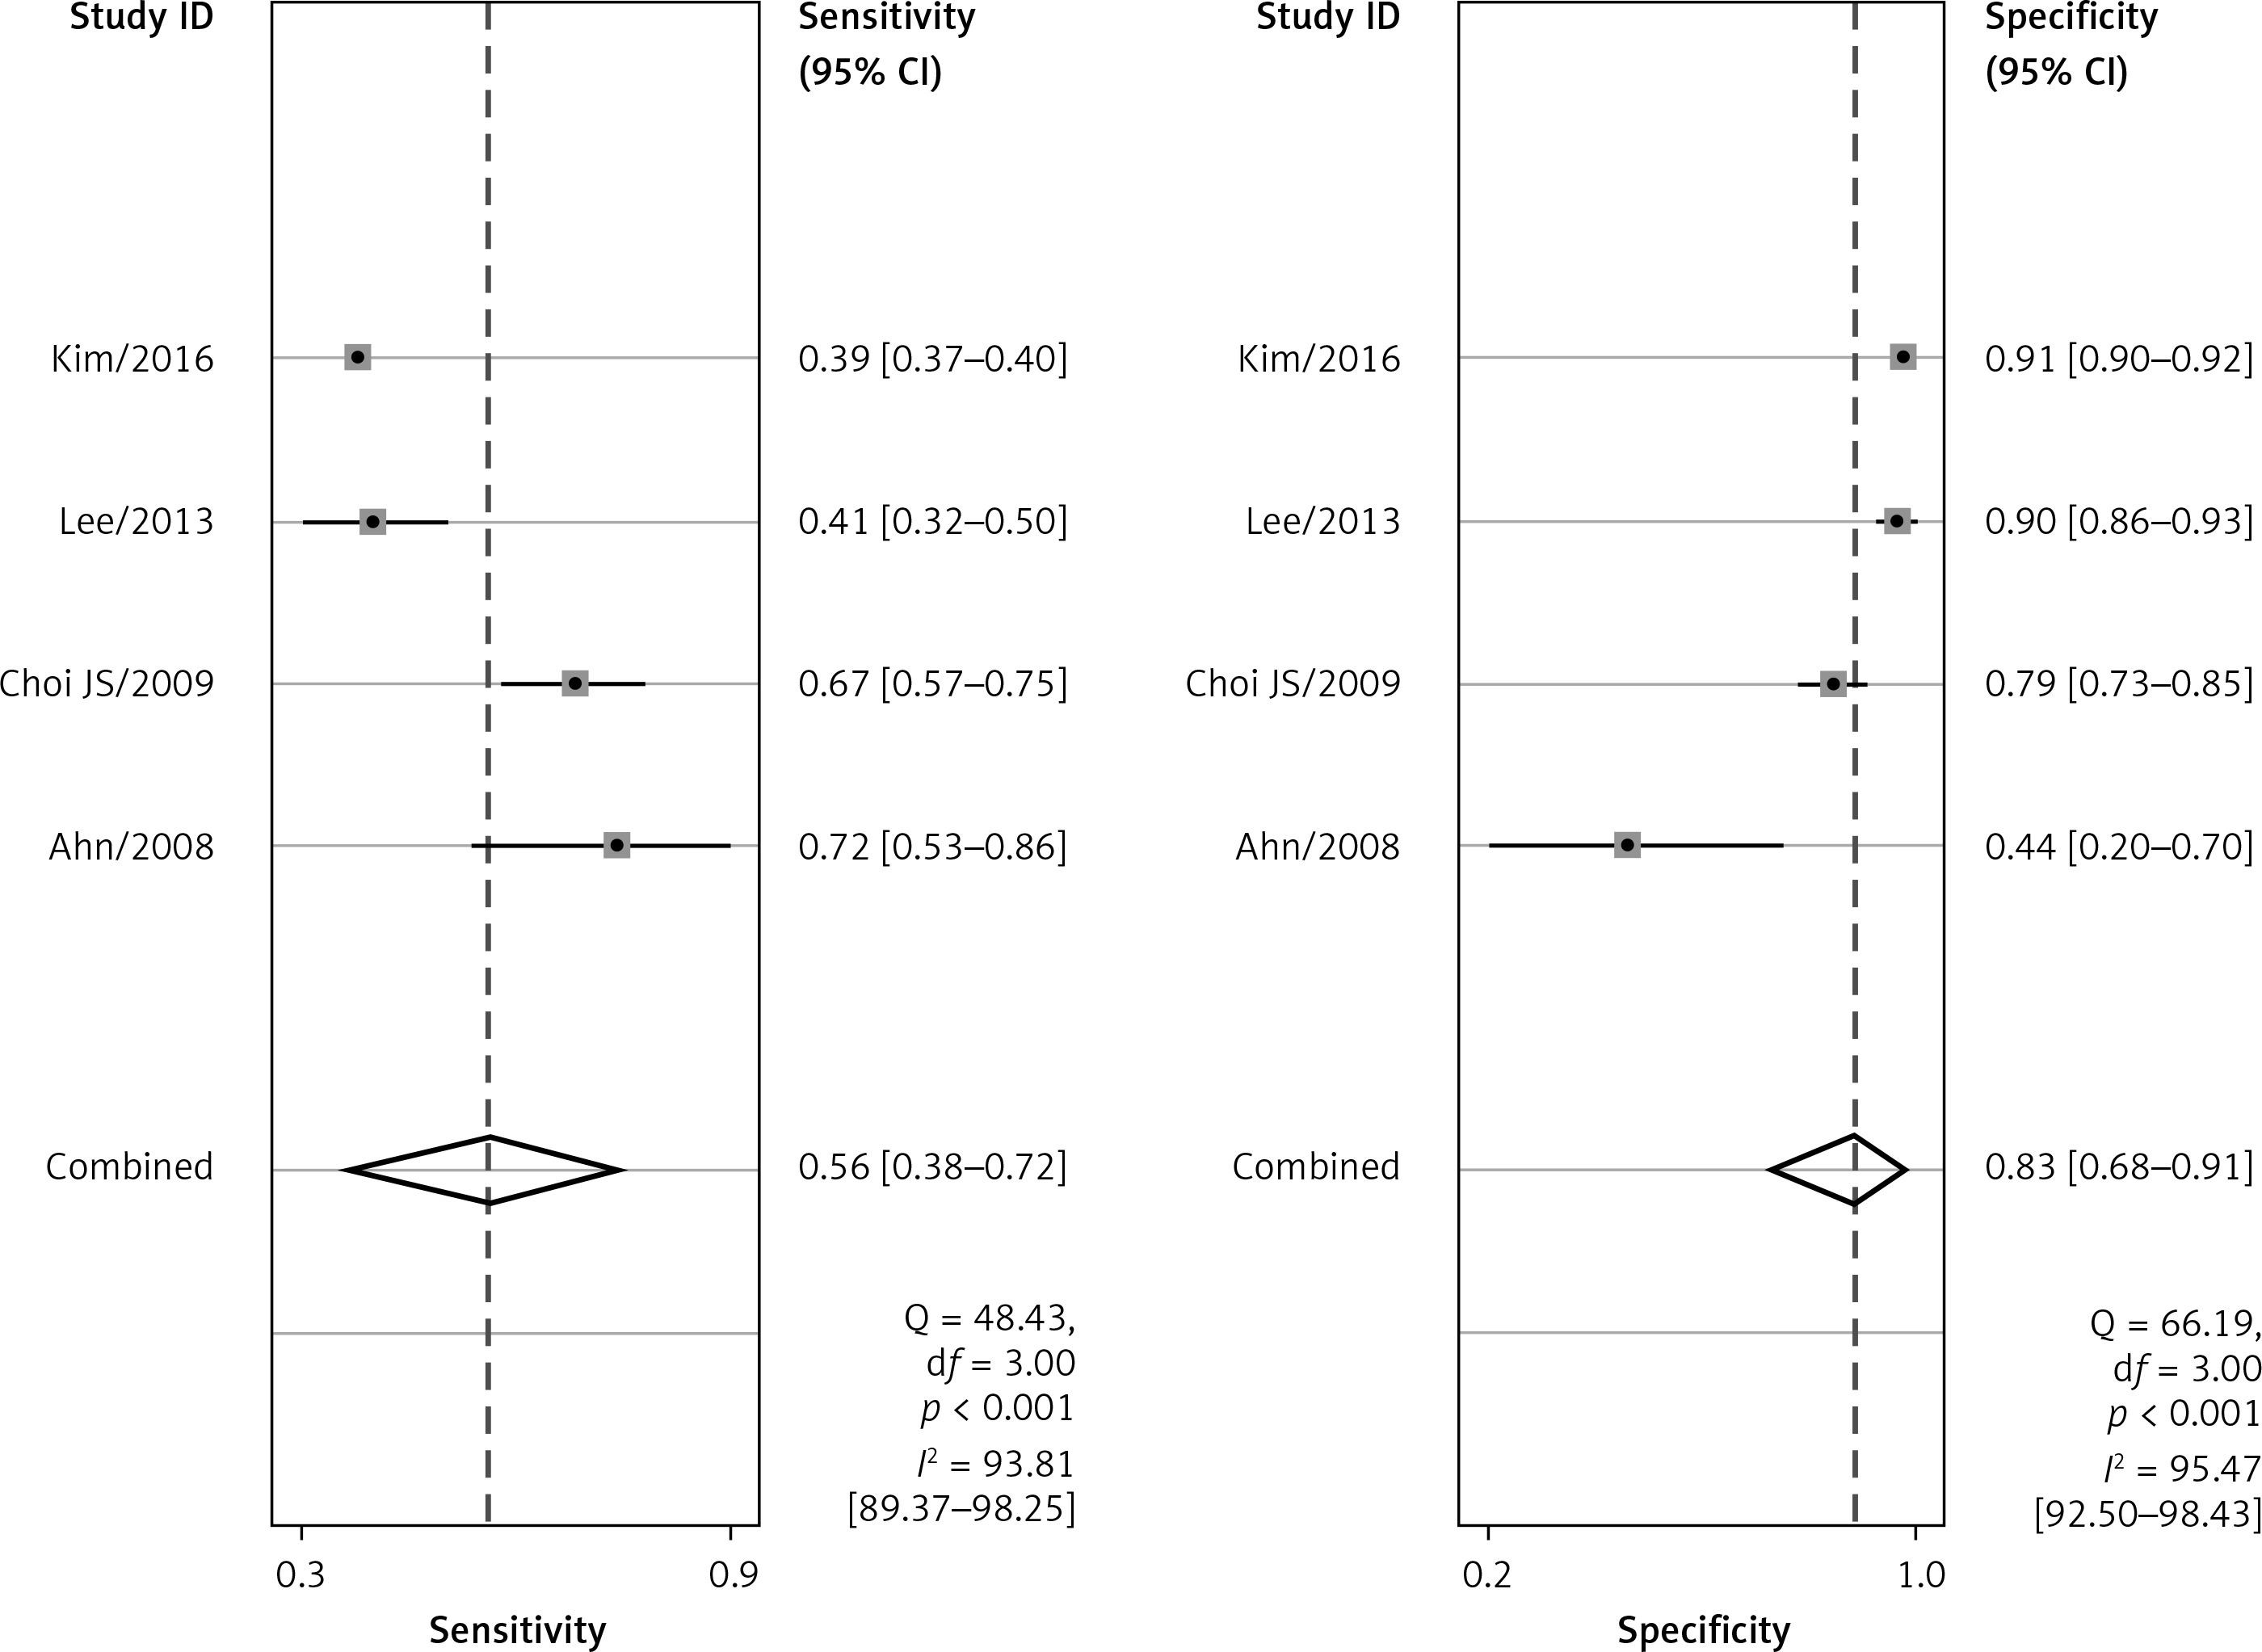
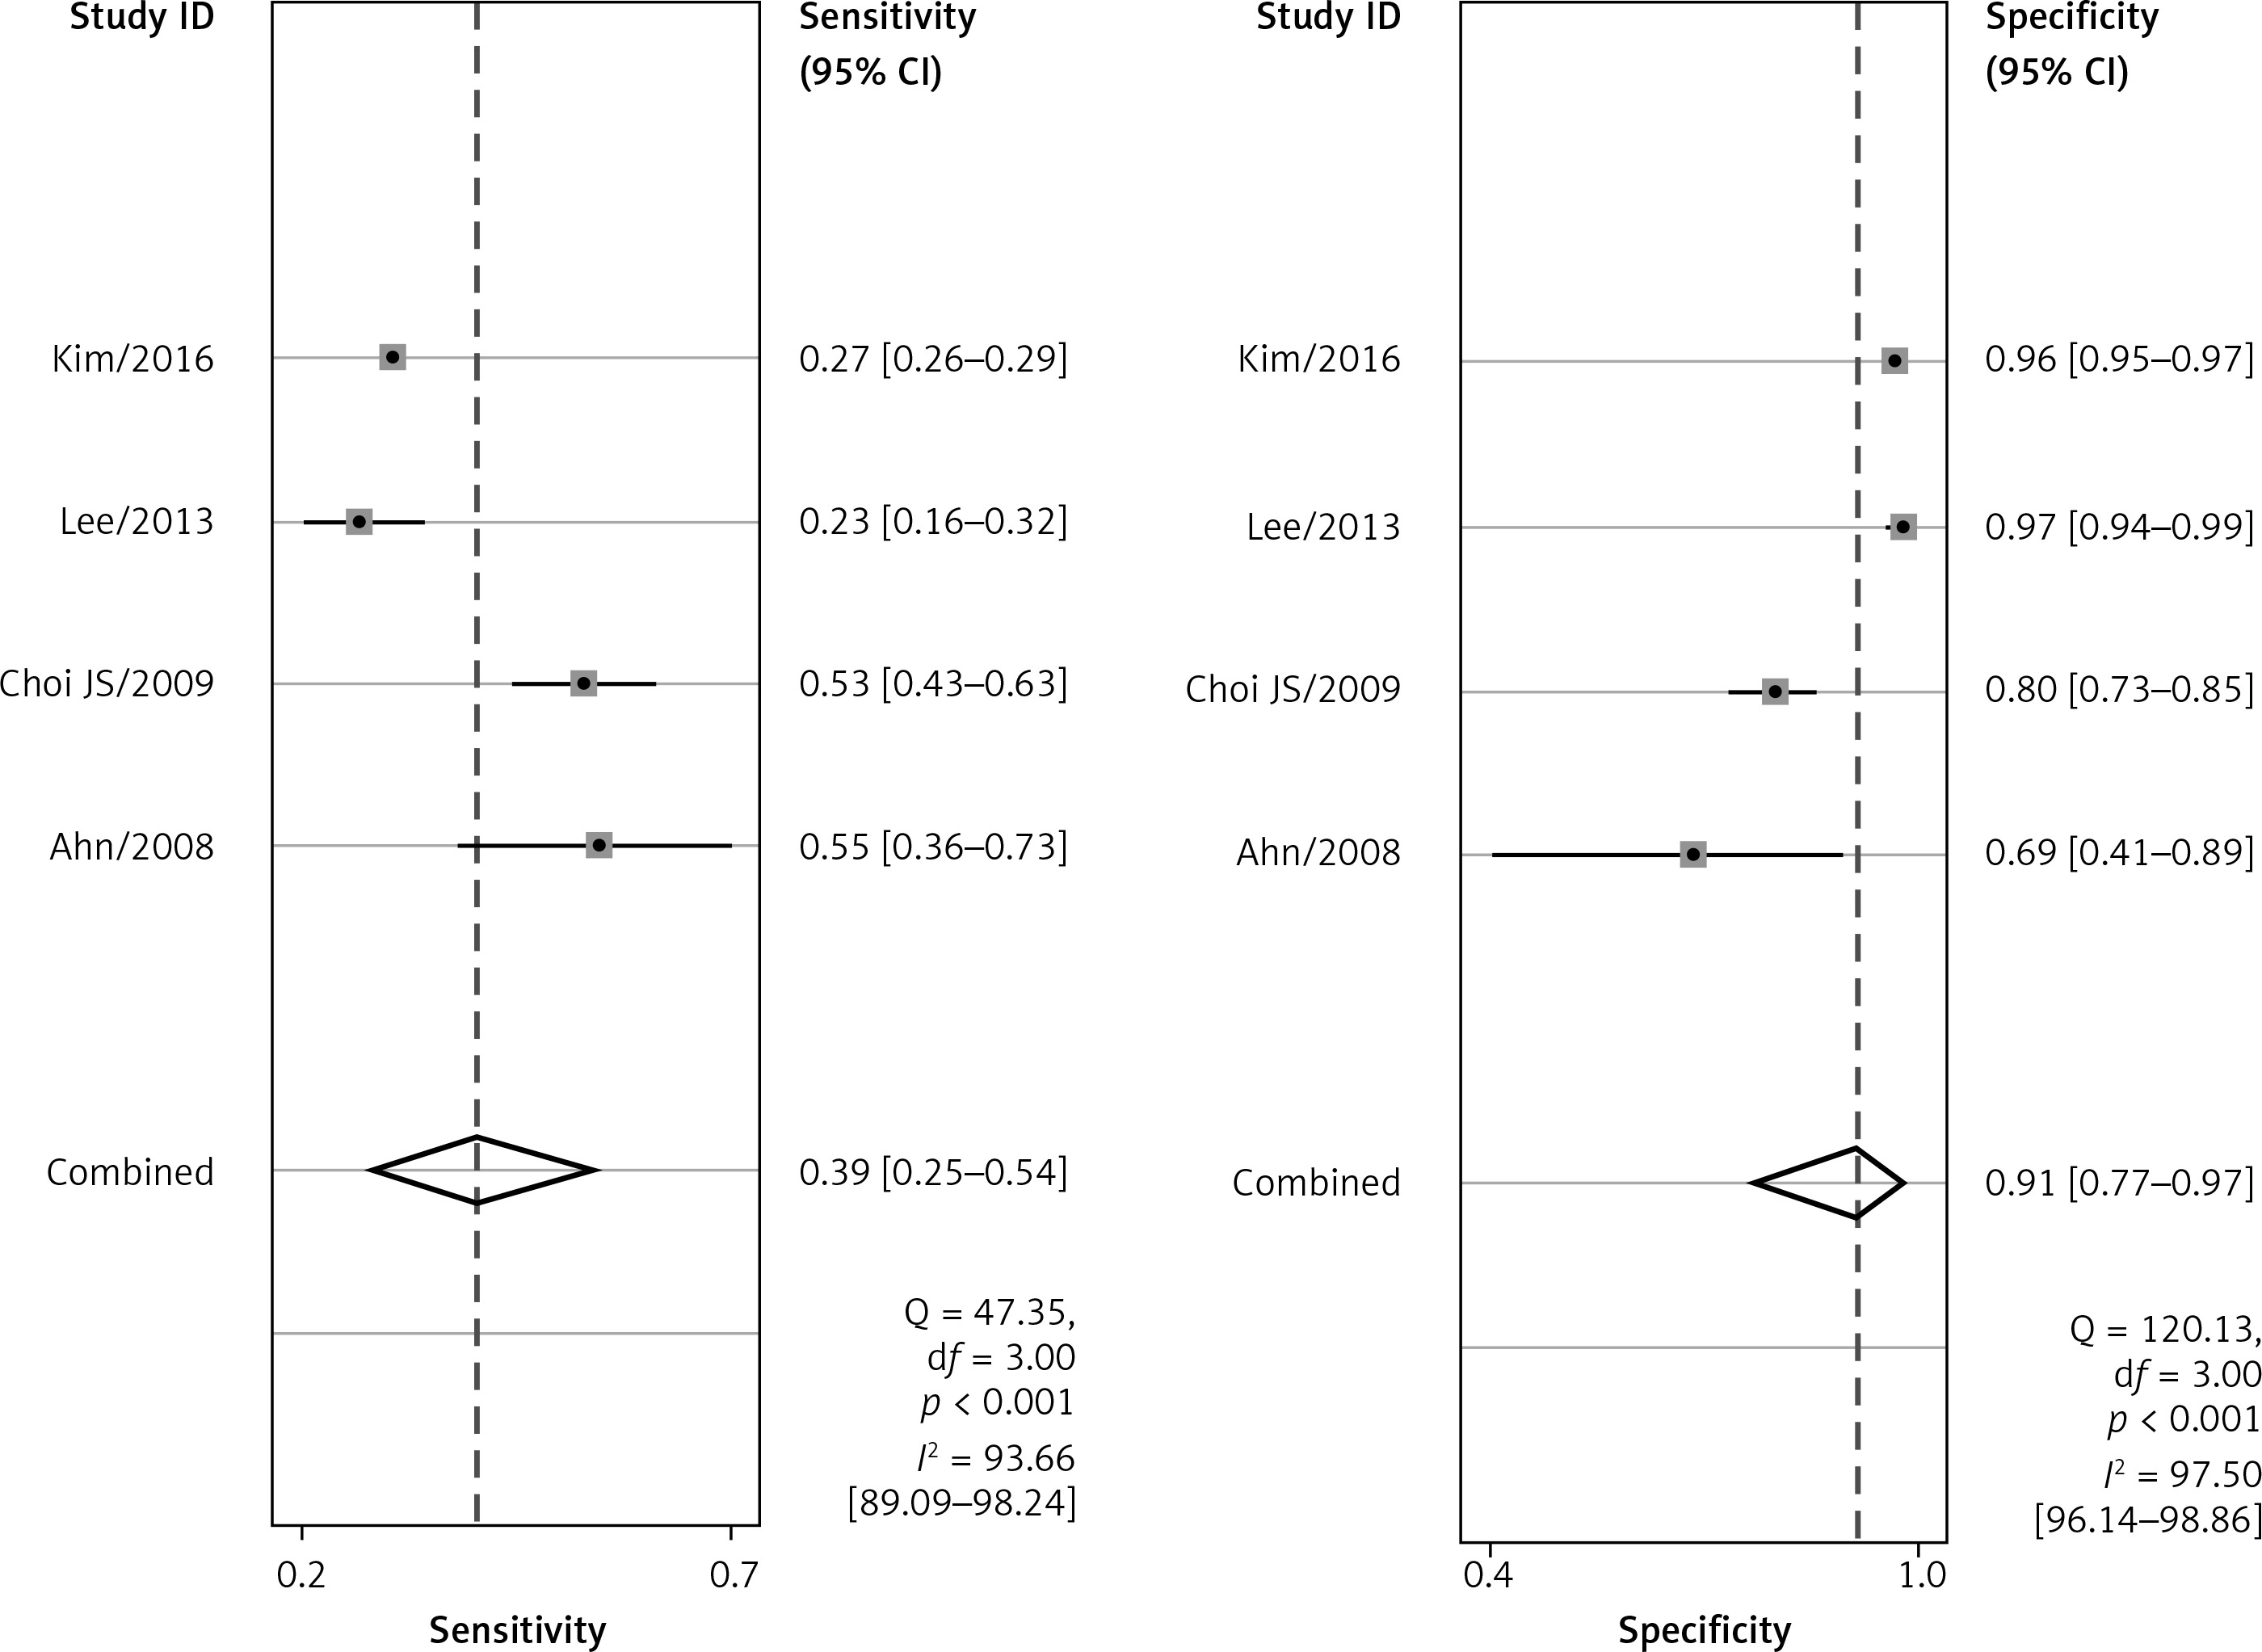
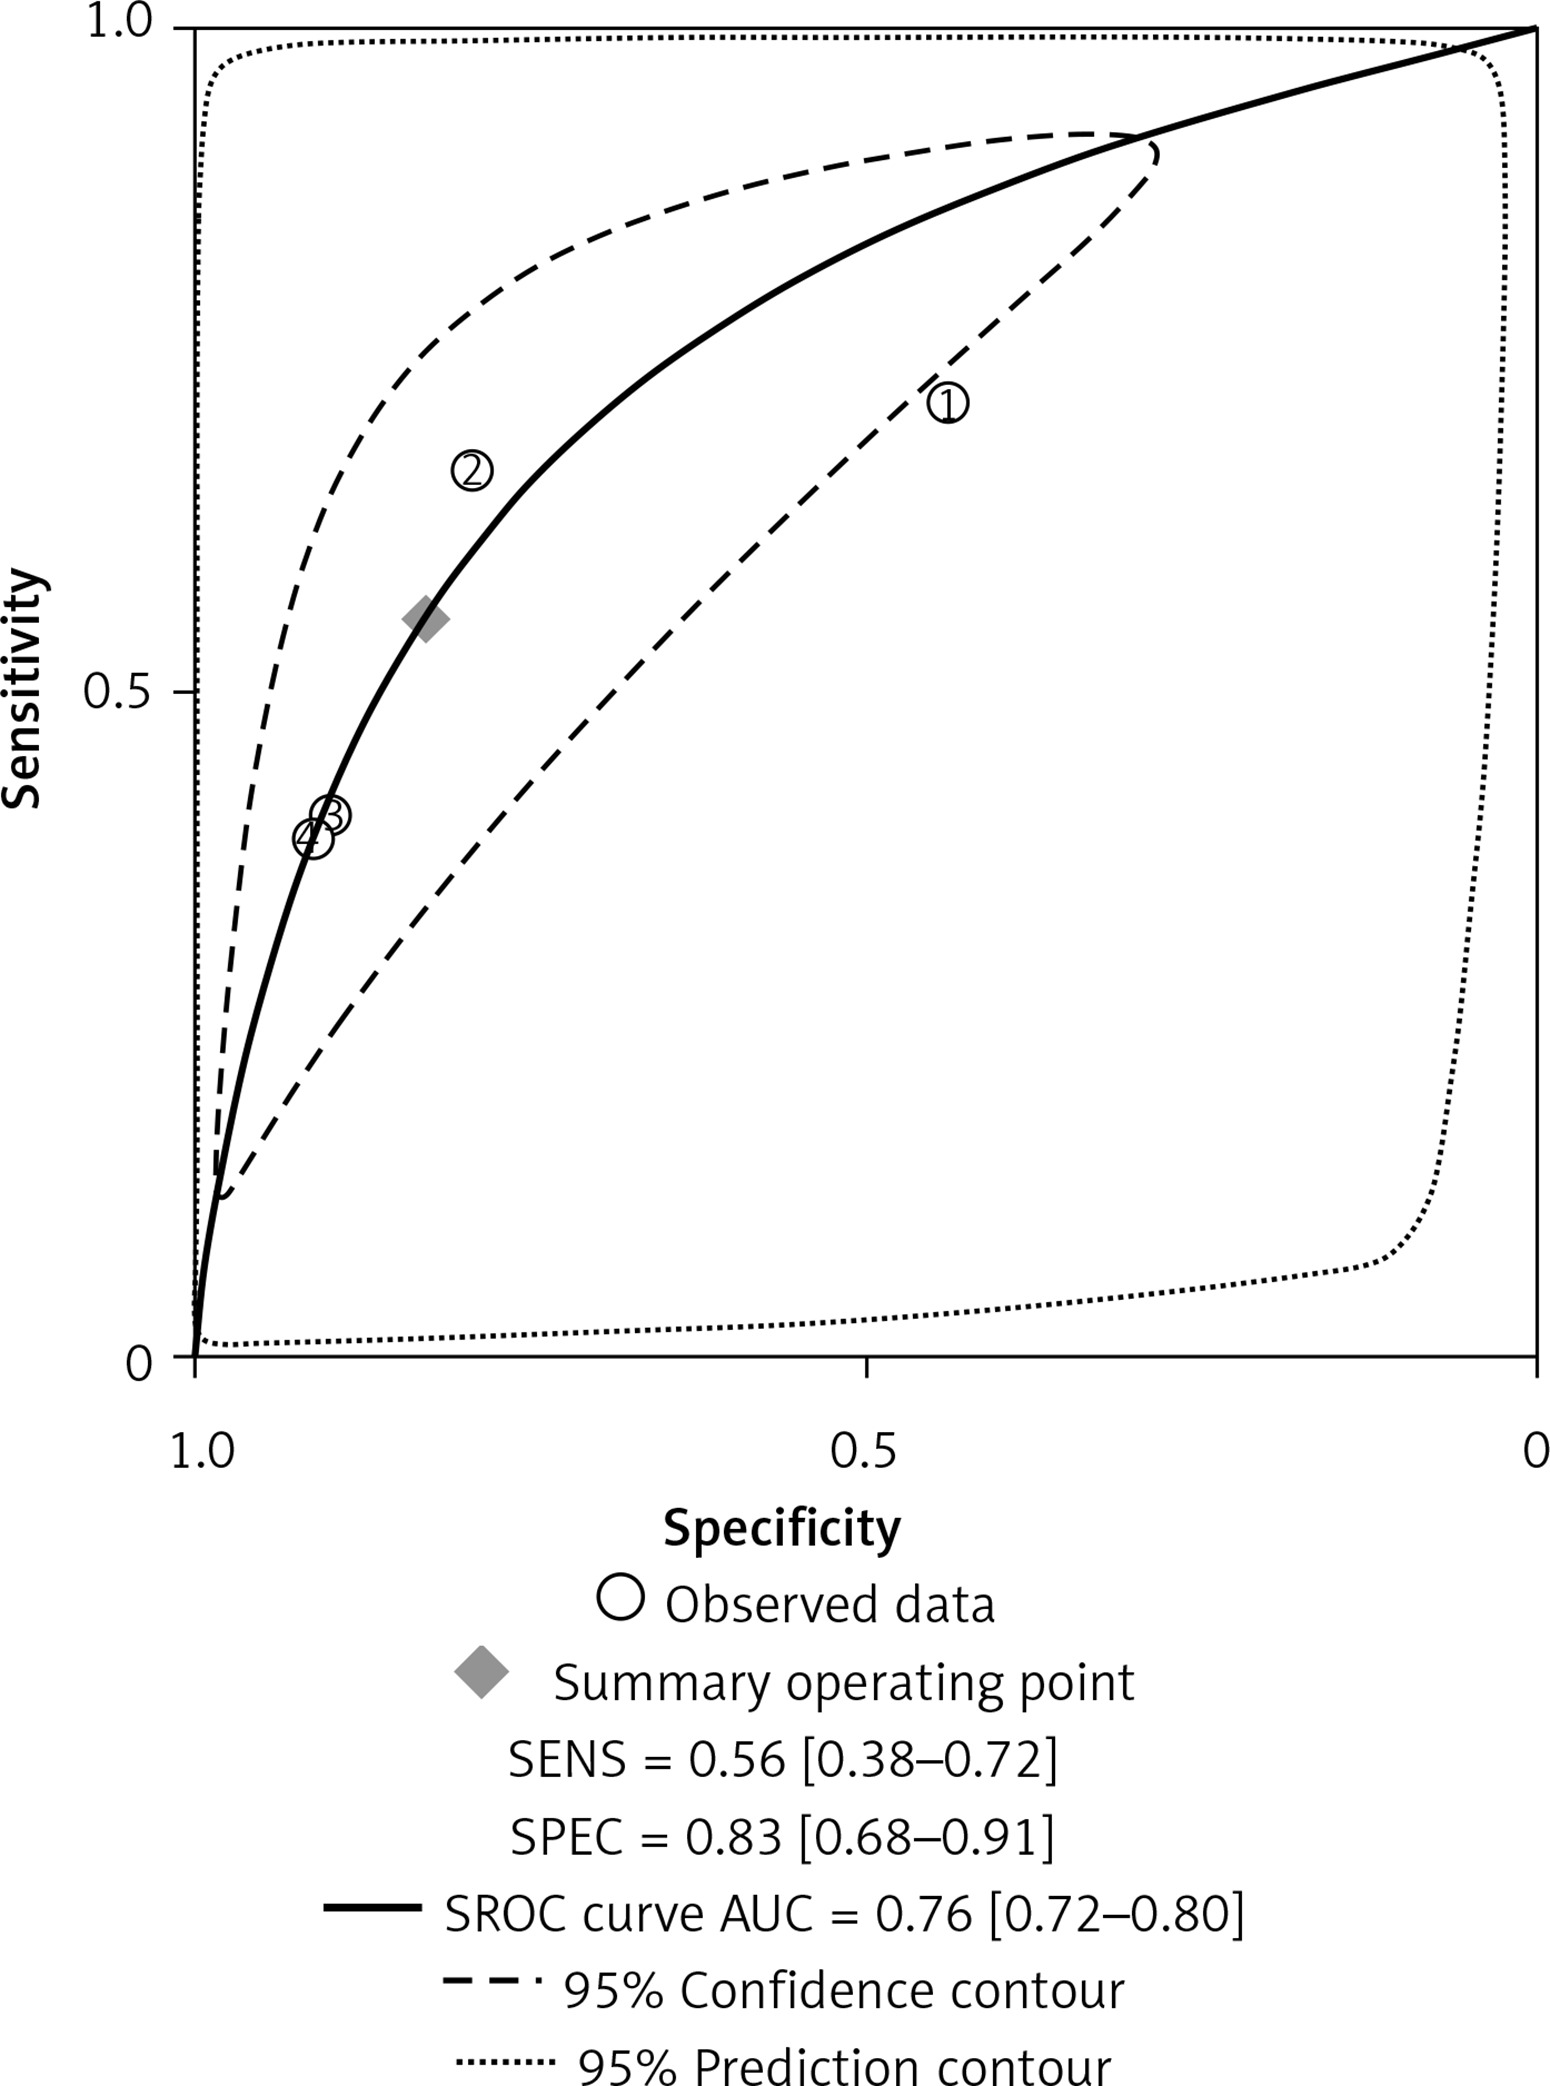
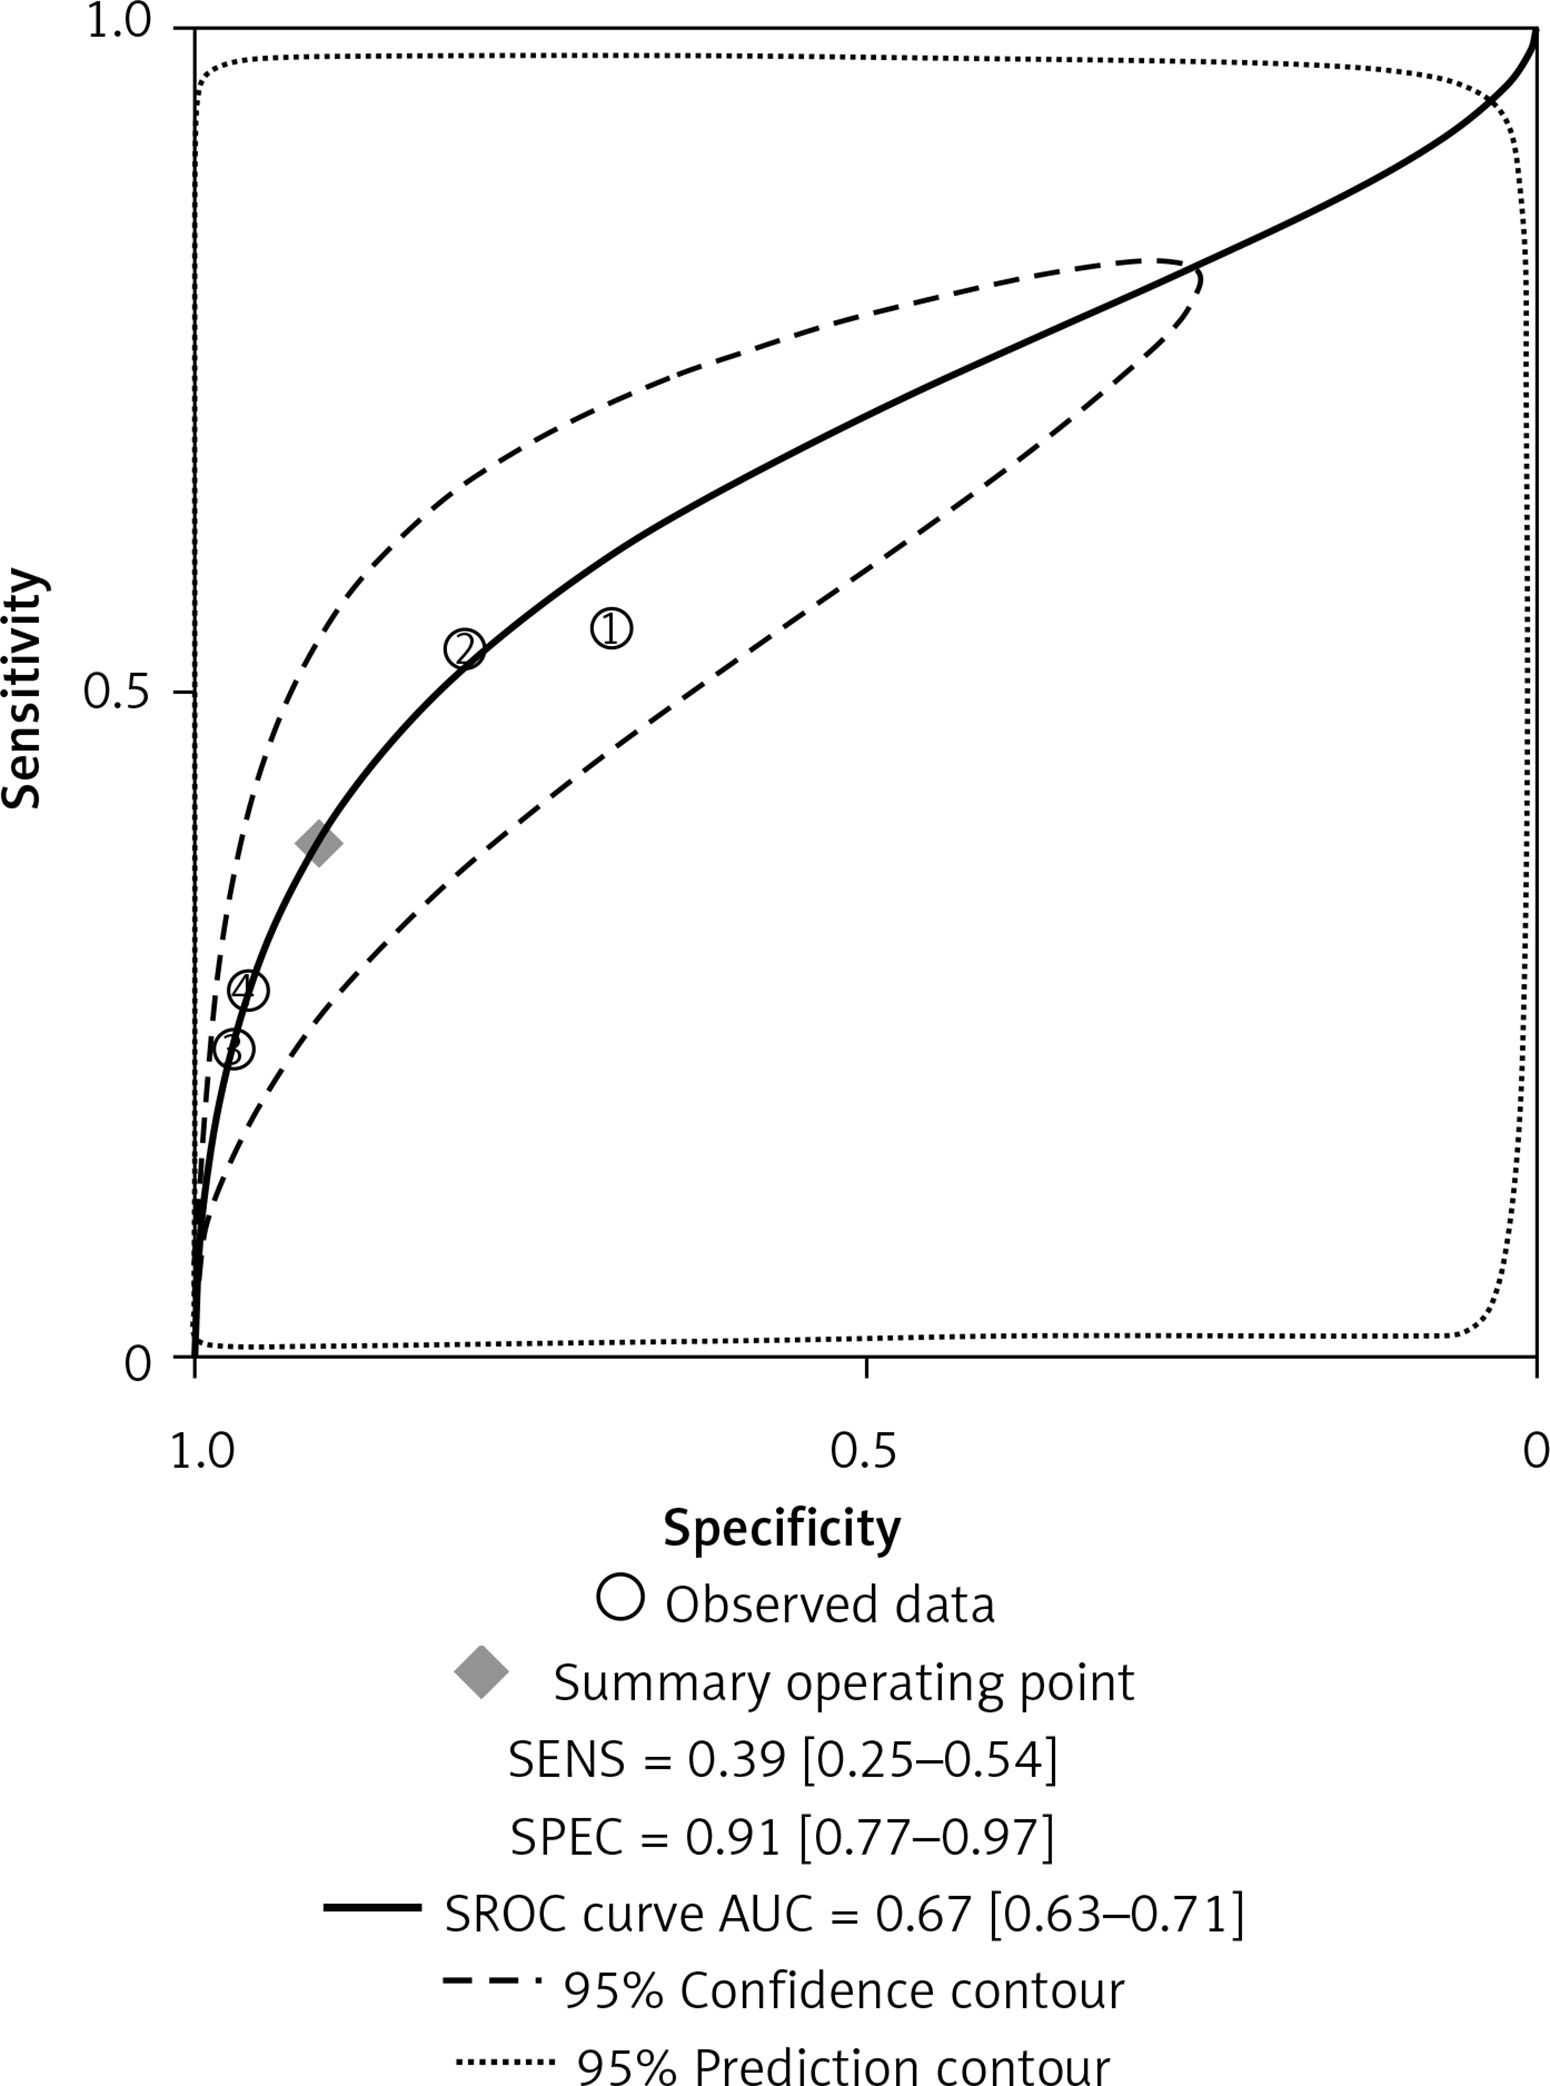
Four of the 8 included studies examined the central cervical area. The results are presented in Figures 6 and 7. The sensitivity and specificity of CT were 0.56 (95% CI: 0.38–0.72) and 0.83 (95% CI: 0.68–0.91), respectively, and those of US were 0.39 (95% CI: 0.25–0.54) and 0.91 (95% CI: 0.77–0.97), respectively. There was no significant difference between these two methods. Figures 8 and 9 show that the SROC and the AUCs of CT and US were 0.76 (95% CI: 0.72–0.80) and 0.67 (95% CI: 0.63–0.71), respectively. The AUC of CT was much larger than that of US.
Discussion
According to the results above, both CT and US could be useful methods to diagnose LNM in the clinic, especially in specificity. Similarly to previous studies [26, 31], our results showed that relatively low sensitivity and high specificity of both US and CT in preoperative detection of LNM from patients with PTC were observed (Figures 2, 3, 6, and 7). Theoretically, CT scans may have higher sensitivity for detecting LNM location. The results of our meta-analyses indicated that compared with US, CT had even comparable sensitivity and specificity in the whole and central site. However, according to Figures 4, 5, 8, and 9, the areas under the SROC curve in the whole site between US and CT shows no significant difference. But in the central cervical area, the AUC of CT was much larger than that of US, which means that CT is superior for central lymph node metastasis.
After the pathologic examination of the specimen, central compartment neck dissection combined with total thyroidectomy is recommended [32]. But the use of central dissection is controversial when LNM is clinically negative, as the necessity is still not standardized clinically [33, 34]. In our study, we did not conduct a comparison of the lateral cervical area due to the limited number of included articles. However, all the previous studies [23, 27, 28] have shown that the sensitivities of both CT and US in detecting the lateral cervical area were higher than the sensitivities in detecting the central cervical area, while the difference of specificity of these two methods in detecting lateral and central cervical areas was not statistically significant. There are two possible explanations for this. Most tumors in the head and neck metastasized to lateral lymph nodes, and studies have mainly focused on lymph node metastasis in the lateral area [35, 36]. The diagnostic criteria for lateral lymph nodes may be not applicable for the central compartment. Besides, the anatomical complexity of the thoracic inlet and the difficulty in reading the imaging results may also limit the application of imaging methods in the central compartment.
Based solely on our statistical results, we recommend CT as the detection method due to its larger AUC than US. However, the cost of CT in examining the thyroid gland is much higher than that of US. The patients and radiologist could choose the appropriate detection methods considering the cost-benefit principle. In view of the low sensitivity of both CT and US in the central cervical area, more diagnostic studies should be conducted to assess the accuracy of CT and US in the central compartment, or new methods should be found and used to diagnose the central LNM.
There are some potential limitations in this study. First of all, high observer bias may exist for the non-blind surgical approaches, and the perception of both surgeons and patients could influence the diagnostic results. Second, publication bias in our study was not assessed, due to the fact that few articles were included, and the limited numbers of patients as well as articles included in our study would affect the quality and the results of the study (Table III). Also, because of the lack of stage information of thyroid carcinoma, the accuracy of the US and CT could be affected. Furthermore, in our study, there may be some information bias, resulting from devices changes in the wide time range of onset in included studies, and images changes of the different or blinded radiologist. In clinical practice, regular instrument maintenance and calibration, standardized training of radiologists and unified standard of diagnosis are necessary to reduce the information error.
In conclusion, the results of our meta-analysis demonstrated comparable diagnostic accuracy of US and CT. The specificity of both these methods was much higher than the sensitivity. More sensitive methods are required to detect LNM in the central neck.