
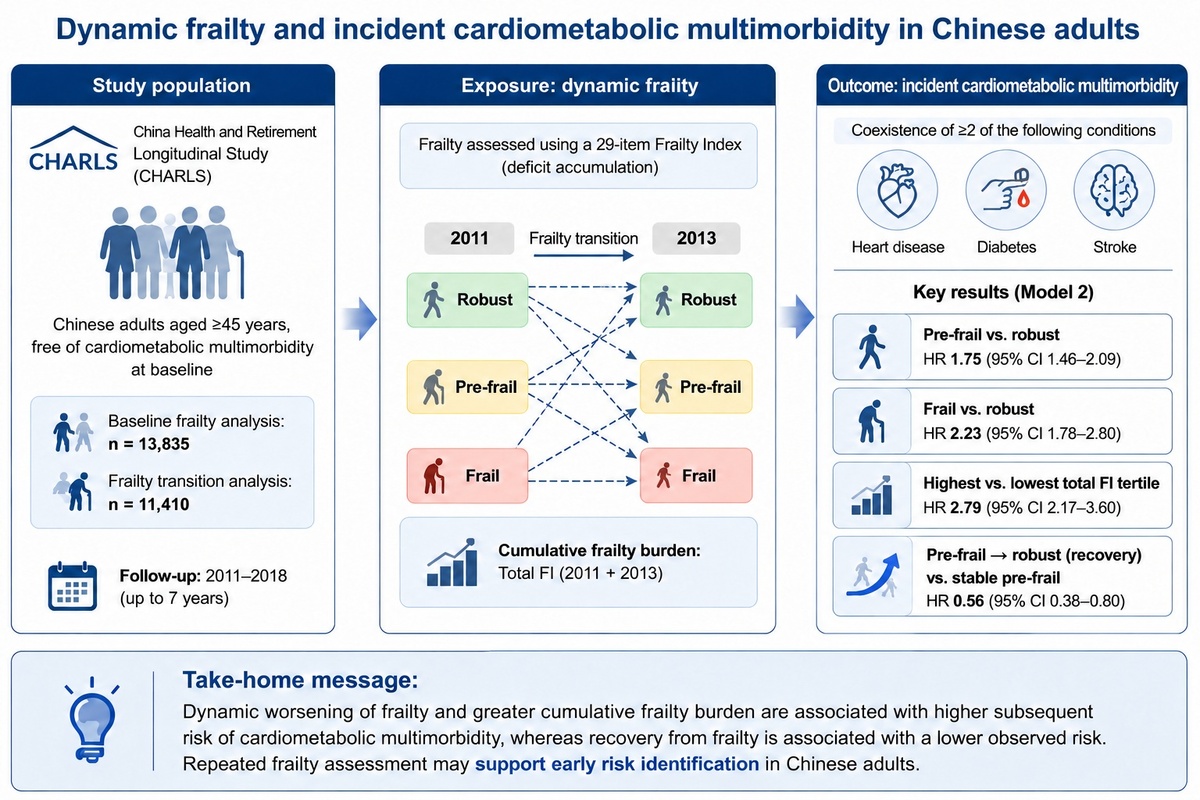
Cardiometabolic multimorbidity (CMM), commonly defined as the coexistence of at least two of diabetes, heart disease, and stroke, is associated with substantially increased mortality [1, 2]. Frailty is a multidimensional state of reduced physiological reserve and may change over time [3–6]. However, evidence linking both frailty progression and recovery to subsequent CMM remains limited. We therefore examined baseline frailty, frailty transitions, and cumulative frailty burden in a nationally representative Chinese cohort.
Methods
We used data from the China Health and Retirement Longitudinal Study (CHARLS), with 2011 as the baseline, 2013 as the frailty reassessment wave, and follow-up extending through 2018 [7]. Participants were aged at least 45 years and free of CMM at the relevant analytic baseline. The baseline frailty analysis included 13,835 participants, whereas the analyses of frailty transitions and total frailty index included 11,410 participants who remained free of CMM in 2013 (Supplementary Figure S1).
Frailty was assessed using a modified 29-item frailty index (FI) based on deficit accumulation [8, 9]. The original 32 deficits were hypertension, diabetes, heart disease, stroke, cancer, arthritis, chronic lung disease, asthma, emotional/nervous/psychiatric problems, memory-related disease, vision problems, hearing problems, self-rated health, five activities of daily living (ADL) limitations (dressing, bathing, eating, transferring, and toileting), five instrumental activities of daily living (IADL) limitations (managing money, taking medication, shopping, housework, and preparing meals), seven mobility limitations (walking one block, rising from a chair, climbing stairs, lifting 10 jin (approximately 5 kg), picking up a coin, stooping/kneeling/crouching, and reaching overhead), depressive symptoms, and cognition (Supplementary Table SI). Diabetes, heart disease, and stroke were removed to prevent overlap with the outcome, leaving 29 deficits. Each deficit was scored from 0 to 1, and the FI was calculated as the sum divided by 29. Frailty was classified as robust, pre-frail, or frail. Frailty transitions were defined from 2011 to 2013. Total FI was the sum of the 2011 and 2013 FI scores and was categorized using cut-off values of 0.145 and 0.304 (Supplementary Table SII).
At each wave, diabetes, heart disease, and stroke were identified exclusively from harmonized self-reported physician diagnoses; biomarkers and medication use were not used. Incident CMM was the first wave at which at least two component conditions were present [2]. CMM status was considered missing when any component condition was missing. Events identified in 2013, 2015, and 2018 were assigned follow-up times of 2, 4, and 7 years, respectively; non-cases were censored at their last valid negative assessment.
Baseline characteristics were summarized using medians and interquartile ranges or numbers and percentages. Cox proportional hazards regression was used to estimate hazard ratios (HRs) and 95% confidence intervals (CIs). Covariate selection was guided by an assumed directed acyclic graph (DAG; Supplementary Figure S2). Model 1 adjusted for age and sex. Model 2 additionally adjusted for education, residence, marital status, smoking, alcohol intake, sleep duration, physical activity, body mass index (BMI), and waist circumference and was prespecified as the primary model. Model 3 further included triglycerides (TG), high-density lipoprotein cholesterol (HDL-C), C-reactive protein (CRP), and glycated hemoglobin (HbA1c). In the DAG, TG and HDL-C represent lipid-metabolic pathways, CRP represents an inflammatory pathway, and HbA1c represents a glycemic pathway potentially downstream of frailty. Accordingly, Model 2 was interpreted as the primary total-association estimate, whereas Model 3 was interpreted as a secondary mechanistic analysis rather than as a fully adjusted confounding model or a formal mediation analysis.
Primary Model 2 analyses used complete cases, with multiple imputation by chained equations (MICE) as a sensitivity analysis. The proportional hazards assumption was assessed using scaled Schoenfeld residuals; when potential non-proportionality was detected, time-varying coefficient and piecewise Cox models were fitted. Restricted cubic spline (RCS) models examined potential nonlinearity (Supplementary Figure S3). Additional sensitivity analyses used alternative FI cut-offs, MICE (50 datasets; 20 iterations), and 2-year lag or landmark analyses. Included and excluded participants were compared to evaluate potential selection bias. Analyses used R version 4.5.0, with two-sided p < 0.05 considered statistically significant.
Results
The baseline frailty and frailty-transition analyses included 13,835 and 11,410 participants, respectively, and showed broadly similar frailty distributions. Frail participants generally had less favorable baseline characteristics, while included and excluded participants differed in several respects (Supplementary Tables SIII–SVI).
In primary Model 2, baseline pre-frailty and frailty were associated with incident CMM (HR = 1.75, 95% CI: 1.46–2.09; and HR = 2.23, 95% CI: 1.78–2.80, respectively; Table I). Total FI showed a graded association: compared with T1, HRs were 1.86 (95% CI: 1.44–2.41) for T2 and 2.79 (95% CI: 2.17–3.60) for T3 (p for trend < 0.001). RCS analysis supported overall and nonlinear associations (both p < 0.001; Supplementary Figure S3).
Table I
Associations of baseline frailty status and total frailty index with incident CMM
[i] Values are HRs (95% CIs); N/events are from the full analytic cohorts. Model 1 adjusted for age and sex. Model 2 additionally adjusted for education, residence, marital status, smoking, alcohol intake, sleep duration, physical activity, BMI, and waist circumference and was the primary model. Model 3 further adjusted for TG, HDL-C, CRP, and HbA1c and was a secondary mechanistic/conditional model. Model-specific N/events for baseline frailty were 13,835/2,333, 3,955/660, and 2,919/518 for Models 1–3, respectively; corresponding values for total FI were 11,410/1,840, 3,382/528, and 2,545/418. Total FI was the sum of the 2011 and 2013 FI scores (T1 ≤ 0.145; T2 > 0.145–0.304; T3 > 0.304); values could exceed 1. P for trend used tertile medians as a continuous term. Model-specific sample sizes differed because complete-case analyses were used. BMI – body mass index, CI – confidence interval, CMM – cardiometabolic multimorbidity, CRP – C-reactive protein, FI – frailty index, HbA1c – glycated hemoglobin, HDL-C – high-density lipoprotein cholesterol, HR – hazard ratio, TG – triglycerides.
Among participants robust in 2011, progression to pre-frailty or frailty was associated with a higher hazard of CMM than remaining robust (HR = 1.83, 95% CI: 1.35–2.47; and HR = 1.86, 95% CI: 1.01–3.43, respectively; Table II). Among those who were pre-frail in 2011, recovery to robustness was associated with a lower hazard of CMM (HR = 0.56, 95% CI: 0.38–0.80), whereas progression to frailty was not significant. Among those who were frail in 2011, recovery to robustness was associated with lower hazard (HR = 0.42, 95% CI: 0.19–0.94), but this estimate was based on only 134 participants and 25 events and should be interpreted cautiously.
Table II
Associations of frailty transitions with incident CMM
[i] N/events are from the full frailty-transition cohort. Within each baseline frailty stratum, participants who remained in the same state were the reference group. Model 1 adjusted for age and sex. Model 2 additionally adjusted for education, residence, marital status, smoking, alcohol intake, sleep duration, physical activity, BMI, and waist circumference and was the primary model. Model 3 further adjusted for TG, HDL-C, CRP, and HbA1c and was a secondary mechanistic/conditional model. Model-specific N/events for Models 1–3 were 6,024/684, 1,750/201, and 1,289/154 among participants robust at baseline; 3,899/753, 1,194/213, and 917/168 among those who were pre-frail at baseline; and 1,487/403, 438/114, and 339/96 among those frail at baseline. Sample sizes differed because complete-case analyses were used. BMI – body mass index, CI – confidence interval, CMM – cardiometabolic multimorbidity, CRP – C-reactive protein, HbA1c – glycated hemoglobin, HDL-C – high-density lipoprotein cholesterol, HR – hazard ratio, TG – triglycerides.
In primary Model 2 analyses, term-specific Schoenfeld residual tests suggested potential non-proportional hazards for baseline frailty status (p = 0.044), frailty transitions among participants robust at baseline (p = 0.049), and total FI tertiles (p = 0.006), whereas the corresponding global tests were non-significant. Time-varying and piecewise analyses generally showed that the associations were stronger early in follow-up and attenuated over time (Supplementary Tables SVII–SXIII). Secondary Model 3 estimates were broadly consistent with the primary results. MICE and alternative-cut-off analyses supported the main findings (Supplementary Tables SXIV–SXVIII). After excluding CMM events in the first 2 years, baseline associations persisted, whereas transition estimates were attenuated in the 2015 landmark analysis (Supplementary Tables SXIX–SXX).
Subgroup findings were generally consistent, although interactions were observed by age for baseline frailty (p = 0.045), by sex for transitions among participants who were pre-frail at baseline (p = 0.003), and by sex for total FI (p = 0.024) (Supplementary Tables SXXI–SXXVI).
Discussion
These findings identify baseline frailty, deterioration, and greater cumulative deficit burden as prospective markers of CMM risk. Under the assumed DAG, Model 2 estimates the total association after adjustment for prespecified baseline covariates. Model 3 additionally conditions on TG and HDL-C as lipid-metabolic pathway variables, CRP as an inflammatory pathway variable, and HbA1c as a glycemic pathway variable. It should therefore be interpreted as a secondary mechanistic/conditional analysis, not as a more fully adjusted causal model or evidence of mediation. Shared inflammatory, metabolic, and behavioral mechanisms may contribute [10–12]. Recovery from pre-frailty was associated with lower hazard of CMM and may aid risk stratification; observational data cannot establish that reversing frailty prevents CMM [13].
Limitations include self-reported disease ascertainment, residual confounding, substantial missingness and possible selection bias, and small numbers in uncommon transitions. The DAG represents assumed causal roles, and temporal ambiguity remains for some baseline behavioral and anthropometric covariates. Death could preclude CMM ascertainment and was not modeled as a competing event. Frailty change was represented by categories and total FI rather than continuous within-person change, and exact onset dates were unavailable. The consistency of the findings across the primary, lagged, and imputed analyses supports their robustness.
In conclusion, repeated FI assessment may help identify middle-aged and older adults at increased risk of developing CMM, but intervention studies are needed before causal prevention claims can be made.