Hypersplenism is a common disease with complicated pathogenesis that often occurs secondary to liver cirrhosis and splenomegaly. We observed through electron microscopy that the major pathological changes in spleen tissue of cirrhosis are extensive spleen fibrosis. Fibrosis is considered to be one of the important causes of hypersplenism [1]. Spleen fibrosis leads to increased mechanical damage of blood cells [2], resulting in peripheral cytopenias. A chemokine is a type of micro-molecule secreted polypeptide with a molecular weight of 8–12 kDa that directs the movement of chemotactic cells [3]. Chemokine CXC motif ligand 12 (CXCL12) is also known as stromal cell-derived factor 1 (SDF-1) or pre-B-cell growth-stimulating factor (PBSF). CXC chemokine receptor 4 (CXCR4) is a major fibrocyte chemotaxis receptor and is a receptor for CXCL12. CXCL12-CXCR4 can promote the proliferation of fibrocytes, formation of myofibroblasts, and extracellular matrix deposition, and accelerate the pathogenesis of fibrosis [4]. CXC chemokine receptor 7 (CXCR7) is a newly discovered receptor of CXCL12 [5]. Increased expression of CXCL12 and CXCR4 has been detected in fibrotic liver, and CXCL12-CXCR4 has been found to be involved in the pathogenesis of liver fibrosis [6]. However, the expression of CXCL12-CXCR4/CXCR7 in the spleen during liver cirrhosis and hypersplenism has not yet been reported. This study was designed to examine the expression of CXCL12-CXCR4/CXCR7 in splenomegaly of cirrhosis and its relationship with spleen fibrosis, thus providing new ideas for further study of the causes of cytopenia related to cirrhotic portal hypertension.
Methods
The animal model of liver cirrhosis and hypersplenism was first made in the model group with CCl4, and then the relevant indicators were detected and compared with the control group.
Specific pathogen-free (SPF) male inbred SD rats were purchased from Hunan SJA Laboratory Animal Co., Ltd. (China), CCl4 (analytical reagent) from Guangdong Guanghua Sci-Tech Co., Ltd. (China), peanut oil from Jiali Cereal & Oil Co., Ltd. (China), and 56% liquor from Baoding Qianmen Brewery (China). DAB staining solution (polymer method) was purchased from Beijing Zhongshan Jinqiao Biological Technology Co., Ltd. (China), PVDF membranes from Millipore (Germany), XCL12 (sc-2886), CXCR4 (sc-9046), and CXCR7 (sc-107515) antibodies from Santa Cruz (USA), HRP-conjugated goat anti-rabbit IgG from Jackson (USA). The lysis buffer, Super-GL hypersensitive electrochemical luminescence solution, total RNA extraction kit, universal reverse transcription kit, and ComSYBRqPCR Mix (with ROX) were obtained from Shanghai Novland Co., Ltd. (China). The NanoDrop-2000 Spectrophotometer was purchased from Thermo Fisher (USA), and the MX3000P real-time PCR instrument from Stratagene (USA). Primers were designed and synthesized by Shanghai Novland Co., Ltd. (China): CXCL12 sense primer 5′-GCATCAGTGACGGTAAGCCA-3′, antisense primer 5′-CTTTTCAGCCTTGCAACAATC-3′; CXCR4 sense primer 5′-AAGAAGCTGAGGAGCATGACAGAC-3′, anti-sense primer 5′-ACTGCTGTAAAGGTTGACGGTGTAG-3′; CXCR7 sense primer 5′-TCACC AGCACCTCCAGCTATAAG-3′, antisense primer 5′-TCGTTGTTGGAAGCAGATGTGAC-3′; GAPDH sense primer 5′-AAGGTCGGTGTGAACGGATTTG-3′, antisense primer 5′-TGTAGTTGAGGTCAATGAAGGGGTC-3′.
The model group was first made into an animal model of liver cirrhosis and hypersplenism with CCl4, and then the relevant indicators were detected and compared with the control group.
Development of liver cirrhosis and hypersplenism in animals
The rats in the control group were given 0.9% normal saline by gavage at a dose of 0.3 ml/100 g twice a week for 8 weeks; in the model group, 40% carbon tetrachloride (CCL4) peanut oil solution was administered by gavage twice a week (0.3 ml/100 g) for 8 weeks to establish a liver cirrhosis and hypersplenism model.
Pathological diagnosis
All samples were first fixed with 10% formalin. The liver and spleen tissues were then dehydrated, cleared, embedded in paraffin, cut into 4 µm serial sections, attached to polylysine-treated coverslips, and stained with HE and Masson’s trichrome. The diagnosis of cirrhosis and splenomegaly was further confirmed by two physicians from Hainan Provincial People’s Hospital.
Measurement of collagen fiber expression in the spleen by Masson’s trichrome staining
The spleen sections were deparaffinized and hydrated, transferred into Bouin liquid for treatment at room temperature overnight or for mordanting in a 37°C incubator for 2 h, and then washed with running water until the yellow color disappeared. Subsequently, the sections were stained dropwise with celestine blue for 2–3 min, and then briefly washed with water. Then, the samples were stained dropwise with Mayer’s hematoxylin for 2–3 min and briefly washed with water, followed by differentiation in 1% hydrochloric acid-ethanol solution for a few seconds, and then by washing with running water for 10 min. The sections were stained dropwise with Ponceau acid fuchsin staining solution for 10 min, and then briefly washed with distilled water, followed by treatment with 1% phosphomolybdic acid for approximately 10 min. After the supernatant was decanted, the sections were next stained dropwise with 2% aniline blue for 5 min without washing, then treated with 1% aqueous solution of glacial acetic acid for 2 min, and finally dehydrated and cleared. The collagen fibers appeared blue, the muscle fibers, cytoplasm, cellulose, keratin, and red blood cells appeared red, and the nucleus appeared blue-brown under the optical microscope. Five to six non-overlapping fields were observed for each tissue sample under a 200 × optical microscope. The percentage of blue-stained area was calculated using Image-Plus 6.0, and the mean was taken for each section.
Immunohistochemical detection of expression of the CXCL12-CXCR4/CXCR7 chemokine axis in the spleen
The spleen sections were deparaffinized and hydrated, retrieved with pH 6.0 citrate buffer at high temperature and high pressure, blocked with 3% H2O2 solution for 10 min, incubated with CXCL12, CXCR4, and CXCR7 primary antibodies (1 : 100 dilution) at 37°C for 1 h, and then incubated with secondary antibody (poly-HRP-conjugated goat anti-mouse/rabbit IgG) at 37°C for 15 min. The samples were then developed with diaminobenzidine (DAB) for 5 min, counterstained with hematoxylin for 1 min, differentiated in 1% hydrochloric-acid alcohol solution for a few seconds, washed with running water for 5 min, and then dehydrated, cleared, and finally mounted. The above procedure was repeated three times. For staining of each group, the primary antibodies were replaced with PBS buffer as a negative control. Five to six non-overlapping high-power significantly positive fields (× 400) were randomly selected for each image (1600 × 1200 pixels). The expression of CXCL12, CXCR4, and CXCR7 was semi-quantified by Image Pro Plus 6.0 software. The average optical density (OD = 1 OD × 1000/area) and positive cell rate (Positive cell rate = Positive cell count/Total cell count × 100%). The measurements of three sections for each sample were averaged.
Western blotting
Each spleen sample was treated with 30 µl of cell lysis buffer, and the lysate was transferred to a new centrifuge tube. Next, 10 µl of sample (5 µg/µl) was mixed with 10 µl of 2×SDS-PAGE loading buffer, heated at 100ºC for 5 min, cooled on ice, and centrifuged at 12 000 g for 5 min. Insoluble precipitates were removed. The sample volume per well was 20 µl (the total amount of protein was 50 µg). Proteins were separated by 10% SDS-PAGE, and transferred onto PVDF membranes by semi-dry electrophoresis at 30 mA for 60 min. The PVDF membranes were blocked with blocking buffer at 4ºC overnight, incubated with CXCR3, CCR5, and CCR3 primary antibodies (1 : 200) at 37ºC for 2 h, and then incubated with horseradish peroxidase-conjugated secondary antibody (1 : 2000) at 37ºC for 2 h. Finally, after chemiluminescent detection using the hypersensitive luminescence solution, the membranes were developed, fixed, and photographed using a gel imaging system. The images were analyzed by Gel-Pro Analyzer software. The results were presented as the ratios of target proteins to GAPDH.
Quantitative real-time PCR (qRT-PCR)
Total RNA was extracted and purified in accordance with the manufacturer’s instructions. Total RNA purity was measured using a spectrophotometer with 2 µl of sample RNA. The A260/A280 was found to be 1.9–2.1, indicating high purity, without DNA or protein pollution. The reverse transcription reaction mixture contained 2 µl of sample RNA, 10 µl of 2 × reverse transcriptase buffer, 1 µl of oligdT (20 µmol/µl) reverse transcription primer, 0.2 µl of MMLV (200 U/µl) reverse transcriptase, and DEPC water to 20 µl total volume. The reaction conditions were 42 C for 30 min followed by 85°C for 10 min. The qRT-PCR system consisted of 10 µl of 2 × quantitative PCR Master Mix, 0.08 µl of 20 µmol/µl upstream primer, 0.08 µl of 20 µmol/µl downstream primer, 2 µl of cDNA template, and dd H2O water to 20 µl total volume. The reaction conditions were as follows: 95°C for 3 min, 95°C for 12 s, and 62°C for 40 s (40 cycles). Gene expression was compared between groups using the ∆∆CT method.
Ethical approval and consent to participate
The animals, content, and papers submitted for this study were reviewed and approved by the Ethics Committee of Hainan General Hospital. It does not violate laws and regulations. See Med-Eth-Re [2019] No. 58.
Statistical analysis
SPSS 25.0 software was used for statistical analysis. Measurement data were presented as x ± s. Between-group comparisons were analyzed using the independent samples t-test. Correlation was analyzed with Pearson’s correlation coefficient. P < 0.05 was considered statistically significant.
Results
Changes in spleen index
Spleen index = spleen weight (mg)/body weight (g). The spleen index of the model group was 3.14 ±0.98, and the spleen index of the control group was 2.33 ±1.03. The difference between the two groups was statistically significant (t = –2.351, p < 0.05). It showed that the spleen index and spleen of the model group were significantly increased.
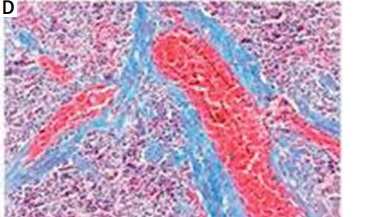
Pathological changes in rat spleens
In rats in the control group, the spleen tissue had a normal structure and organization and slight fiber deposition; the fibrosis area accounted for 2.83 ±1.14% of the total area. In rats in the model group, the spleen tissue had a disordered structure and organization, obvious vascular endothelial thickening, vascular endothelial proliferation, an expanded blood pool within the red pulp, expansion of the splenic sinus, significant proliferation of splenic fibrous tissue, and varying degrees of central arterial wall thickening with extensive collagen fiber deposition; the proliferative collagen fibers gradually spread into the splenic cord, merging to form meshes or plaques. In this group, the fibrosis area accounted for 11.17 ±3.39% of the total area, which was significantly higher than that of the control group (t = –8.151, p < 0.01) (Figure 1).
Changes in peripheral blood cell counts in rats
Compared with the control group, peripheral blood RBC, PLT and Hb counts were significantly lower in the model group (p < 0.05), while the WBC count was significantly higher (p < 0.01) (Table I).
Table I
Changes in peripheral blood cell counts (**p < 0.01, *p < 0.05)
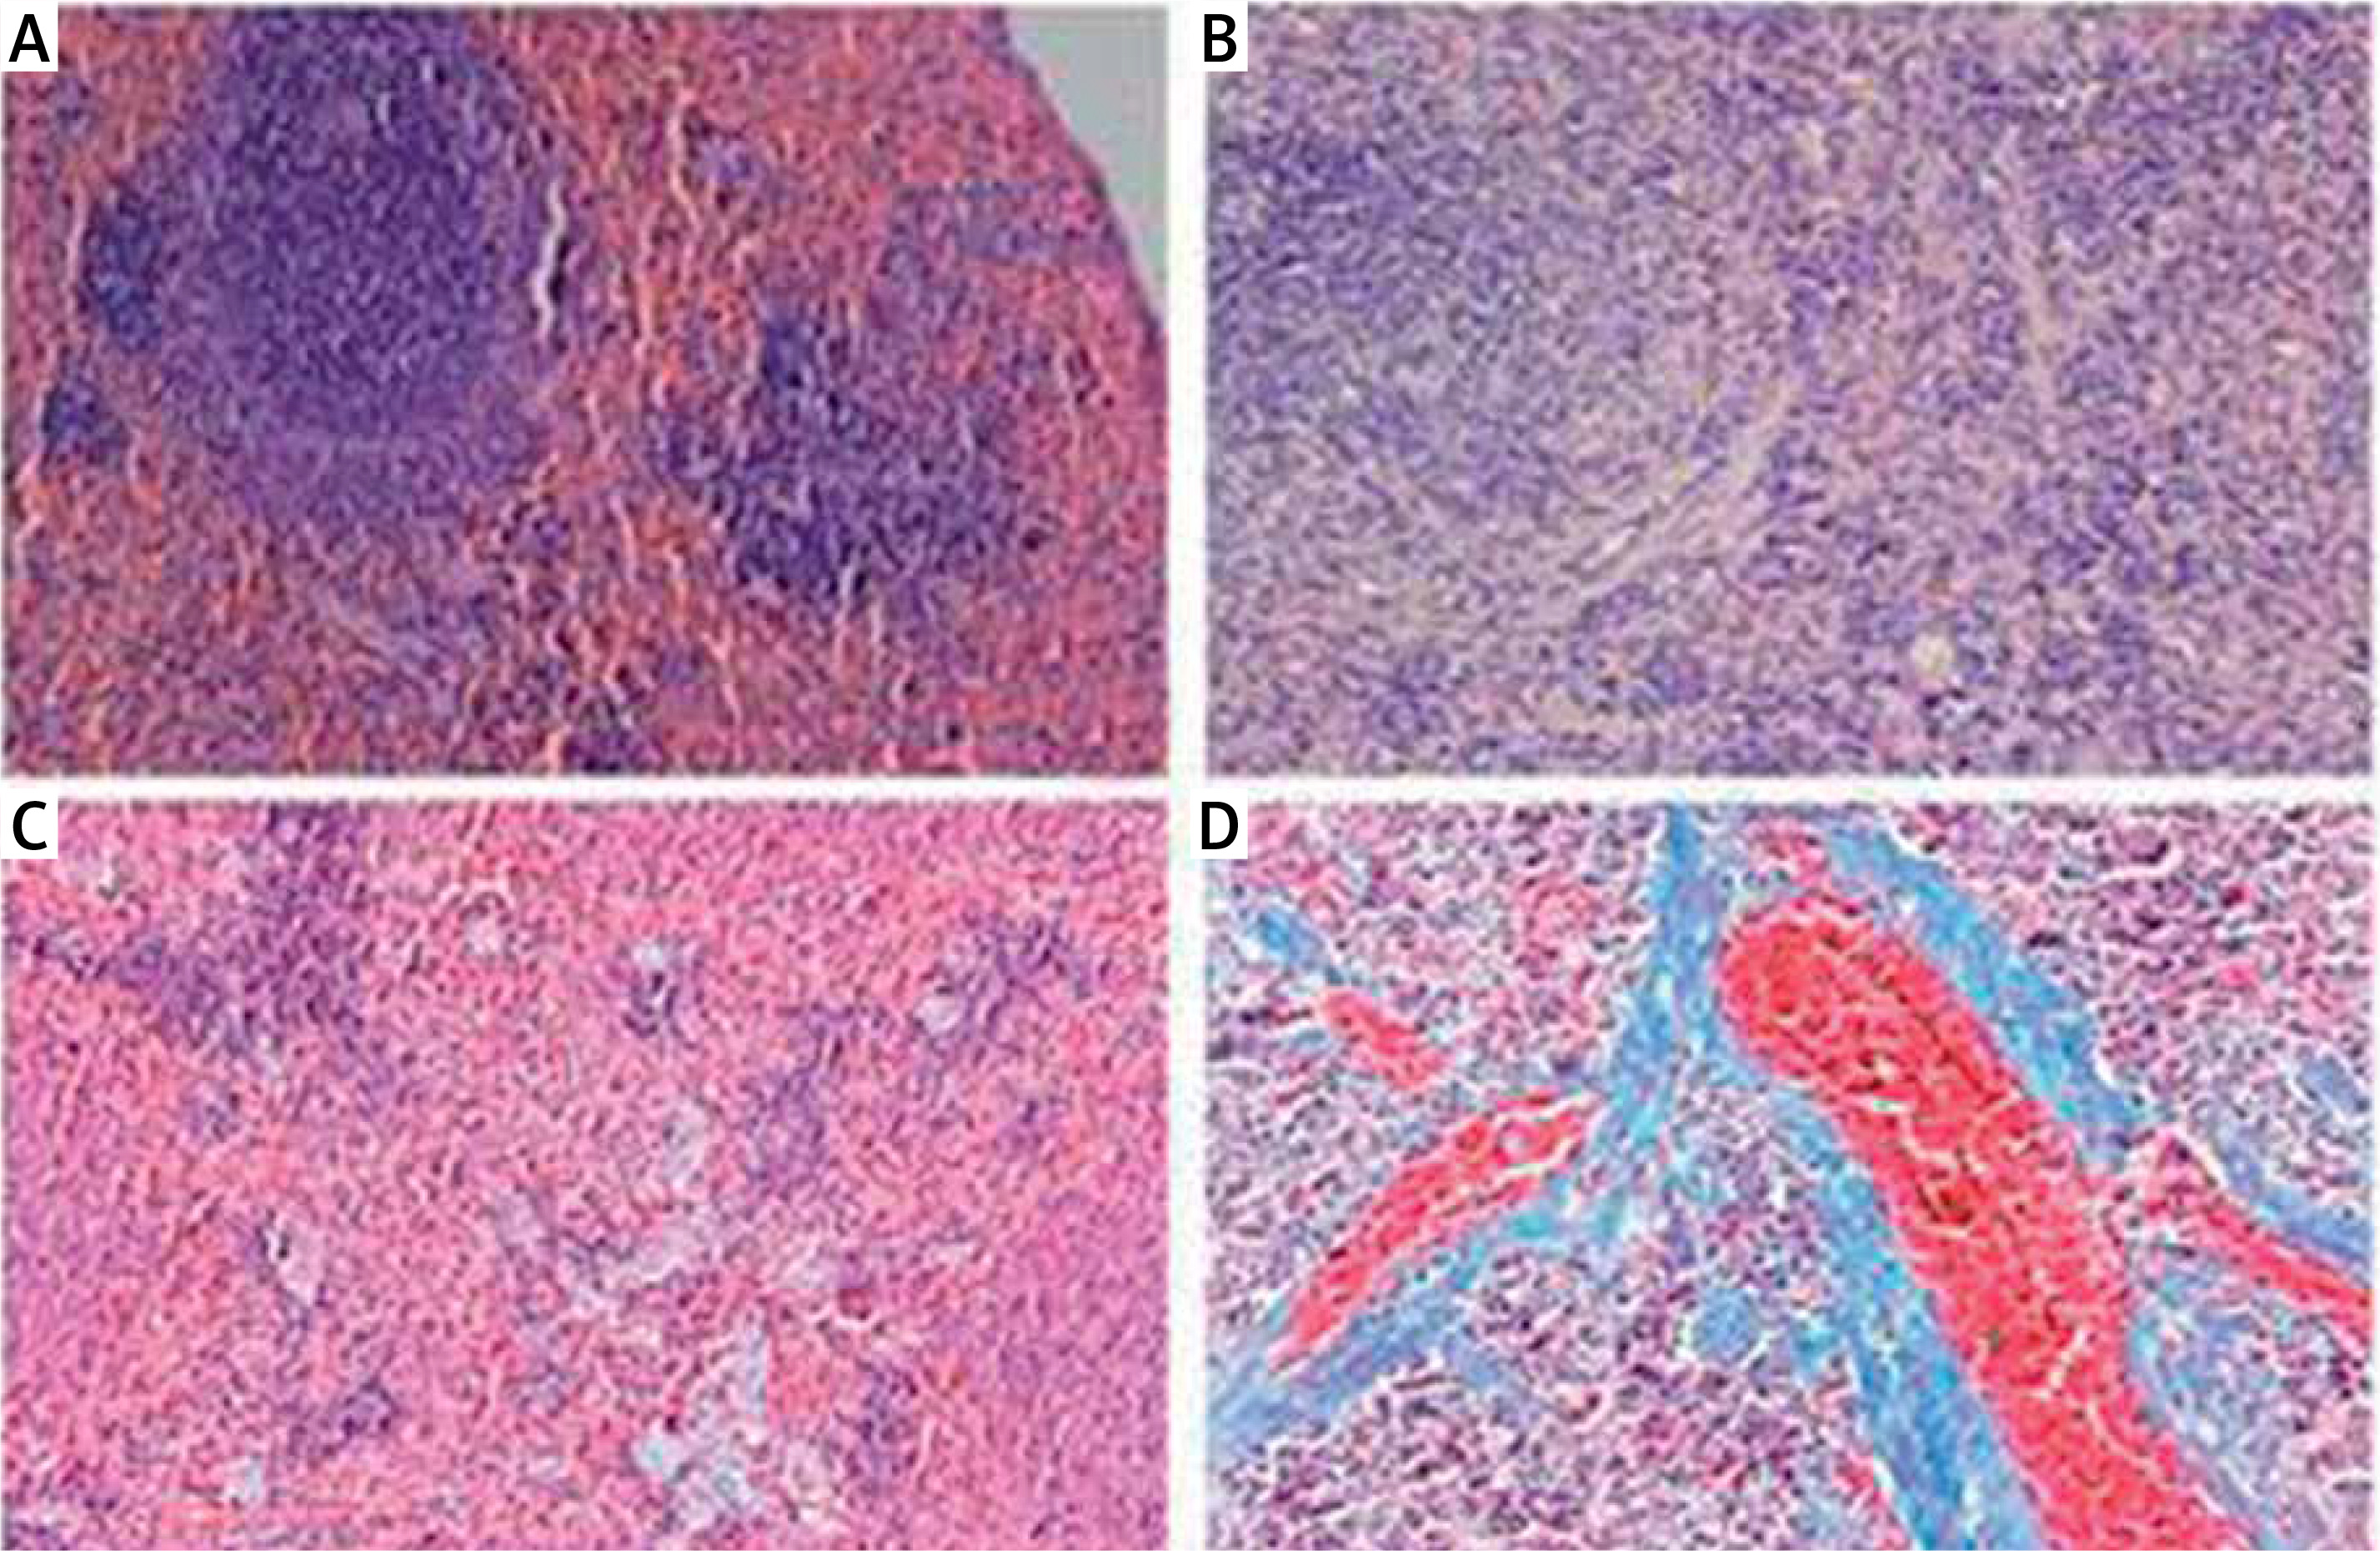
Spleen immunohistochemistry results
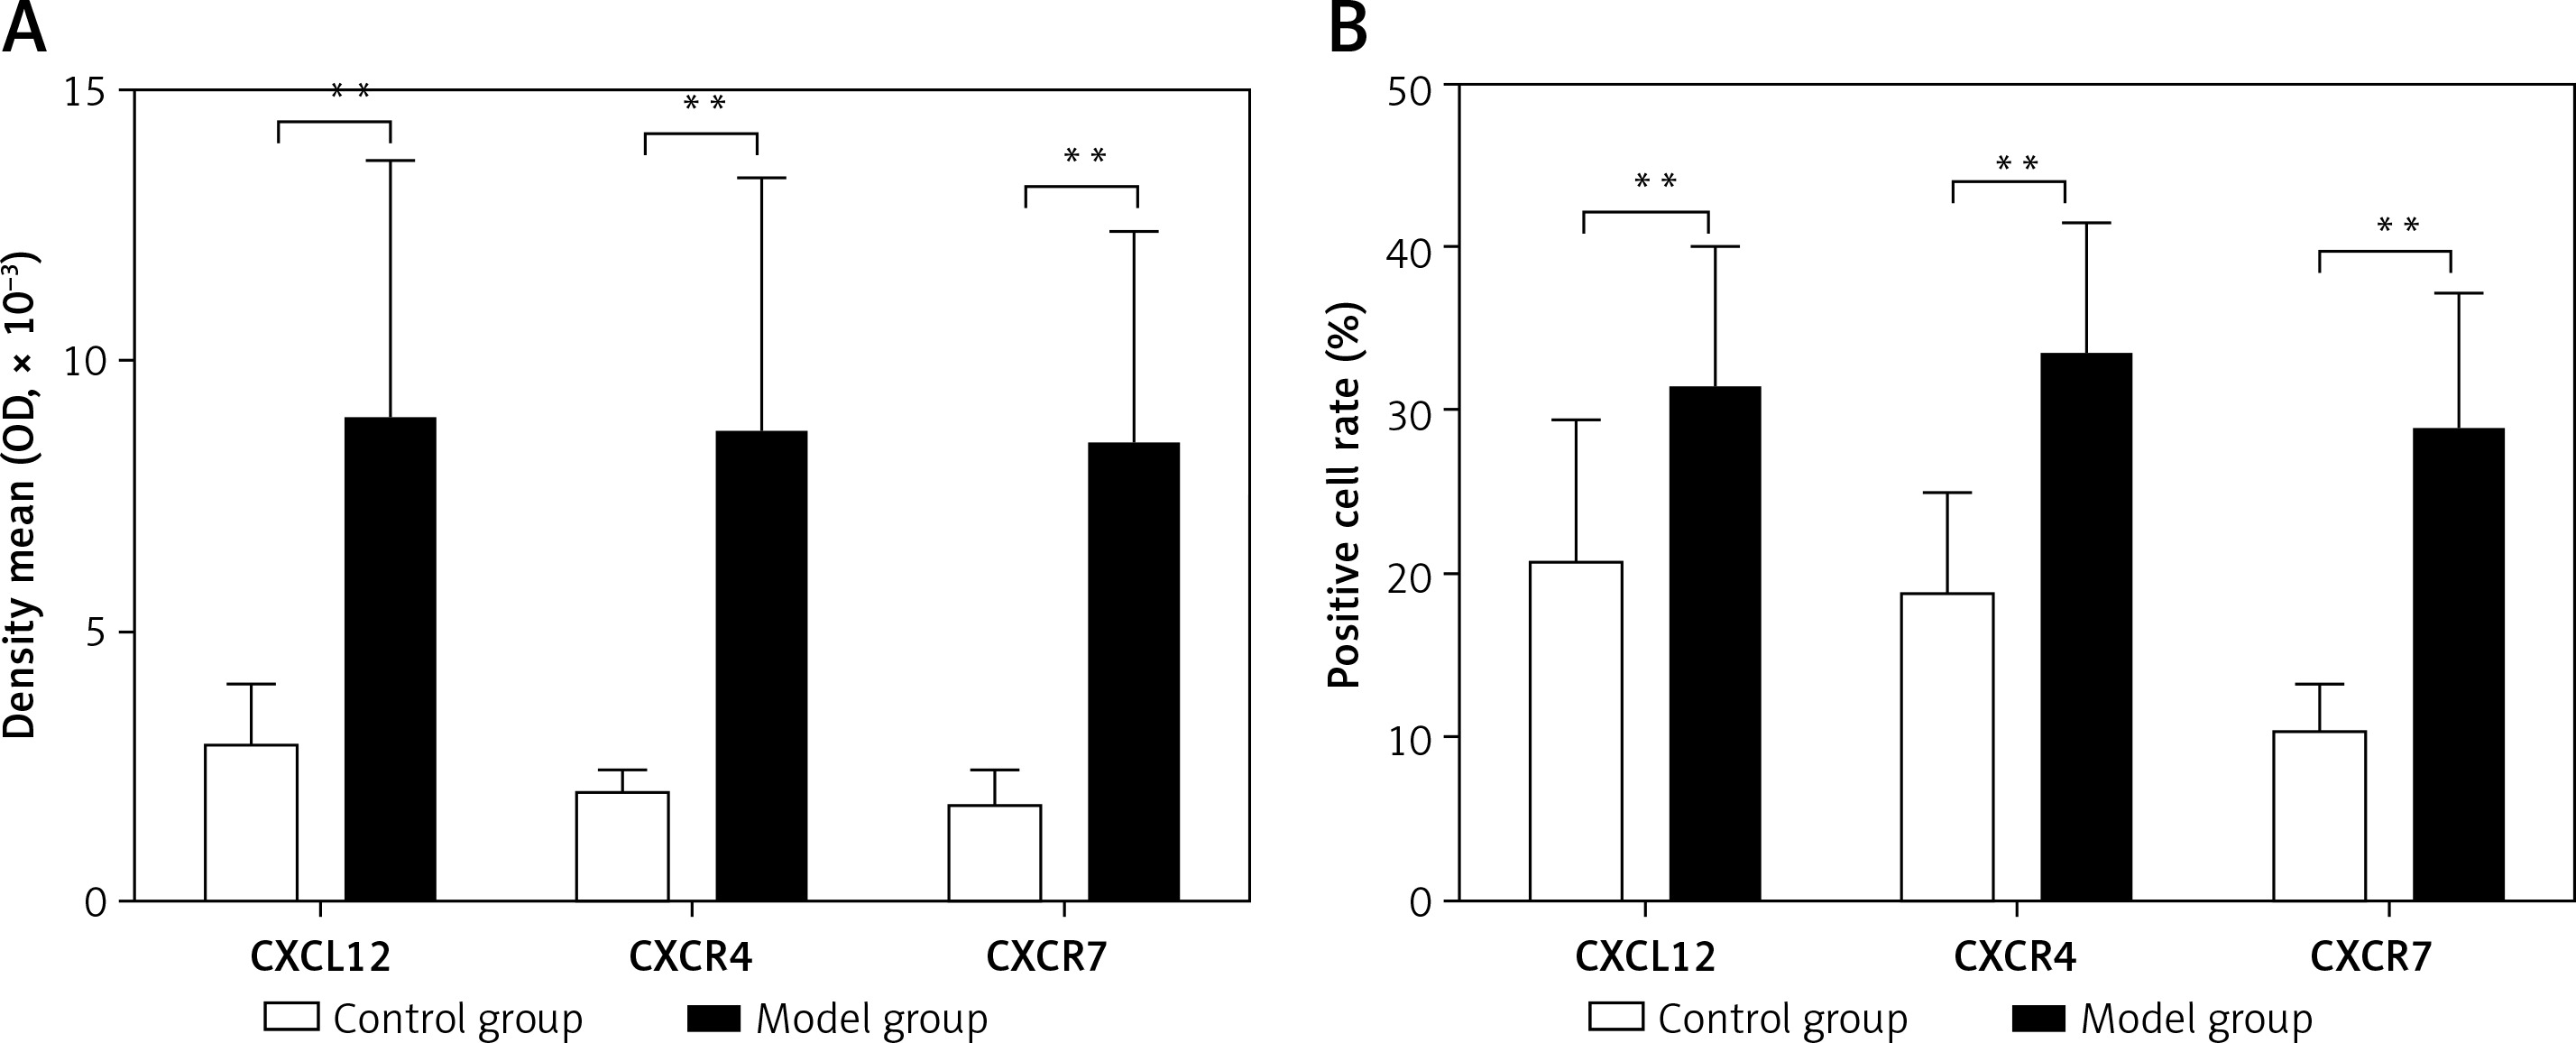
CXCL12, CXCR4, and CXCR7-positive cells showed yellow-, brown-, or dark brown-stained membranes and/or cytoplasm, and were mainly located in the subcapsular region, red pulp, and marginal zone (Figure 2). The average optical densities of CXCL12, CXCR4, and CXCR7 were 2.89 ±1.11 × 10⁻³, 2.03 ±0.45 × 10⁻³, and 1.81 ±0.69 × 10⁻³, respectively, in the control group, which were significantly lower than those in the model group (8.89 ±4.89 × 10⁻³, 8.78 ±4.67 × 10⁻³, and 8.47 ±3.97 × 10⁻³; t = 4.126, p < 0.01; t = 4.973, p < 0.01; t = 5.644, p < 0.01). The positive cell rates of CXCL12, CXCR4, and CXCR7 were 20.62 ±8.88%, 18.81 ±6.23%, and 10.49 ±2.99%, respectively, in the control group, which were significantly lower than those in the model group (31.02 ±9.03%, 33.22 ±8.31%, and 28.89 ±8.40%; t = –3.112, p < 0.01; t = –4.170, p < 0.01; t = –6.293, p < 0.01) (Figure 3).
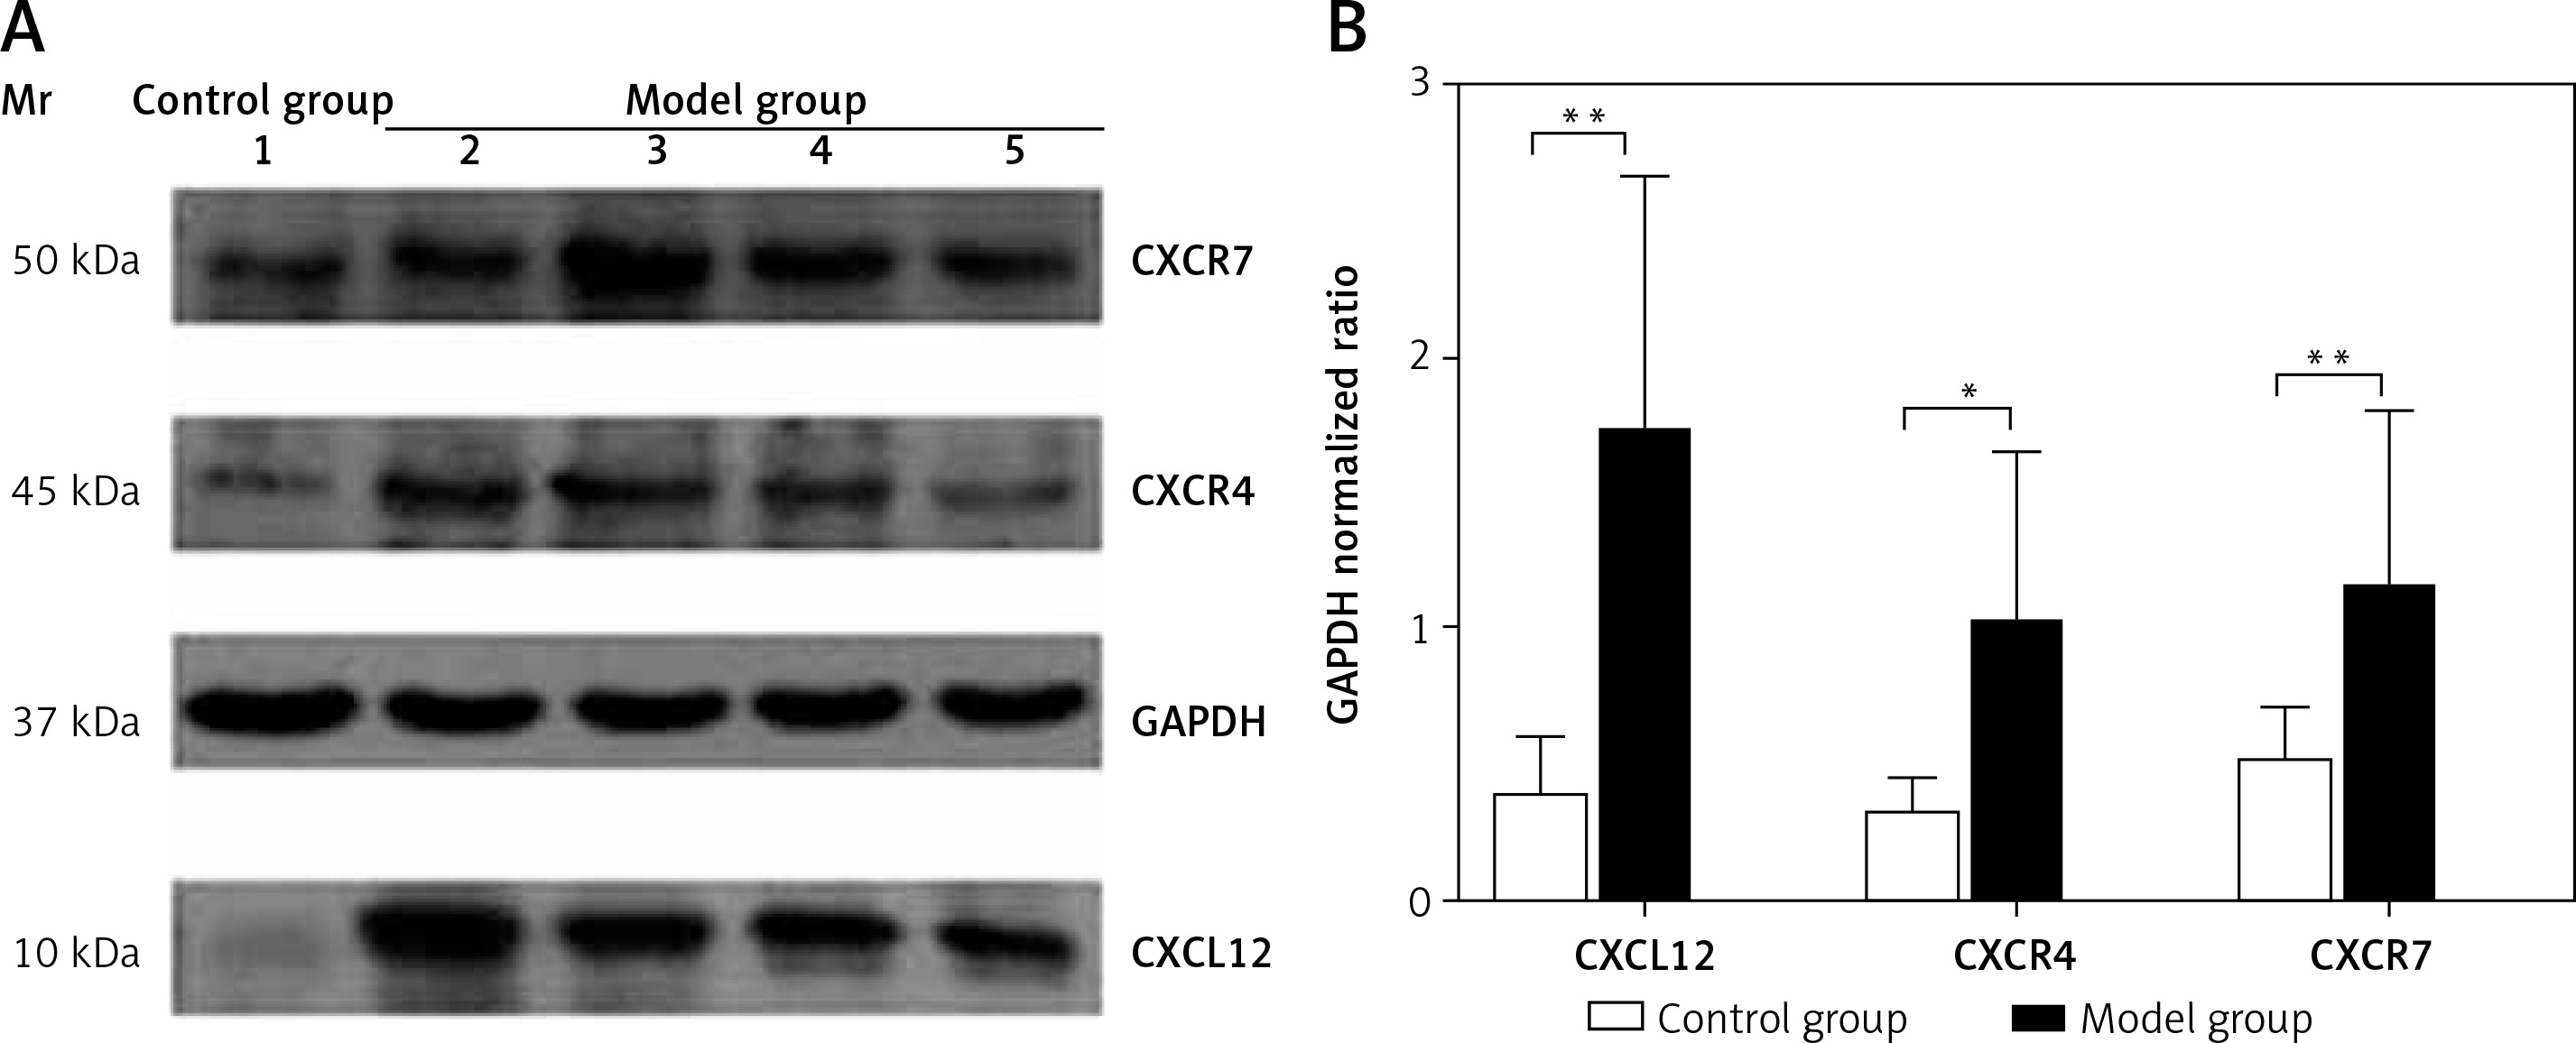
Spleen Western blotting results
The protein expression levels of CXCL12, CXCR4, and CXCR7 in the spleen were 0.39 ±0.21, 0.32 ±0.13, and 0.51 ±0.21, respectively, in the control group, which were significantly lower than those in the model group (1.71 ±0.96, 1.02 ±0.63, and 1.15 ±0.66; t = 4.735, p < 0.01; t = 2.639, p < 0.05; t = 3.152, p < 0.01) (Figure 4). As assessed by Pearson’s correlation coefficient, the protein expression of CXCL12, CXCR4, and CXCR7 was positively correlated with the spleen fibrosis area (r = 0.688, p < 0.01; r = 0.711, p < 0.01; r = 0.579, p < 0.01).
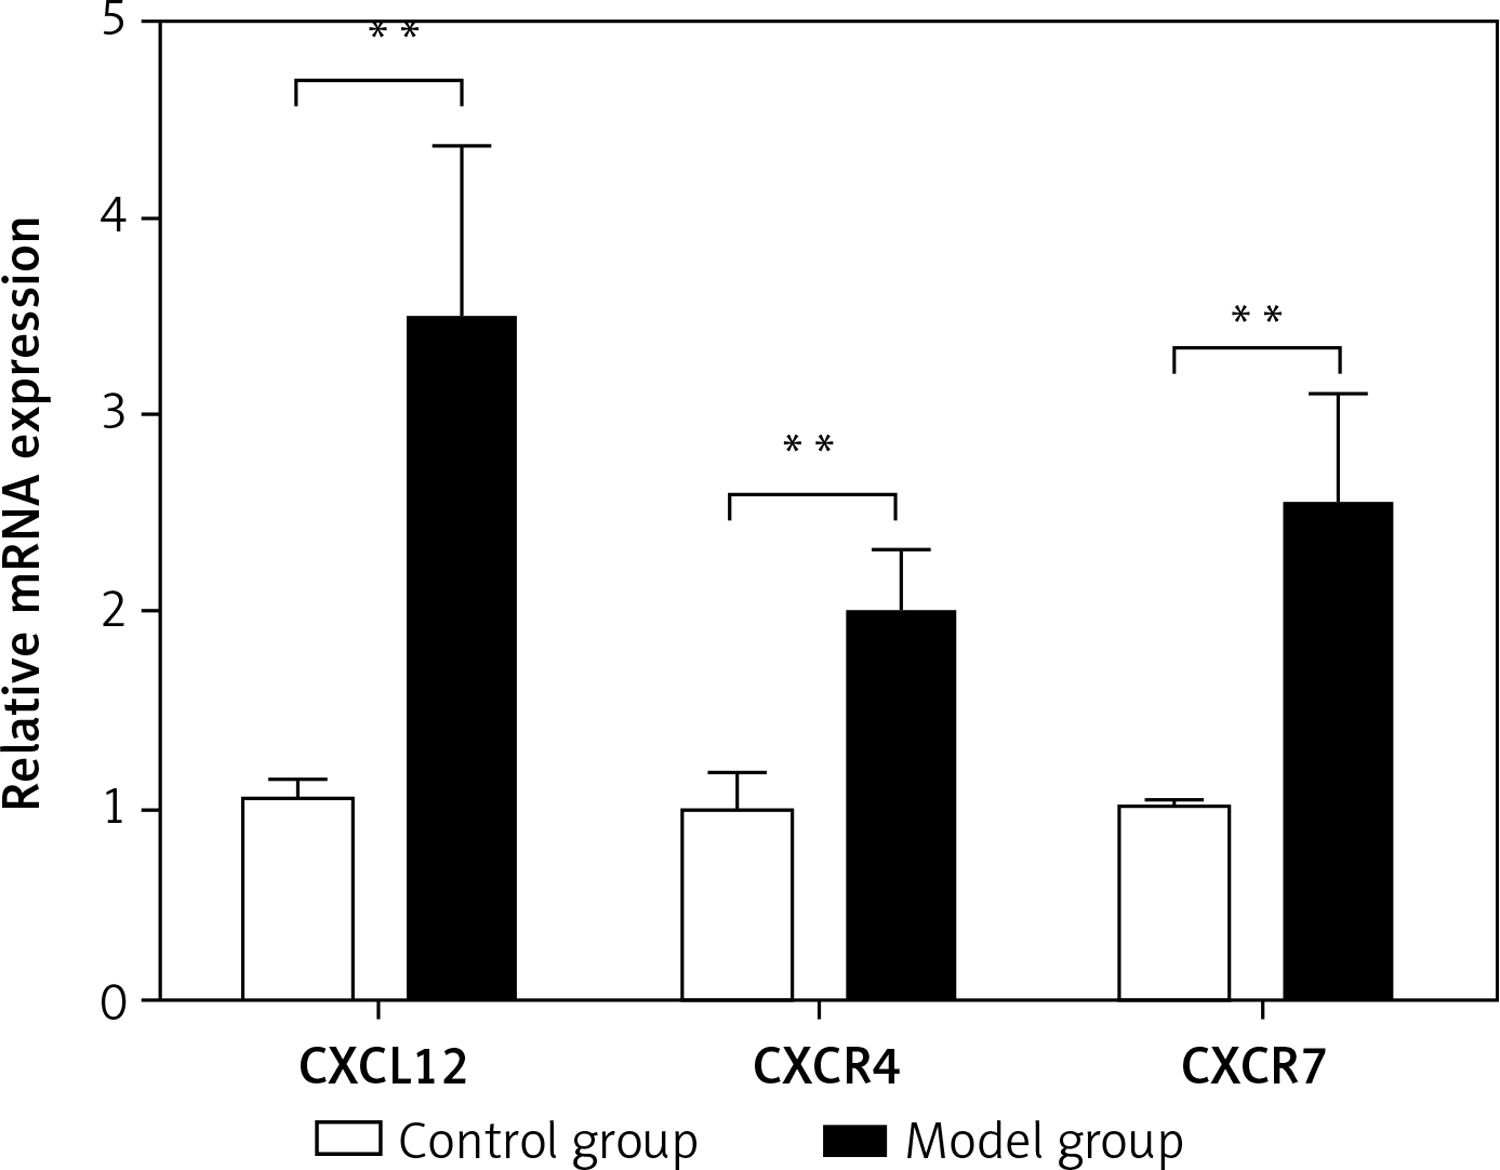
Spleen qRT-PCR results
The relative mRNA expression of CXCL12, CXCR4, and CXCR7 in the spleen was 1.05 ±0.10,1.00 ±0.18 and 1.02 ±0.02, respectively, in the control group, and was significantly lower than the values in the model group (3.48 ±0.90,1.99 ±0.34 and 2.53 ±0.59; t = –9.607, p < 0.01; t = –10.460, p < 0.01; t = –9.259, p < 0.01) (Figure 5). As assessed by Pearson’s correlation coefficient, the relative mRNA expression of CXCL12, CXCR4, and CXCR7 was positively correlated with the spleen fibrosis area (r = 0.694, p < 0.01; r = 0.647, p < 0.01; r = 0.609, p < 0.01).
Discussion
The RBC, PLT, and Hb levels were significantly decreased (p < 0.05), particularly PLT (p < 0.01), in the model group. These findings are substantially similar to conditions in human cirrhotic portal hypertension with hypersplenism [7]. The significantly increased WBC count in the model group may be related to unresolved inflammation.
CXCL12 interacts with its receptor CXCR4/CXCR7 to form a coupled molecular pair closely related to inter-cell communication and cell migration; this is referred to as a chemokine axis. The CXCL12-CXCR4/CXCR7 chemokine axis plays an important role in growth and development, including hematopoietic function, blood vessel formation, and tissue repair. In this study, as assessed by immunohistochemistry, Western blotting and qRT-PCR, both the protein and mRNA expression levels of CXCL12, CXCR4, and CXCR7 in the spleen were significantly higher than those in normal rats, indicating severe fibrosis in the enlarged spleen. This finding is consistent with the pathological findings revealed by Masson’s trichrome staining. Correlation analysis showed that both the relative protein and mRNA expression levels of CXCL12, CXCR4, and CXCR7 were positively correlated with the degree of spleen fibrosis. The more severe the spleen fibrosis, the higher the relative expression levels of CXCL12, CXCR4, and CXCR7. In other words, the degree of spleen fibrosis may also be estimated by the relative expression of CXCL12, CXCR4, and CXCR7. Chu et al. [8] also found increased collagenous and elastic fibers in the enlarged spleen under an optical microscope. Accumulation of fibrocytes and expansion of the fibrotic area depend on the pathological response of fibrocytes to the chemokine ligand, suggesting that the CXCL12-CXCR4/CXCR7 chemokine axis may be related to the occurrence and progression of fibrosis in the enlarged spleen in liver cirrhosis.
CXCL12-CXCR4 can promote the proliferation of fibroblasts [4, 6], and the increase in fibrotic spleen tissue is understandable. The exact cause of the significantly increased expression of CXCL12-CXCR4/CXCR7 is not clear, but it may be related to activation of the CXCL12-CXCR4/CXCR7 signaling pathway. The expression of angiogenesis- and fibrosis-related cytokines, such as vascular endothelial growth factor (VEGF) and transforming growth factor β1 (TGF-β1), has been found to be significantly increased in the spleen in portal hypertension with hypersplenism [9]. The CXCL12-CXCR4/CXCR7 pathway can be activated by VEGF and TGF-β1 [10]. It is speculated that, in hypersplenism, CXCL12-CXCR4/CXCR7 is activated by multiple disordered cytokines to activate downstream signaling pathways, thereby ultimately promoting blood sinus proliferation and spleen fibrosis. Jak2-Stat3 is a signaling pathway downstream of CXCL12-CXCR4, and can be activated by CXCL12-CXCR4 [11]. It has been reported that, in portal hypertension with hypersplenism, the Jak2-Stat3 signaling pathway is activated, leading to an increase in some profibrotic cytokines, such as TGF, fibroblast growth factor (FGF), and VEGF, thereby resulting in activation of spleen fibroblasts, and prompting spleen fibrosis [12]. Moreover, CXCL12/CXCR4 can also regulate fibrocytes via signal conversion and activation of the MAPK, PI3K, and AKT signaling pathways [13].
Blood cells can only enter the splenic vein through the basement membrane pores between the splenic cord and blood sinus. These pores are only 2–3 µm in diameter, while erythrocytes and leukocytes are 7–12 µm in diameter. Therefore, blood cells must be extremely deformed to pass the pores. However, in patients with cirrhosis, blood cells usually cannot pass the pores due to poor deformability, and thus are retained in the splenic cord for a long period and destroyed by macrophages. After spleen fibrosis, the normal structure of the spleen is destroyed, the basement membrane pores become smaller, and even closed; as a result, a large number of blood cells are retained in the splenic cord, leading to more severe splenomegaly and macrophage destruction of blood cells. Moreover, the proliferation of fibrous tissues will also lead to increased mechanical damage of blood cells, resulting in severe peripheral cytopenias [14].
It has been reported in the literature that proliferation of fibrous tissue was observed in the enlarged spleen with liver cirrhosis under an optical microscope. However, it is not supported by objective experimental evidence. By constructing an animal model of splenomegaly with liver cirrhosis, and confirming fibrosis by immunohistochemistry, Western blotting, and gene levels, this study provides good evidence for the proliferation of fibrous tissue in the enlarged spleen with liver cirrhosis.
The occurrence and development of splenic fibrosis is a complex pathological process. After a large amount of splenic fibrosis, the space (pore) of the blood sinus wall narrows, the cell filtration rate decreases, blood cells cannot enter and exit the blood sinus wall pore normally, and the blocked blood cells in the red pulp blood sinus have enough time to be captured, engulfed and destroyed by phagocytes, dendritic cells, lymphocytes, monocytes and neutrophils, leading to the reduction of peripheral blood cells [15]. Tuftsin has enhanced phagocytosis. Peripheral blood cytopenia is an important indicator for diagnosing hypersplenism. The high expression of the CXCL12-CXCR4/CXCR7 chemokine axis plays an important role in this process. If there is a way to block the activated CXCL12-CXCR4/CXCR7 signal pathway, it is possible to slow down or reduce splenic fibrosis, keep the blood sinus wall hole normal, leave the blood cells in and out of the wall hole unaffected, and reduce the incidence of natural hypersplenism. This study should provide a new idea for research on the etiology and treatment of hypersplenism due to cirrhosis.
In conclusion, the expression of CXCL12-CXCR4/CXCR7 in liver cirrhosis and splenic fibrosis of rats is abnormally high. There are no previous research data in this area. The increased expression of CXCL12-CXCR4/CXCR7 is related to the degree of splenic fibrosis. This shows that it participates in the whole process of liver cirrhosis and splenic fibrosis. CXCL12-CXCR4/CXCR7 can be used to evaluate the area and degree of splenic fibers. Blocking the CXCL12-CXCR4/CXCR7 signal pathway may slow down or reduce the process of splenic fibrosis and reduce the occurrence of hypersplenism. To provide new ideas for research on the etiology and treatment of splenic fibrosis in cirrhosis and portal hypertension.