Introduction
Nonalcoholic fatty liver disease (NAFLD), a prevalent chronic liver condition characterized by abnormal fat buildup in the liver, is closely associated with metabolic syndrome [1]. The prevalence of NAFLD is continuously on the rise, with around 25% of the global population currently affected [2]. As a result, NAFLD has become a significant public health concern [3, 4]. In 2020, it was suggested that the name and description of NAFLD should be changed to metabolic dysfunction related steatotic liver disease (MASLD) and that at least one of five cardiometabolic risk factors should be present. This would better reflect the cause of the disease. The term “steatotic liver disease” (SLD) was kept to include all the different causes of steatosis, such as MASLD, MetaALD (people with MASLD who drink more alcohol), other specific etiology SLD (such as alcoholic liver disease (ALD), drug-induced liver injury (DILI), and monogenic diseases), and cryptogenic SLD (with no metabolic parameters and no known cause) [5]. Oxidative stress (OS) plays a significant role in MASLD, as indicated by a recent study [6]. It is characterized by an imbalance between pro-oxidants and antioxidants, which leads to more reactive oxygen species (ROS) in redox processes. ROS can damage lipids, proteins, and DNA through oxidative damage [7, 8]. Prior research has shown that higher intake of certain nutrients, such as calcium, vitamins E, D and C, zinc, magnesium, and selenium, reduces the risk of OS. In contrast, bad habits such as smoking and drinking too much alcohol increase the production of reactive oxygen and nitrogen species (RONS), which speeds up the cell harm associated with OS [9–11]. However, because pro-oxidants and antioxidants work with each other in a complicated way, a single OS-related factor has a small impact on the oxidative/antioxidant system. The oxidative balance score (OBS) was created to measure a person’s oxidative and antioxidant state. It has two parts: the dietary OBS and the lifestyle OBS [12].
OBS is negatively associated with a variety of diseases, such as metabolic syndrome, hypertension, chronic kidney disease, and so on. However, few observational studies have investigated the association of OBS risk with MASLD and fibrosis. The study hypothesized that the OBS, including dietary OBS and lifestyle OBS, is negatively correlated with MASLD and MASLD-related fibrosis. However, based on analysis of data from the National Health and Nutrition Examination Survey (NHANES), this study suggested a different outcome.
Material and methods
Study population
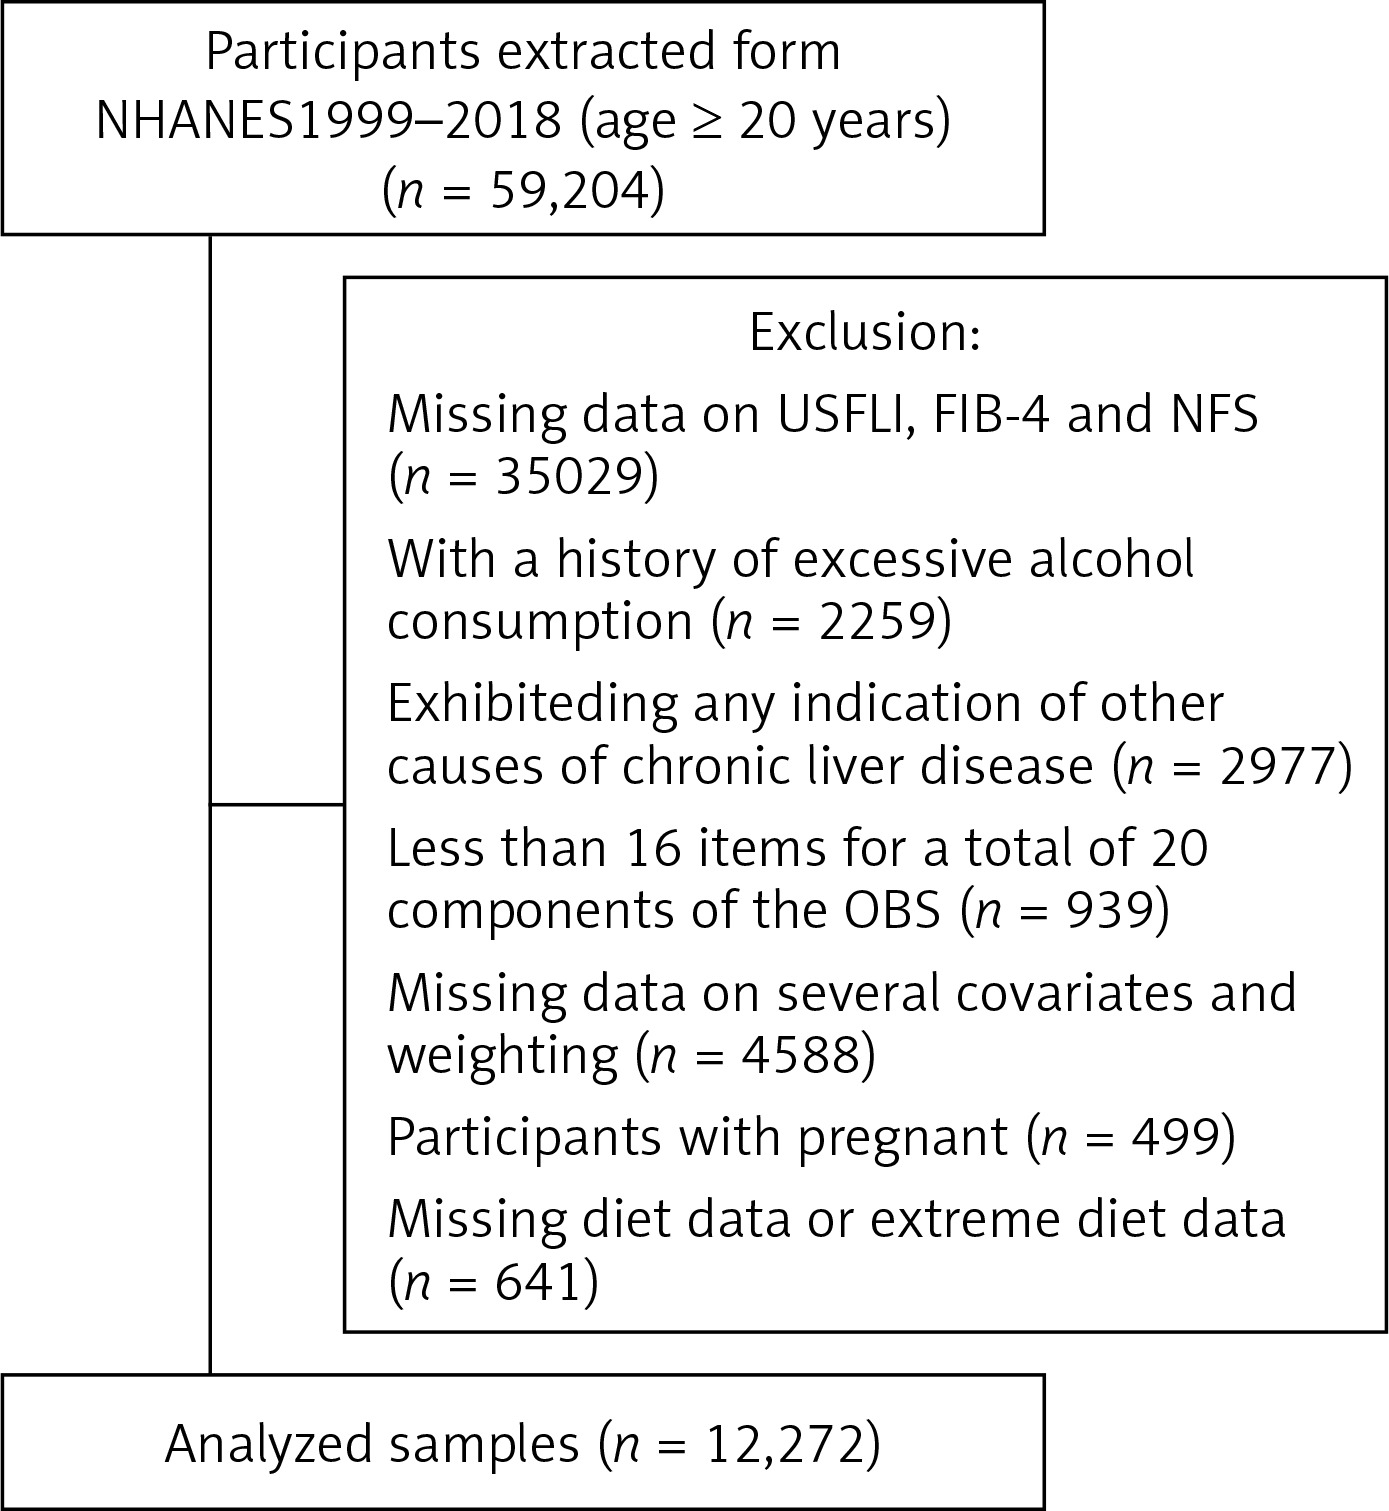
This cross-sectional study included subjects from the nationally representative consecutive NHANES 1999-2018. To ensure a representative sample, we consolidated sociodemographic information, personal life history, dietary records, and laboratory data from ten cycles of the NHANES. Of the 59,204 subjects aged 20 years or older in the NHANES 1999-2018, individuals were excluded if (1) there was missing data on the US fatty liver index (US FLI), Fibrosis-4 Index (FIB-4) or NAFLD fibrosis score (NSF) (n = 35,029); (2) they had a history of excessive alcohol consumption (> 2 drinks/day and > 3 drinks/day for women and men respectively) (n = 2259); (3) they exhibited any indication of other causes of chronic liver disease such as MetALD, viral hepatitis infection, autoimmune hepatitis, liver cancer or cryptogenic SLD (n = 2977); (4) there were less than 16 items for a total of 20 components of the OBS (n = 939); (5) there were missing data on several covariates and weighting (n = 4588 ); (6) we further excluded 499 pregnant participants, and 641 participants who had missing diet data or extreme diet data (total energy intake of < 800 or > 4200 kcal day−1 for males and < 500 or > 3500 kcal day−1 for females). The percentage of missing data for each covariate was less than 5%, so missing values were not imputed. Ultimately, a total of 12,272 subjects were enrolled in this research (Figure 1).
The National Center for Health Statistics’ Ethical Review Committee approved NHANES, and all participants provided written informed consent. This research adhered to the applicable guidelines and regulations (https://www.cdc.gov/nchs/data_access/restrictions.htm).
MASLD and liver fibrosis assessment
The US fatty liver index (USFLI) was used to define MASLD in this study and was derived specifically for the NHANES database, with a cut-off of 30 to define MASLD [13]. In addition, we calculated the Fibrosis-4 (FIB-4) score and MASLD fibrosis score (NSF) to assess liver fibrosis, and participants with FIB-4 scores ≥ 2.67 or NFS > 0.676 were considered to have liver fibrosis [14]. The formulas of USFLI and FIB-4 can be found in Supplementary Table SIII.
Oxidative balance score
The OBS was determined by adding up the numbers for each of the four lifestyle factors and the 16 nutrients, which include 5 pro-oxidants and 15 antioxidants. We found out how much of 16 nutrients people ate, such as fiber, total fat, carotene, riboflavin, niacin, calcium, zinc, magnesium, copper, selenium, iron, total folate, vitamins B12, C, and E, by asking people to remember what they ate for 24 h. The estimate did not take into account dietary supplements or medicine sources. Physical exercise, body mass index (BMI), alcohol use, and smoking (nicotine amounts) were all lifestyle-based OBS factors [9]. Total fat, iron, drinking alcohol, smoking, and BMI were all thought to be pro-oxidants. Three groups were made up of people who drank alcohol: heavy drinkers (15 g/day for women and 30 g/day for men), light drinkers (0 to 15 g/day for women and 0 to 30 g/day for men), and nondrinkers. The questions in this section covered lifetime and recent (past 12 months) use of alcohol for ages 20 years and over. Each group was given a score between 0 and 1, and the nondrinkers were given a score of 2 [9]. Then, the other parts were split into three groups based on their tertile. Antioxidants were assigned a score on a scale from 0 to 2, with the lowest tertile (tertile 1) receiving 0 points, the middle tertile (tertile 2) receiving 1 point, and the highest tertile (tertile 3) receiving 2 points. In contrast, the scoring for prooxidants was structured in an inverse manner. The highest tertile, which represents the greatest concentration or presence of prooxidants, was assigned 0 points, and the lowest tertile was given 2 points, reflecting the higher score for lower levels of prooxidants [9]. The groups were then split into two groups based on sex. The protective effect is stronger when the OBS score is higher.
Covariates
In our study, we selected several variables previously displayed or that may influence MASLD or OBS and collected the following information: age, sex, race (Mexican American, other Hispanic, non-Hispanic black, non-Hispanic white, other race including multiracial), education, marital status (having a partner, no partner, unmarried), and poverty-to-income ratio (PIR) (< 1.3, 1.3 to 3.5, > 3.5), fasting glucose, fasting insulin, glycated hemoglobin, homeostasis model assessment insulin resistance (HOMAIR = fasting glucose (mmol/l) × fasting insulin (mU/ml)/22.5), total cholesterol (TC), triglycerides (TG), high-density lipoprotein (HDL) and low-density lipoprotein (LDL), C-reactive protein (CRP), alanine aminotransferase, aspartate aminotransferase, γ-glutamyl transferase, the 2015 version of the Healthy Eating Index (HEI) and total energy intake, hypertension, diabetes, and cardiovascular disease.
Statistical analysis
The scoring for this study was based on guidance from the Centers for Disease Control and Prevention (CDC). The data came from forms 1999–2000 and 2001–2002, so the formula was 2/5 × WTDR4YR (Dietary day one 4-Year sample weight) or 3/5 × WTDRD1 (Dietary day one 2-Year sample weight) to take into account the NHANES’s complex multistage cluster survey design. During data handling and analysis, we made sure that continuous variables had a normal distribution. For variables with a normal distribution, we used the weighted mean ± standard error (SE), and for variables with a nonnormal distribution, we used the interquartile range (IQR). Next, the weighted one-way ANOVA or Kruskal-Wallis’s H test was used to analyze continuous variables. Weighted χ2 tests were used to analyze categorical variables, which were given as numbers (weighted percentages). It was broken up into quartiles, with Q1 being the lowest (13–13), Q2 being the next lowest (13–19), Q3 being the next lowest (19–25), and Q4 being the highest (25–37). We evaluated the association between different OBS and MASLD and MASLD-related fibrosis using weighted logistic regression models. The OBS was divided into two components: dietary OBS and lifestyle OBS. In the unadjusted model, no factors were modified, while Model 1 was adjusted for age, sex, race, marital status, education, PIR, smoking status and alcohol intake. To assess trends, the median value of each variable was also used. Moreover, Model 2 included additional adjustments for SII and total energy intake (kcal), while Model 3 was further adjusted for ALT, ASST, GGT, Scr, BUN, total energy, TC, glucose, TG, DM, CVD, hypertension and stroke. Subgroup analyses were also conducted based on race, gender, age, family income to poverty ratio, amount of schooling, and marriage status. Once all of Model 3’s factors had been changed, restricted cubic splines (RCS) were used to evaluate nonlinear relationships and identify general trends between the different OBS scores and MASLD. Also, to test how stable the data were, sensitivity studies were conducted by taking out one part of the overall OBS at a time. A two-tailed p-value less than 0.05 was considered statistically significant. R version 4.3.1 was used for all statistical studies (http://www.R-project.org).
Results
Baseline characteristics
A total of 12,272 individuals participated in this study. Of these, 3,480 had MASLD, comprising 28.35% of the study sample. In Table I, the baseline features of the subjects are shown, grouped by OBS quartiles. In the study, the average age of the people who took part was 50.34 ±0.29 years, and 72.47% of them were non-Hispanic white.
Table I
Baseline characteristics by OBS quartiles: NHANES 1999–2018
People in the top quartile of OBS were younger and more likely to be non-Hispanic white (78.04%) than people in the bottom quartile of OBS. People in the highest OBS quartile were wealthier, had more schooling, ate more, had higher HEI, higher HDL, lower CRP, lower GGT, lower LDH, lower CRP, lower HOMAIR, and were more likely to have partners than people in the lowest OBS quartile. The sex difference between the OBS groups was not important from a statistical point of view. With an increase in OBS, there was a gradual decrease in the number of people with MASLD and its associated diseases, such as diabetes, high blood pressure, heart disease, stroke, and fibrosis caused by MASLD.
Association between different OBS and MASLD and MASLD-related fibrosis
Table II shows the relationships between different OBS and MASLD, as well as MASLD-related fibrosis. This study using weighted logistic regression analysis identified a significant negative association between various OBS and MASLD. First, in Model 3 with all the changes made, the highest quartile of OBS (OR = 0.37(0.27, 0.51), p < 0.001) was more strongly associated with a lower risk of MASLD than the lowest quartile of OBS (OR = 0.77 (0.62, 0.97), p = 0.03). Second, the risk of MASLD decreased with higher lifestyle OBS (OR = 0.14 (0.10–0.19), p < 0.0001). Lastly, a higher dietary OBS was associated with a lower risk of MASLD (OR = 0.48 (0.36, 0.66), p < 0.0001). The decreasing trend was statistically significant (p < 0.05 for all trends), as shown by the trend test. While both the OBS and lifestyle OBS were negatively associated with fibrosis, no significant association was found between fibrosis and dietary OBS in MASLD patients (OR = 0.72 (0.48, 1.08), p = 0.08).
Table II
The associations between different OBS and NAFLD and NAFLD-related fibrosis
[i] Crude model: Unadjusted model. Model 1: Adjusted for age, sex, race, marital status, PIR, education, smoke, alcohol user. Model 2: Additionally adjusted for SII, energy (kcal). Model 3: Additionally adjusted for ALT, AST, GGT, Scr, BUN, total energy, TC, glucose, TG, DM, CVD, hypertension, stroke. Test for trend based on the variable containing a median value for each quartile.
Stratification and sensitivity analyses
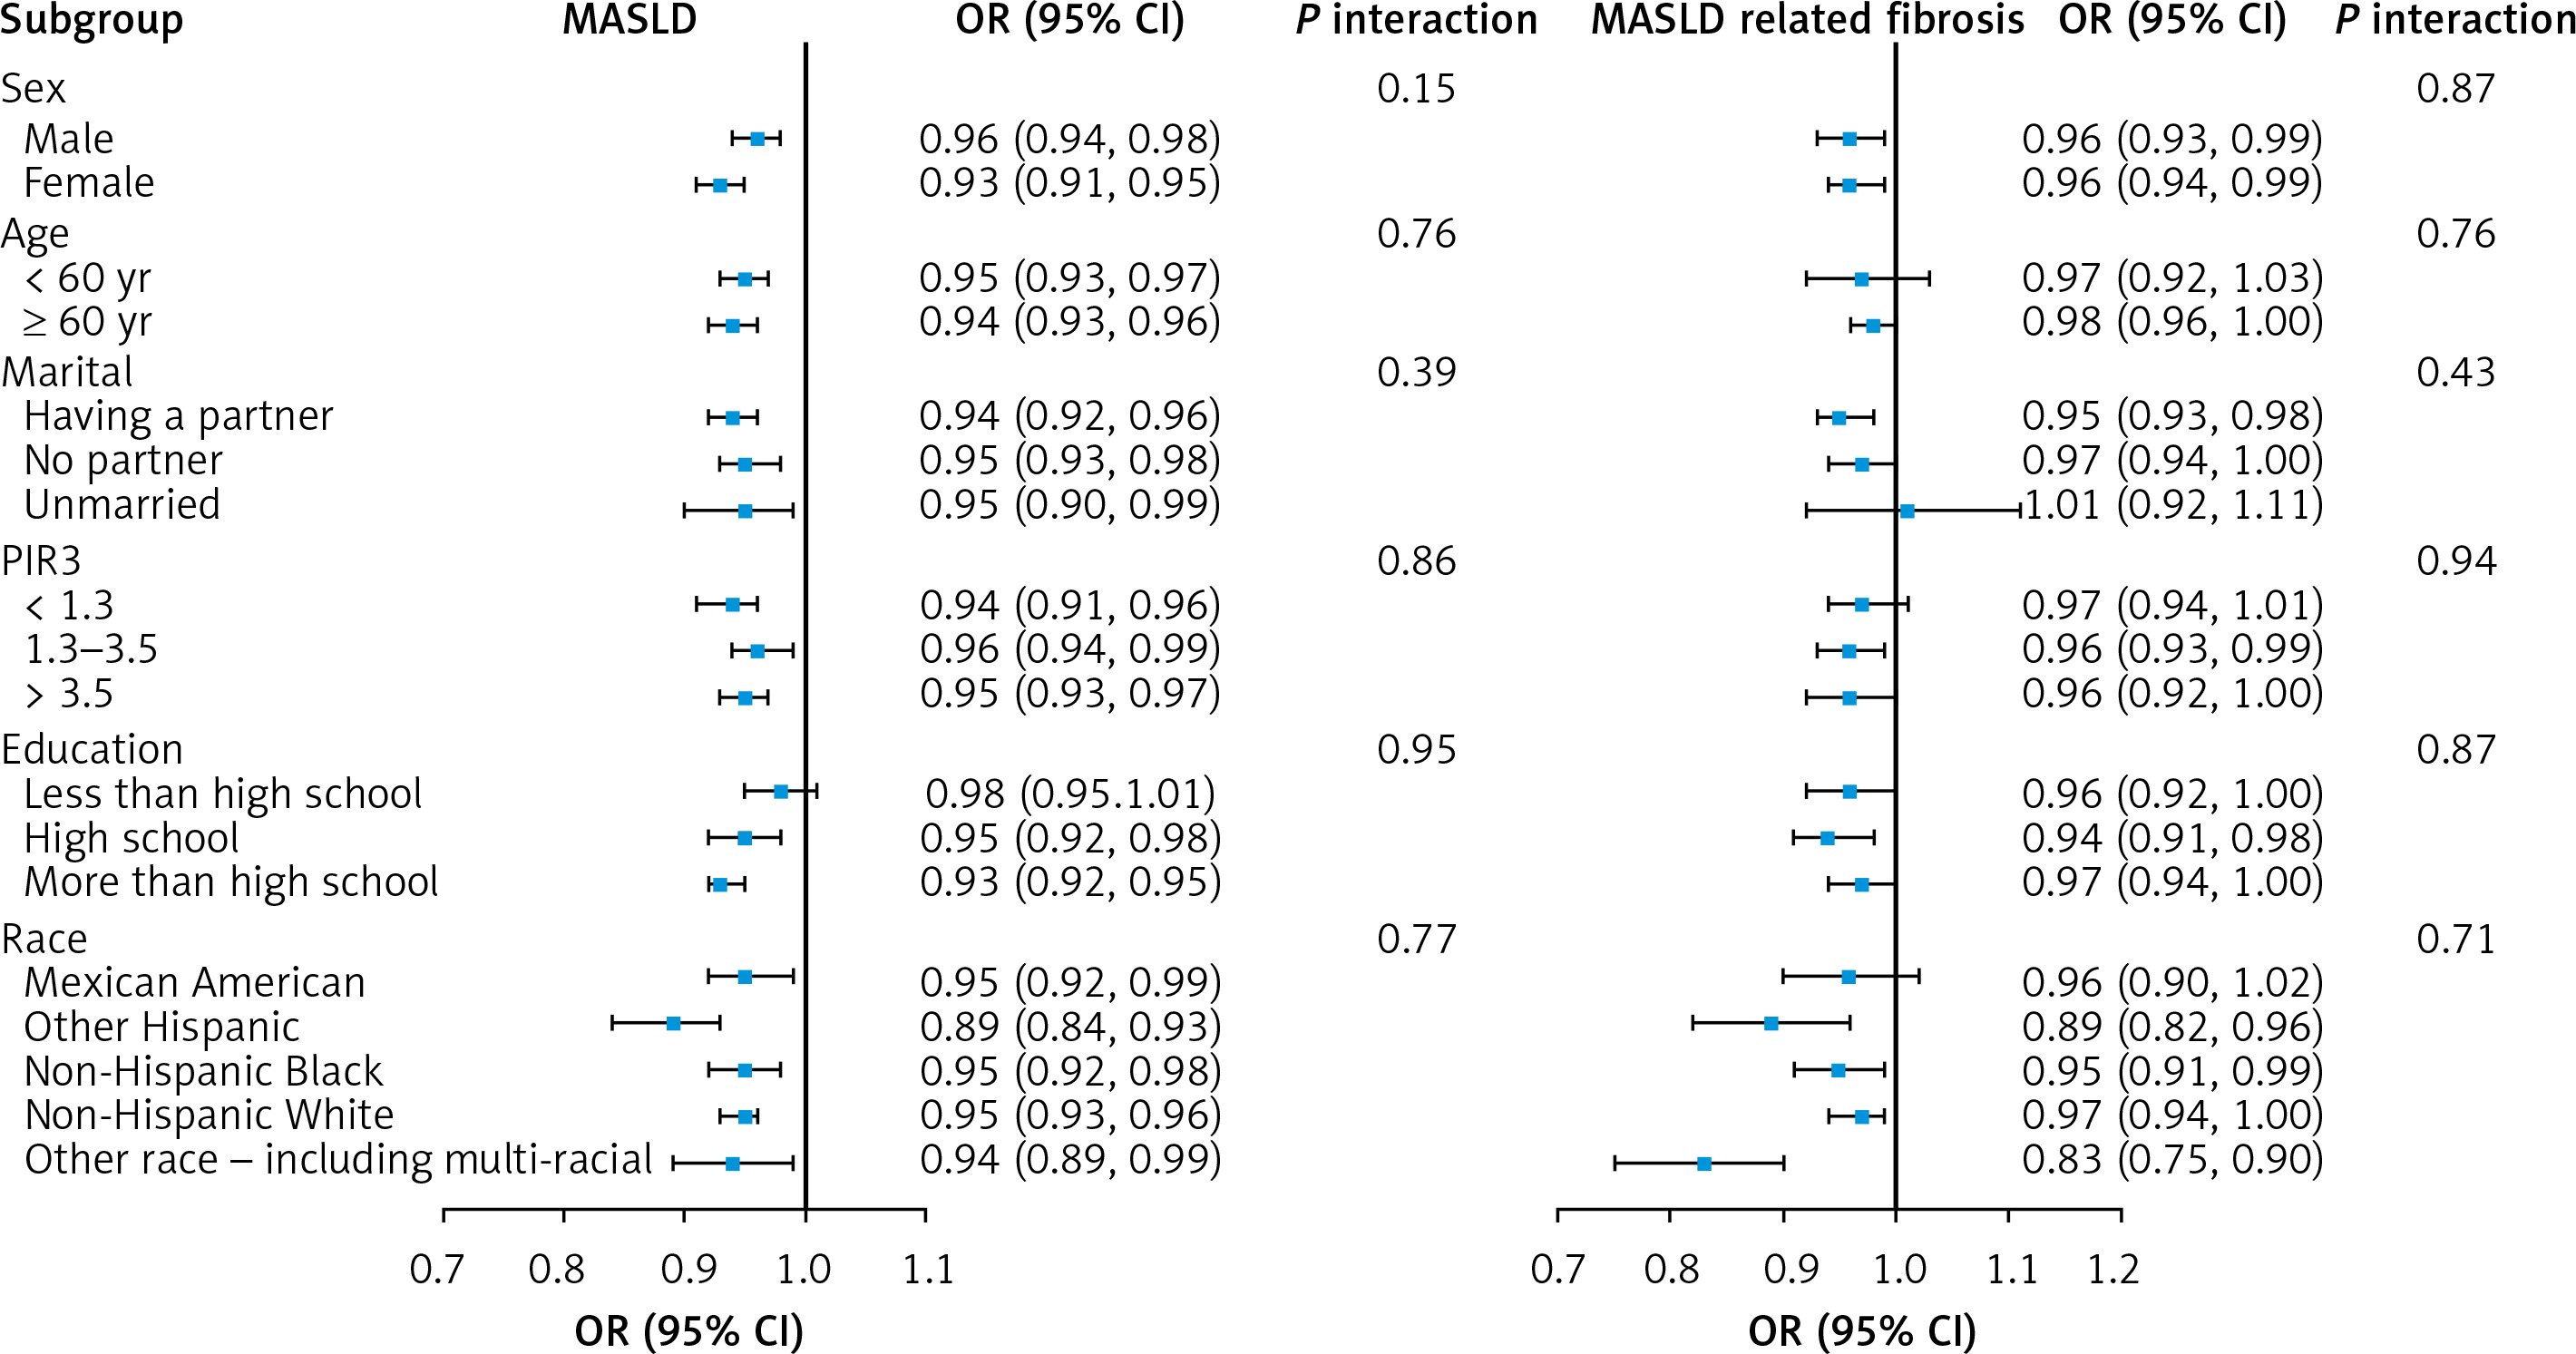
We conducted stratification analyses to assess the robustness of the association between different OBS and MASLD and related fibrosis (Figure 2 and Supplementary Table SII A, B). When stratified by age and sex, the results showed that OBS was negatively associated with the prevalence of MASLD at all levels, but there was no significant association between OBS and MASLD-related fibrosis. Additionally, dietary OBS showed a significant negative association with MASLD, especially in men. When we stratified the results by family income to poverty ratio (PIR) and education level, we found that both OBS and dietary OBS were significantly associated with MASLD in people whose PIR was higher than 3.5 (OR = 0.95 (0.93, 0.97)), or beyond high school (OR = 0.93 (0.92, 0.95); OR = 0.96 (0.94, 0.98)). Additionally, we found that the lifestyle OBS was strongly associated with MASLD and fibrosis at all stages. We carried out sensitivity studies by taking out each OBS component one at a time, and the MASLD values stayed the same (Supplemental Table SI). But when body mass index, physical exercise, copper, magnesium, and vitamin C were excluded, the results for MASLD-related fibrosis were not clear and could not be interpreted meaningfully. We also found that eating OBS and lifestyle OBS did not affect each other in the whole group (p for interaction = 0.677).
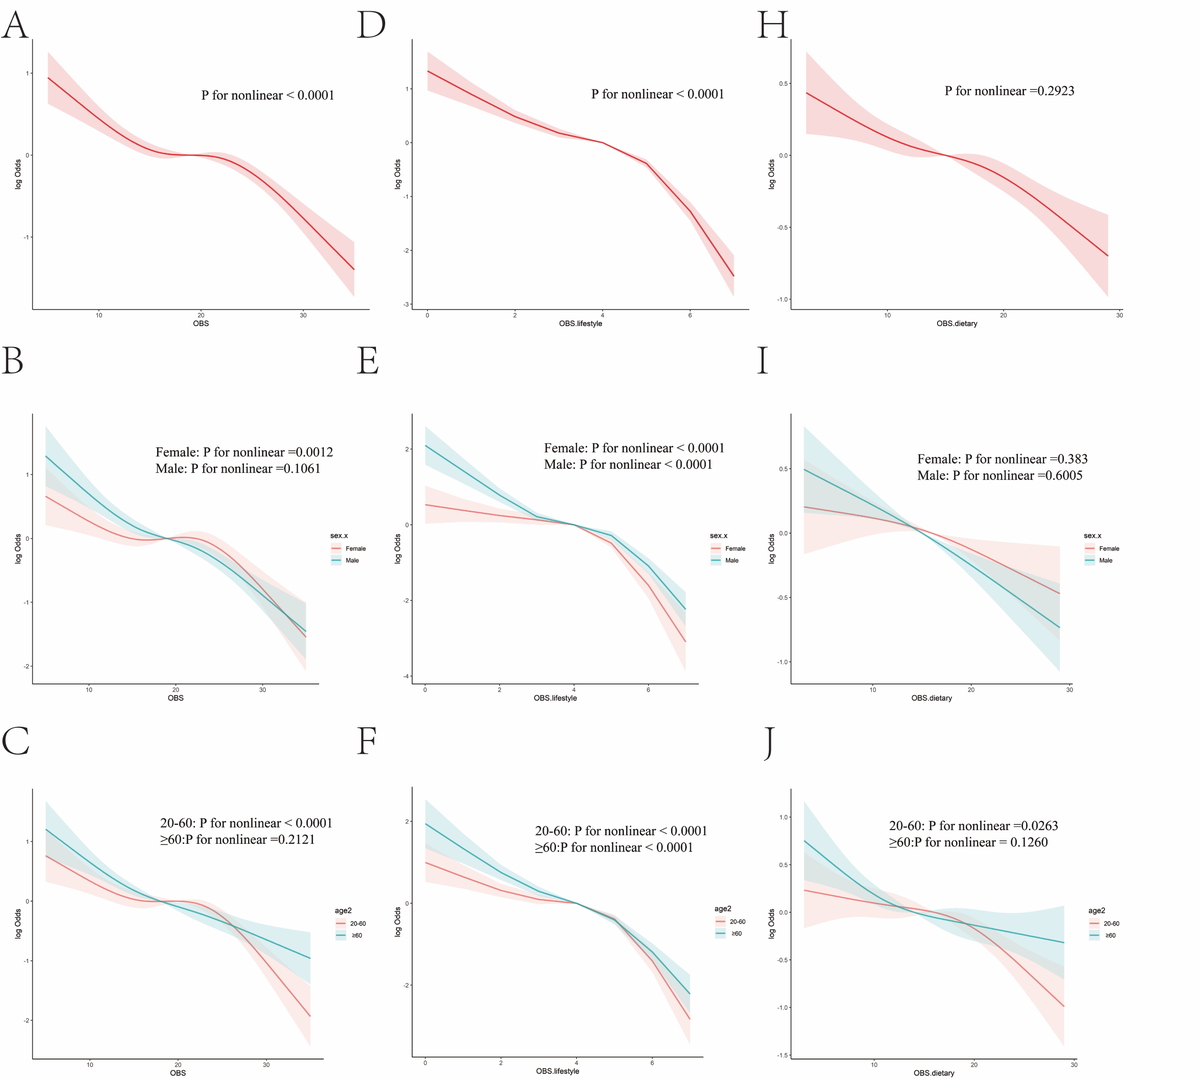
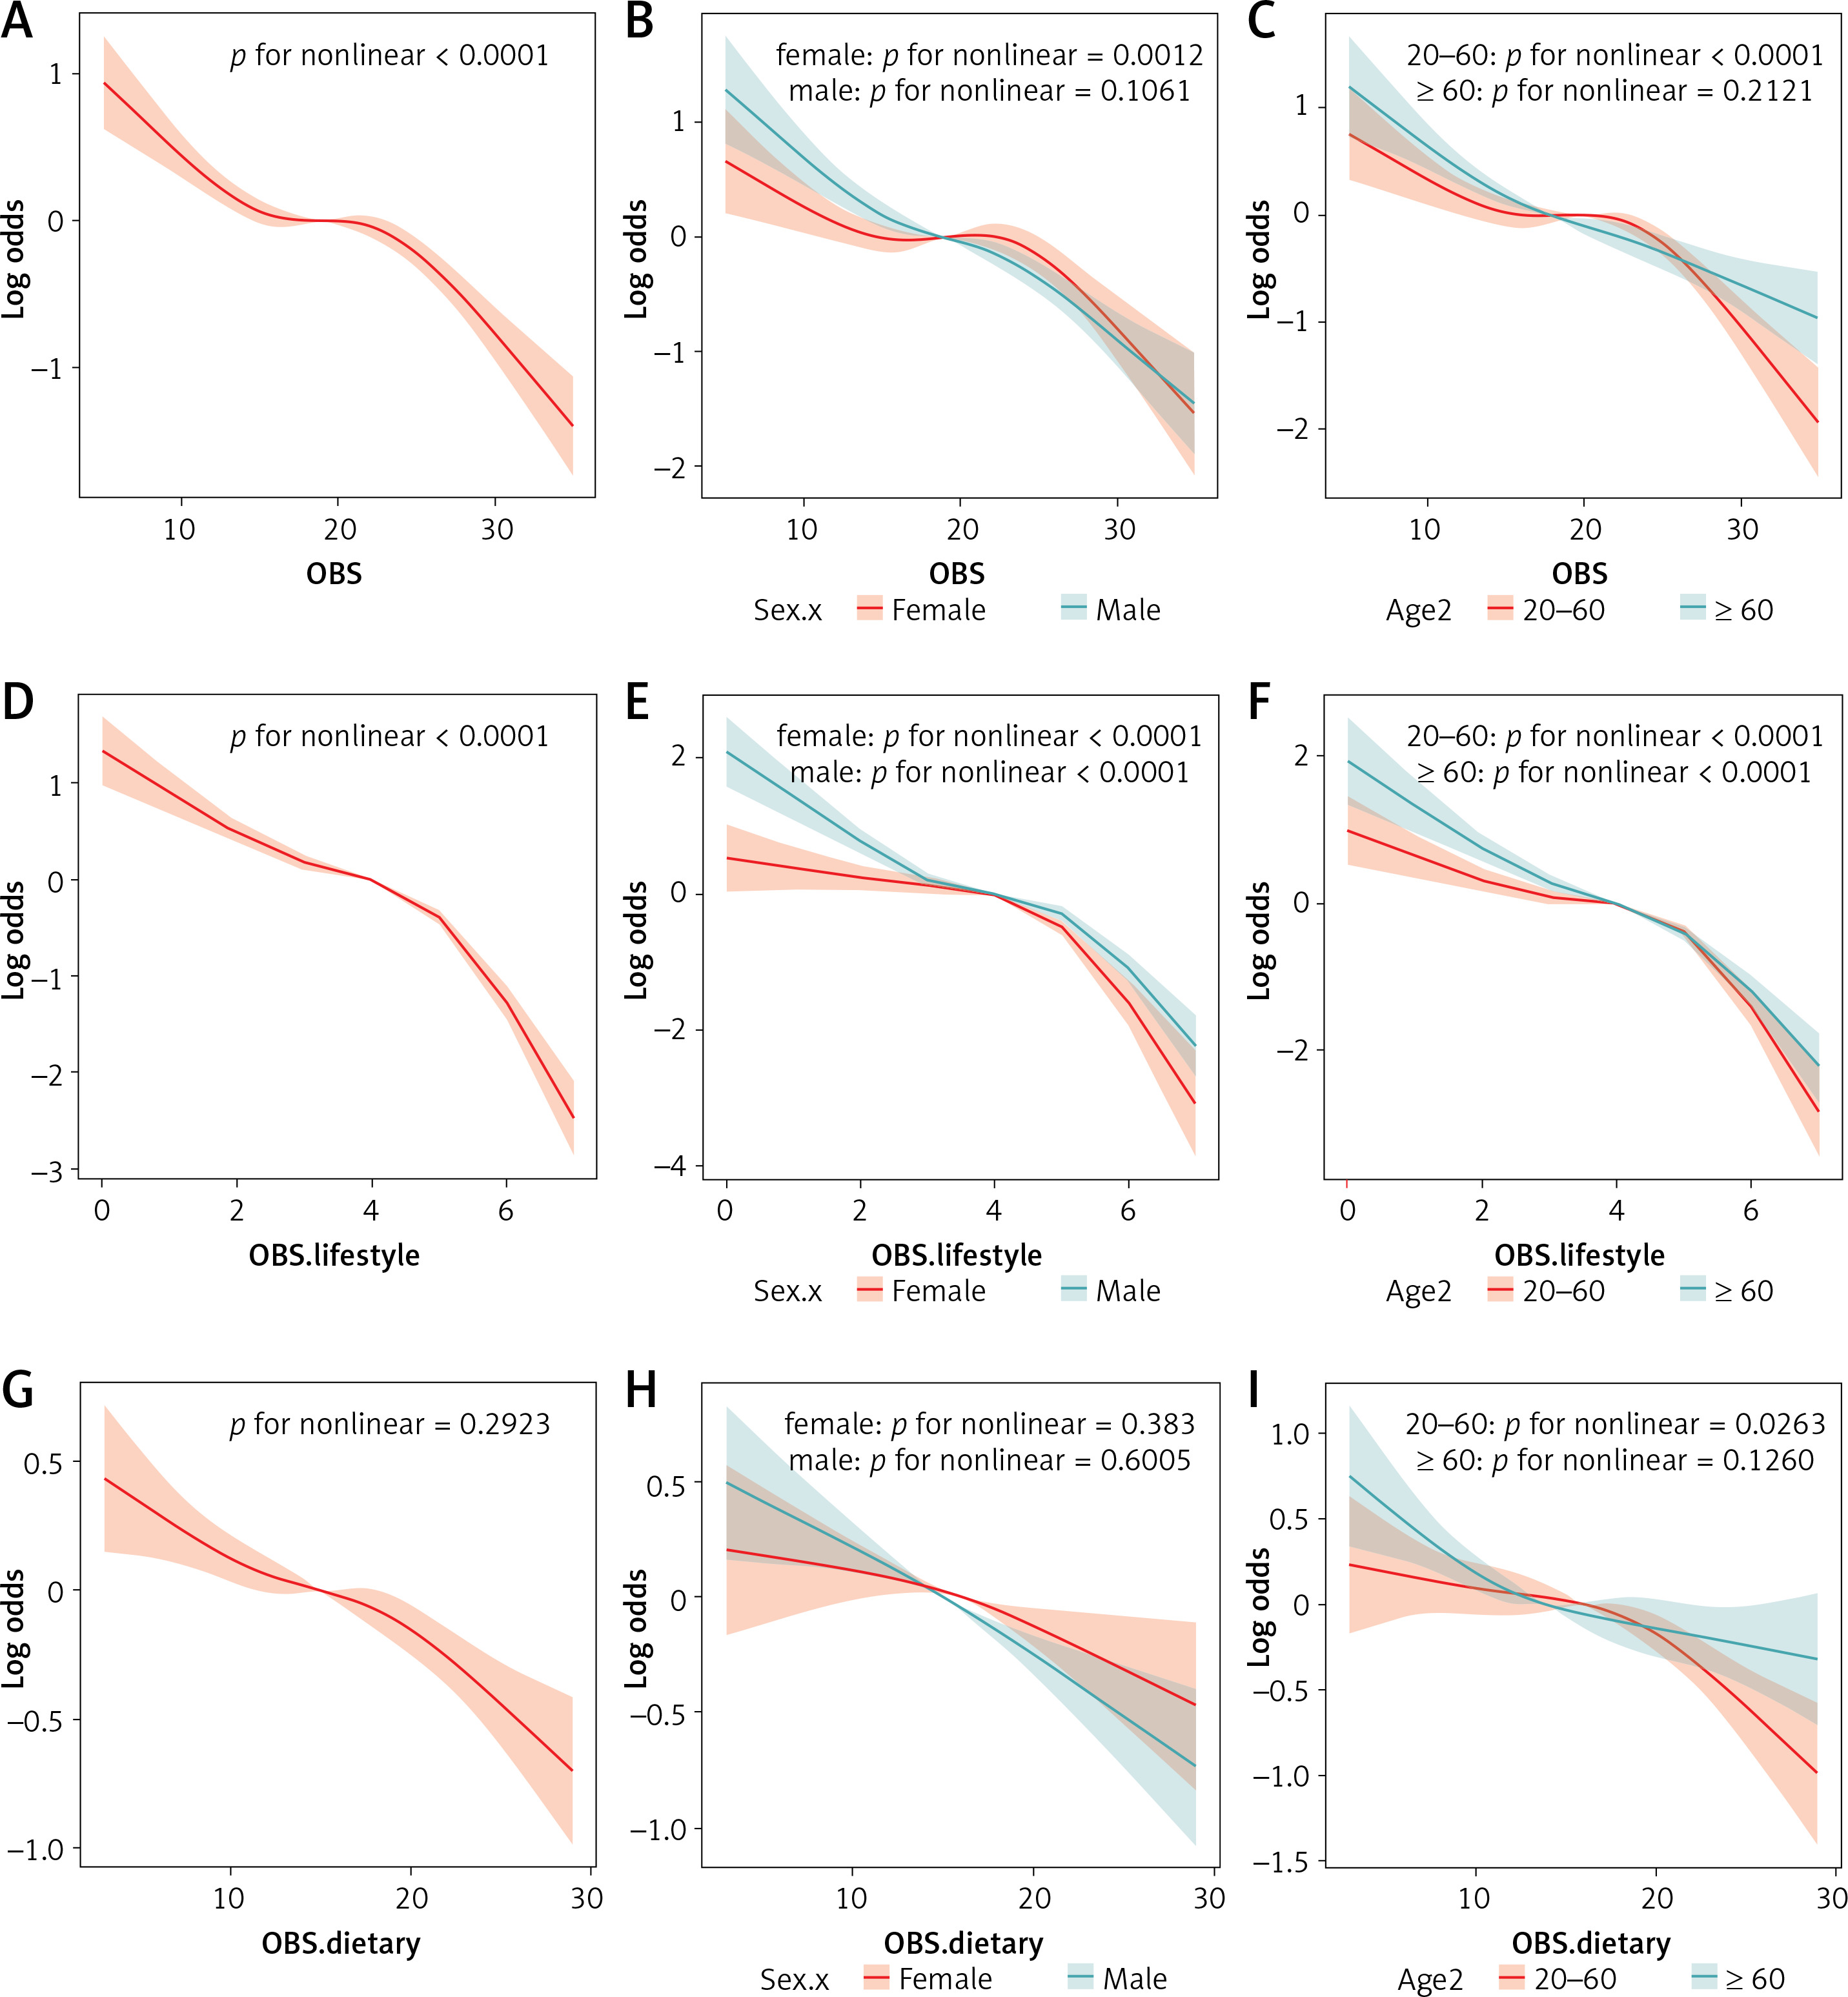
Analysis of restricted cubic spline regression
We found a nonlinear relationship between OBS and MASLD in restricted cubic spline regression (RCS) (Figure 3; p for nonlinearity = 0.0001; Figure 3 A). We also found a significant nonlinear relationship in women and people aged 20 to 60 (p for nonlinearity = 0.0012; p for nonlinearity = 0.0001; Figures 3 B, C). This picture (Figures 2) shows that the risk of MASLD decreased as OBS increased. This trend was seen in both men and patients aged 60 and up. Lifestyle OBS was nonlinearly associated with a lower risk of MASLD (p for nonlinearity < 0.0001, Figure 3 D), and this association remained the same for both male and female subgroups and all age groups (p for nonlinearity < 0.0001, Figures 3 E, F). There was a negative linear relationship between dietary OBS and the risk of MASLD (p for nonlinearity = 0.2923; Figure 3 G). There was also a negative linear relationship between dietary OBS and MASLD in different age or gender groups and in patients aged 60 or more (Figures 3 H, I). The nonlinear analysis of the RCS gave slightly different results, but the overall trends of the dependent and independent factors were generally negative.
Discussion
We conducted a cross-sectional study of 12,272 people in the NHANES dataset to find out more about the association between OBS and MASLD. We found that total OBS and lifestyle OBS were both associated with a lower risk of MASLD and fibrosis. This supports the idea that OBS has a major effect on the development and worsening of MASLD, and the link was the same for both men and women. Our research also revealed that having higher OBS and lifestyle OBS scores is not always associated with a lower chance of MASLD. Our research showed that dietary OBS was negatively associated with the number of cases of MASLD but not with fibrosis related to MASLD. Also, dietary OBS was only negatively associated with MASLD in men. A previous study showed that women may have a better antioxidant capacity than men. This could be because estrogen has antioxidative effects and antioxidant enzyme activity varies between men and women [9, 15]. It is not clear what exactly causes these differences between men and women, but they may have something to do with oxidative stress and the biology of MASLD [16]. Dietary habits and quality of life are both important factors that affect MASLD, but they may have a bigger effect on men.
Several oxidative stress biomarkers, including malondialdehyde and nitric oxide, were found to be higher in the serum of people with MASLD compared to controls. At the same time, concentrations of several antioxidant biomarkers, including glutathione, glutathione peroxidase, and superoxide dismutase, were significantly lower [17, 18]. In the pathophysiology of MASLD/NASH, hepatic lipotoxicity leads to failure in several ROS-producing cell compartments. This causes excess production and release of ROS, which disrupts the balance of redox signals. Also, growing clinical evidence suggests that adding a variety of antioxidants to a person’s diet, such as β-carotene and vitamins A, E, and C, along with making lifestyle changes such as aerobic exercise, may help improve some clinical indicators by lowering oxidative stress in MASLD/NASH patients [19–21]. Since there are not many accepted drug treatments for MASLD, changes to dietary and lifestyle are still the most important strategies [22]. The OBS is very useful because it can be used to check a person’s general redox balance. Many study groups have evaluated its potential associations with different metabolic illnesses or conditions. For example, studies have shown that a higher OBS is associated with a lower risk of new-onset hypertension and metabolic syndrome. It is also associated with better control of blood sugar, especially in adults with type 2 diabetes [23–25]. The aim of this study was to determine how the OBS, which shows the balance of pro-oxidants and antioxidants, is related to the number of cases of MASLD. As with other studies [26], in our study the OBS has components that have been studied before, such as dietary fiber, total fat, carotene, riboflavin, niacin, calcium, zinc, magnesium, copper, selenium, iron, total folate, vitamins B12, C, and E, as well as information about smoking, physical activity, BMI, and total folate. Even when all the other investigated factors were taken into account, OBS was still associated with the risk of MASLD and fibrosis. In the Q4 population, the risk of MASLD and fibrosis was 63% and 40% lower than in the Q1 population with OBS (p trend < 0.0001).
Higher lifestyle OBS and dietary OBS were each independently associated with a lower risk of MASLD, showing reductions of around 86% and 52% in the population with OBS in the Q4 quartile compared to Q1, respectively. Notably, the risk of fibrosis was 63% lower in Q4 compared to the group with lifestyle OBS in Q1. However, dietary OBS was not associated with fibrosis in people with MASLD. Hence, lifestyle OBS seems to be more strongly associated with a lower risk of MASLD and fibrosis than dietary OBS. The results of this study agree with those of a recent study using NHANES III [27], which found that dietary factors are less important than physical exercise for the outcome of people with MASLD. The basic processes are still not clear, so they need to be investigated further in future studies.
To learn more about the complex connection between different OBS and the risk of MASLD, we used restricted cubic splines. The associations between OBS and lifestyle OBS and MASLD risk were not linear (p for nonlinearity < 0.0001). For OBS, the turning point was 19 points, and for lifestyle OBS, it was 5 points. After achieving 19 and 5 points, respectively, threshold effect analysis showed that OBS and lifestyle OBS were tied to a significant drop in MASLD risk. The way MASLD patients are treated might change because of these results.
Stratified analysis showed that all p-values for the interaction were greater than 0.05 across different subgroups, thus indicating that the link between OBS and risk of MASLD was consistent regardless of individual characteristics. These results also suggest that OBS, particularly lifestyle OBS, may reduce MASLD risk across diverse populations. It is interesting that the p-value for the interaction was less than 0.05 for age groups when we looked into how lifestyle OBS affected the risk of fibrosis in those groups. After that, we looked for interactions and found that lifestyle OBS was more strongly associated with the risk of fibrosis in people aged 41 or older, who were most likely to benefit from a diet and lifestyle high in antioxidants (OR = 0.8 (0.7, 0.9); p < 0.001).
Also, tests that excluded each OBS component one at a time showed that the results of MASLD remained the same. The factors that had the largest effect on preventing fibrosis were vitamin C, magnesium, copper, physical exercise, and BMI. A new study from NHANES found a strong association between higher serum copper levels and a higher risk of both onset and deterioration of MASLD and other metabolic disorders [28]. A study in the U.S. population found a strong association between blood vitamin C levels and better scar formation in people with MASLD [29, 30]. A lot of research has shown that exercise can help lower NASH and liver fibrosis by stopping fat from building up in the liver [31, 32]. The clinical guidelines also recommend that people with MASLD should eat well and exercise to lose weight [33].
This study has several strengths. First, the OBS as a whole gives a more complete picture of a person’s total pro-oxidant and antioxidant intake. Second, the NHANES data were chosen using a complicated multi-stage chance sampling method, representing the general population of the US. Third, many other factors were taken into account in this study to greatly lessen the impact of factors that could have caused confusion. Fourth, sensitivity and stratified studies showed that our results were stable, and limited cubic spline regression helped us understand the relationships better.
However, our work has some limitations as well. In the first place, it might be hard to prove a cause-and-effect relationship since the study was cross-sectional. This needs to be investigated in future studies through large-scale prospective cohort studies and randomized controlled trials. Second, since the study only included people in the US, more research is needed to determine whether the results can be applied to people in other countries. Third, a major weakness of this study is that it did not use liver biopsies to diagnose MASLD and fibrosis. Instead, it used non-invasive markers, which could make the results less accurate. However liver biopsy is expensive, can have problems, and cannot be used in large population-based studies. Non-invasive methods, on the other hand, are a good alternative that has been shown to be accurate [13]. Diagnosis using non-invasive scores is well understood, and these effects probably will not change how reliable the results are. Additionally, dietary OBS scores were calculated using a 24-hour dietary memory interview, which could have been skewed by remember bias. We also used two 24-hour dietary records to conduct sensitivity analyses, but the results of all the analyses in this study remained largely the same. Overall, the dietary culture in the U.S. differs greatly from other countries, with fast food, processed foods, and high sugar and fat intake being common. In contrast, many other countries (e.g., Mediterranean and Asian nations) emphasize fresh foods, vegetables, and fruits. While the U.S. has an abundant food supply in supermarkets and fast food chains, other countries may rely more on seasonal or self-sustaining diets. These differences could lead to inaccurate conclusions when using NHANES data for international comparisons.
In conclusion, it was concluded that OBS was associated with a lower risk of MASLD. Notably, both dietary and lifestyle OBS helped lower the risk of MASLD, both on their own and together. Also, the higher lifestyle OBS was better than the dietary OBS at lowering the number of cases of MASLD-related fibrosis. Lifestyle OBS showed strong protective benefits for MASLD and fibrosis associated with MASLD. Our results show that following an antioxidant-rich lifestyle and diet is a good way to prevent MASLD.
We sincerely appreciate the NHANES participants and staff for providing the data used in this study. Special thanks to Jing Zhang from the Second Department of Infectious Disease at Shanghai Fifth People’s Hospital, Fudan University, for developing the nhanesR package and webpage, which have significantly facilitated access to the NHANES database.