Introduction
Maintenance hemodialysis (MHD) patients have higher mortality compared to the general population. The morbidity of cardiovascular complications is high, and cardiovascular disease (CVD) is the major cause of mortality in MHD patients [1]. Traditional risk factors may not fully explain the high incidence of CVD in MHD patients because these patients also suffer from uremic toxins and dialysis-related risk factors, such as a microinflammatory state [2]. A microinflammatory state is common in MHD patients and is an important reason for a poor prognosis.
The systemic inflammation response index (SIRI) is a novel marker of microinflammation, which is calculated as neutrophil count × monocyte/lymphocyte count [3–5]. SIRI might better reflect the host immune and inflammation balance, but the pathophysiology remains incompletely understood. It is widely known that immune cells play an important role in triggering inflammatory responses and modulating inflammation. Previous research demonstrated that during the early period of inflammation, neutrophils could release cytokines and chemokines, induce apoptosis of endothelial cells, and cause vascular damage. This promoted the development and progression of CVD [6]. Due to the increase of monocytes, the number of macrophages differentiated from monocytes also rises. The macrophages can be transformed into foam cells, which are closely associated with vascular endothelial dysfunction, thus accelerating the progression of atherosclerotic lesions [7]. Previous studies have also shown that blood monocyte count predicted total and cardiovascular mortality in HD patients [8]. Lymphocyte plays a vital role in the immune response of humans. Fei et al. [9] found that lymphopenia at an early stage could aggravate the severity and elevate the death risk of COVID-19 patients. In previous research, significant lymphocyte apoptosis was observed in the vascular endothelium with atherosclerosis. A lower lymphocyte level was associated with adverse CVD outcomes [10]. However, neutrophils, monocytes, and lymphocytes are easily affected by dehydration, exercise, etc., so the specificity is unsatisfactory. C-reactive protein (CRP) has been confirmed to be a predictor of mortality in HD patients [11]. However, CRP is an acute phase protein, which can be easily affected by weight change, smoking, diabetes, and other factors. Hence its specificity is also not high [12]. In recent years, research has also found that the neutrophil-lymphocyte ratio (NLR) was a short-term predictor of all-cause mortality in patients with diabetic nephropathy [13]. A higher NLR was associated with frequent congestive heart failure decompensation and long-term mortality [10]. Additionally, the monocyte-to-lymphocyte ratio (MLR) has been shown to be a predictor of cardiovascular and all-cause mortality in hemodialysis patients [14]. By comparison, the measurement method for SIRI is simple and stable. SIRI is supposed to integrate the three different mechanisms of inflammatory and immunological responses for neutrophils, monocytes, and lymphocytes. Therefore it is more comprehensive and easily accessible. The increase in SIRI can indicate that the immune system disorder is becoming more apparent, and the inflammatory response is more powerful. This may be a potential mechanism influencing outcomes for patients.
SIRI has been widely studied in predicting terminal events in many diseases and has a good predictive effect and clinical guidance value. Studies have shown that SIRI can predict the prognosis of patients with stroke and cancer [3–5]. Another study found that SIRI was associated with increased all-cause and cardiovascular mortality among patients with hypertension [15]. However, there are currently fewer studies on the effect of SIRI on the prognosis of MHD. In this study, we aimed to explore the association between inflammation reflected by SIRI and all-cause and CVD mortality in MHD patients.
Material and methods
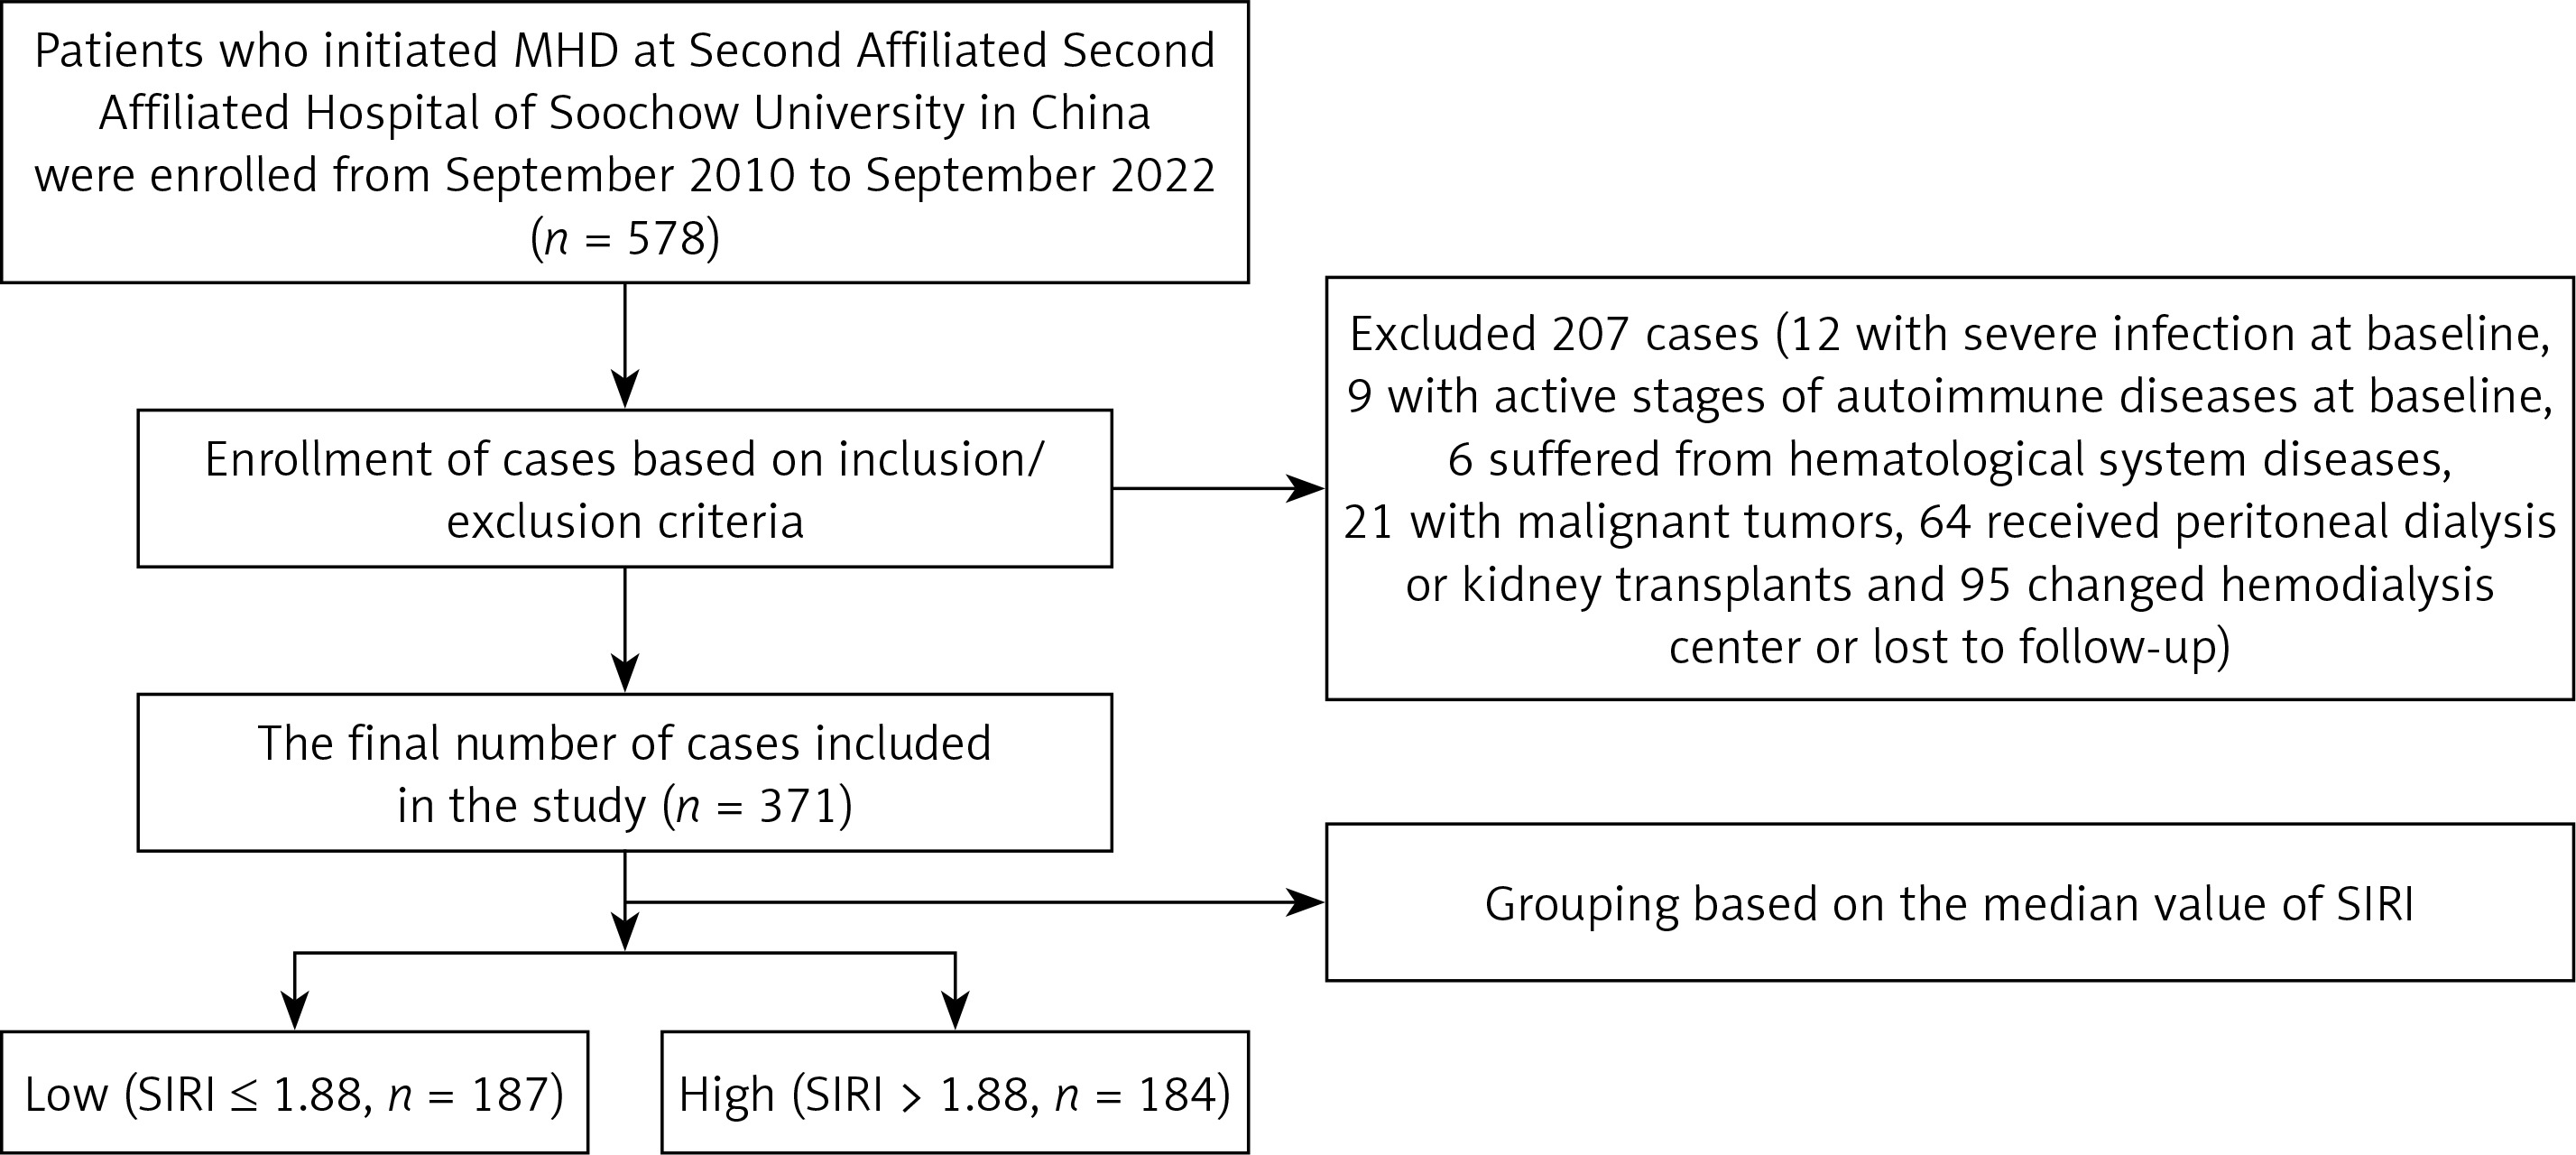
In this retrospective study, patients who initiated MHD in the hemodialysis center of the Second Affiliated Hospital of Soochow University in China were enrolled from September 2010 to September 2022. The inclusion criteria were as follows: (1) age > 18 years; (2) on hemodialysis for at least 3 months. The exclusion criteria were as follows: (1) complicated by severe infection at baseline; (2) during the active stages of autoimmune diseases at baseline; (3) hematological system diseases; (4) malignant tumors; (5) received peritoneal dialysis (PD) or kidney transplants during the follow-up period; (6) changed hemodialysis center or lost to follow-up. The follow-up period ended on 31 December 2022. This study was approved by the Clinical Research Ethics Committee of The Second Hospital Affiliated of Soochow University.
Baseline data were collected, including age, gender, and smoking history. Body mass index (BMI) was calculated according to height and weight. We recorded the history of hypertension and diabetes, the history of CVD, and the pathogenesis of end-stage renal disease (ESRD). Laboratory parameters including neutrophil count, monocyte count, lymphocyte count, hemoglobin, CRP, serum creatinine, serum urea nitrogen, serum uric acid, serum albumin, serum calcium, serum phosphorus, serum potassium, blood cholesterol, triglyceride, parathyroid hormone (PTH), and total Kt/V (Kt/V is the fractional urea clearance, defined as urea clearance (K) multiplied by the dialysis session length (t) divided by the urea distribution volume V). The Kt/V results were obtained using the special HD formula of Kt/V. The glomerular filtration rate (eGFR) was estimated using the CKD-EPI formula. The SIRI was calculated as neutrophil count × monocyte/lymphocyte count [3–5]. The NLR and MLR were also calculated. All data were obtained within 1 month after the patient’s regular HD reached dry body mass. We recorded the causes of death. CVD mortality was defined as death due to coronary artery disease, valvular heart disease, myocardial disease, arrhythmia, cerebrovascular disease, and peripheral vascular disease.
Statistical analysis
The statistical analysis was performed using SPSS 26.0 (IBM SPSS, Somers, NY, USA) and R software (version 4.3.0, Vienna, Austria). Continuous variables followed the normal distribution with mean and standard deviation. Parameters with skewed distribution were presented as median, interquartile range. The t-test was used for normally distributed data to compare the differences between two groups. A nonparametric statistical method, the Mann-Whitney test, was used for data with skewed distribution. Categorical data were expressed as the count (percentage) and compared using a χ2 test. The time-dependent ROC curve and area under the curve (AUC) were used to compare the predictive performance of SIRI, NLR, and MLR at 1, 3, 5, and 10 years for all-cause and CVD mortality. Kaplan-Meier methods were used to compute the survival analysis, and the significance test was done using the log-rank method. Univariate and multivariate Cox regression analyses were performed to assess the risk factors of all-cause and CVD mortality. Univariate Cox regression analysis was first performed, and the multivariate Cox regression analysis included factors with a p- value less than 0.10. Two nomograms were developed to predict all-cause and CVD mortality at 1, 3, 5, and 10 years. All p-values were two-sided, and p < 0.05 was taken as statistically significant.
Results
Baseline characteristics
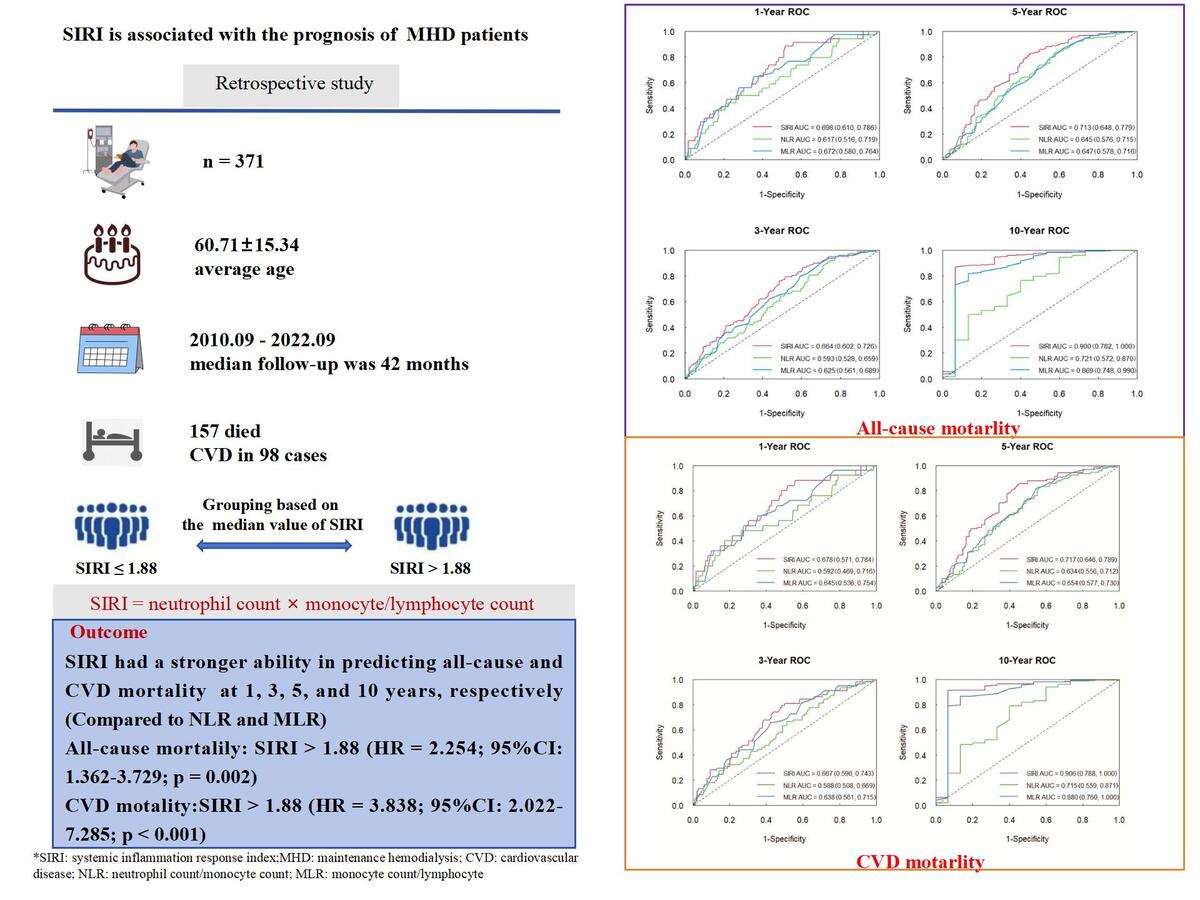
A total of 578 patients were enrolled, 207 were excluded, and 371 patients were finally included in the study. The median value of SIRI was 1.88. According to the median value, these patients were categorized into a low group (SIRI ≤ 1.88) and high group (SIRI > 1.88) (Figure 1). The average age was 60.71 ±15.34 years, and the median follow-up was 42 (20–66) months. 121 patients had a history of CVD. 157 (42.3%) patients died during follow-up. The causes of death in these patients include CVD in 98 cases, infections in 25 cases, multiple organ failure in 14 cases, gastrointestinal hemorrhage in 7 cases, and other or unknown causes in 13 cases.
ROC curve analysis
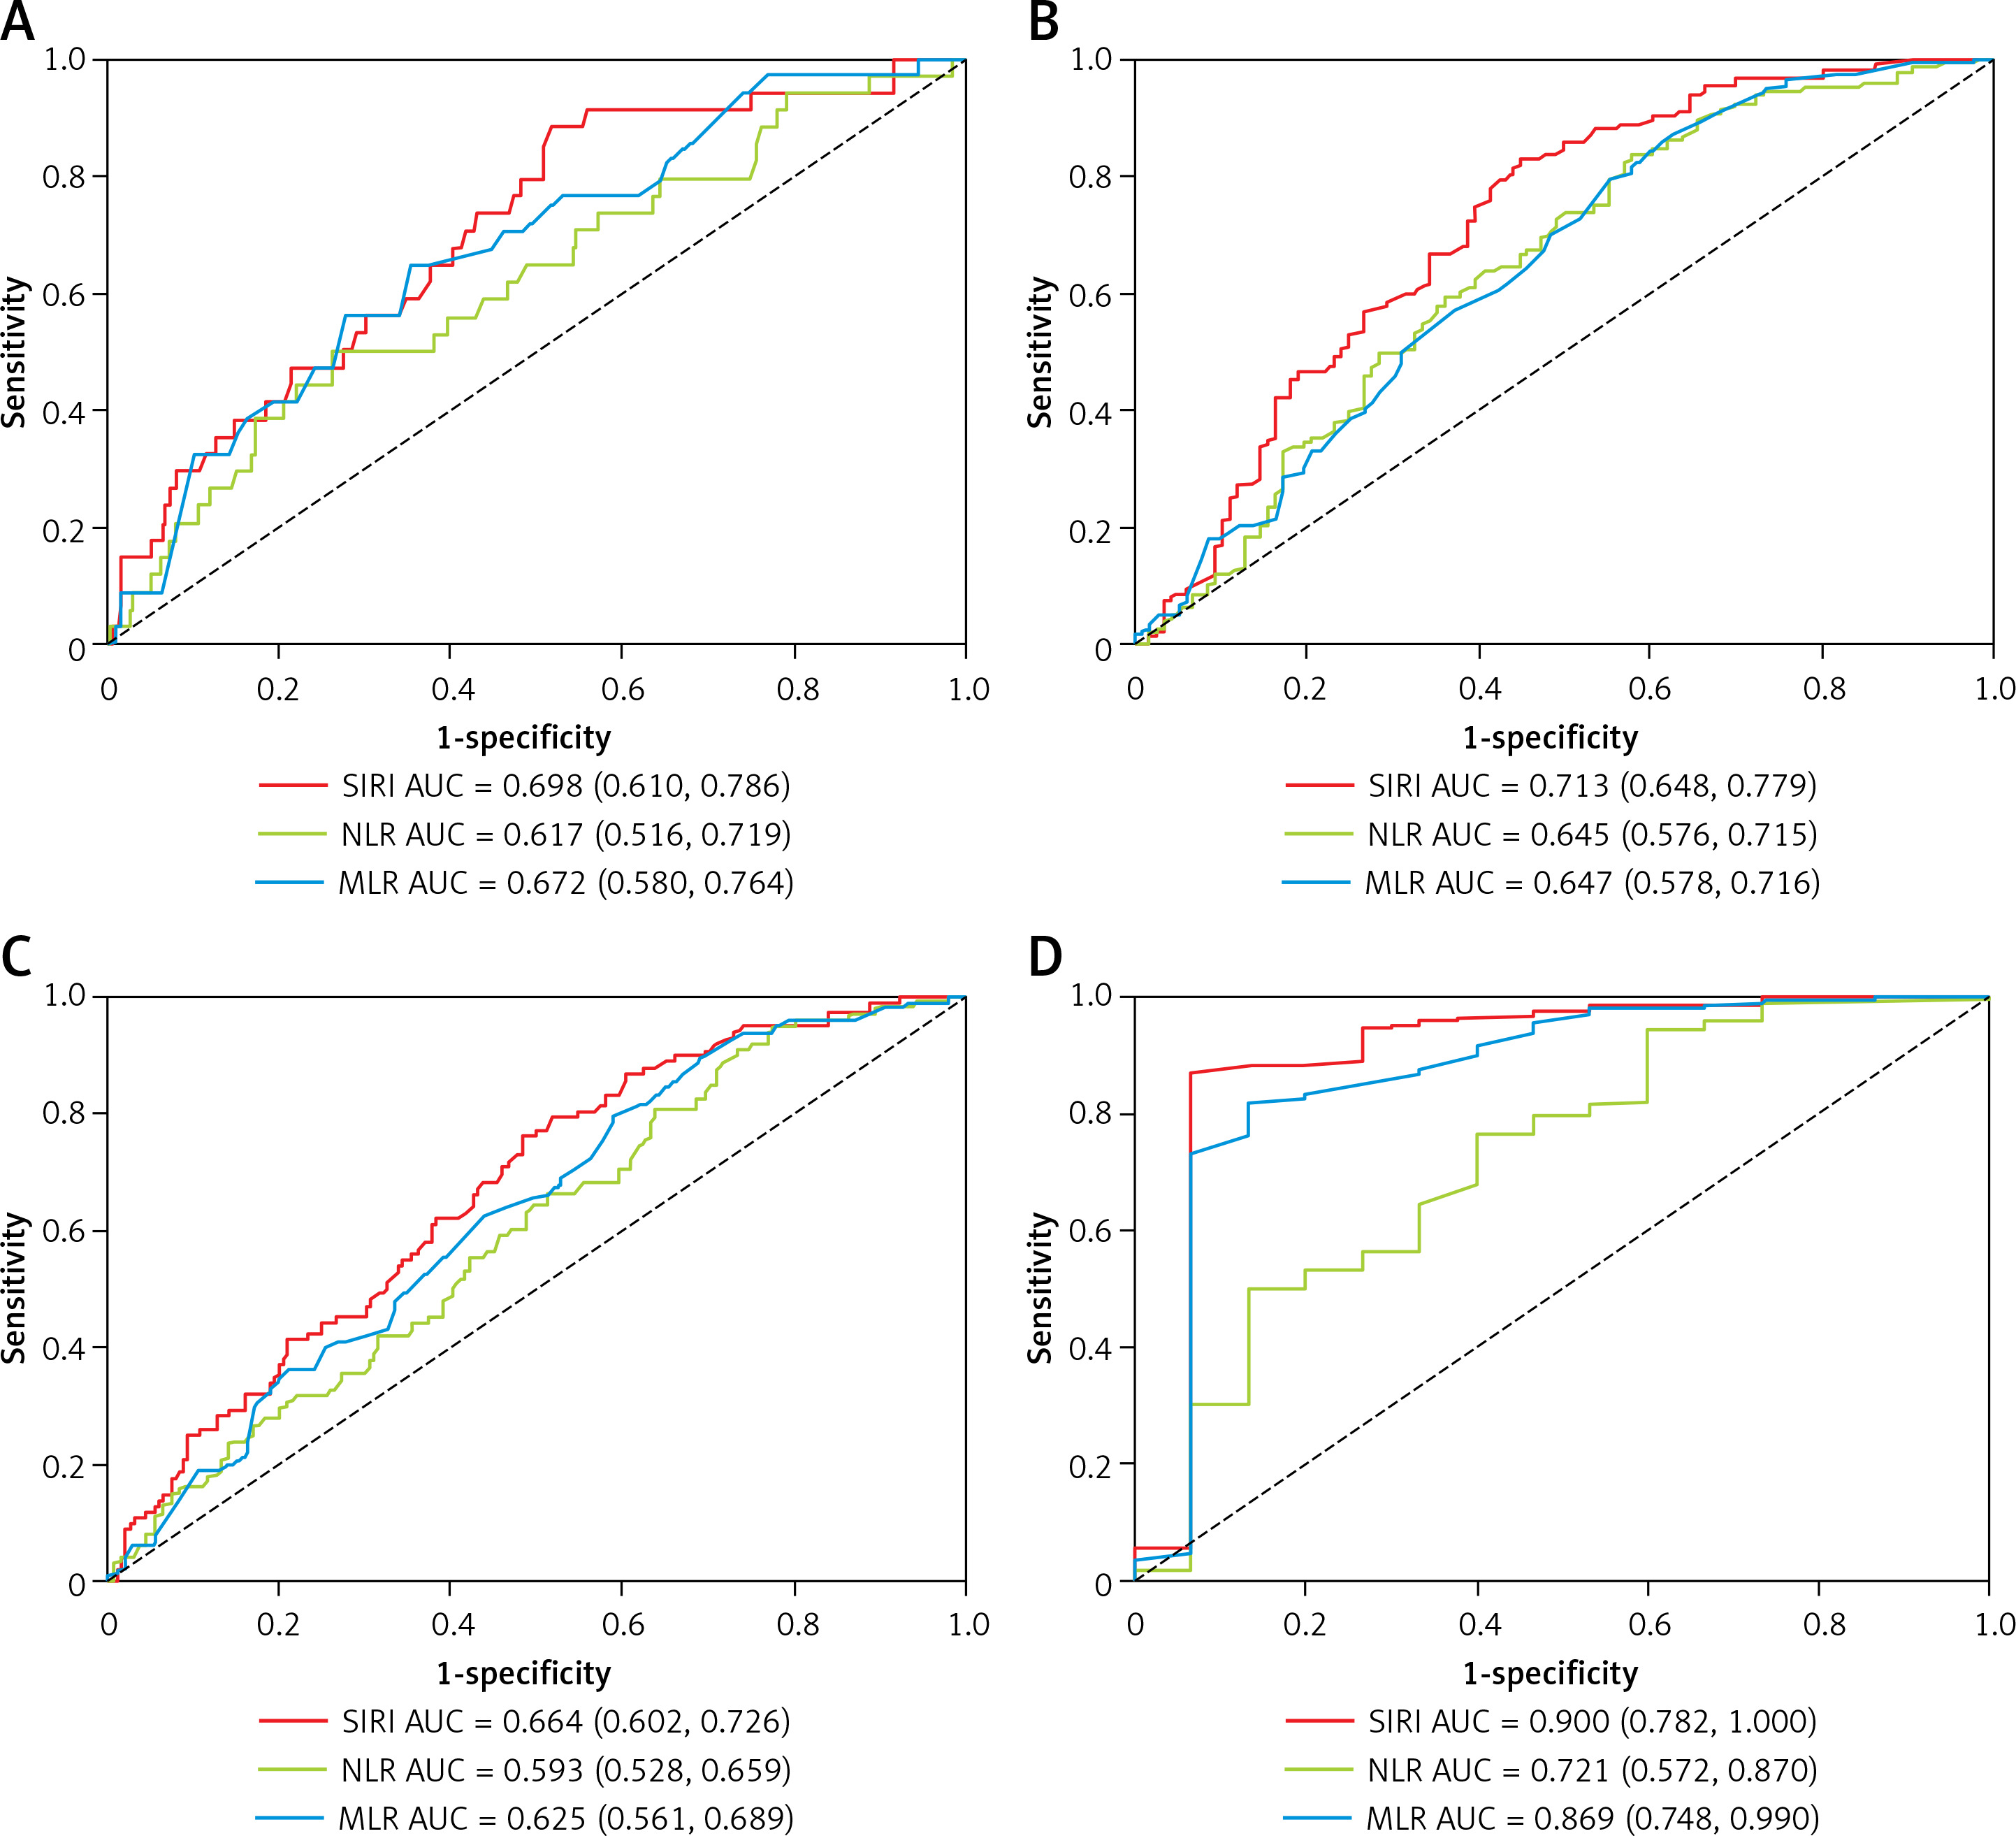
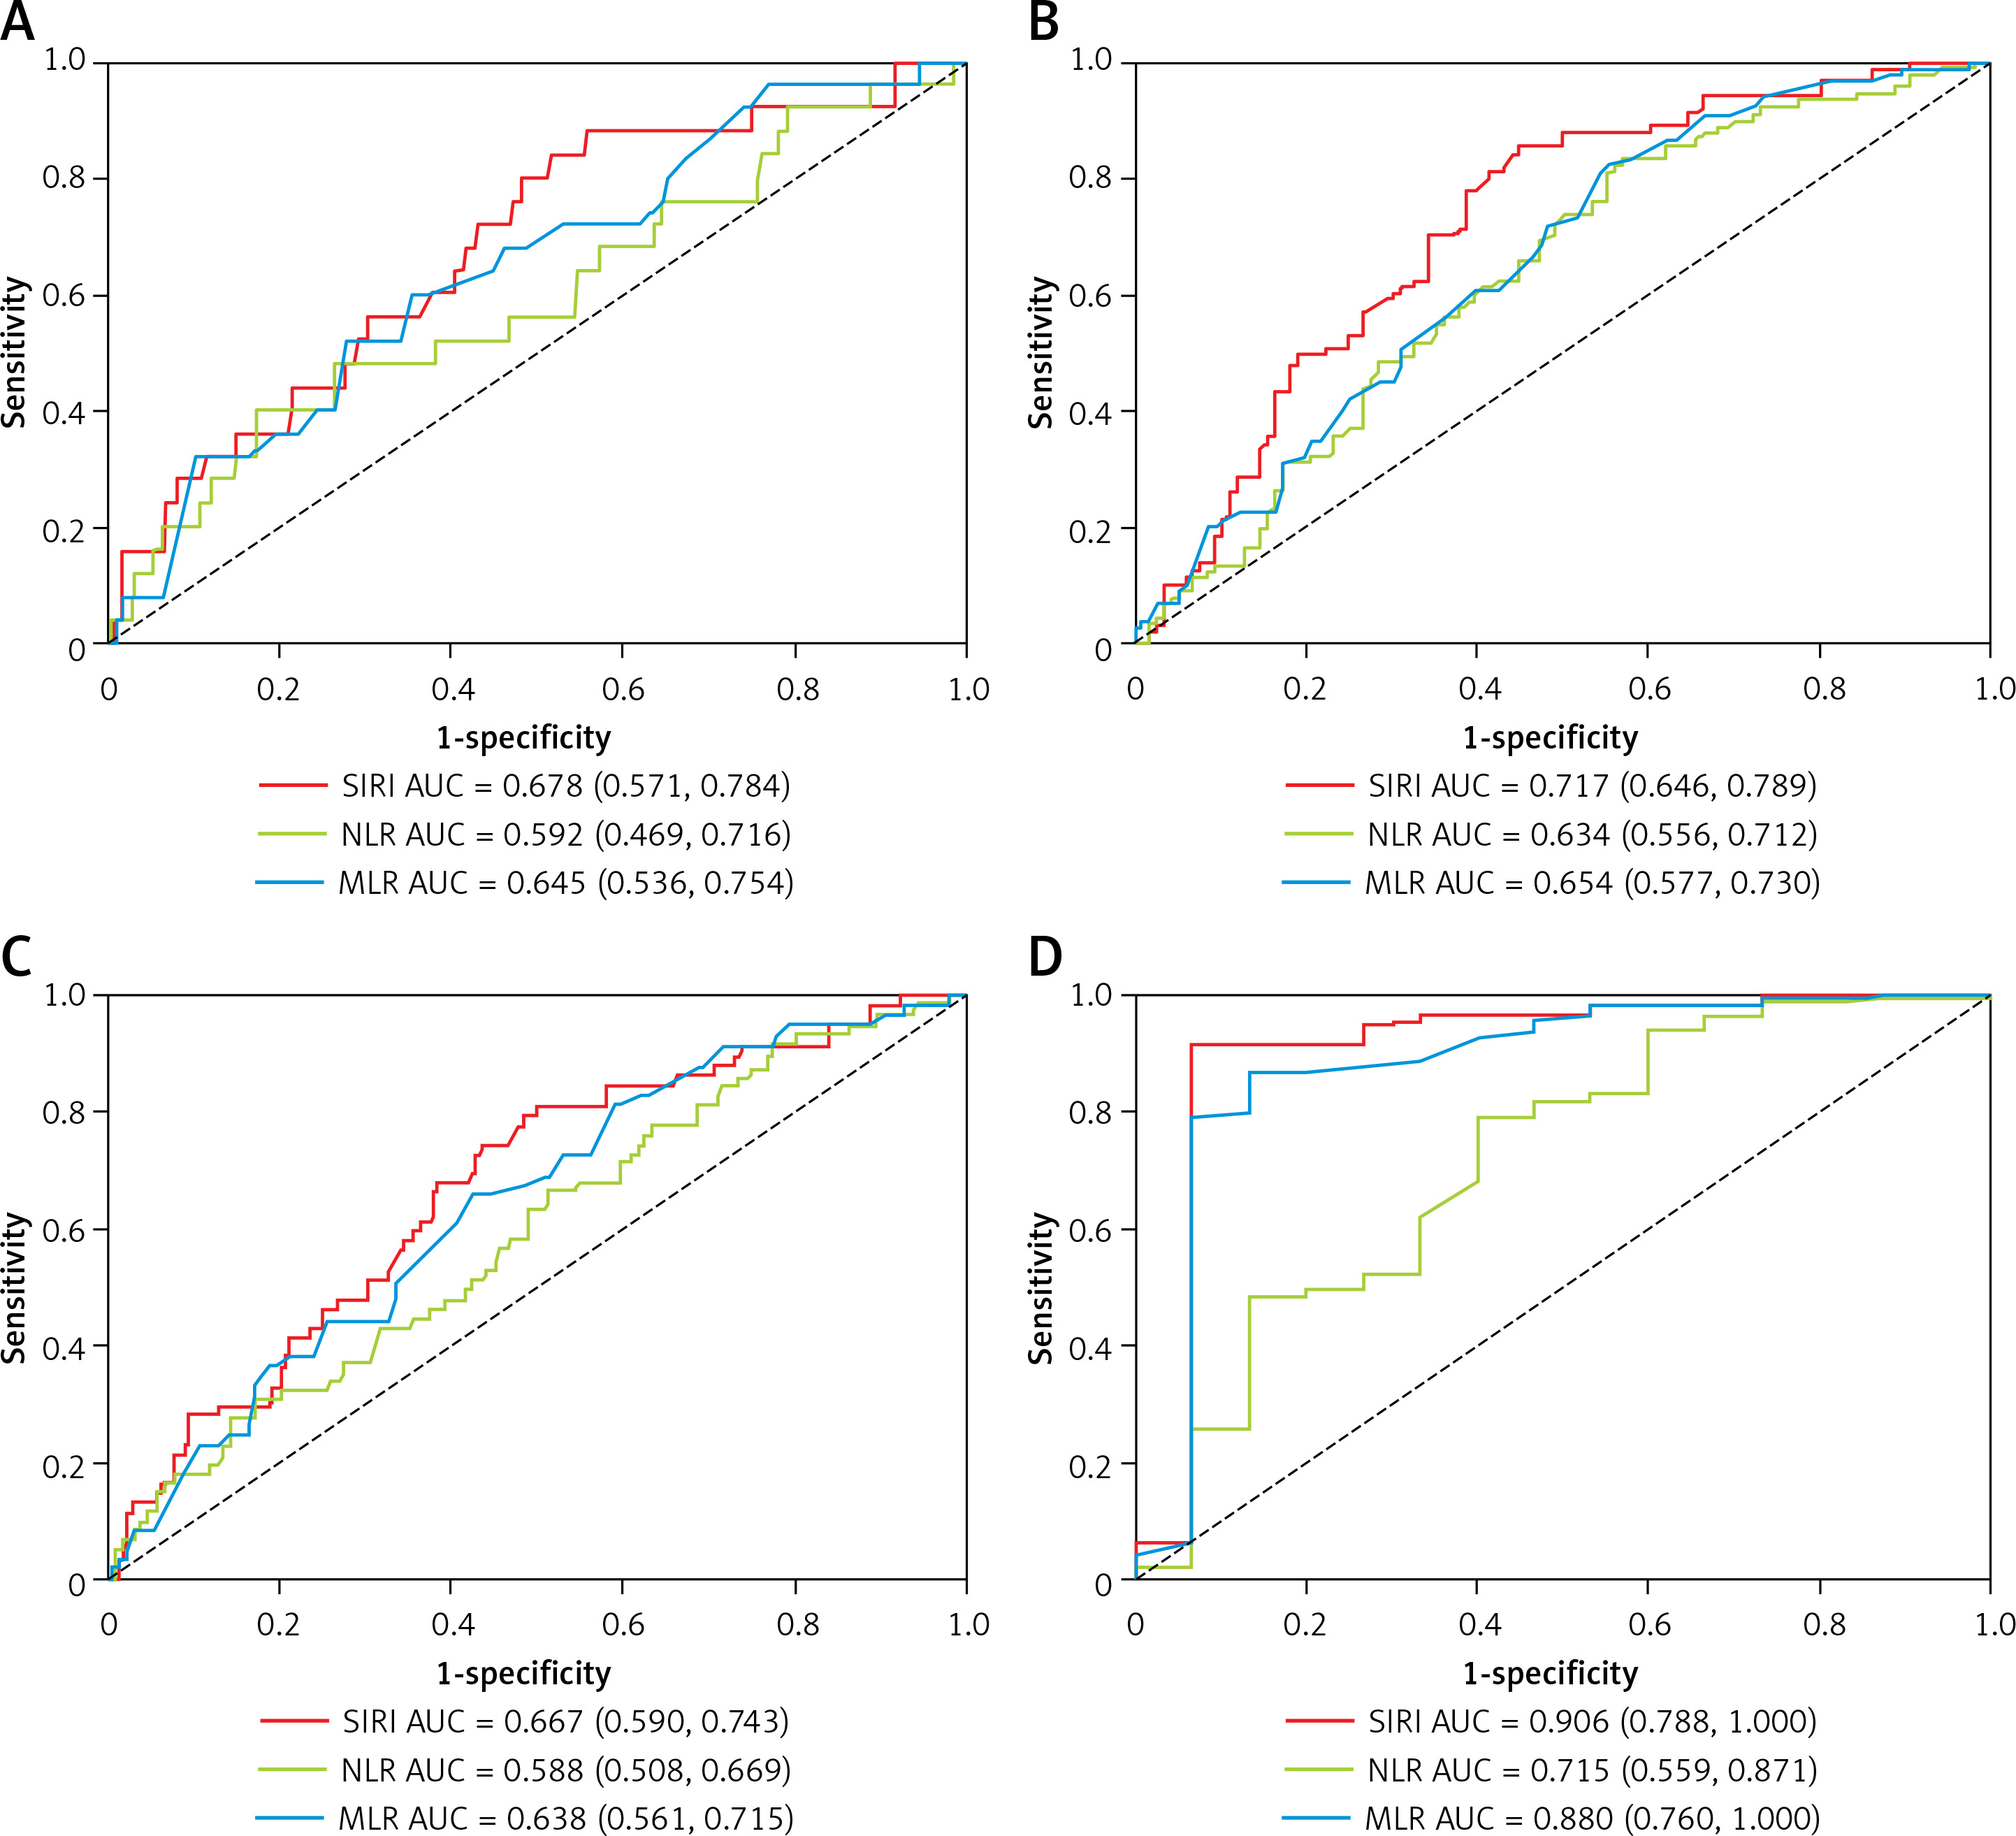
The time-dependent ROC curve analysis was used to evaluate the predictive ability of SIRI, NLR, and MLR. Compared to NLR and MLR, SIRI showed a stronger ability in predicting all-cause and CVD mortality. The AUC of SIRI to predict all-cause mortality was 0.698 (95% CI: 0.610–0.786), 0.664 (95% CI: 0.602–0.726), 0.713 (95% CI: 0.648–0.779), and 0.900 (95% CI: 0.782–1.000) at 1, 3, 5, and 10 years, respectively (Figure 2). For CVD mortality, the AUC of SIRI was 0.678 (95% CI: 0.571–0.784), 0.667 (95% CI: 0.590–0.743), 0.717 (95% CI: 0.646–0.789), and 0.906 (95% CI: 0.788–1.000) at 1, 3, 5, and 10 years, respectively (Figure 3).
Comparison of SIRI ≤ 1.88 group and SIRI > 1.88 group
The results of the two groups were compared at baseline. The high SIRI group showed significantly older age and a higher proportion of previous CVD, and the CRP level was higher. However, serum creatinine, serum albumin, and serum potassium were significantly lower (all p < 0.05) (Table I).
Table I
Baseline characteristics of the SIRI ≤ 1.88 group and SIRI > 1.88 group
Survival analysis
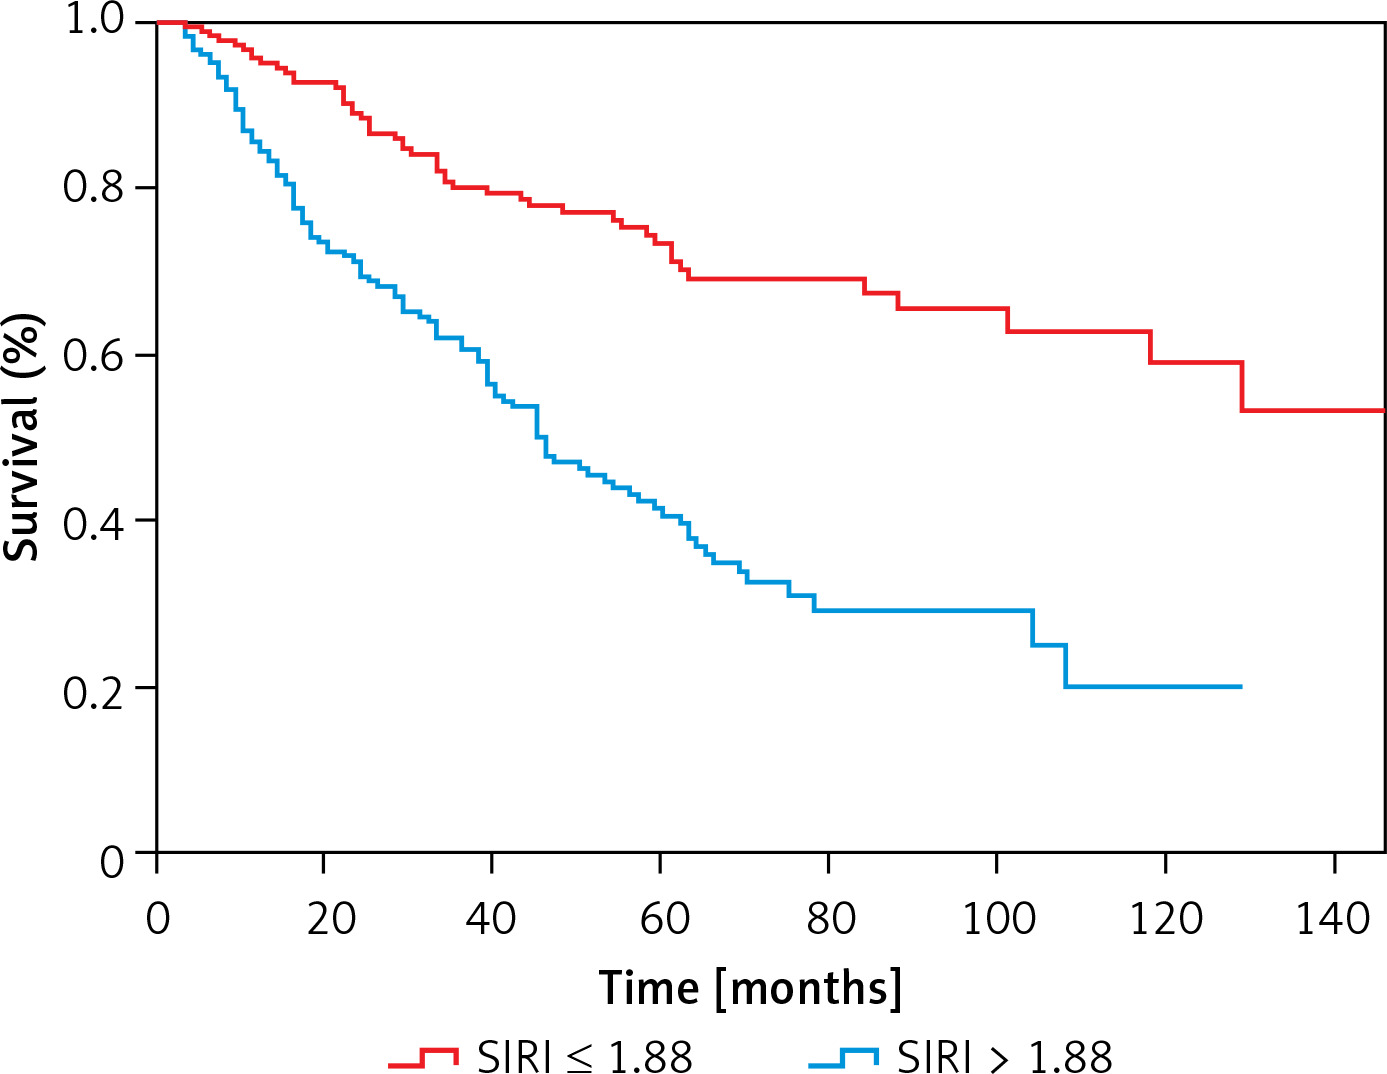
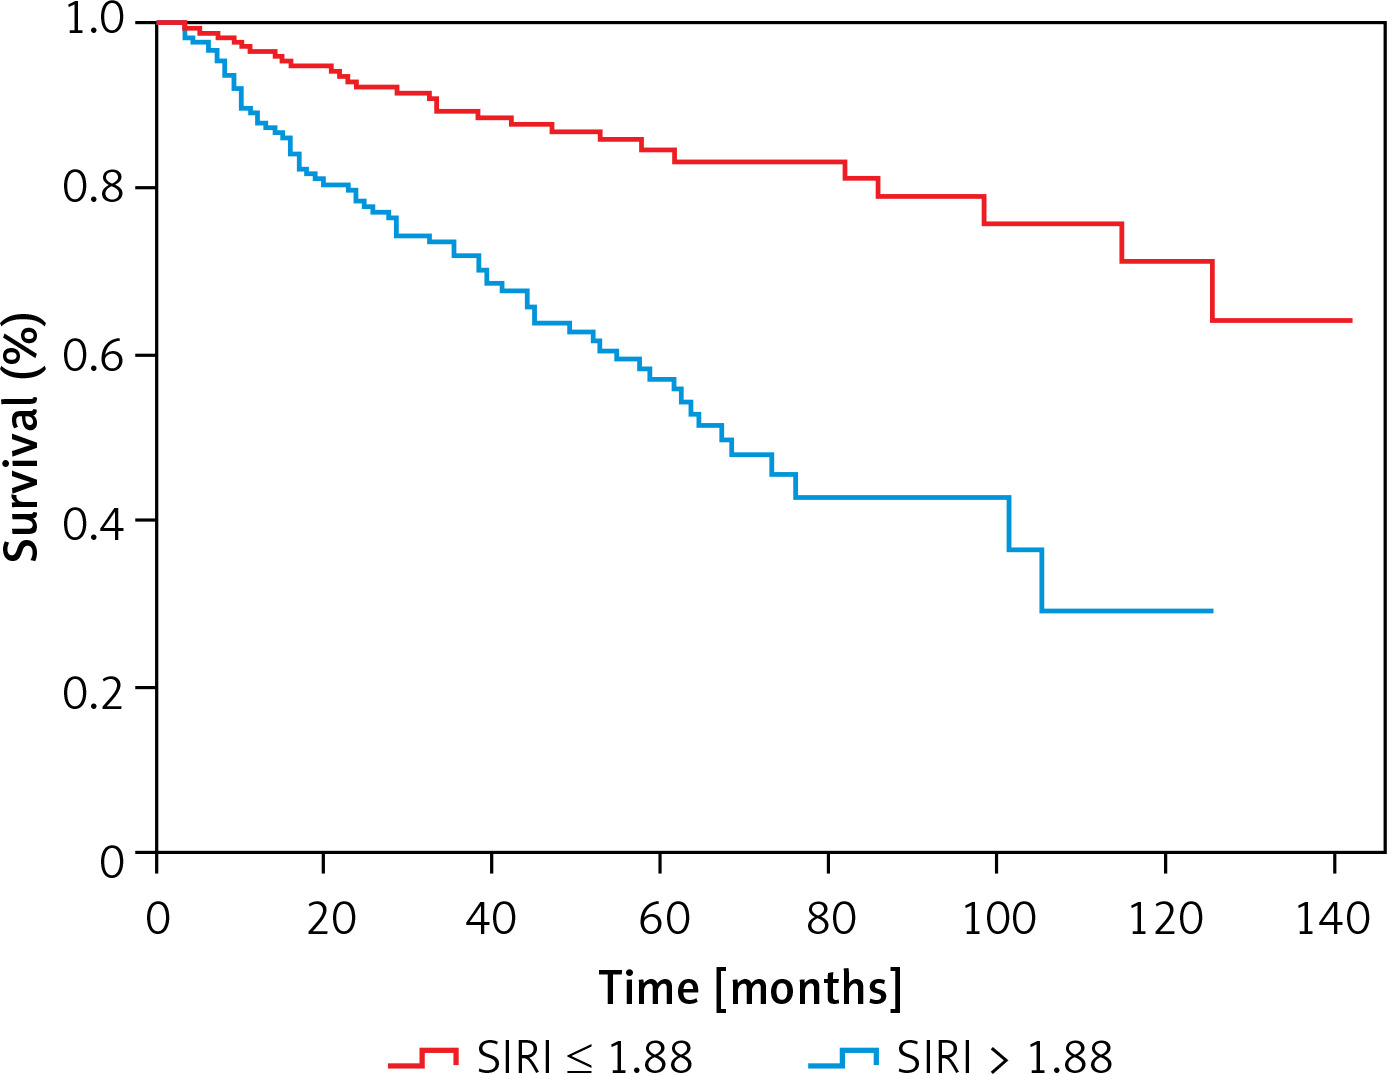
The medium survival time of the low SIRI group and high SIRI group was 48 months and 36 months, respectively. The parameters significantly differed (Z = –3.902, p < 0.001). In the low SIRI group, 50 patients died, and the all-cause mortality rate was 26.74%. The number of CVD deaths was 28, and CVD accounted for 14.97% of all deaths. 107 patients died in the high group, and the all-cause mortality rate was 58.15%. In this group, the number of CVD deaths was 70, and CVD accounted for 38.04% of all deaths. It demonstrated that all-cause and CVD mortality were higher in the SIRI > 1.88 group (all p < 0.001). The Kaplan-Meier survival curves indicated that there were statistically significant differences in all-cause (χ2 = 41.31, p < 0.001) (Figure 4) and CVD mortality (χ2 = 34.82, p < 0.001) between the two groups (Figure 5).
Cox regression analysis and nomogram
Variables with p < 0.10 in the univariate regression were included in the model for multivariate regression. SIRI, NLR, and MLR were all divided into two groups according to their median value. Our results showed that age (HR = 1.030; 95% CI: 1.016–1.044; p < 0.001), diabetes (HR = 1.909; 95% CI: 1.326–2.750; p = 0.001), history of CVD (HR = 2.172; 95% CI: 1.524–3.097; p < 0.001), SIRI > 1.88 (HR = 2.254; 95% CI: 1.362–3.729; p = 0.002), and serum phosphorus (HR = 1.541; 95% CI: 1.013–2.340; p = 0.043) were independent risk factors for all-cause mortality (Table II). The concordance index was 0.753 (95% CI: 0.716–0.790). For CVD mortality, age (HR = 1.017; 95% CI: 1.001–1.034; p = 0.044), diabetes (HR = 2.516; 95% CI: 1.560–4.058; p < 0.001), history of CVD (HR = 2.123; 95% CI: 1.348–3.344; p = 0.001), and SIRI > 1.88 (HR = 3.838; 95% CI: 2.022–7.285; p < 0.001) were independent risk factors (Table III). The concordance index was 0.771 (95% CI: 0.728–0.814). Both models showed good performance.
Table II
Cox regression analysis of risk factors for all-cause mortality
Table III
Cox regression analysis of risk factors for CVD mortality
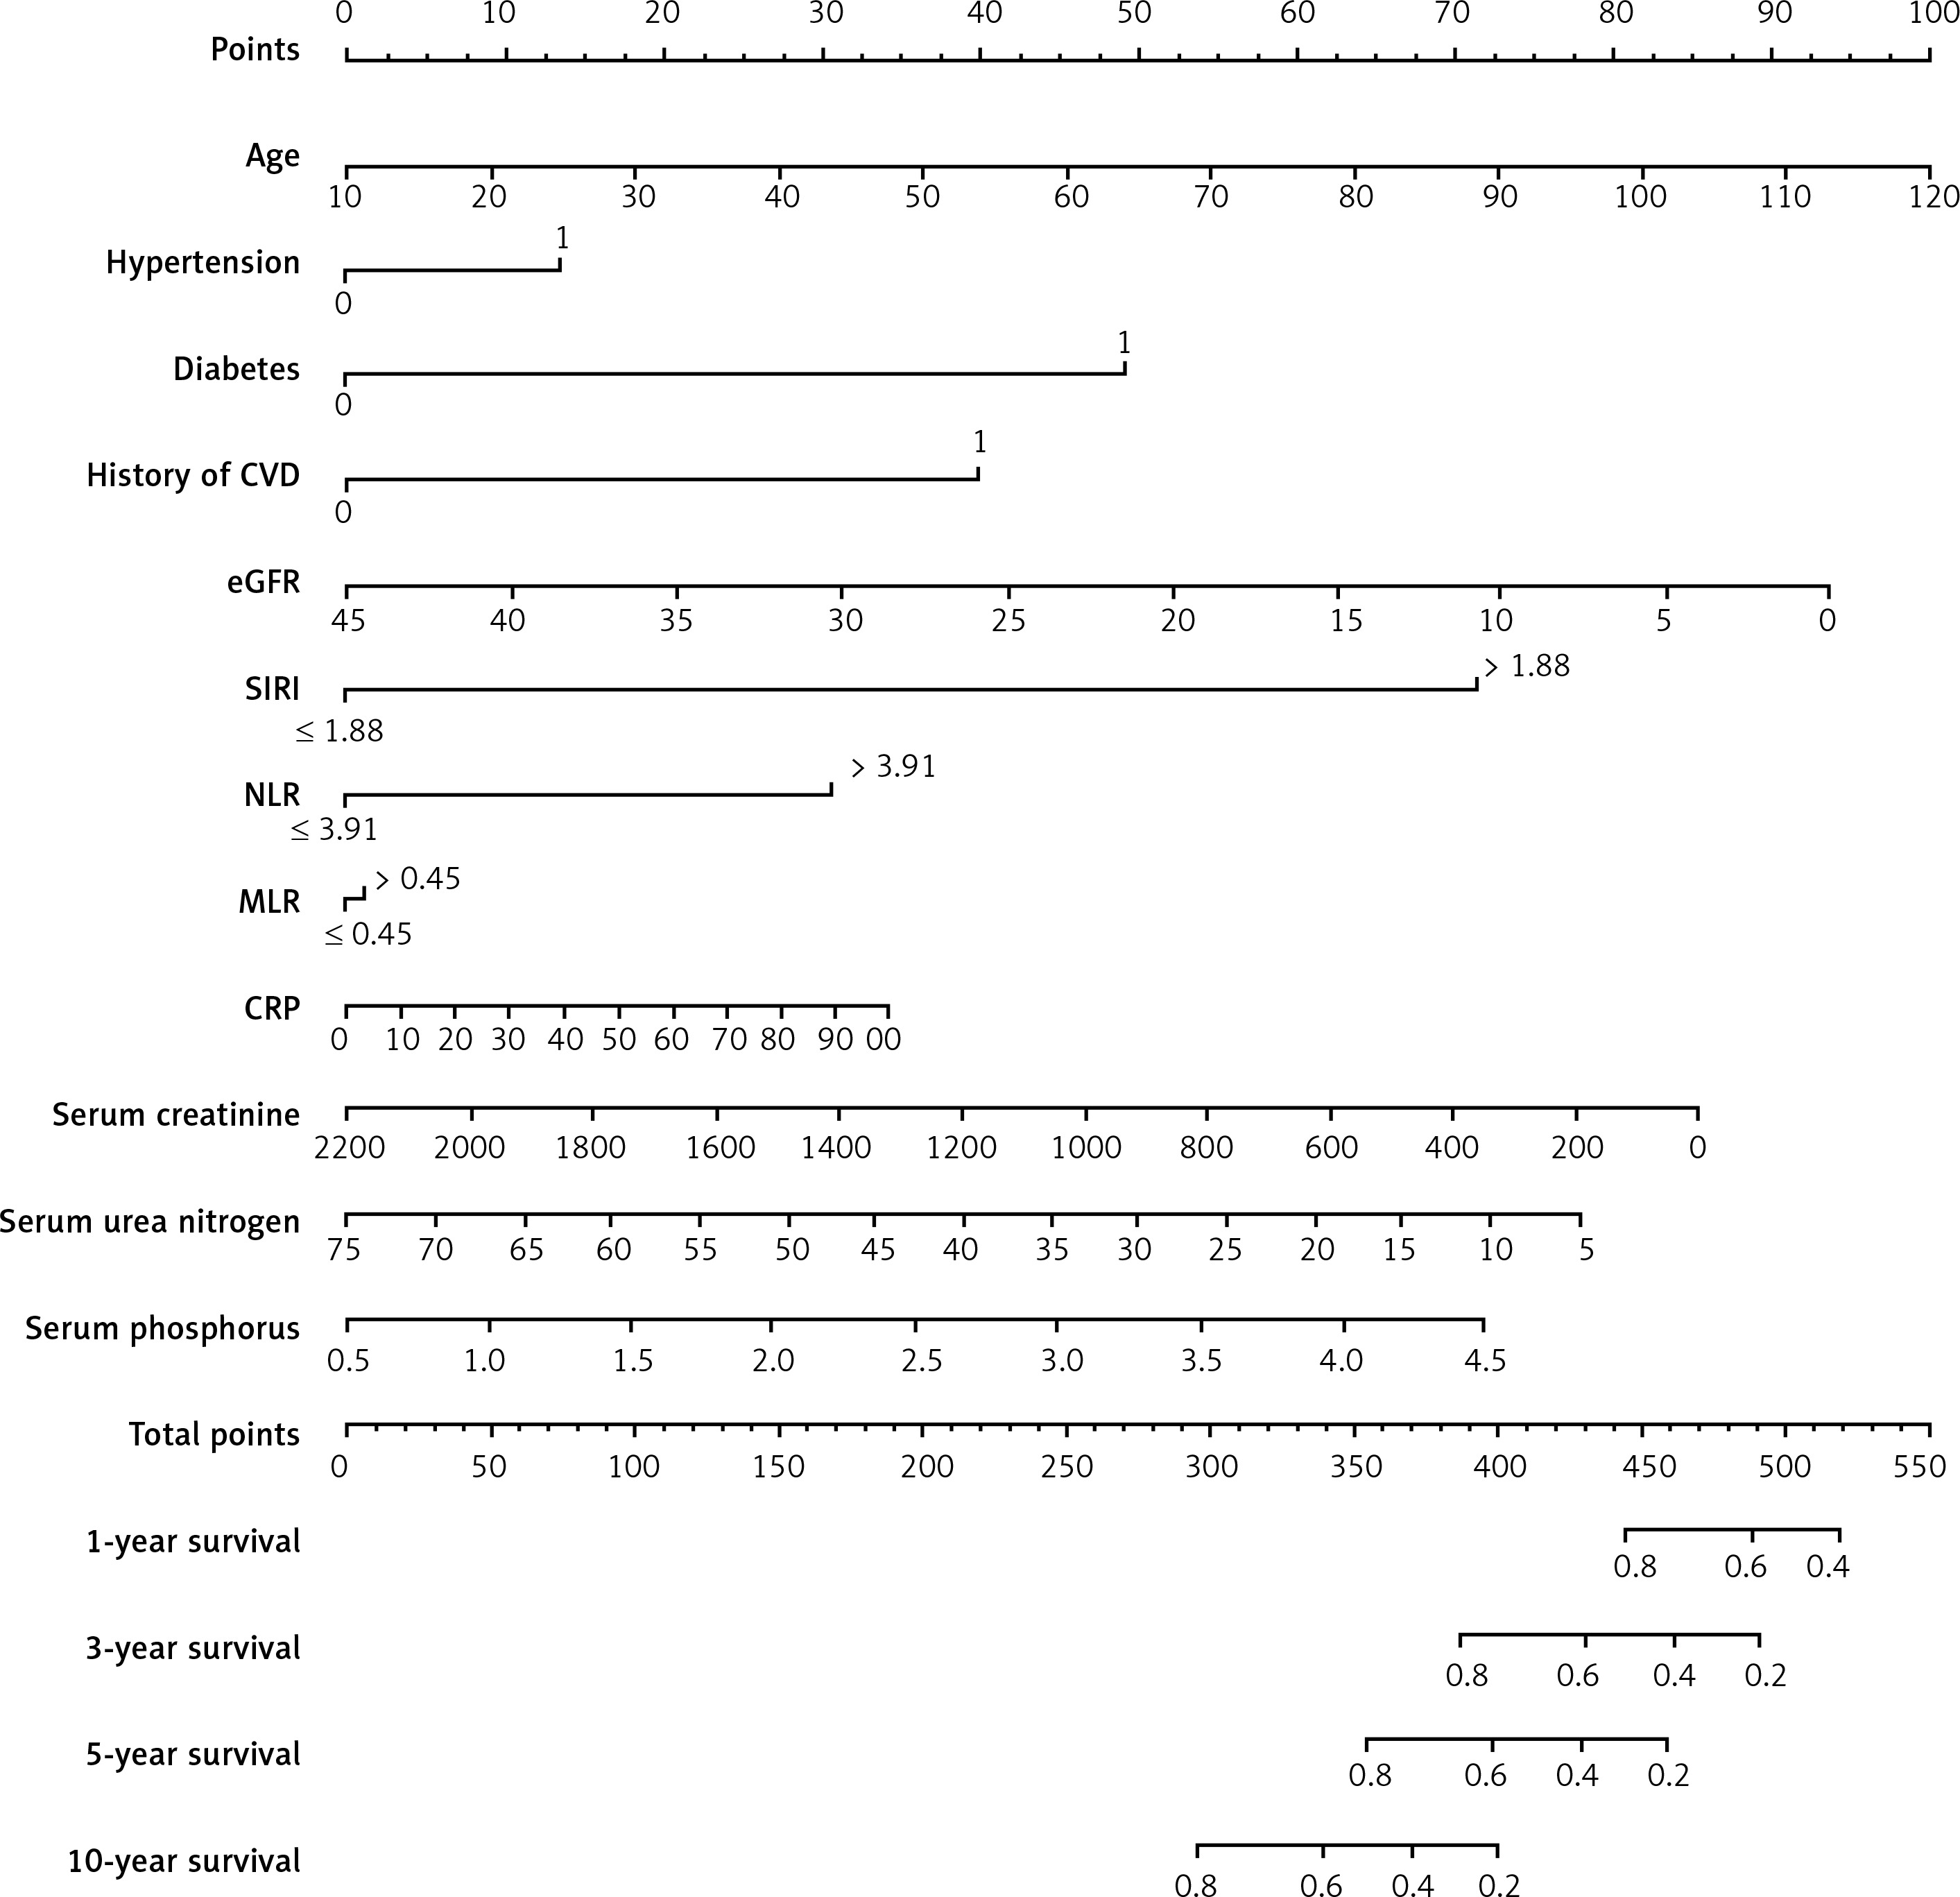
The predictive models were visualized as nomograms. Based on these predictors from the Cox regression model, we developed two nomograms to predict all-cause and CVD mortality at 1, 3, 5, and 10 years in MHD patients. For all-cause mortality, variables included age, hypertension, diabetes, history of CVD, eGFR, SIRI > 1.88, NLR > 3.91, MLR > 0.45, CRP, serum creatinine, serum urea nitrogen, serum albumin, and serum phosphorus (Figure 6). For CVD mortality, variables included age, hypertension, diabetes, history of CVD, eGFR, SIRI > 1.88, NLR > 3.91, MLR > 0.45, CRP, serum creatinine, serum urea nitrogen, and serum phosphorus (Figure 7).
Figure 6
Nomogram to predict risk of all-cause mortality in MHD patients. The value of each predictor was given a score on the point scale axis. A total score could be easily obtained by adding each single score. By projecting a line straight down on the total points scale, the probability of all-cause mortality at 1, 3, 5, and 10 years could be estimated
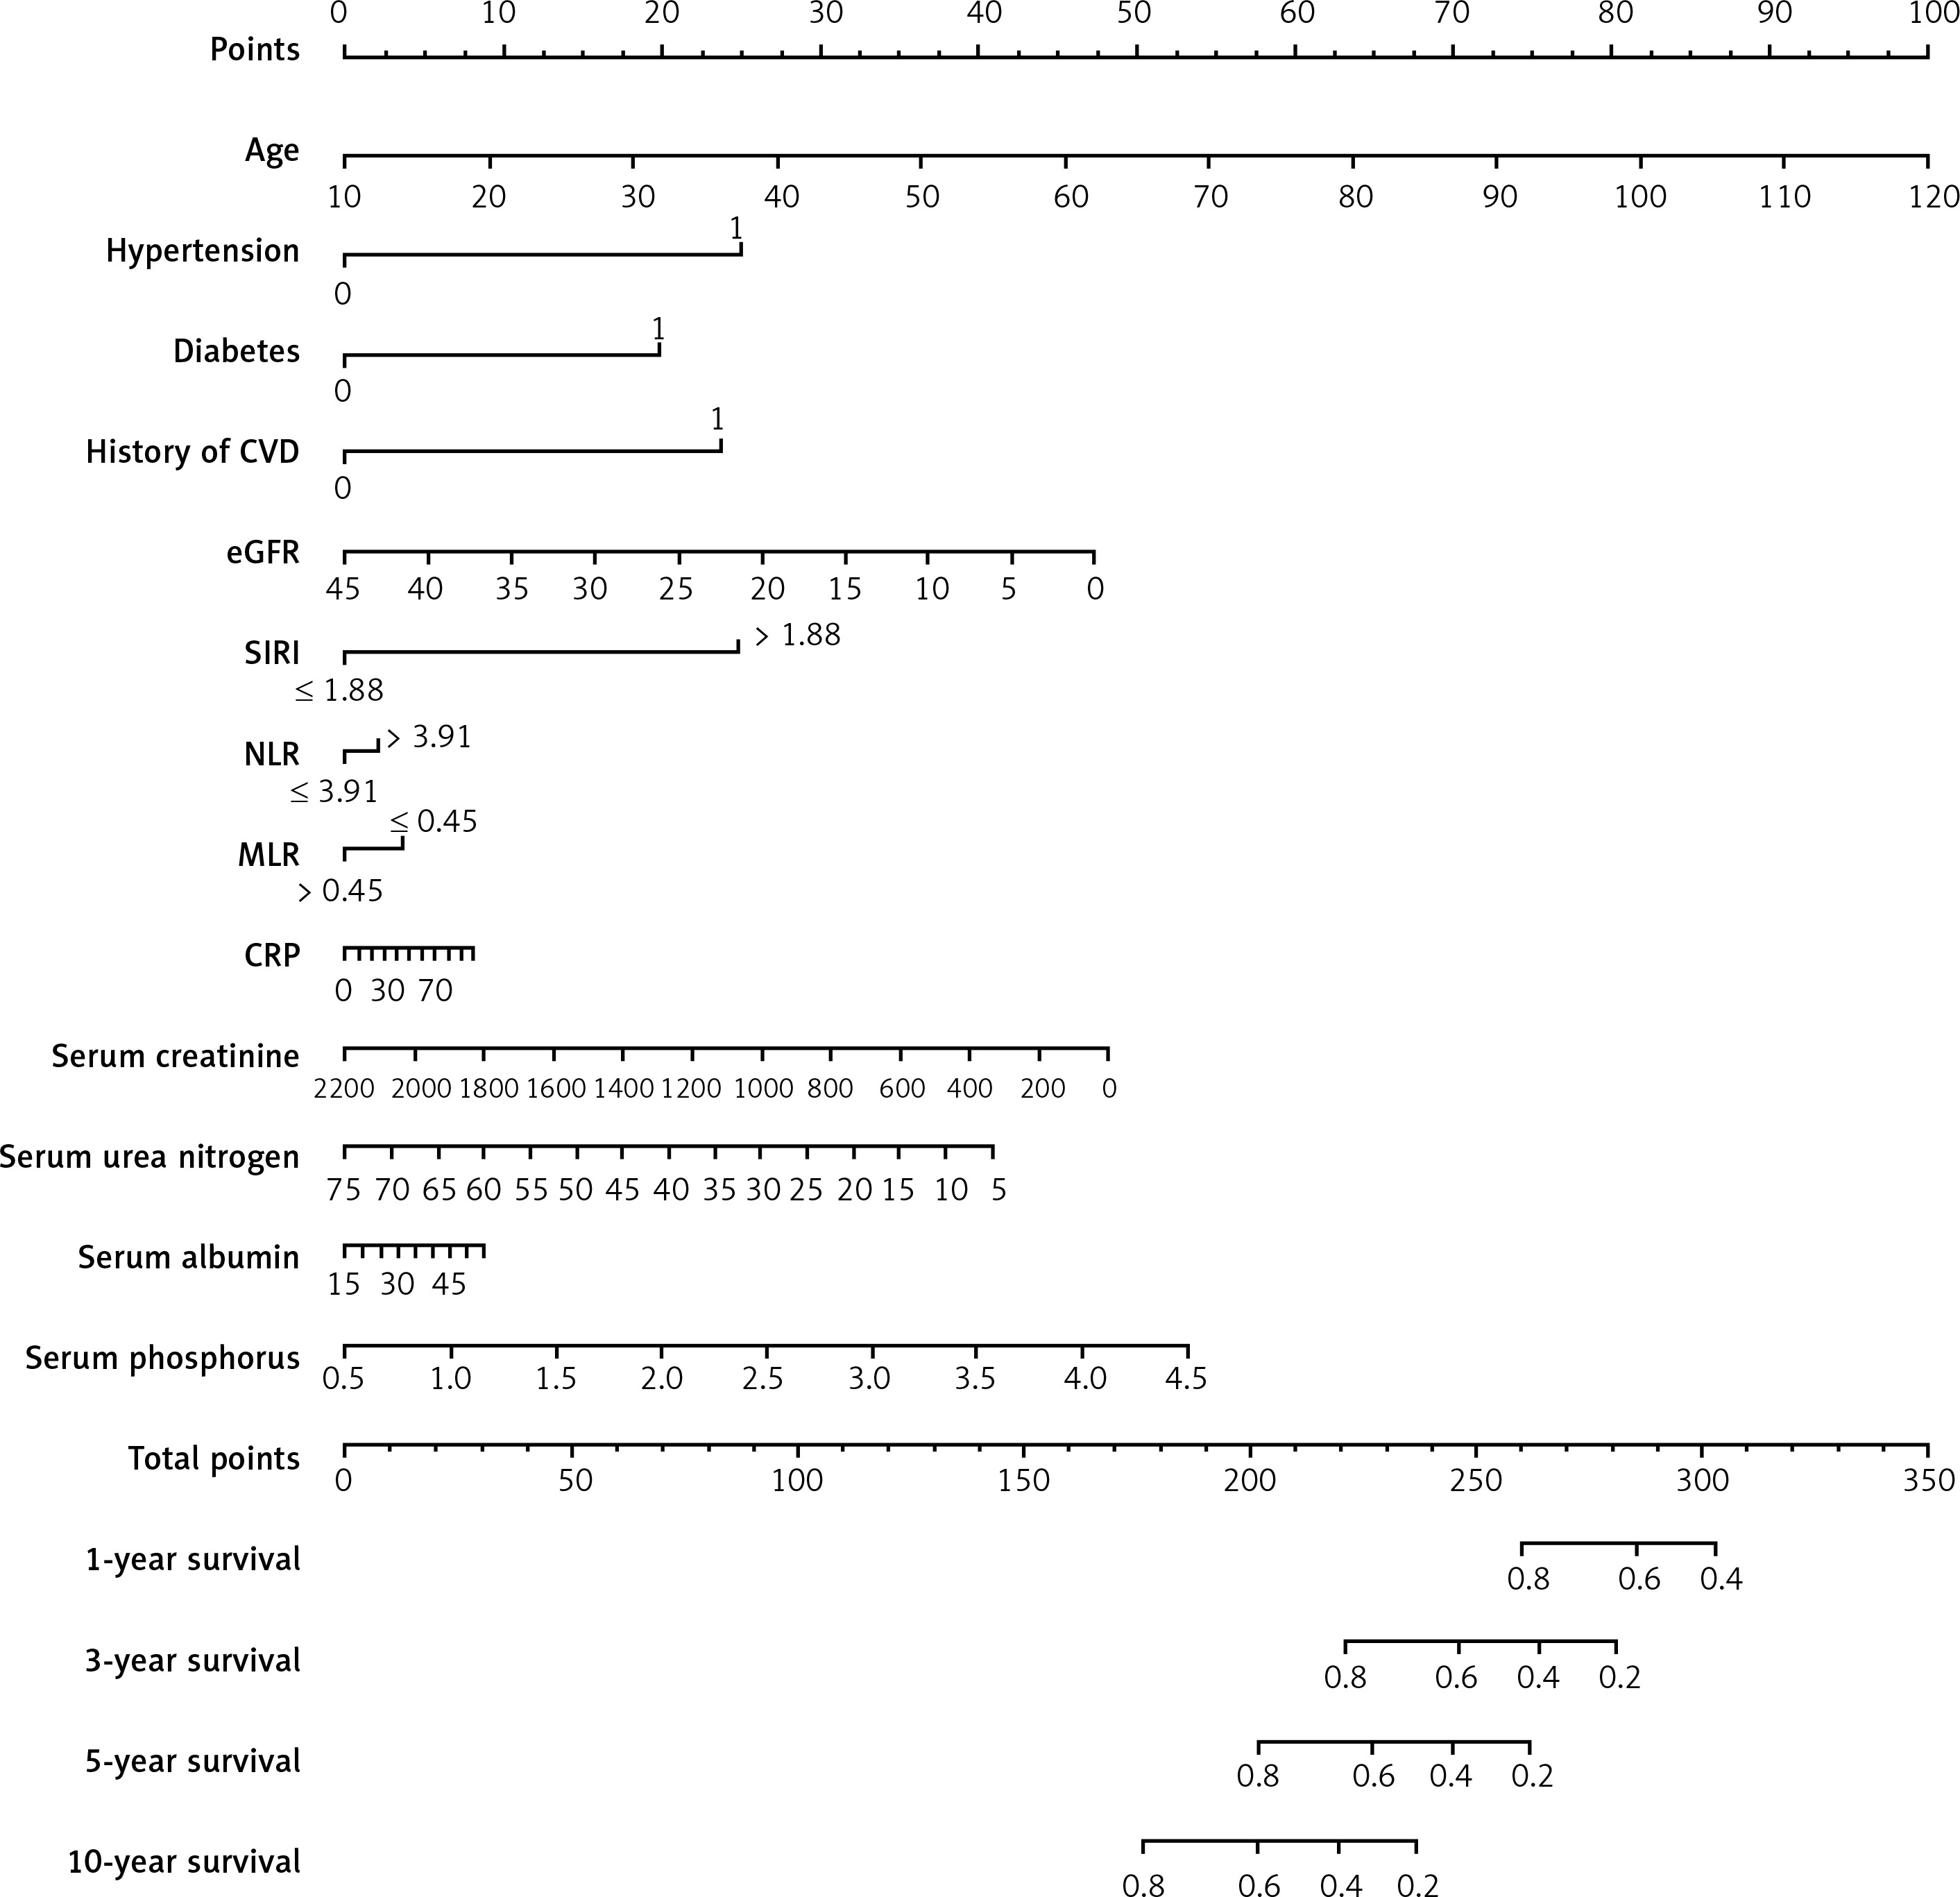
Figure 7
Nomogram to predict risk of CVD mortality in MHD patients. The value of each predictor was given a score on the point scale axis. A total score could be easily obtained by adding each single score. By projecting a line straight down on the total points scale, the probability of CVD mortality at 1, 3, 5, and 10 years could be estimated
Discussion
Our study confirmed that the baseline SIRI > 1.88 was independently associated with all-cause and CVD mortality in MHD patients, and SIRI had advantages in predicting the prognosis over other parameters, including NLR and MLR. Microinflammation is universal and uncontrolled both in MHD and PD patients. A study showed that higher SIRI levels were predictive of an increased incidence of all-cause and CVD deaths in PD patients, and SIRI had a prognostic value comparable to the NLR and MLR [16]. Their results were similar to ours. However, using the time-dependent ROC curve analysis, we further demonstrated that SIRI had a stronger ability to predict all-cause and CVD mortality in different lifetimes for MHD patients. Recently, Yan et al. [17] also found that SIRI was an accurate prediction value for diabetic MHD, and SIRI had a higher risk of all-cause death. Our study involved both diabetic and non-diabetic MHD patients and had a longer follow-up time. We demonstrated that SIRI was an independent risk factor not only for all-cause mortality but also for CVD mortality.
Previous studies have reported that a persistent microinflammatory state contributed pivotally to cardiovascular disease and was the leading cause of death [18]. Microinflammation could accelerate the progression of atherosclerosis, exacerbate myocardial ischemia and damage, and finally cause adverse cardiovascular outcomes [19]. In addition, Paraskevaidis et al. found that inflammation could excessively activate intracellular mitochondria, endoplasmic reticulum, and other organelles, releasing a variety of proteases, lipids, and inflammatory cytokines, thereby inducing myocardial cell damage [20]. Persistent microinflammatory status is a signature feature of chronic kidney disease (CKD). Studies have confirmed that MHD patients’ microinflammatory state was more apparent [21]. The development of microinflammation in MHD patients is of multifactorial origin, including uremic toxin, fluid retention, heart failure, and metabolic acidosis [22]. Other causes related to hemodialysis treatment include vascular access infection, blood exposure to exogenous substances such as dialysis membranes, and endotoxin in dialysate during HD, which stimulate an inflammatory response [23]. It has also been found that hemodialysis could alter hepatic blood flow and diminish liver function, leading to endotoxemia and thus increased inflammation [24]. We compared the incidence of CVD in the two groups at baseline. We found that the high SIRI group had a higher rate of CVD. This may suggest that before receiving dialysis, there already existed damage to the cardiovascular system caused by microinflammation in CKD patients. Similarly, all-cause and cardiovascular mortality were higher in the SIRI > 1.88 group. We believed that during the treatment of hemodialysis, MHD patients were still exposed long term to microinflammation, which would increase the risk of adverse cardiovascular outcomes and death.
In our study, the average age of patients in the high SIRI group was significantly higher. Aged people are generally considered to have reduced physical strength, declining multi-organ function, and a weakened immune system. Research has shown that SIRI was associated with aging [25]. In this study, we also found that serum albumin, serum creatinine, and serum potassium were significantly lower in the high SIRI group. The reason may be that although the blood creatinine level was lower in this group, these patients tended to have more significant symptoms of uremia and needed to start hemodialysis at the time. It is well accepted that the existence of inflammation will worsen protein catabolism. Also, uremic toxins can result in decreased appetite and inadequate nutrient intake. Serum albumin, serum creatinine, and serum potassium could also reflect the nutritional status of MHD patients, and lower levels of the above parameters indicated a poorer nutritional status. Research has shown that poor nutritional status would lead to decreased immune function and disorder of immunity regulation and exacerbate the inflammatory reaction [26]. That is, nutrition and inflammation are interrelated and exert a mutual influence on each other. In our study, we found that increased age, diabetes, and history of CVD were independent risk factors for all-cause and CVD mortality in MHD patients. These conclusions are consistent with clinical practice and previous studies. Additionally, elevated serum phosphorus is strongly associated with adverse outcomes in CKD patients. For example, Zhu et al. demonstrated that higher serum phosphate level could increase all-cause mortality and the incidence of adverse cardiovascular events [27]. Our results also showed that elevated serum phosphorus was an independent risk factor for all-cause mortality in MHD patients. However, for CVD mortality, Cox multivariate analysis showed no statistical difference. This may be due to the limited number of samples in the study.
The strengths of this study include a long follow-up period, and we confirmed that when patients began to undergo hemodialysis, SIRI could independently predict all-cause and CVD mortality in different lifetimes. However, this study also has some limitations. First, SIRI was not monitored dynamically, so the changing situation of SIRI with time was unknown. Second, this was a single-center study with a small sample size. Multicenter studies with a large sample size are needed to verify our results.
In conclusion, the inflammation index SIRI is associated with all-cause and CVD mortality and can be used as an effective independent predictive indicator among MHD patients. Therefore, monitoring the SIRI value was useful to identify high-risk MHD patients.