Obesity has substantial health, economic, and social consequences [1, 2]. Many genetic studies have demonstrated that genetic factors (genome) are the major association factors for obesity [3, 4].
It was reported that gene polymorphisms in fat mass and obesity-associated gene (FTO), melanocortin 4 receptor (MC4R) gene, transmembrane protein 18 (TMEM18) gene and many other genes were associated with obesity and diabetes [5–7]. In the past, body mass index (BMI) and waist circumference (WC) were adopted as obesity phenotypes by most studies. Now fat mass (FM) as one of the indicators of body composition has also been adopted. This study is to use the FM of body composition as the obesity phenotype in healthy people in Shanghai. Through genome-wide association studies (GWAS) of the obesity phenotype, it is intended to find the single nucleotide polymorphisms (SNPs) associated with FM of each part of the body in healthy people in Shanghai.
The purpose of this study is to identity the relationship of gene polymorphisms and FM, providing some clues for subsequent studying the molecular mechanism of FM.
Methods
Subjects
In total, 944 unrelated subjects were collected, including 364 young men aged 20–40 years, 239 young premenopausal women aged 20–40 years, and 341 postmenopausal women aged 50–80 years. The exclusion criteria were as follows: (1) diseases and drugs that caused osteoporosis, (2) any form of calcium and vitamin-D therapy in 3 months or taking antiosteoporotic drugs, (3) evidence of other metabolic disease, such as hypertension, diabetes, hyperlipidemia, hyperuricemia, BMI > 25 kg/m2, and (4) postmenopausal women who had experienced early menopause (before 45 years of age). The study was approved by the ethics committee of Shanghai Sixth People’s Hospital Affiliated to Shanghai Jiao Tong University School of Medicine.
FM parameter measurements
Total FM, arm FM, leg FM, trunk FM, total LM, arm LM, leg LM, and trunk LM were measured by dual energy X-ray absorptiometry (DXA) on a GE-LUNAR Prodigy (Lunar Corp., Madison, WI). The BMD (bone mineral density) of the lumbar spine 1–4 (L1-4) and the left proximal femur were also measured by the same DXA.
Genotyping
High-throughput genome-wide SNP genotyping was performed using the Illumina Infinium Asian Screening Array-24 + v1.0 BeadChip technology containing 846000 SNPs and following the manufacturer’s protocol.
Statistical analysis
We divided the data into three groups according to age, and differences between groups were assessed using an ANOVA test with Fisher’s protected least significant difference post hoc test for normal data. The threshold value of inter group significance was set as p < 0.05.
Genotype imputation and phenotype rank: SNP association test
We obtained a mean sample-level r2 of 0.736 estimated by 1% holdout SNPs on the array. We employ the Spearman correlation test with a permutation-based exact p-value to test phenotype rank–SNP associations. Up to 1010 simulation is performed. The whole genome trend χ2 test results in SNPs, chromosome, physical location, and p-value of the input R software to generate a genome-wide association analysis of the Manhattan map and Quantile-Quantile plots map (Q-Q map).
Results
Basic characteristics of the study subjects
The basic characteristics of the subjects were summarized in Table I. By filtering unqualified subjects, a total of 887 individuals were finally enrolled, including 327 postmenopausal women, 221 young premenopausal women, and 339 young men. BMD of the lumbar spine, femoral neck, and total hip in postmenopausal women (n = 327) were 0.988 ±0.153 g/cm2, 0.785 ±0.130 g/cm2, and 0.846 ±0.127 g/cm2, respectively. In the postmenopausal women group, there were lower hip and spine BMD than in the other two groups. This significant difference observed here was consistent with the previous findings. In the young men group (n = 339), Arm FM, leg FM, trunk FM and total FM were 1.263 ±0.705 kg, 4.683 ±1.844 kg, 9.351 ±4.258 kg and 15.886 ±6.693 kg, respectively. In the young men group, there were fewer arm FM, leg FM, trunk FM and total FM than in the other two groups. Lean mass parameters, arm LM, leg LM, trunk LM and total LM in the young men group (n = 339) were 5.766 ±0.781 kg, 17.356 ±2.192 kg, 24.271 ±2.792 kg and 51.337 ±5.571 kg, respectively. Lean mass values were higher in the young men than in the postmenopausal women group and premenopausal young women group.
Table I
Basic characteristics of the studied samples
| Traits | Total sample (n = 887) | Young men (n = 339) | Young women (n = 221) | Postmenopausal women (n = 327) |
|---|---|---|---|---|
| Age [years] | 43.4 ±17.5 | 29.9 ±6.1* | 32.5 ±5.9* | 64.5 ±6.7* |
| Height [cm] | 163.0 ±9.7 | 173.0 ±6.0* | 160.1 ±5.3* | 154.8 ±5.1* |
| Weight [kg] | 62.5 ±11.3 | 70.6 ±10.2* | 55.9 ±8.4* | 58.4 ±8.6* |
| BMI [kg/m2] | 23.1 ±2.7 | 23.3 ±2.2* | 21.4 ±2.8* | 24.2 ±3.0* |
| Spine BMD [g/cm2] | 1.091 ±0.161 | 1.139 ±0.139* | 1.172 ±0.121* | 0.988 ±0.153* |
| Neck BMD [g/cm2] | 0.902 ±0.160 | 1.002 ±0.138* | 0.924 ±0.112* | 0.785 ±0.130* |
| Total hip BMD [g/cm2] | 0.938 ±0.148 | 1.014 ±0.135* | 0.959 ±0.117* | 0.846 ±0.127* |
| Arm FM [kg] | 1.683 ±0.823 | 1.263 ±0.705* | 1.597 ±0.718* | 2.171 ±0.742* |
| Leg FM [kg] | 5.426 ±1.965 | 4.683 ±1.844* | 5.956 ±1.855* | 5.833 ±1.927* |
| Trunk FM[kg] | 10.114 ±3.970 | 9.351 ±4.258* | 9.035 ±3.542* | 11.608 ±3.457* |
| Total FM[kg] | 17.875 ±6.545 | 15.886 ±6.693* | 17.258 ±5.995* | 20.313 ±5.949* |
| Arm LM [kg] | 4.382 ±1.277 | 5.766 ±0.781* | 3.401 ±0.510* | 3.618 ±0.635* |
| Leg LM [kg] | 13.653 ±3.389 | 17.356 ±2.192* | 11.709 ±1.377* | 11.160 ±1.388* |
| Trunk LM [kg] | 20.180 ±3.954 | 24.271 ±2.792* | 17.627 ±1.768 | 17.694 ±2.085 |
| Total LM [kg] | 41.599 ±8.898 | 51.337 ±5.571* | 35.955 ±3.476* | 35.395 ±4.038* |
Relationship between FM parameters and GWAS, LM parameters and GWAS
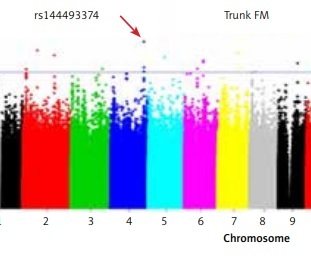
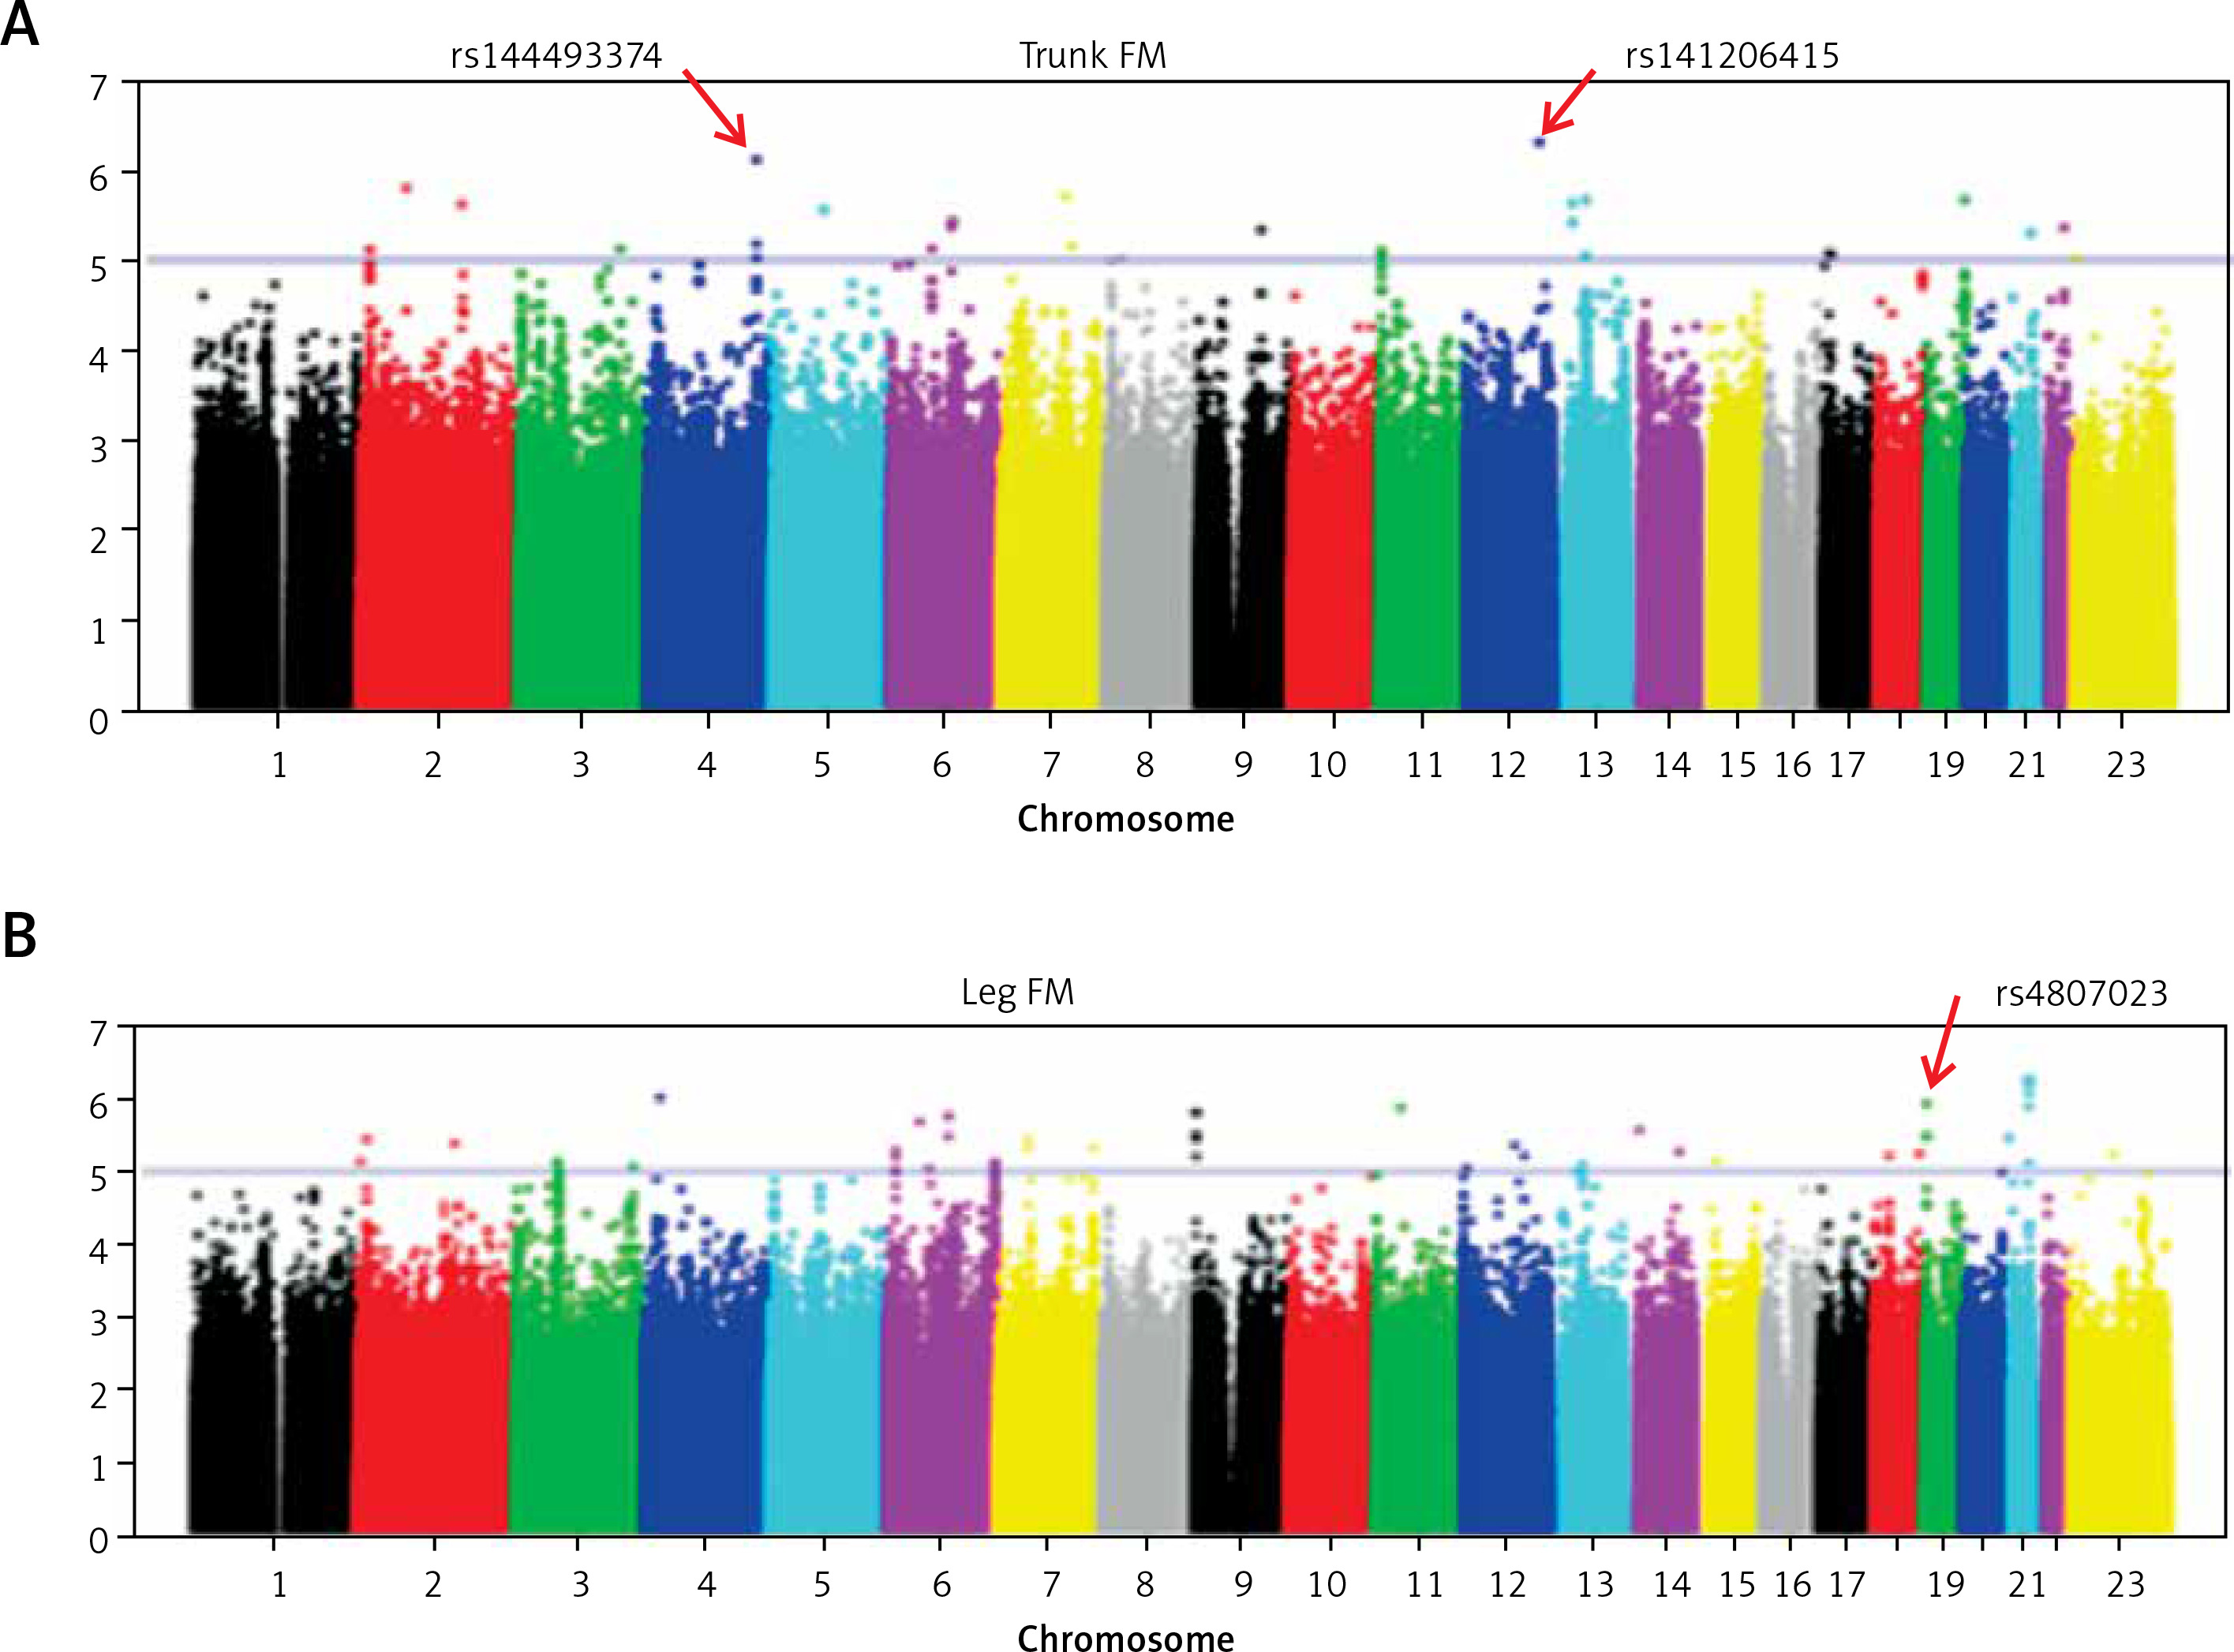
Table II showed the distribution of p-values of GWAS across the genome in our samples. We found some significant SNPs with p < 5 × 10⁻⁶. We listed some SNPs for fat mass in Table II. There was a marginal difference between SNP rs141206415 (p = 4.84 × 10⁻⁷) located in RAS protein activator like 1 (RASAL1) gene and trunk FM, suggesting that it was a susceptible site of trunk FM (Figure 1 A). The results showed that the rs144493374 of the Palladin (PALLD) gene was associated with trunk FM (p = 7.49 × 10⁻⁷) (Figure 1 A). Rs4807023 of the protein tyrosine phosphatase receptor S (PTPRS) gene was associated with leg FM (p = 1.20 × 10⁻⁶) (Figure 1 B).
Discussion
Our main findings were that three SNPs were significantly associated with FM phenotypes. The rs141206415 in the RASAL1 gene and rs144493374 in the PALLD gene were the quantitative trait locus of variation of trunk FM; and the rs4807023 in the PTPRS gene was associated with leg FM. To the best of our knowledge, this is the first study to investigate the RASAL1 gene, PALLD gene, and PTPRS gene and their association with FM.
RASAL1, encoding a Ras GTPase-activating protein (RasGAP) that catalyzes Ras inactivation. Osteopenia and osteoporosis are often detected in many of the RASopathies [8], but bone mineralization defects on the skeleton are poorly understood. Therefore, we speculated that this gene may regulate bone mineral density by regulating trunk FM. Further knowledge of the role of the RASAL1 on the fat mass function and more detailed musculoskeletal phenotyping will be critical in further understanding of Ras protein function.
Previous studies have found that PALLD was identified differentially expressed in sub-cutaneous abdominal adipose tissue (SCAAT) through a pathway analysis from obese compared to lean male subjects living in similar obesogenic conditions [9]. Another group of researchers observed an expression of this gene of more than eight-fold higher in large adipocytes compared to small adipocytes [10]. Our current research results also confirm the previous conclusion that this gene is associated with FM, although a specific mechanism may require further research to confirm.
Our study also showed that the rs74389755 polymorphism of the PTPRS gene was associated with leg FM. Previous genetic research of body composition identified that several CpG sites in the PTPRS gene differentially methylated between obese and non-obese children, significant correlations between methylation levels of CpG sites on PTPRS with BMI [11]. Previous research reports indicated that PTPRS was necessary for normal Wnt/β-catenin pathway activation [11, 12], thus we speculated that this gene affected bone mineral density by regulating leg FM. Therefore, the PTPRS gene has been confirmed to be associated with FM in people of different ages and genders, which lays a foundation for the feasibility of subsequent molecular biological mechanism research.
Our study also has some shortcomings. Our sample size was relatively small and we were likely underpowered to detect variants with small effect sizes. Subsequently, we will expand the sample of research subjects to verify the experimental results.
In conclusion, our study found some SNPs of the RASAL1, PALLD and PTPRS genes related to FM by GWAS in Chinese Han population. The results provided novel insight in the underlying biology of fat metabolism and obesity. Our findings may also provide a clue to elucidate the etiology and genetic pathogenesis of fat metabolism.