Frailty is a clinical condition characterized by systemic diseases and a lack of internal homeostasis [1]. In 2015, the World Health Organization defined frailty as “a progressive age-related decline in physiological systems that results in decreased reserves of intrinsic capacity, which confers extreme vulnerability to stressors and increases the risk of a range of adverse health outcomes” [2]. In recent years a small number of studies have focused on the relationship between frailty and osteoarthritis (OA). O’Brien et al. found frailty rates of 24% to 60% in older adults with OA [3]. Castell et al. conducted a cross-sectional study using data from six European countries and found that OA was strongly associated with frailty in the elderly [4]. Bindawas et al. found that participants with knee pain were more likely to become frail during 6-year follow-up, whereby demonstrating a causal relationship between knee pain and frailty, but it is unclear as to whether there is a causal relationship between frailty and OA [5]. Therefore, our study was the first that explored whether there was a correlation between frailty and OA via a cross-sectional study with the National Health and Nutrition Examination Survey (NHANES) database, and then further demonstrated that there was a causal relationship between the two through the use of Mendelian randomization (MR).
Methods
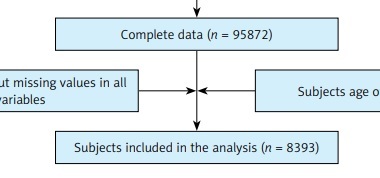
For the cross-sectional study, we used data from the NHANES database for a total of nine cycles from 2003 to 2020. OA data were obtained from interview data, according to “Which type of arthritis” for participants with OA. The frailty index (FI) was developed by Rockwood et al. based on a comprehensive geriatric assessment by counting the number of deficits accumulated; the covariates were age, gender, body mass index (BMI), race/ethnicity, education, marital status, hypertension, diabetes, poverty, smoking, cancer, and physical activity. The MR study used a two-sample MR. Exposure factors were FI data from Atkins et al. sequenced in 2021, containing 175,226 samples, 7,589,717 Single Nucleotide Polymorphisms (SNPs) [6]. The outcome factor for OA was derived from hospitals diagnosed, containing 50,508 samples and 15,845,511 SNPs, sequenced by Zengini et al. in 2018 [7].
Statistical analysis
NHANES data were analyzed by referring to the NHANES statistical tutorial, which followed its complex multi-stage probability sampling and weighted the samples, with the weight variable chosen as wtmec2yr, calculated as 1/9 * wtmec2yr, and all analyses were performed under complex weighting. Continuous data were statistically described by the mean and standard deviation (SD), and t-test was used for statistical analysis. Count data were statistically described by rates, and χ2 test was used for statistical analysis. Weighted logistic regression was used to explore the association of FI with OA. All covariates were using the lowest quartile as the reference. Model 1 is weighted logistic regression, the independent variable is FI and the dependent variable is OA; Model 2 was adjusted for age, sex, and race/ethnicity. Model 3 was further adjusted for all the covariates.
MR was used to explore the causal relationship between FI and OA using a two-sample MR. SNPs with genome-wide significance that were independent of and strongly correlated with OA were selected as instrumental variables for FI. FI with genome-wide significance parameter was set to be p < 5 × 10⁻⁸, the linkage disequilibrium parameter (r2) parameter was set to be 0.001, and the genetic distance was set to be 10 MB to screen for instrumental variables without linkage effects. Association between FI and OA was assessed using an inverse-variance weighting (IVW) method. Heterogeneity was examined using the IVW method. Sensitivity analysis was performed using the leave-one-out method. Pleiotropy analysis was performed using the Egger intercept method. Finally, the strength of association of the genetic instruments for each putative risk factor was quantified by the F statistic (F = β2/se2) for all SNPs, to assess the power of the SNPs. All statistical analyses were performed using R (4.1.2) software.
Results
Frailty Index and Osteoarthritis in NHANES: The screening flow chart is shown in Figure 1. A total of 8393 cases were included, of which 4590 (55%) were males and 3803 (45%) were females, which could represent 40,559,286 cases after weighting, of which 22,307,607 were males and 182,516,789 were females. The differences between the two groups are shown in Table I. The results of weighted logistic regression showed that the OR (95% CI) value of FI in model 3 was 1.07 (1.05,1.08), p-value < 0.0001, and the OR (95% CI) value of the age in model 3 was 1.01 (1.00, 1.02), p-value = 0.03. See Table II for details.
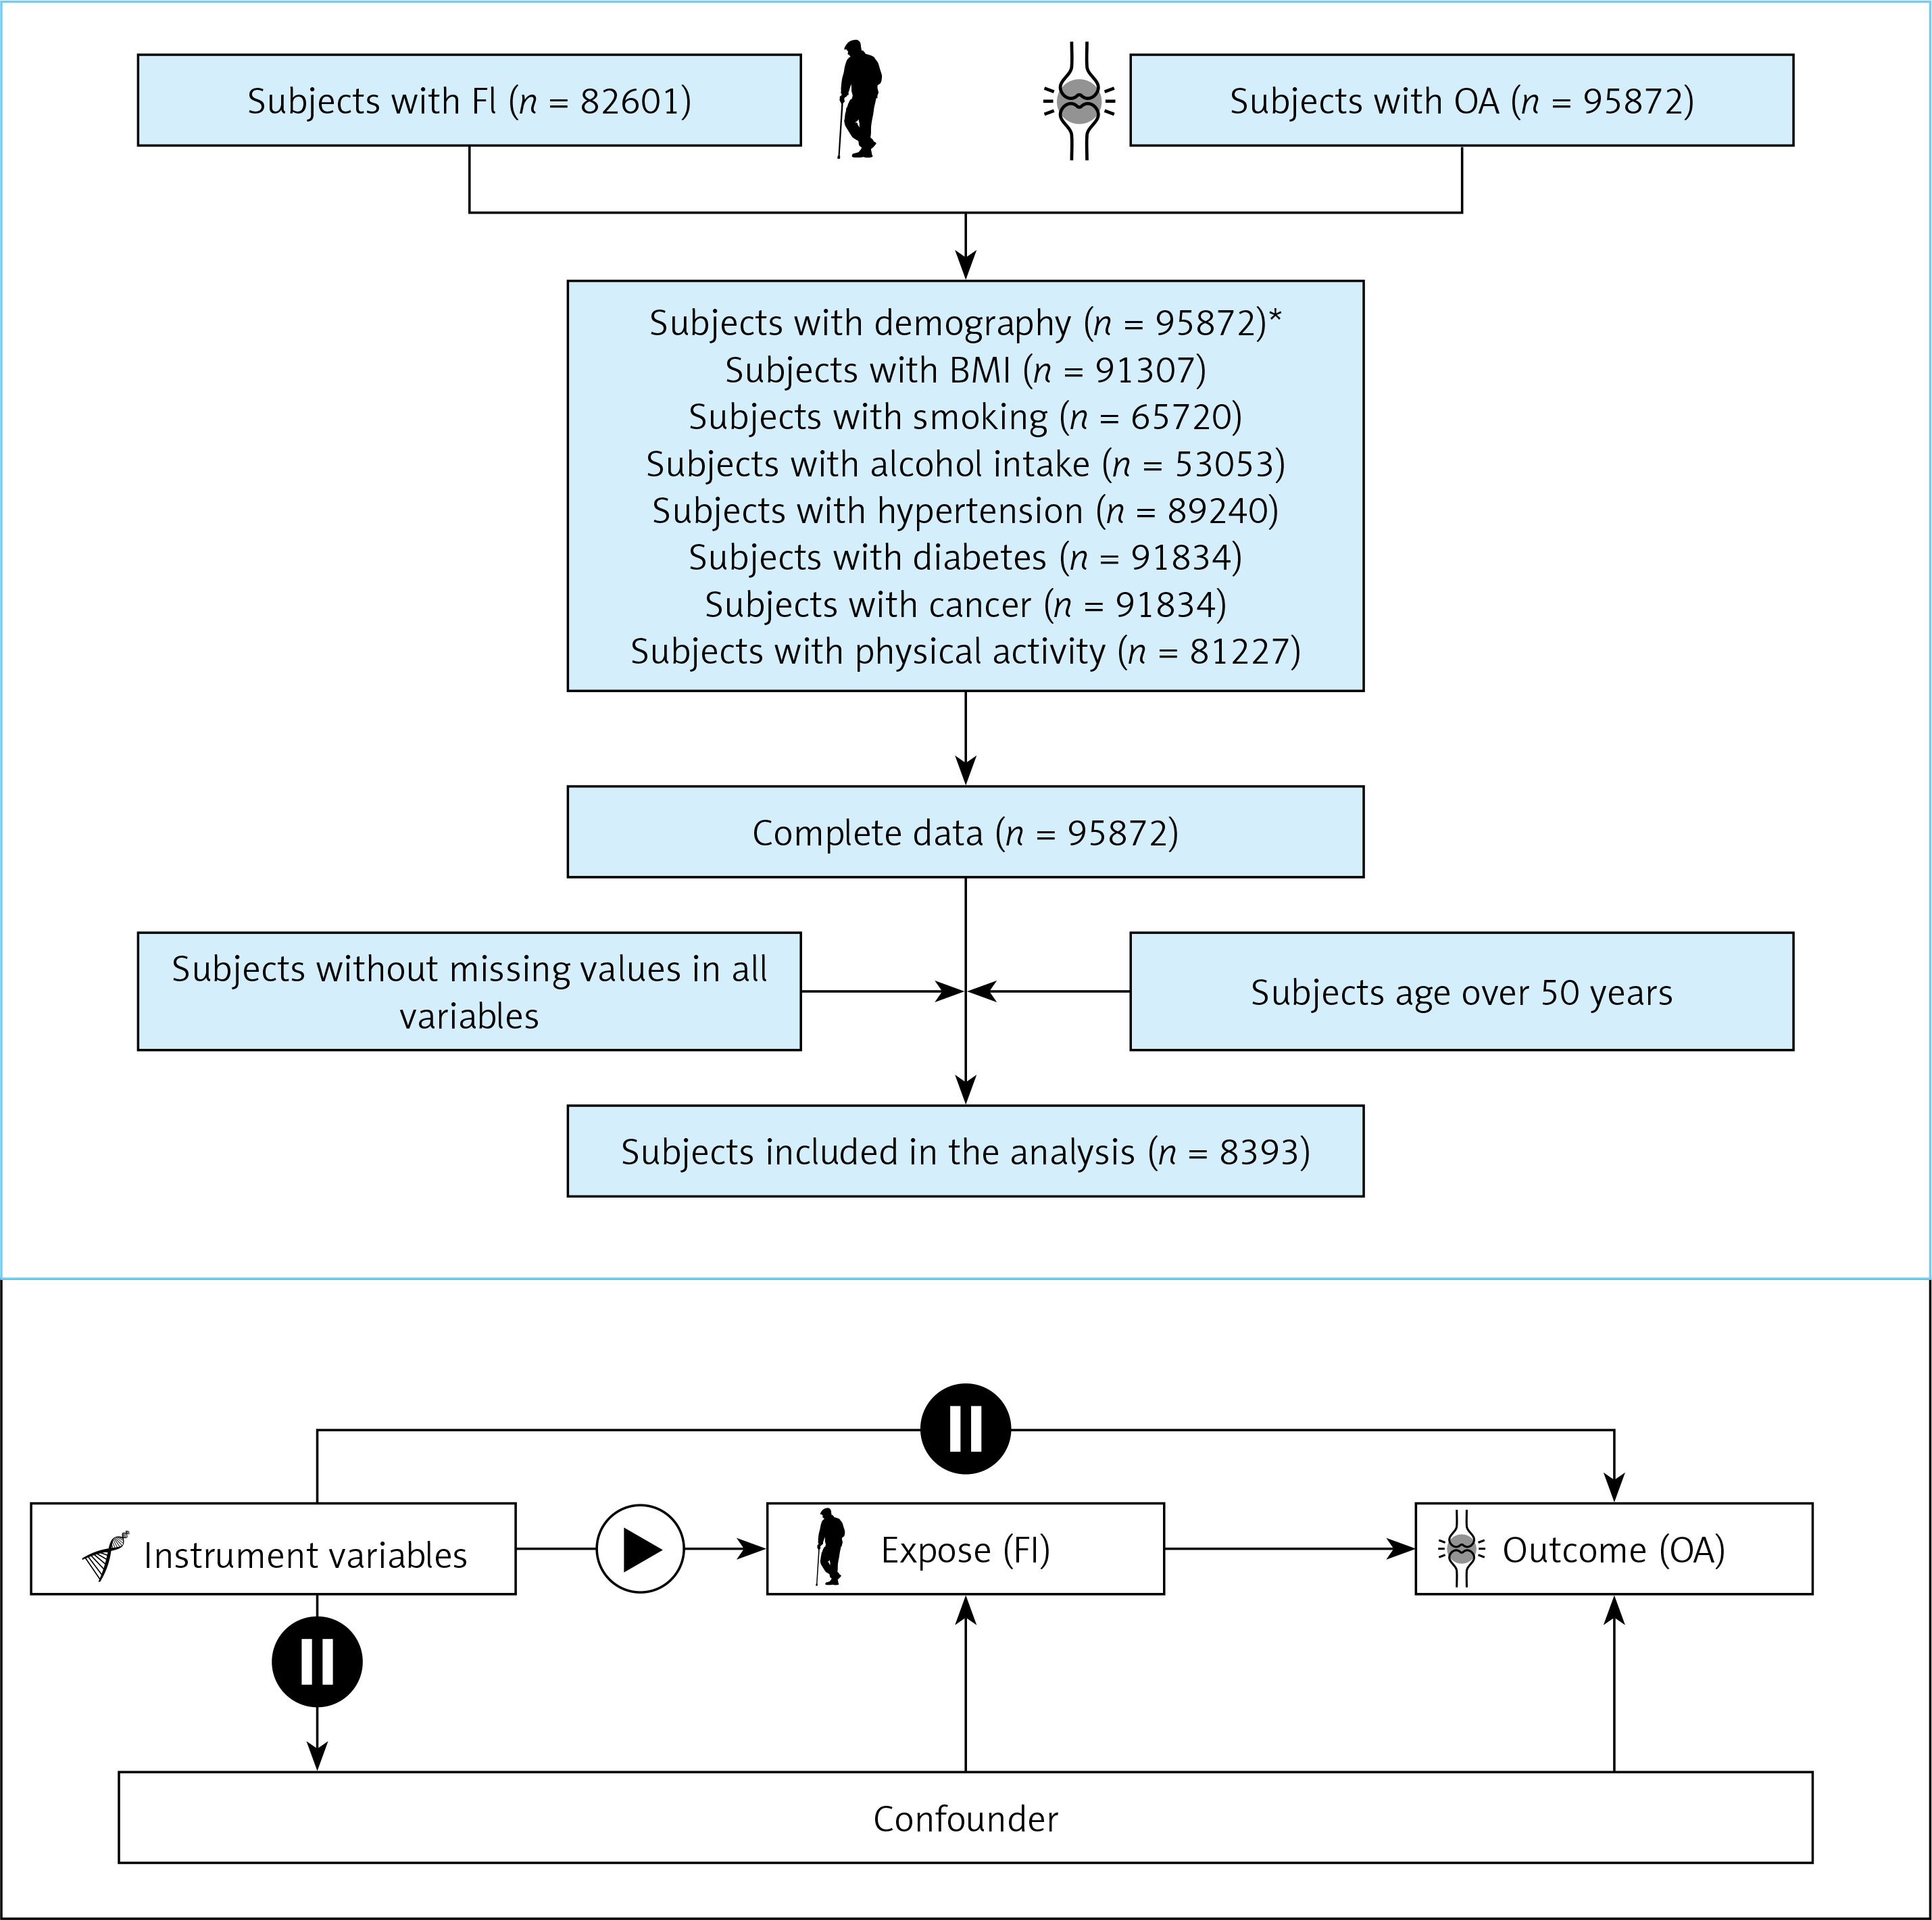
Table I
Weighted selected characteristics of the study population in females and males, NHANES (weighted N = 40,559,286).
Table II
Weighted ORs (95% CIs) of the associations between FI and OA
Causal Association between Frailty Index and Osteoarthritis in MR
A total of 10 SNPs were screened by FI and used as instrumental variables. The IVW results showed OR (95% CI) of 1.69 (1.01–2.83), p-value of 0.045, and total F-value of 33.15. The heterogeneity test showed p-value of 0.68 for the IVW method. The results of sensitivity analysis showed that no SNPs were found in the leave-one-out method. Pleiotropy analysis showed p-value of 0.86.
Discussion
Our study is the first to use the NHANES database for a cross-sectional study and combined with the MR method to explore the relationship between FI and OA. In the cross-sectional study, the results of the multivariate logistic analysis showed OR (95% CI) values of 1.07 (1.05, 1.08) for FI, respectively, with both results indicating a correlation between FI and OA. Further two-sample MR was used to explore the causal relationship between FI and OA. GWAS data for OA were derived from hospital-diagnosed, the same as those for OA in the NHANES database. MR analysis of the IVW method showed OR (95% CI) value of 1.69 (1.01–2.83), and demonstrating the causal relationship between FI and OA.
Osteoarthritis is a highly prevalent and widespread condition that affects millions of people worldwide. It is the most common form of arthritis and primarily affects the joints, especially those in the knees, hips, hands, and spine [8, 9]. The prevalence of osteoarthritis is known to increase with age, making it more common in older individuals. Additionally, factors such as obesity, previous joint injuries, genetic predisposition, and repetitive stress on the joints can contribute to the development of osteoarthritis in both young and older populations. Moreover, as life expectancy continues to rise and sedentary lifestyles become more prevalent, the burden of osteoarthritis is expected to grow further in the coming years. However, the association between osteoarthritis and FI has not been investigated yet. Osteoarthritis can affect joint function and mobility, potentially contributing to limitations in physical activity and functional decline [10]. As a result, individuals with osteoarthritis might be at a higher risk of accumulating deficits and having a higher frailty index score. On the other hand, the frailty index can be used as a tool to identify individuals with osteoarthritis who may be more vulnerable to adverse health outcomes and complications related to their condition [4]. By assessing overall health and functional status, healthcare providers can better tailor interventions and support to manage osteoarthritis and prevent further deterioration in these individuals. FI is a comprehensive and multidimensional tool used to assess the overall health status and vulnerability of individuals, particularly in the context of aging. It is designed to measure an individual’s level of frailty by considering health-related factors and functional capabilities. The concept of frailty goes beyond just chronological age and recognizes that as people grow older, they may experience declines in various physiological systems, leading to an increased risk of adverse health outcomes. This index serves as a valuable clinical and research tool, enabling healthcare professionals to better identify and understand the needs of older adults and design targeted interventions to improve their quality of life and overall well-being [5]. Researchers have utilized the NHANES database to investigate frailty among older adults and its association with various health outcomes. Chen et al. conducted a cross-sectional study based on NHANES database to investigate the association between the frailty index and chronic heart failure and they found that FI was not only associated with chronic heart failure but also connected with all-cause death among individuals with cardiac and cerebrovascular disease [11]. Another study aimed to investigate the relationship between tooth loss, periodontal diseases, and frailty in older American adults. The researchers used data from the National Health and Nutrition Examination Surveys (NHANES) conducted between 2011 and 2014, including 2,368 adults aged 60 years and older who were living in the community. Frailty was measured using a 49-item frailty index, while oral health indicators included the number of teeth and the presence of periodontal disease. They found that oral health is associated with frailty in older adults, and nutritional intake appears to have a modest effect on this association. The findings underscore the importance of maintaining good oral health as one ages and suggest that oral health indicators should be considered in routine geriatric assessments [12]. Blodgett et al. demonstrated that higher frailty levels were associated with a higher risk of death, particularly at older ages, using an FI based on common laboratory tests might offer scientific advantages and practical benefits in aging research and screening [13].
In previous studies, it has been found that people with OA have a higher prevalence of frailty in comparison to those without OA. Castell et al. used a cross-sectional study of a total of 2,455 male and female participants in six European countries and found a risk of frailty of 2.96 (2.11–4.16) in patients with OA in comparison to those without OA, which is similar to the cross-sectional findings of the present study and demonstrates a correlation between frailty and OA, but cannot prove whether there is a causal relationship between the two. In contrast to the present study, Wise et al. used only a cross-sectional study to explore the male population with radiographic hip OA or total hip replacement [14]. Misra et al. were the first to find in a cross-sectional study that the prevalence of frailty in radiographic knee OA is more common relative to the population without radiographic knee OA (4.39% vs. 2.77%), and then found in a longitudinal cohort study that patients with radiographic knee OA were at a greater risk of developing frailty (4.73% vs. 2.50%) [15]. Cook et al. first used a cross-sectional study to find that patients with OA (versus without OA) were more likely to be frail, with an adjusted relative risk ratio of 3.4 (3.3–3.6) [16], and then used a cohort study to find that patients with OA had an incidence of frailty of in the future of 1.7 (1.3–2.1) [17]. Moreover, both studies found a greater likelihood of frailty in patients with OA in cohort studies, whereby demonstrating a causal relationship between OA and frailty, but failed to demonstrate whether there was a causal relationship between frailty and OA. In contrast, our study combined cross-sectional and MR studies to first demonstrate the correlation between the two, and then further demonstrated a causal relationship between frailty and OA that was more reliable.
In addition, our study also found that frailty may be a better response than age to OA. A large number of previous studies have demonstrated that age is a high risk factor for OA, and the same conclusion was reached in our study, but OR (95% CI) for FI was consistently greater than OR (95% CI) for age in logistic regressions, which indicates that the effect of FI upon OA is greater than the effect of age upon OA. The concept of age is one of a natural age that reflects the length of time that a person has experienced since birth. In contrast, age-related changes occur at different rates for different individuals as they age. The physiological functions, cognitive functions, and mental states of individuals at the same age are not the same. In contrast, FI is more of a biological definition of age, and is a biological age obtained by combining various physical functions and psychological functions, which can better reflect the levels of physiological and psychological functions. Compared with age, FI can better reflect the degree of ageing of the body; therefore, FI may better reflect the situation of OA than age.
However, there are still some shortcomings in this study. The OA data in the NHANES database are derived from questionnaires on patients’ memory and may have some recall bias. Although the MR method was used to explore the causal relationship between the two in this study, MR presupposes the existence of a linear relationship between the two, and if it does not exist, MR is not applicable.
In conclusion, our study used cross-sectional studies and MR to demonstrate that there is both a correlation and a causal relationship between frailty and OA, and that frailty may be a potentially better response than age to OA.