Introduction
Diabetic kidney disease (DKD) is the most frequently occurring complication of diabetes mellitus, and it is the primary cause of end-stage renal disease and one of the main causes of death in patients with diabetes. Data from the 2015 IDF Diabetes Atlas [1] revealed that there were approximately 415 million patients with diabetes worldwide, accounting for 1 in every 11 adults. The number of patients with diabetes was predicted to reach 642 million by 2040. In China, there are presently 109 million patients with diabetes, and this number is expected to reach 151 million by 2040. DKD is a progressive disease and is the second-most common complication in the late stage of diabetes and a major cause of chronic renal failure, making it a major cause of morbidity and mortality among patients with diabetes [2]. The pathological features of DKD include mesangial expansion and hypertrophy, protein deposition in extracellular matrix (ECM) and podocyte apoptosis [3], followed by glomerular sclerosis, tubulointerstitial fibrosis and eventually renal failure.
Long non-coding RNAs (lncRNAs) are a class of RNA molecules that do not encode proteins and are typically more than 200 nucleotides in length. While recent studies have confirmed that some lncRNAs as important regulators involved in the development of diabetes [4–10], their precise role in DKD remains unclear. Overexpression of lncRNA UBE2R2-AS1 promotes tumour cell apoptosis; however, its role in high-glucose-induced renal tubular epithelial cell apoptosis has not yet been elucidated. In our present study, we discuss the effects and mechanisms of lncRNA UBE2R2-AS1 in renal injury induced by diabetes in an in vitro study.
Material and methods
Materials
The following chemicals and assay kits were used: DMEM F-12 medium (Hyclone, USA); foetal bovine serum (Gibco, USA); penicillin, streptomycin and amphotericin B (Lonza, USA); trypsin (Gibco, USA); TRIzol reagent (Invitrogen, USA); cDNA reverse transcription kit (Invitrogen, USA); SYBR green PCR fluorescent dye (Invitrogen, USA); human TNF-α and IL-6 ELISA Kit (R&D, USA); mouse anti-rabbit TLR4, MyD88 and NF-κB (p65) antibodies (Abcam, UK); horseradish peroxidase (HRP) labelled anti-rabbit and anti-mouse secondary antibodies (Beijing Dingguo Changsheng); fluorescence labelled anti-mouse and anti-rabbit secondary antibody (Invitrogen, USA); flow cytometry kit (Jiangsu Keygen Biotech, China); shRNA-negative control (shRNA-NC) and lncRNA UBE2R2-AS1 inhibitor, shRNA-UBE2R2-AS1 and miR-887-3p inhibitor (Jiangsu Keygen Biotech, China).
Cell culture
The human proximal tubular epithelial cell line HK-2 was purchased from the American Standard Culture Collection and was cultured in DMEM-F12 medium containing 10% fetal bovine serum, 104 U/l penicillin, 104 U/l streptomycin and 20 mg/l amphotericin B in a humidified incubator at 37°C with 5% CO2. Cells were observed under an inverted microscope and were observed to merge into a monolayer, displaying a typical paving stone-like arrangement after around 3 days.
Cell grouping and stimulation
Cells were seeded in 6-well plates and synchronised for 12 h in serum-free DMEM-F12 medium until they reached 70%–80% confluence. HK-2 cells were divided into three groups as follows: the CG was cultured in conventional DMEM-F12 medium, the model group was treated with high glucose (D-glucose 30 mmol/l); the model + shRNA-NC group was transfected with non-targeting shRNA prior to treatment with high glucose; the model + shRNA group was transfected with shRNA targeting UBE2R2-AS1 prior to treatment with high glucose, and the model + shRNA + miRNA inhibitor group was co-transfected with shRNA-UBE2R2-AS1 and miR-877-3p inhibitor prior to treatment with high glucose. The cells were transfected with shRNA-NC, shRNA-UBE2R2-AS1 or miR-877-3p at room temperature for 12 h.
Flow cytometry analysis of apoptosis
Apoptosis was induced in each group as previously described. Cells (5 × 10⁵) were collected by centrifugation and resuspended in 1× binding buffer (diluted from 5× binding buffer with distilled water). Next, 5 µl of FITC and 10 µl of propidium iodide were added to each tube, gently mixed and incubated in the dark for 5 min prior to flow cytometry analysis.
Measurement of inflammatory factor concentrations by ELISA
Supernatants were collected from the cells from each group to measure the concentrations of inflammatory factors IL-6 and TNF-α, using ELISA kits according to the manufacturer’s protocol (Sigma, USA).
RT-PCR measurement of lncRNA UBE2R2-AS1 and miR-877-3p mRNA expression
Total RNA was extracted from cells from the different groups using TRIzol reagent and the concentration determined using an ultraviolet spectrophotometer. cDNA was synthesised by reverse transcription using 2 µg of RNA from each group in a 20-µl reaction system, according to the manufacturer’s instructions (Toyobo, Japan). Primers were synthesised from Jiangsu Keygen Biotech as follows: lncRNA UBE2R2-AS1 F: 5’-GTCTGGGTAGTCAGCTGTGAGG-3’, R: 5’-TCTCCAGAGGCAGTGTTCCTC-3’; miR-877-3p F: 5’-TCCTCTTCTCCCTCCTCCC-3’, R: 5’-CTCTACAGCTATATTGCCAGCC-3’ and U6 F: 5’-GGGAGATACCATGATCACGAAGGT-3’, R: 5’-CCACAAATTATGCAGTCGA-GTTTCCC-3’. Pre-denaturation was performed at 95°C for 10 min followed by 40 cycles of denaturation at 95°C for 10 s, annealing at 60°C for 20 s and extension at 72°C for 15 s. The relative expression of the target genes was calculated using the 2–ΔΔCT method. Three duplicate wells were set up for each group, and the experiment was repeated three times in an in vitro study.
Western blot analysis of protein expression
Cells from each group were collected and lysed to extract total protein using lysate buffer, and protein concentration was measured using a BCA kit (Sigma, USA) according to the manufacturer’s instructions. Total protein samples (50 µg) were taken from each group, separated using 10% SDS–PAGE, electrotransferred to PVDF membranes, blocked using 5% skimmed milk at room temperature for 2 h, washed with PBST (phosphate buffered saline) and incubated with anti-TLR4, anti-MyD88, anti-NF-κB (p65) or anti-GAPDH antibody (1 : 1000 for all) overnight at 4°C. The next day, after rinsing with TBST (Tris-Buffered Saline and Tween 20), HRP-labelled goat anti-rabbit and anti-mouse IgG was added and incubated for 2 h at room temperature. Bands were visualised using ECL reagents, using GAPDH as an internal control. The experiment was repeated three times under the same experimental conditions and the grey value of the target bands was determined using Image J software. This experiment was repeated 3 times
Immunocytochemistry measurement of TLR4, MyD88 and NF-κB (p65) protein expression
Cells were cultured in six-well plates, washed with 4% paraformaldehyde for 20 min, permeabilised with 0.5% Triton X-100 for 30 min and incubated with a drop of primary antibody diluted with 1% bovine serum albumin (BSA) at 4°C overnight. The next day, secondary antibody (diluted 1 : 200 with 1% BSA) was added dropwise and incubated at 37°C in the dark for 1 h. The slice was then washed with PBS and sealed with DFX-containing anti-quenching sealer and observed under a fluorescence microscope. Fluorescence images were analysed using Image-Pro Plus 6.0 software. Ten fields were randomly selected for each group and the average fluorescence intensity of each field was calculated by dividing the integral fluorescence intensity by the area of the field.
Luciferase reporter assay
Cells were transfected with empty vector or miR-877-3p using luciferase reporter containing 3′-UTRs of TLR4, wild-type or mutant UBE2R2-AS1 fragments using Lipofectamine 2000 (Invitrogen) in 96-well plates. Cells were harvested for 48 h after transfection and luciferase activity was measured using chemiluminescence in a luminometer (PerkinElmer Life Sciences) using the Dual Luciferase reporter assay system (Promega).
Statistical analysis
Relative data were analysed by SPSS 22.0 and graphs were drawn using GraphPad Prism 7.0. Data were expressed as mean ± SD, t test was used for pairwise comparison and one-way analysis of variance was used for comparison among multiple groups. P-values < 0.05 were considered statistically significant. All experiments were repeated 3 times.
Results
LncRNA UBE2R2-AS1 and miRNA-877-3p gene expression
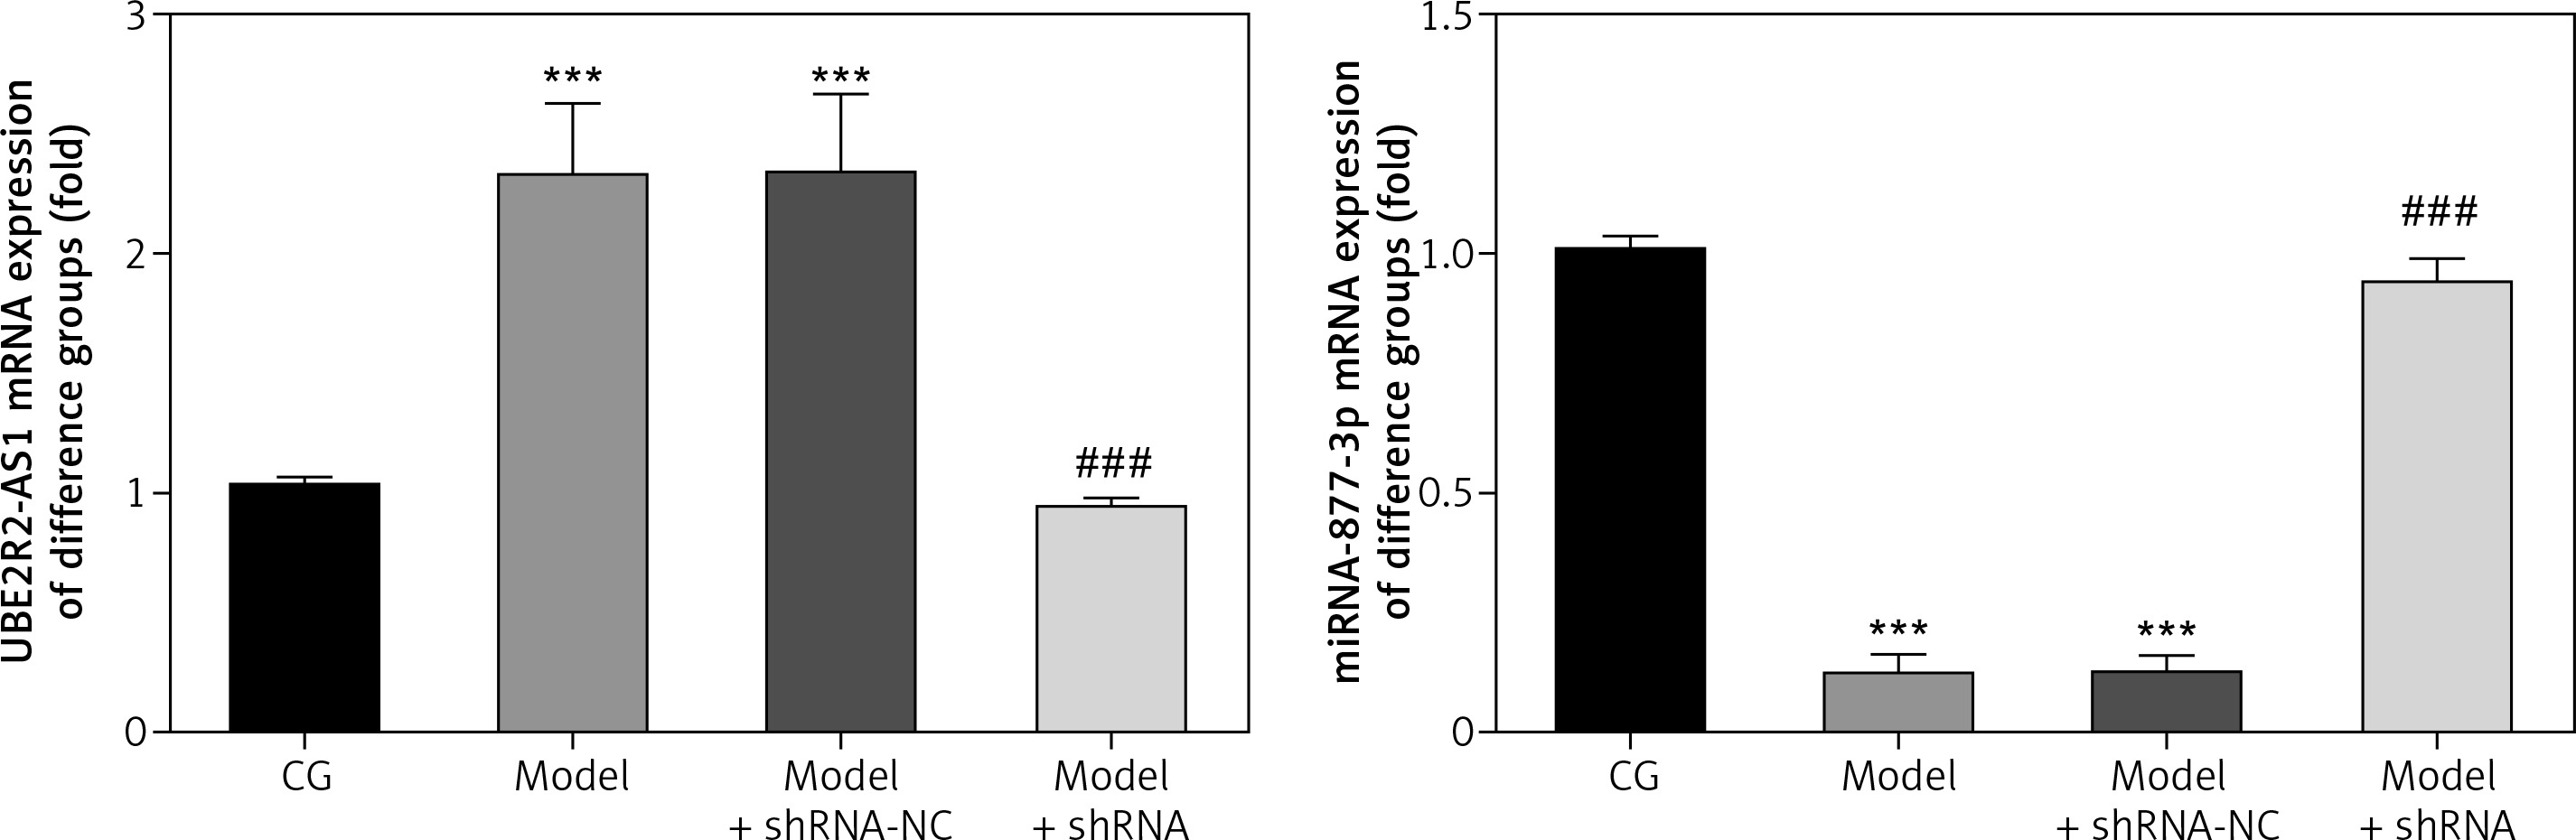
RT-PCR analysis revealed that UBE2R2-AS1 mRNA expression was significantly higher (p < 0.001) in the model and model + shRNA-NC groups, whereas miRNA-877-3p mRNA expression was significantly lower (p < 0.001) in these groups compared with the CG (Figure 1). Compared with the model group, UBE2R2-AS1 mRNA expression was significantly down-regulated (p < 0.001) and miRNA-877-3p gene expression was significantly higher (p < 0.001) in the model + shRNA group (Figure 1).
Figure 1
lncRNA UBE2R2-AS1 and miRNA-877-3p gene expression in the different groups
CG – control group, Model – high-glucose model group, Model + shRNA-NC – HK-2 cells transfected with shRNA-negative control and treated with high-glucose medium, Model + shRNA – HK-2 cells transfected with shRNA UBE2R2-AS1 and treated with high-glucose medium. ***P < 0.001 vs. NC group; ###p < 0.001 vs. Model group.
Effects of lncRNA UBE2R2-AS1 knockdown on cell apoptosis
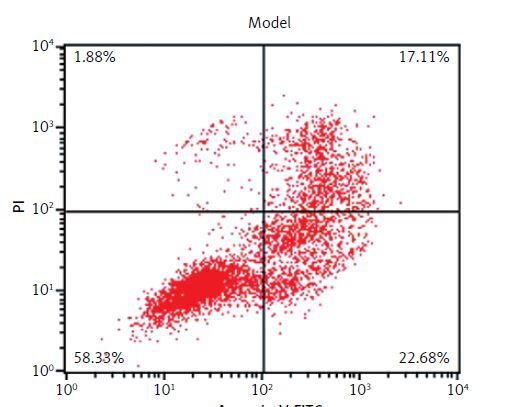
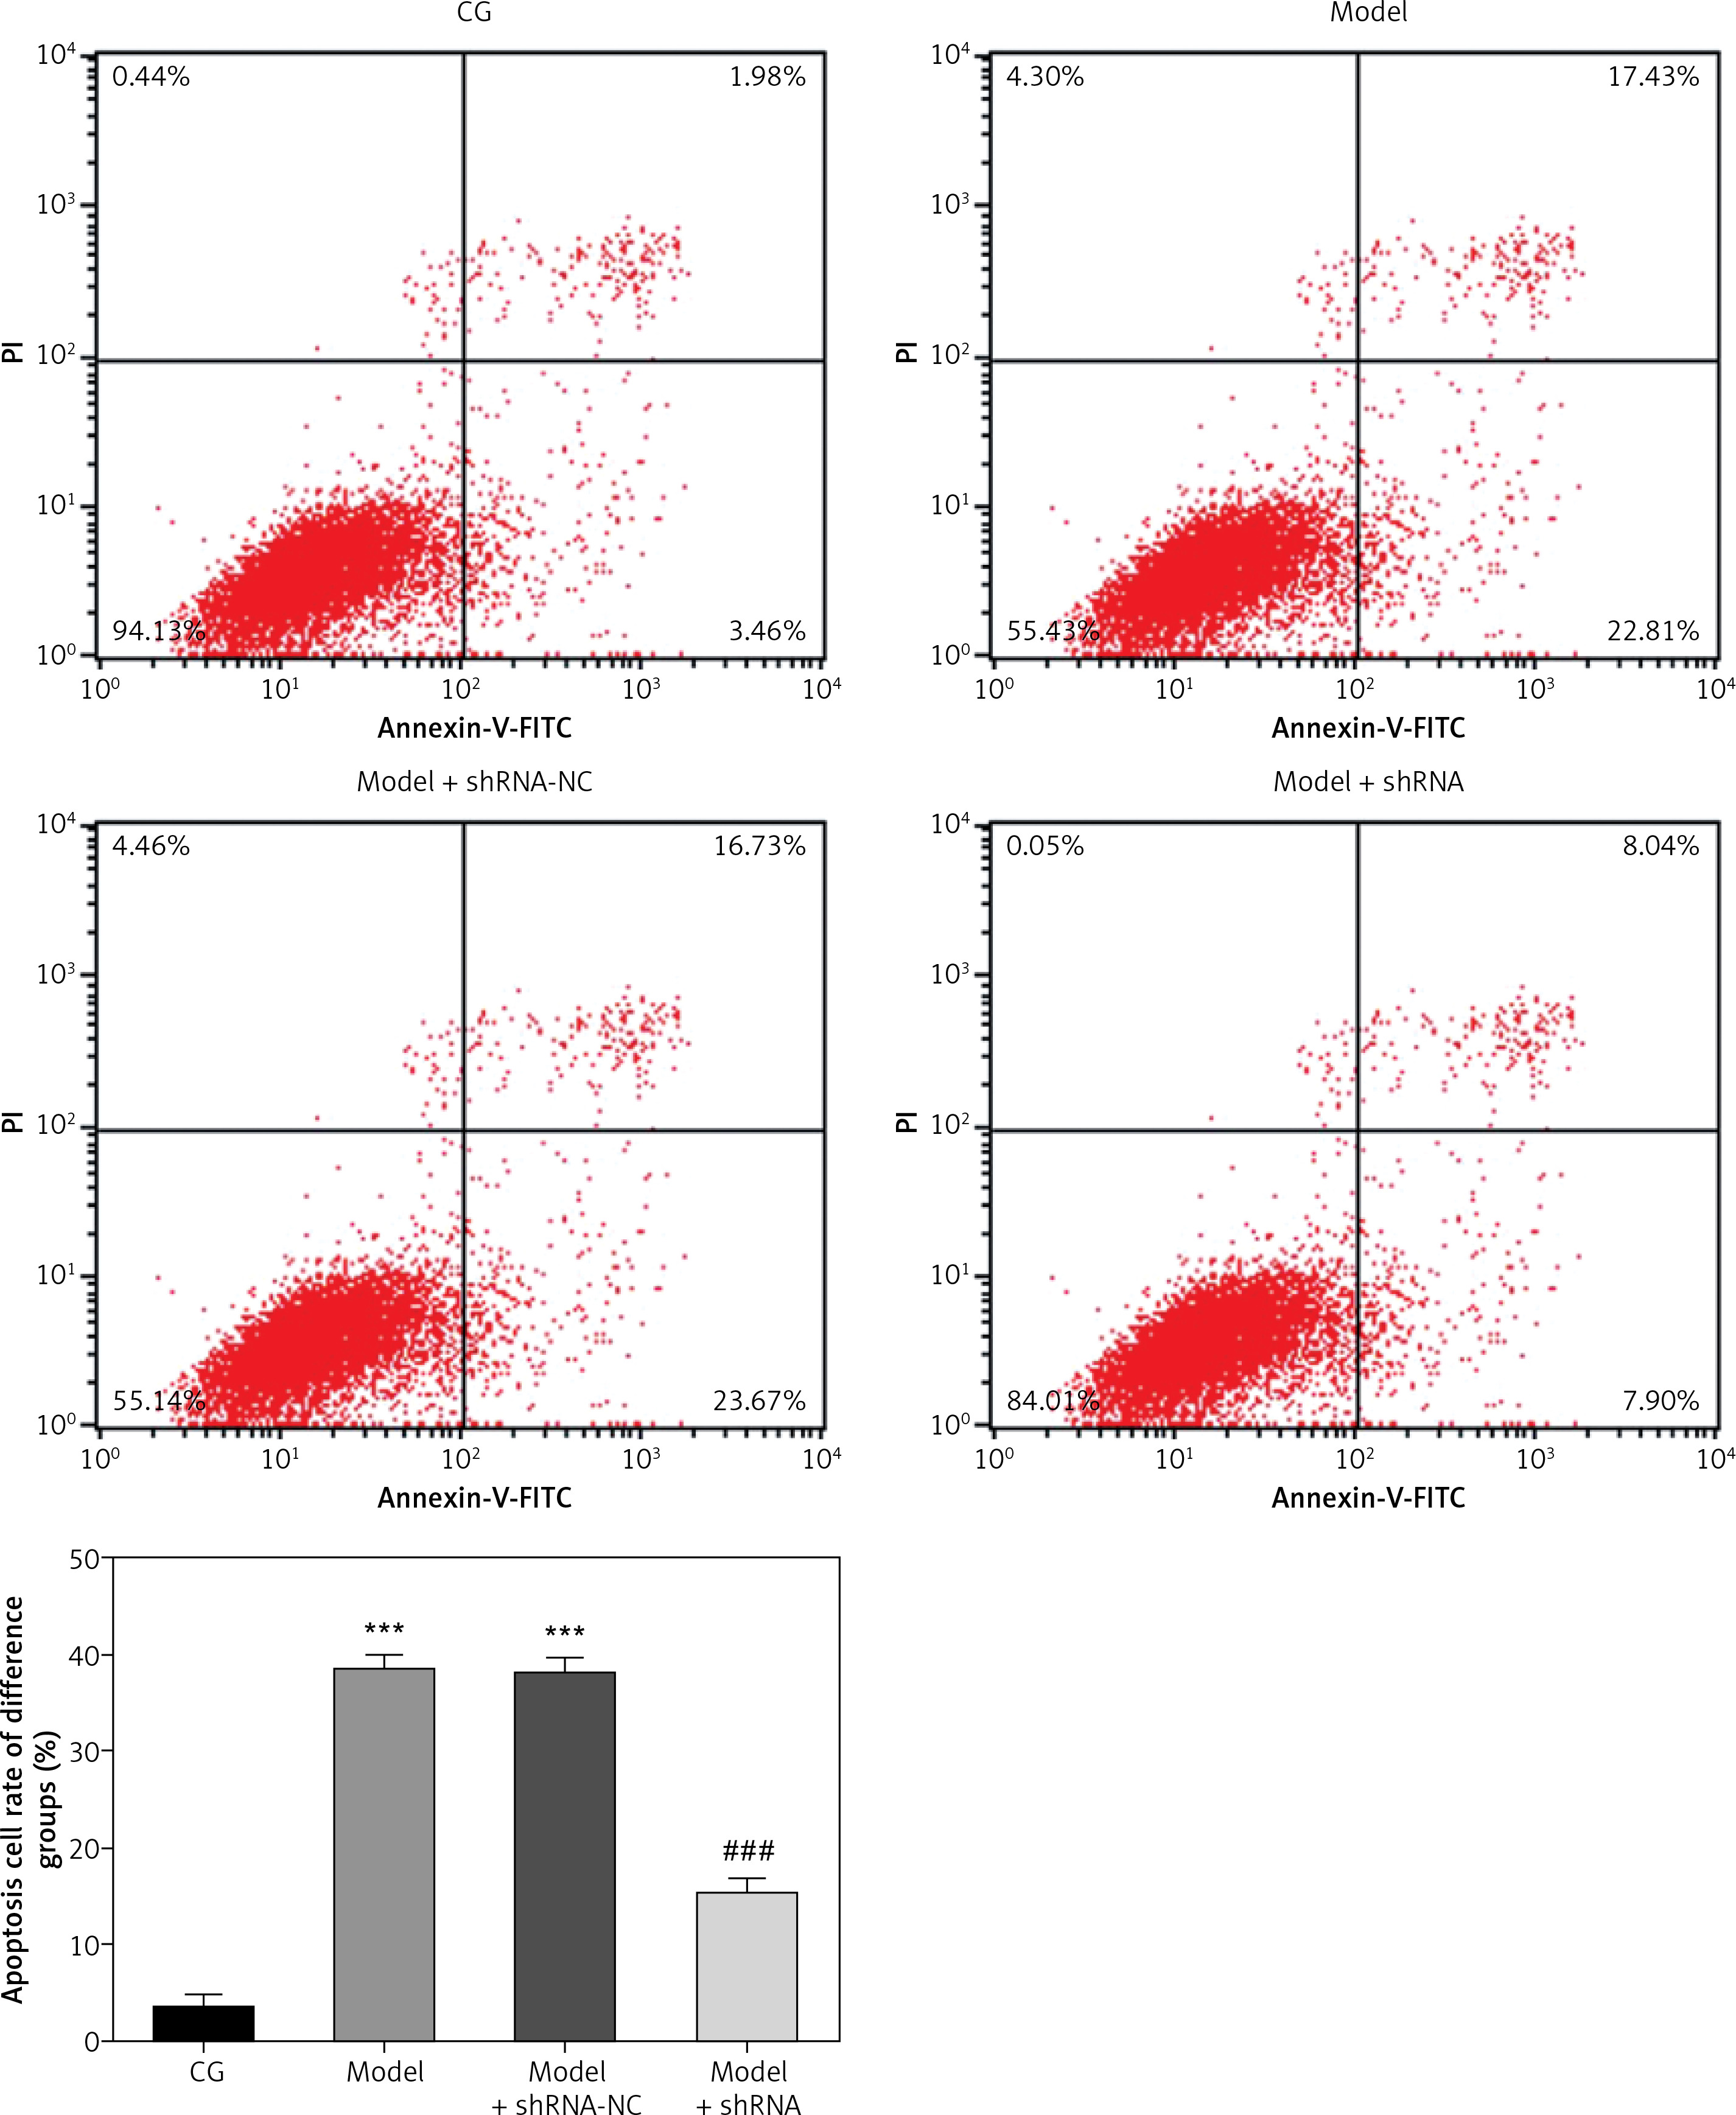
Compared with the NC group, the cell apoptosis rate was significantly higher (p < 0.001) in the model and model + shRNA-NC groups (Figure 2). Knockdown of UBE2R2-AS1 using shRNA significantly decreased (p < 0.001) the cell apoptosis rate in the model + shRNA group compared with that of the model group (Figure 2).
Figure 2
Effects of lncRNA UBE2R2-AS1 knockdown on cell apoptosis
CG – control group, Model – high-glucose model group, Model + shRNA-NC – HK-2 cells transfected with shRNA-negative control and treated with highglucose medium, Model + shRNA – HK-2 cells transfected with shRNA UBE2R2-AS1 and treated with high-glucose medium. ***P < 0.001 vs. NC group; ###p < 0.001 vs. Model group.
Effect of lncRNA UBE2R2-AS1 knockdown on inflammatory factors
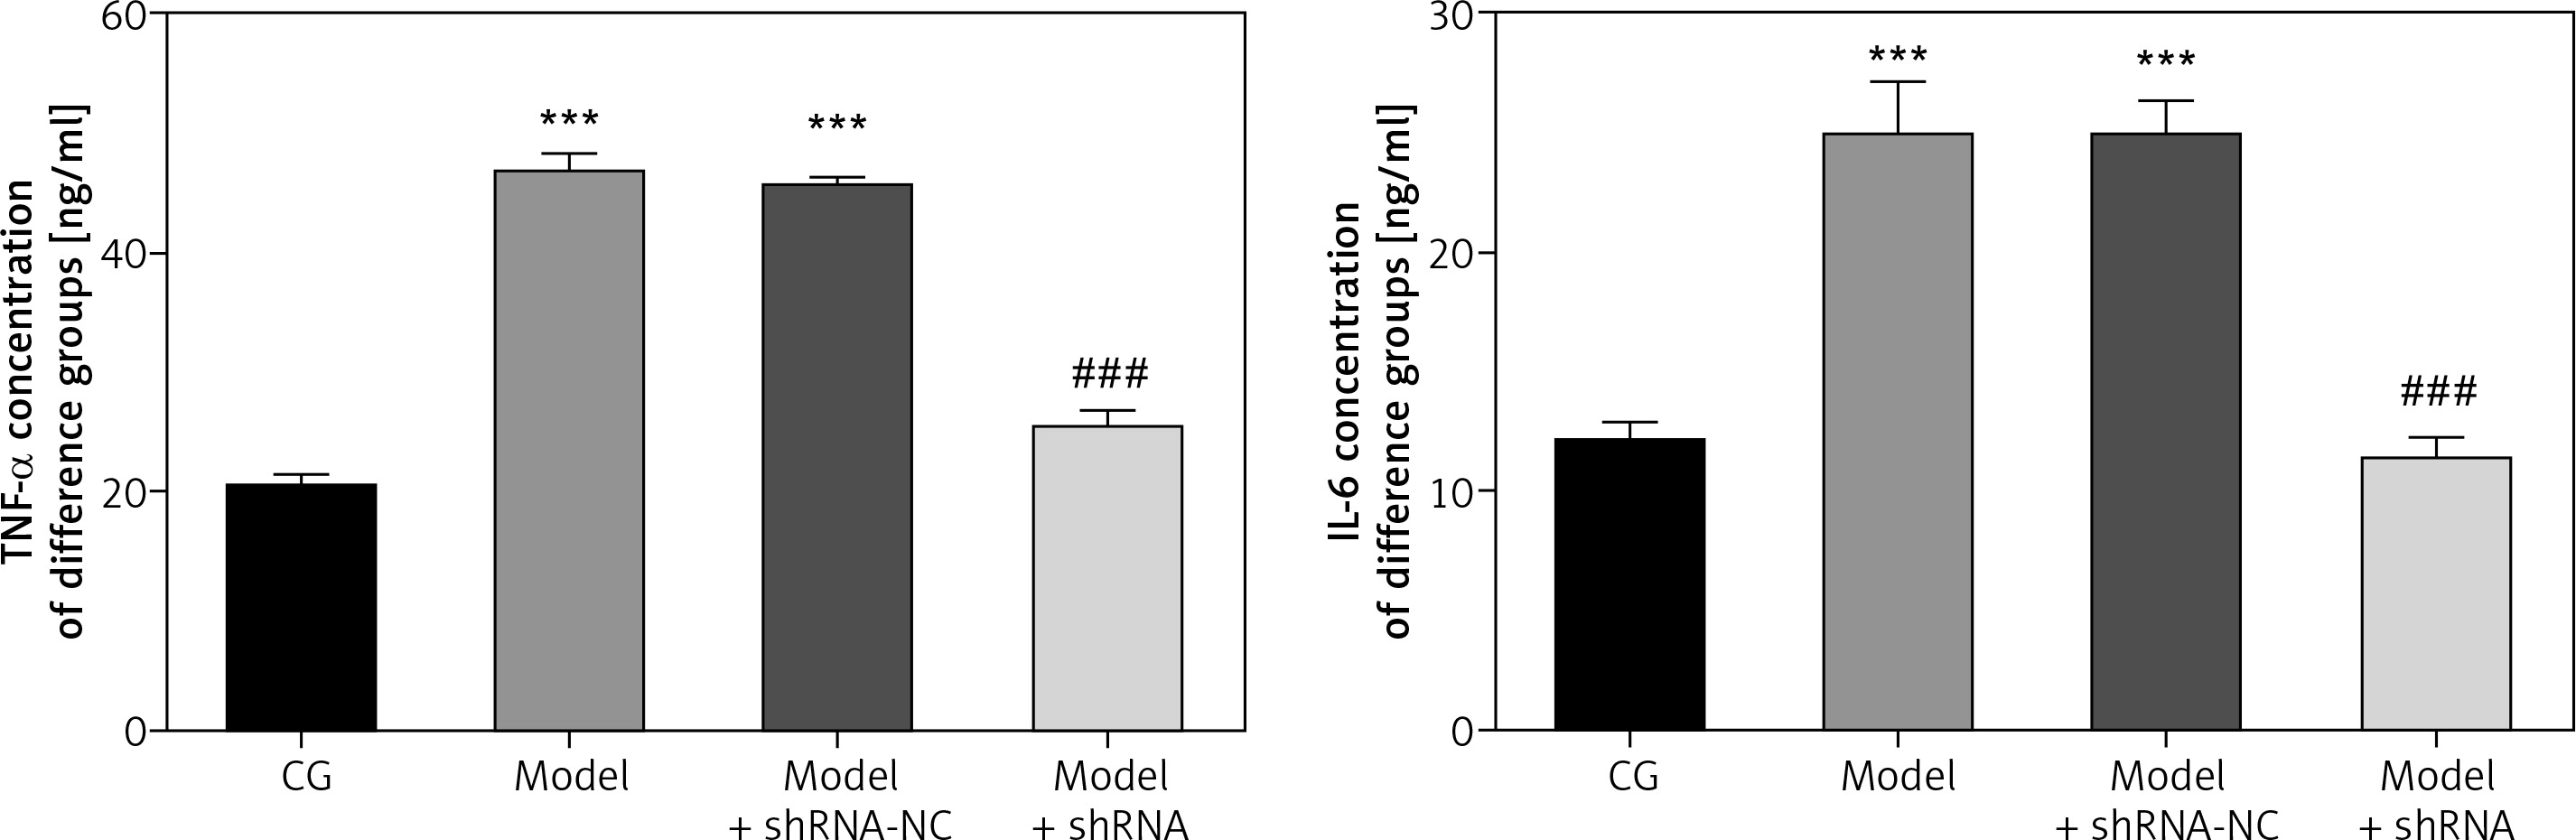
ELISA analysis showed that TNF-α and IL-6 levels were significantly higher in the model and model + shRNA-NC groups compared with those of the CG (p < 0.001 for both; Figure 3). Transfection with shRNA UBE2R2-AS1 led to significantly lower TNF-α and IL-6 levels in the model + shRNA group compared with those of the model group (p < 0.001) (Figure 3).
Figure 3
Effect of lncRNA UBE2R2-AS1 knockdown on inflammatory factors
CG – control group, Model – high-glucose model group, Model + shRNA-NC – HK-2 cells transfected with shRNA-negative control and treated with high-glucose medium, Model + shRNA – HK-2 cells transfected with shRNA UBE2R2-AS1 and treated with high-glucose medium. ***P < 0.001 vs. NC group; ###p < 0.001 vs. Model group.
Effect of lncRNA UBE2R2-AS1 knockdown on relative protein expression measured by WB
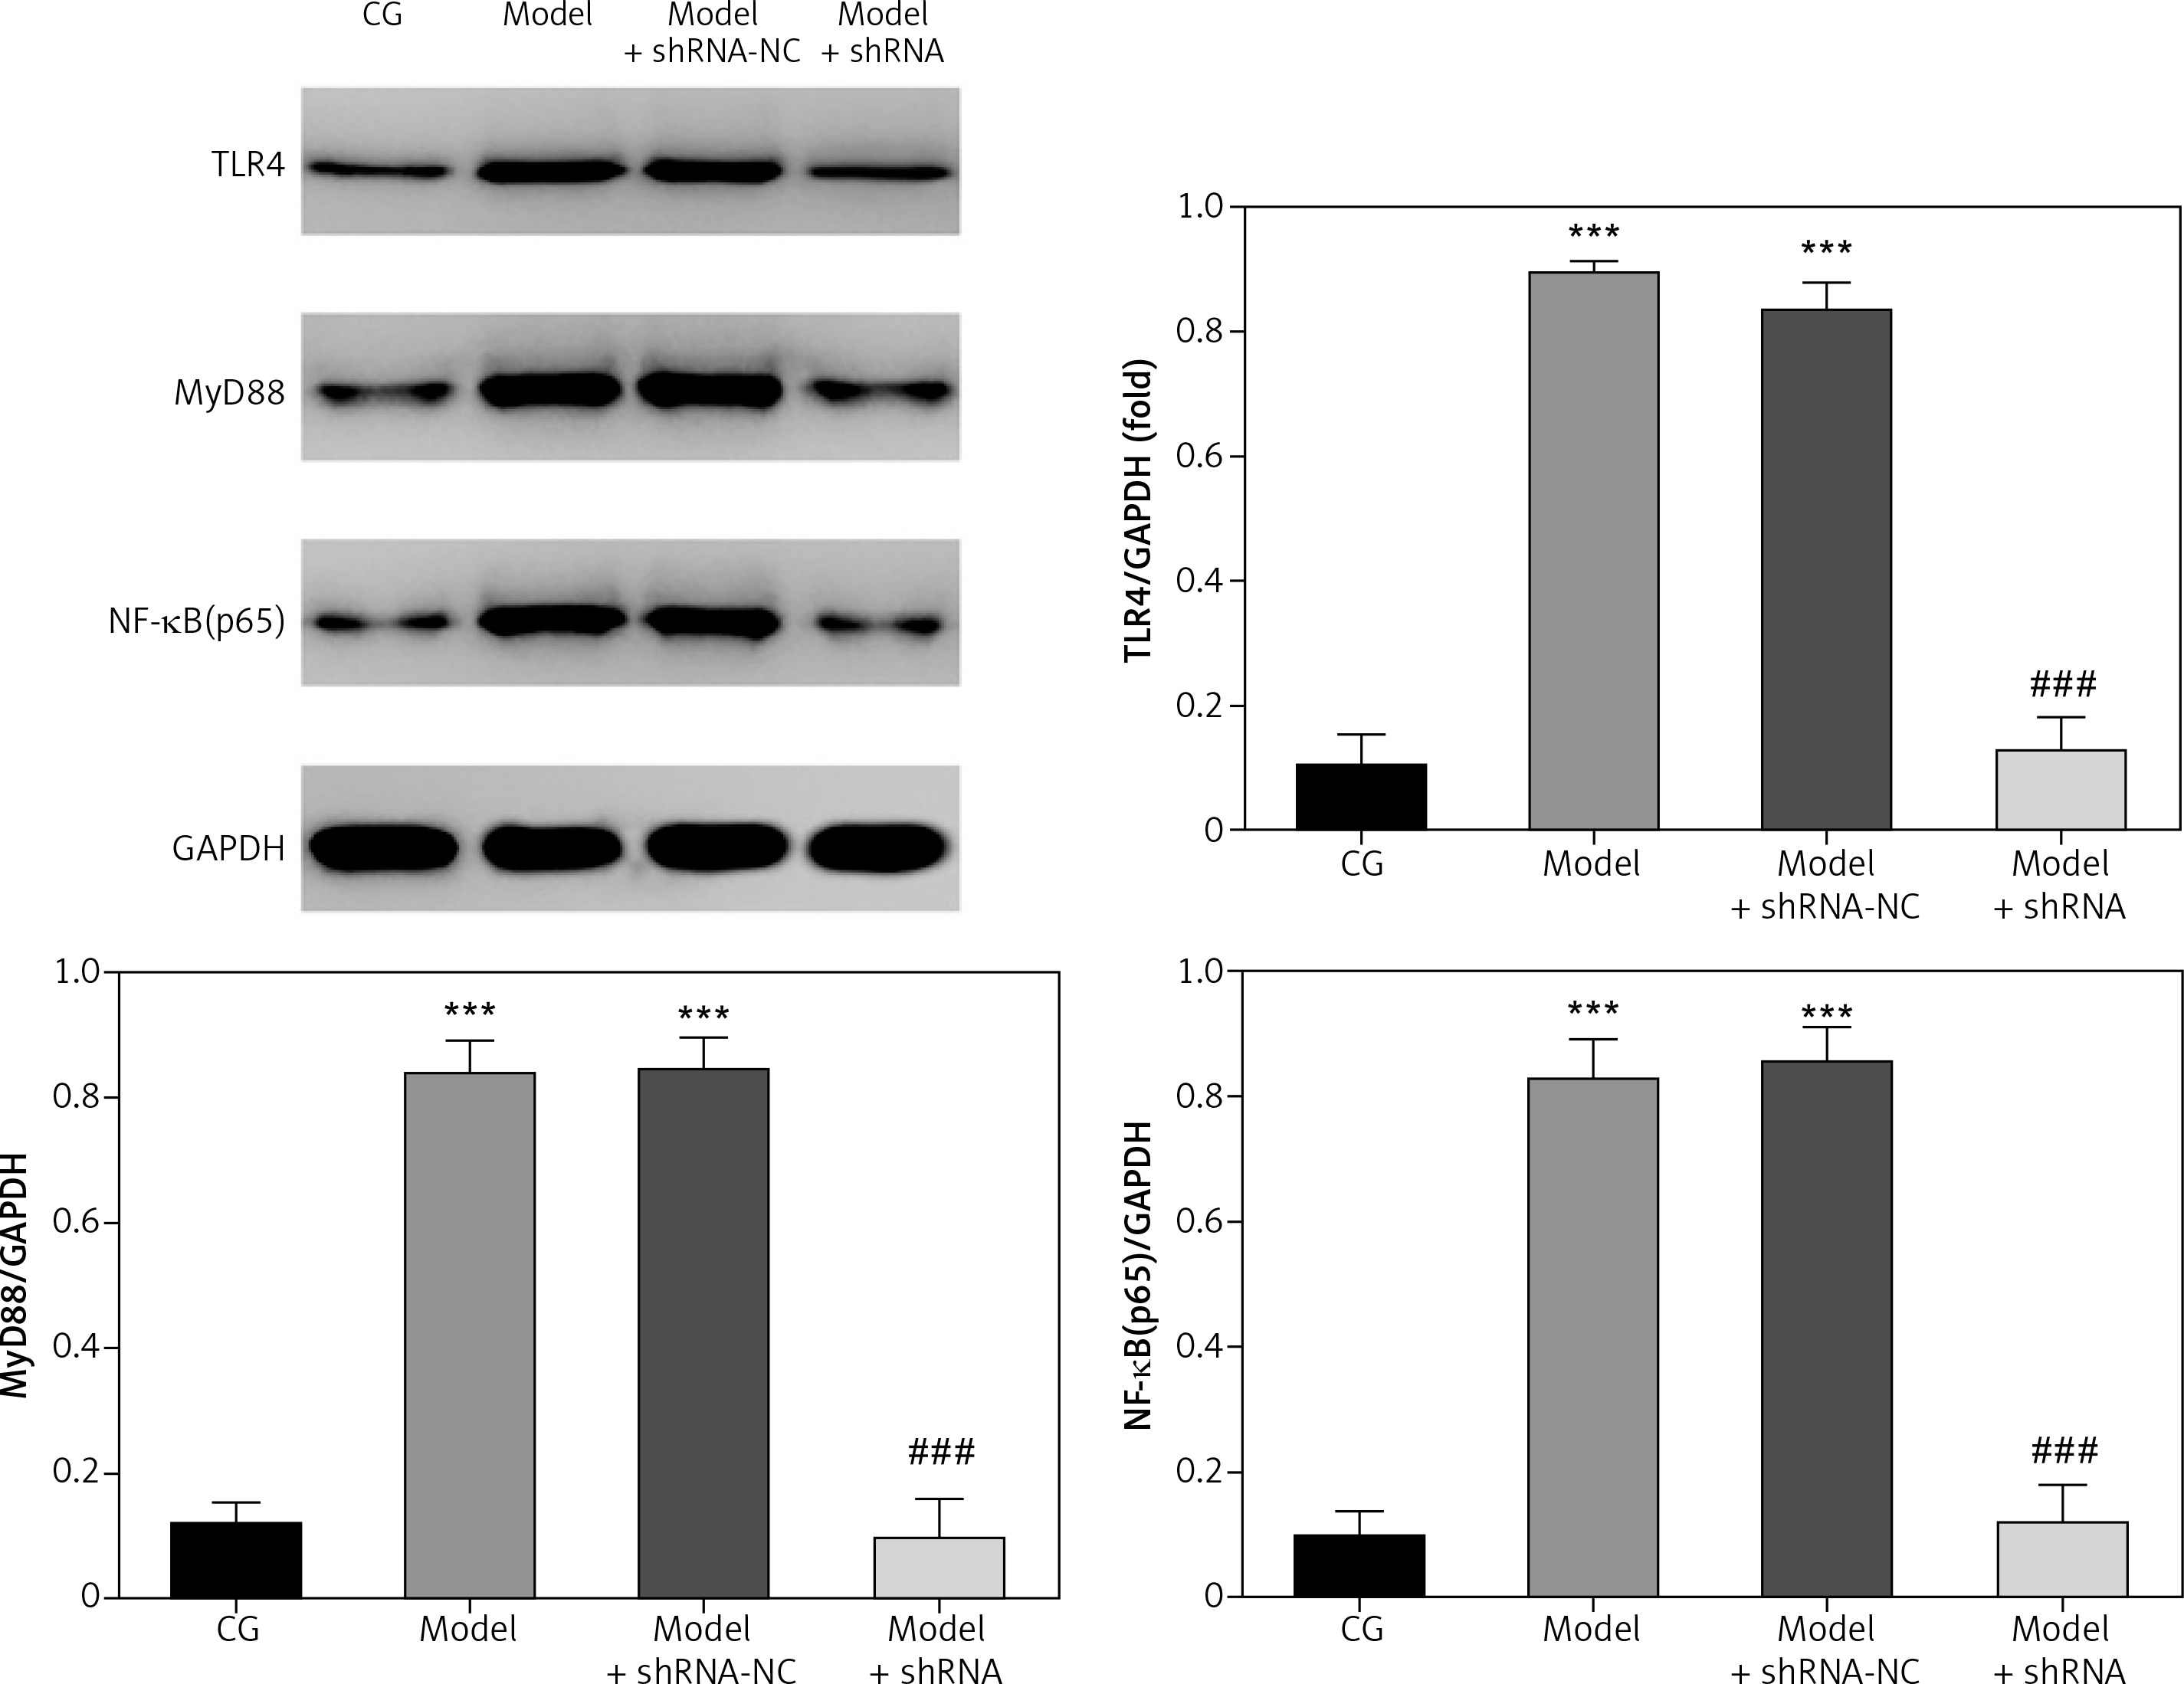
Western blot (WB) analysis revealed that TLR4, MyD88 and NF-κB(p65) protein levels were significantly higher (p < 0.001) in the model and model + shRNA-NC groups compared with those of the CG (Figure 4). Knockdown of lncRNA UBE2R2-AS1 using shRNA led to significantly lower (p < 0.001) TLR4, MyD88 and NF-κB(p65) protein levels in the model + shRNA group compared with those of the model group (Figure 4).
Figure 4
Effects of lncRNA UBE2R2-AS1 knockdown on relative protein expression measured by WB
CG – control group, Model – high-glucose model group, Model + shRNA-NC – HK-2 cells transfected with shRNA-negative control and treated with high-glucose medium, Model + shRNA – HK-2 cells transfected with shRNA UBE2R2-AS1 and treated with high-glucose medium. ***P < 0.001 vs. NC group; ###p < 0.001 vs. Model group.
Effect of lncRNA UBE2R2-AS1 knockdown on relative protein expression measured by immunocytochemistry
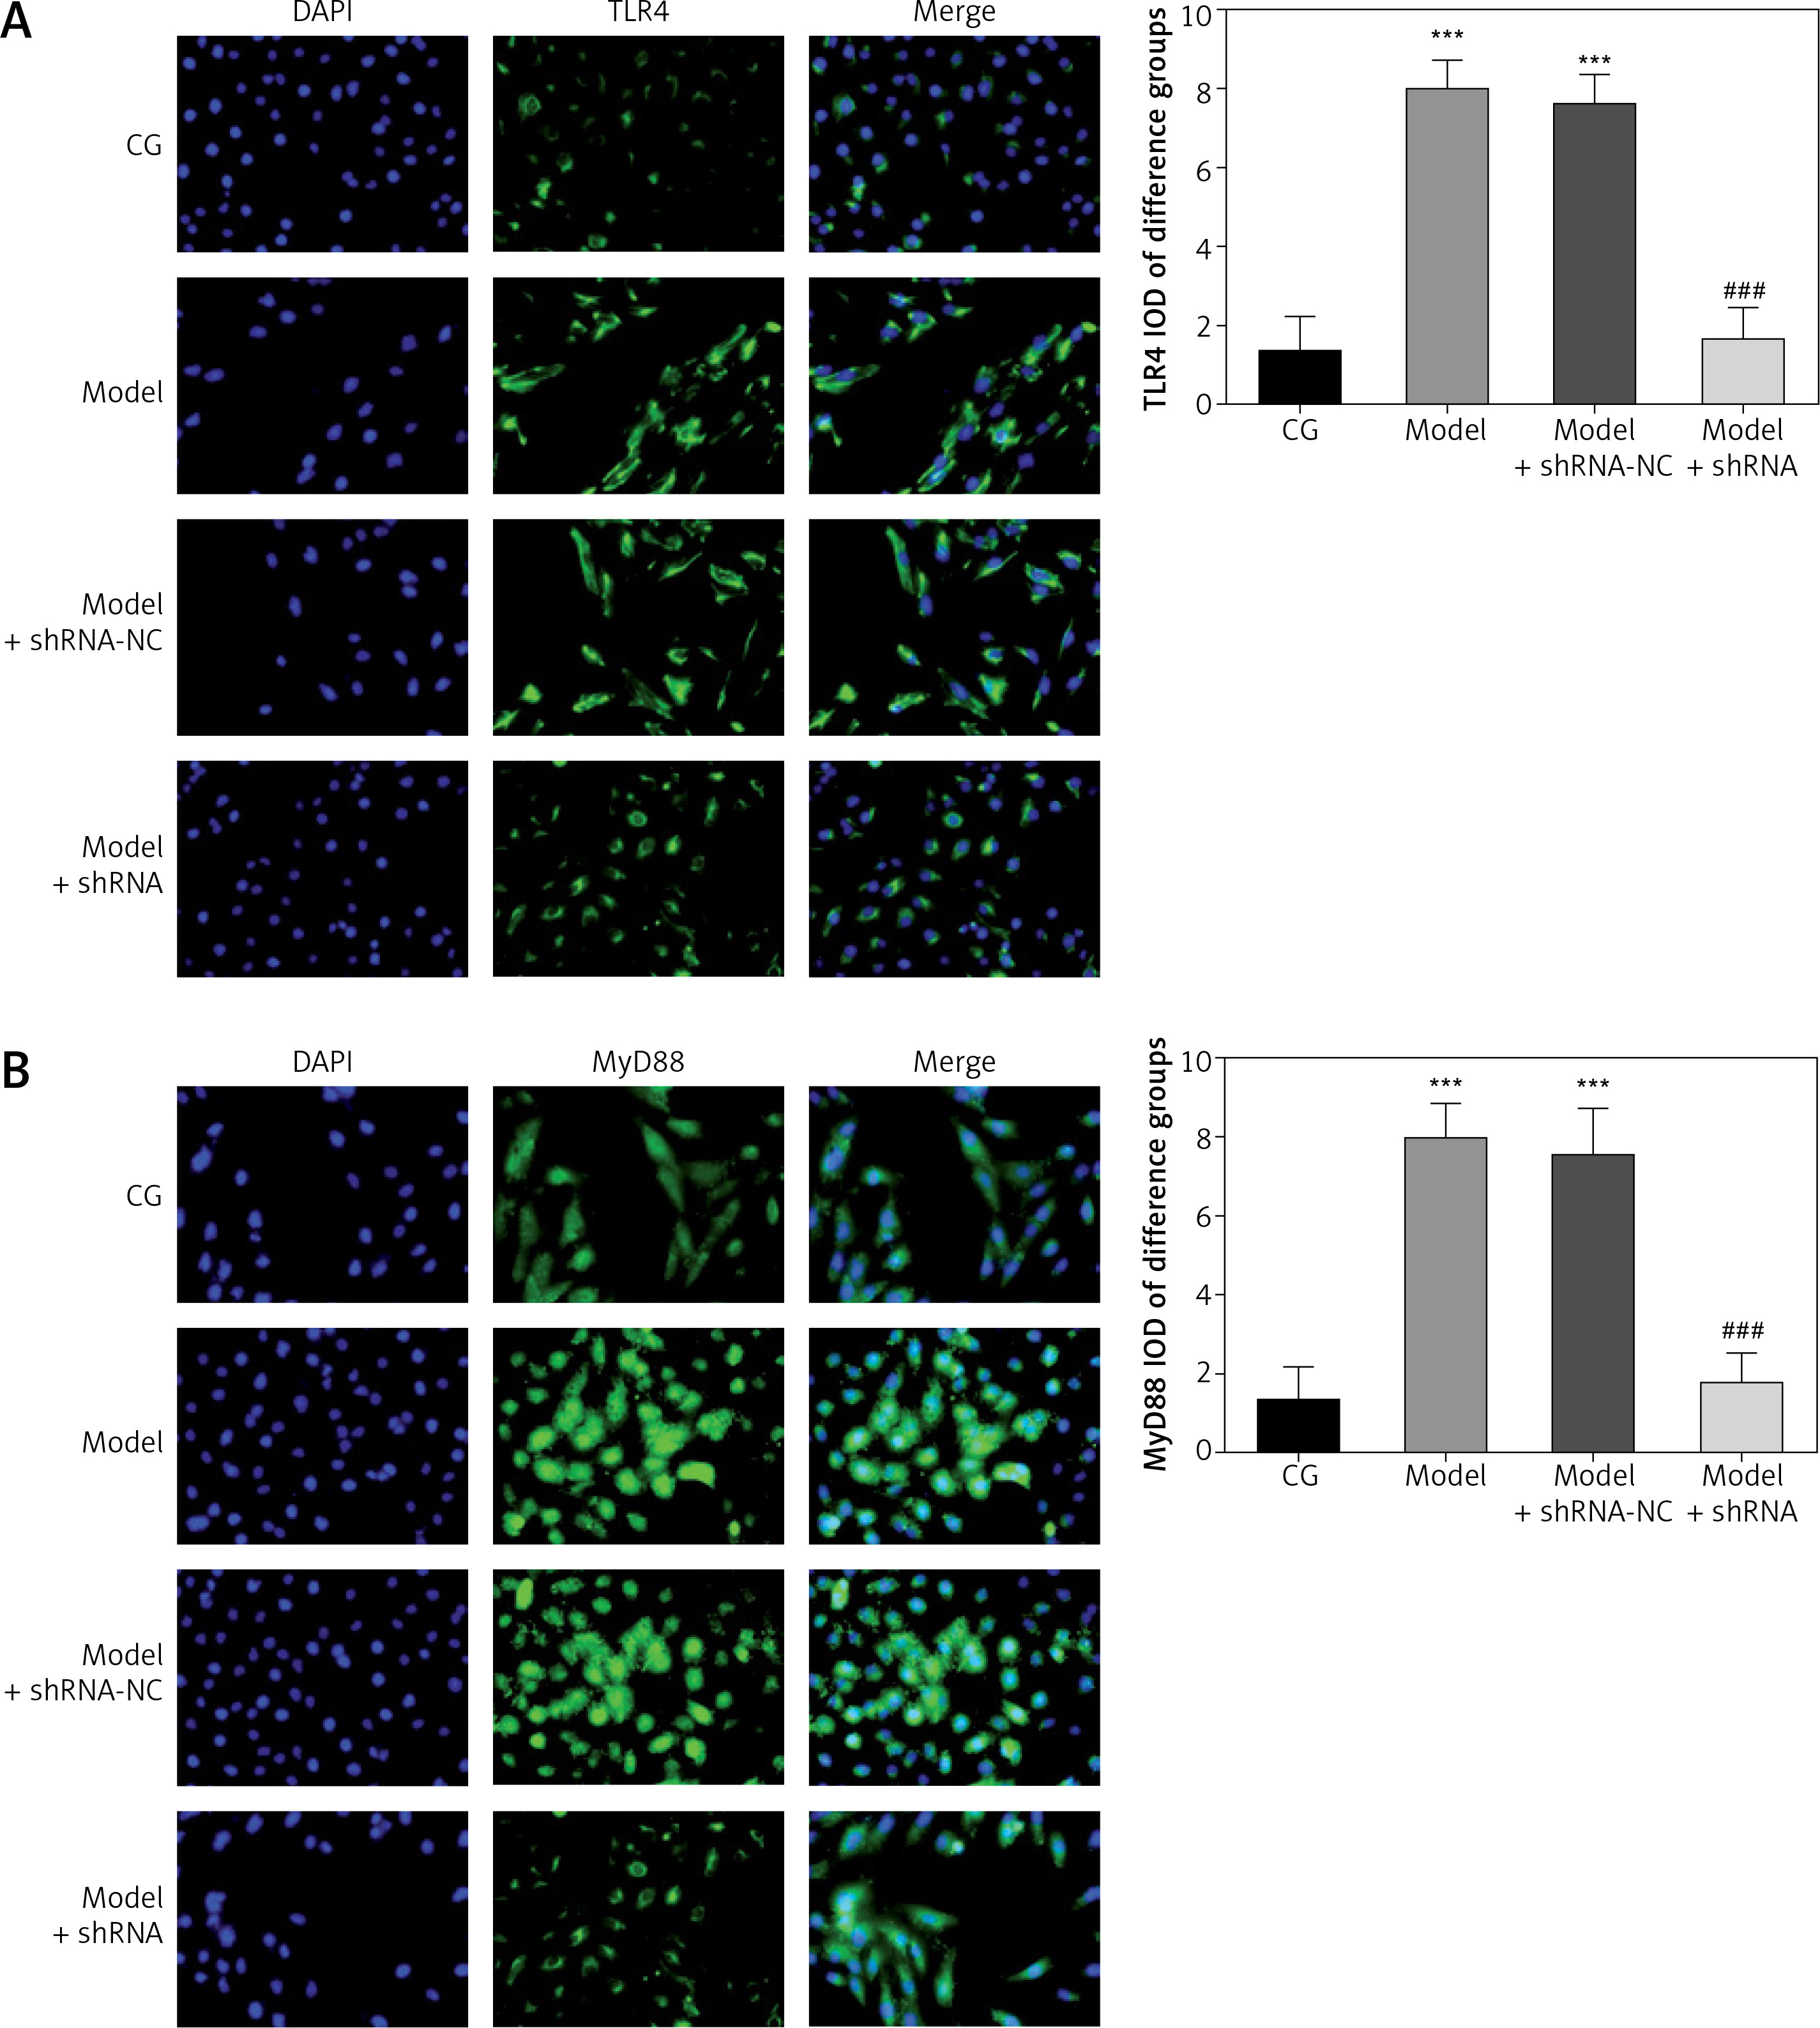
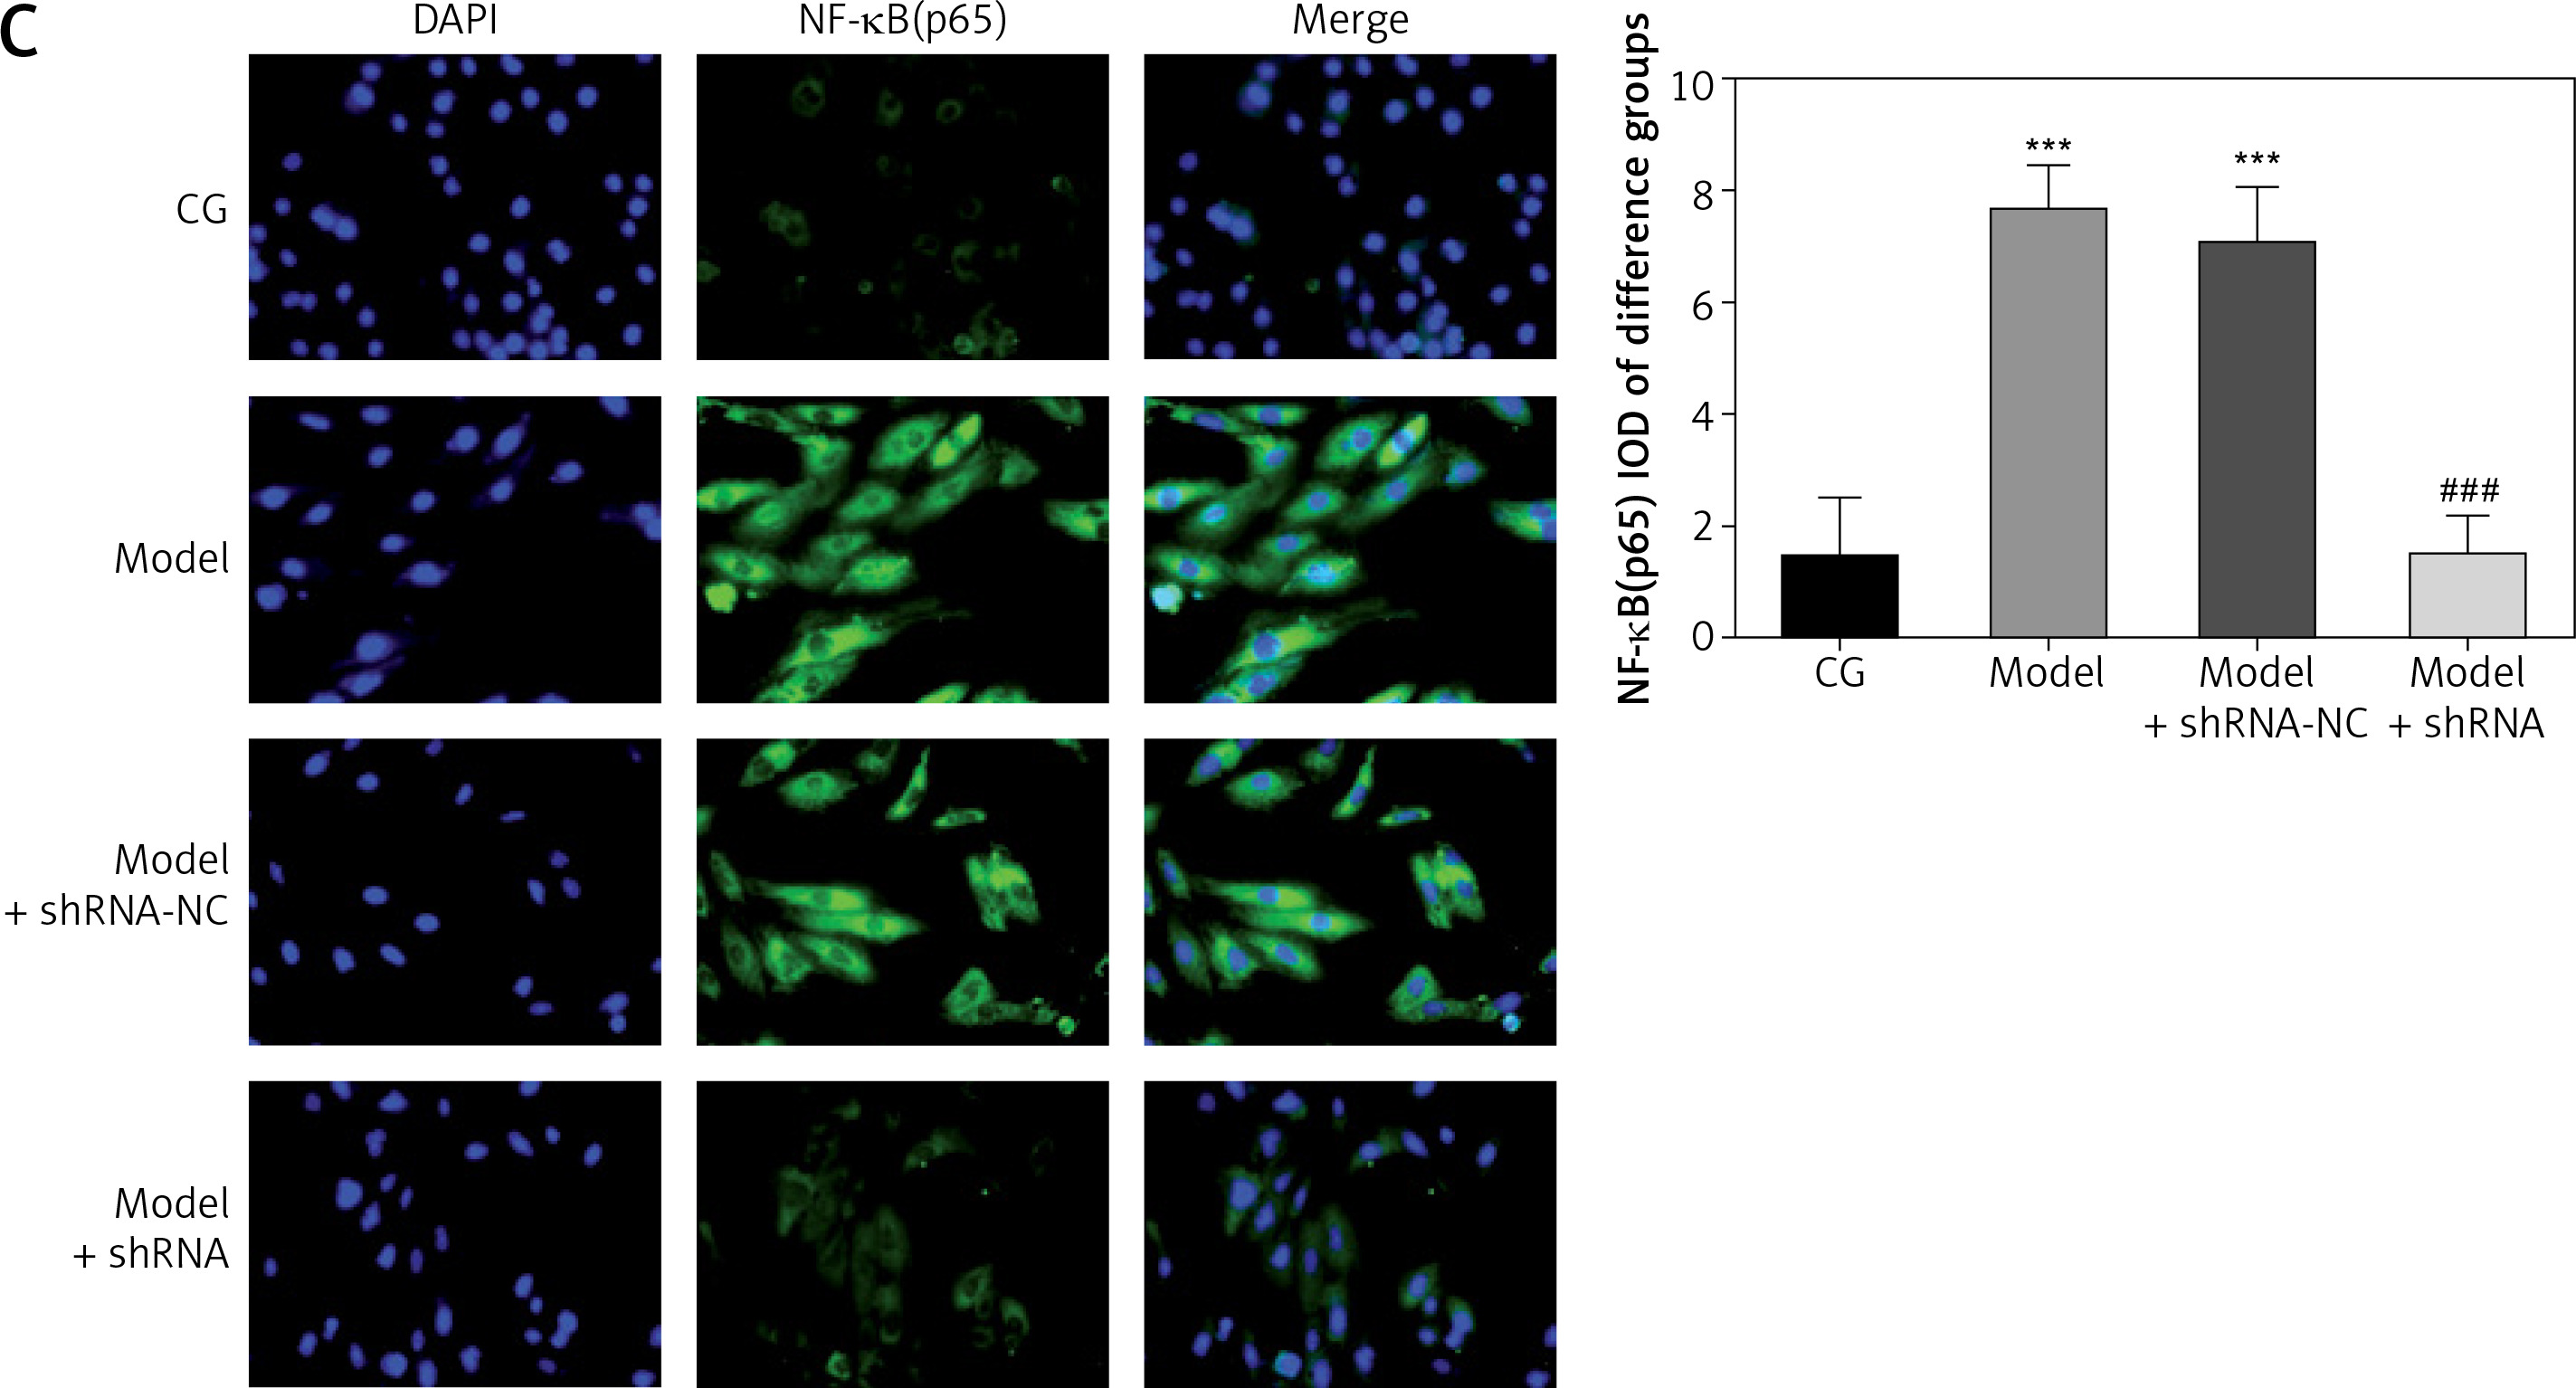
Immunocytochemistry analysis showed significantly higher TLR4, MyD88 and NF-κB(p65) protein volume (p < 0.001 for all) in the model and model + shRNA-NC groups compared with the CG (Figure 5). Furthermore, shRNA inhibition of lncRNA UBE2R2-AS1 significantly decreased TLR4, MyD88 and NF-κB(p65) protein levels in the model + shRNA group (p < 0.001) (Figure 5).
Figure 5
Effects of lncRNA UBE2R2-AS1 knockdown on relative proteins expression measured by immunocytochemistry
CG – control group, Model – high-glucose model group, Model + shRNA-NC – HK-2 cells transfected with shRNA-negative control and treated with high-glucose medium, Model + shRNA – HK-2 cells transfected with shRNA UBE2R2-AS1 and treated with high-glucose medium. ***P < 0.001 vs. NC group; ###p < 0.001 vs. Model group.
mRNA expression of lncRNA UBE2R2-AS1 and miRNA-877-3p in the different groups
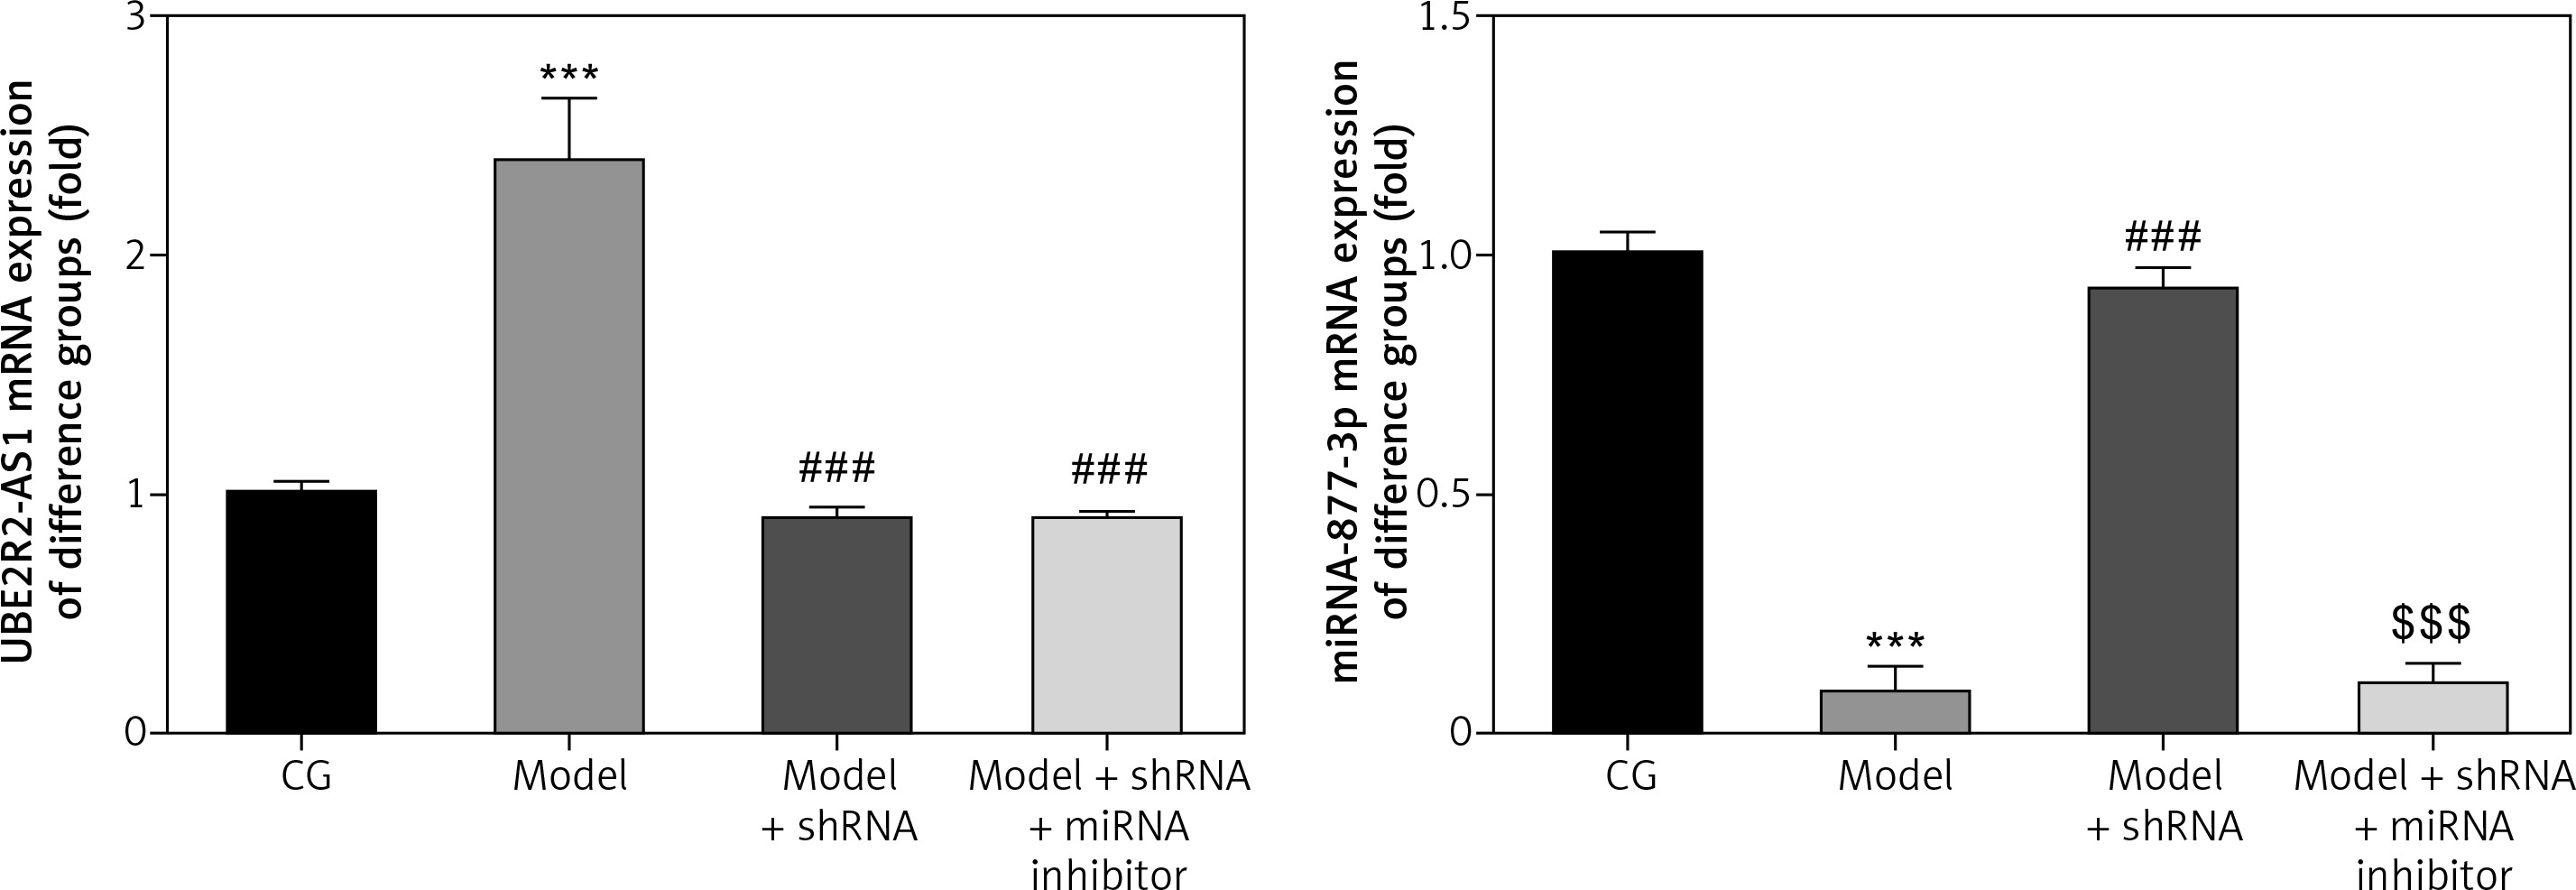
Compared with the CG, lncRNA UBE2R2-AS1 mRNA levels were significantly up-regulated (p < 0.001), whereas miRNA-877-3p mRNA expression was significantly down-regulated (p < 0.001) in the model group (Figure 6). shRNA knockdown of lncRNA UBE2R2-AS1 significantly (p < 0.001) down-regulated lncRNA UBE2R2-AS1 mRNA expression and miRNA-877-3p mRNA expression was significantly higher (p < 0.001) in the model + shRNA group compared with that of the model group (Figure 6). Treatment with shRNA targeting lncRNA UBE2R2-AS1 and miRNA inhibitor resulted in significantly lower miRNA-877-3p and lncRNA UBE2R2-AS1 mRNA expression in the model + shRNA + miRNA inhibitor group (p < 0.001) compared with the model + shRNA group.
Figure 6
mRNA expression of lncRNA UBE2R2-AS1 and miRNA-877-3p in the different groups
CG – control group, Model – high-glucose model group, Model + shRNA – HK-2 cells transfected with shRNA UBE2R2-AS1 and treated with high-glucose medium, Model + shRNA + miRNA inhibitor – HK-2 cells transfected with shRNA UBE2R2-AS1 and miRNA-877-3p inhibitor and treated with high-glucose medium. ***P < 0.001 vs. NC group; ###p < 0.001 vs. Model group, $$$P < 0.001 vs. Model + shRNA group.
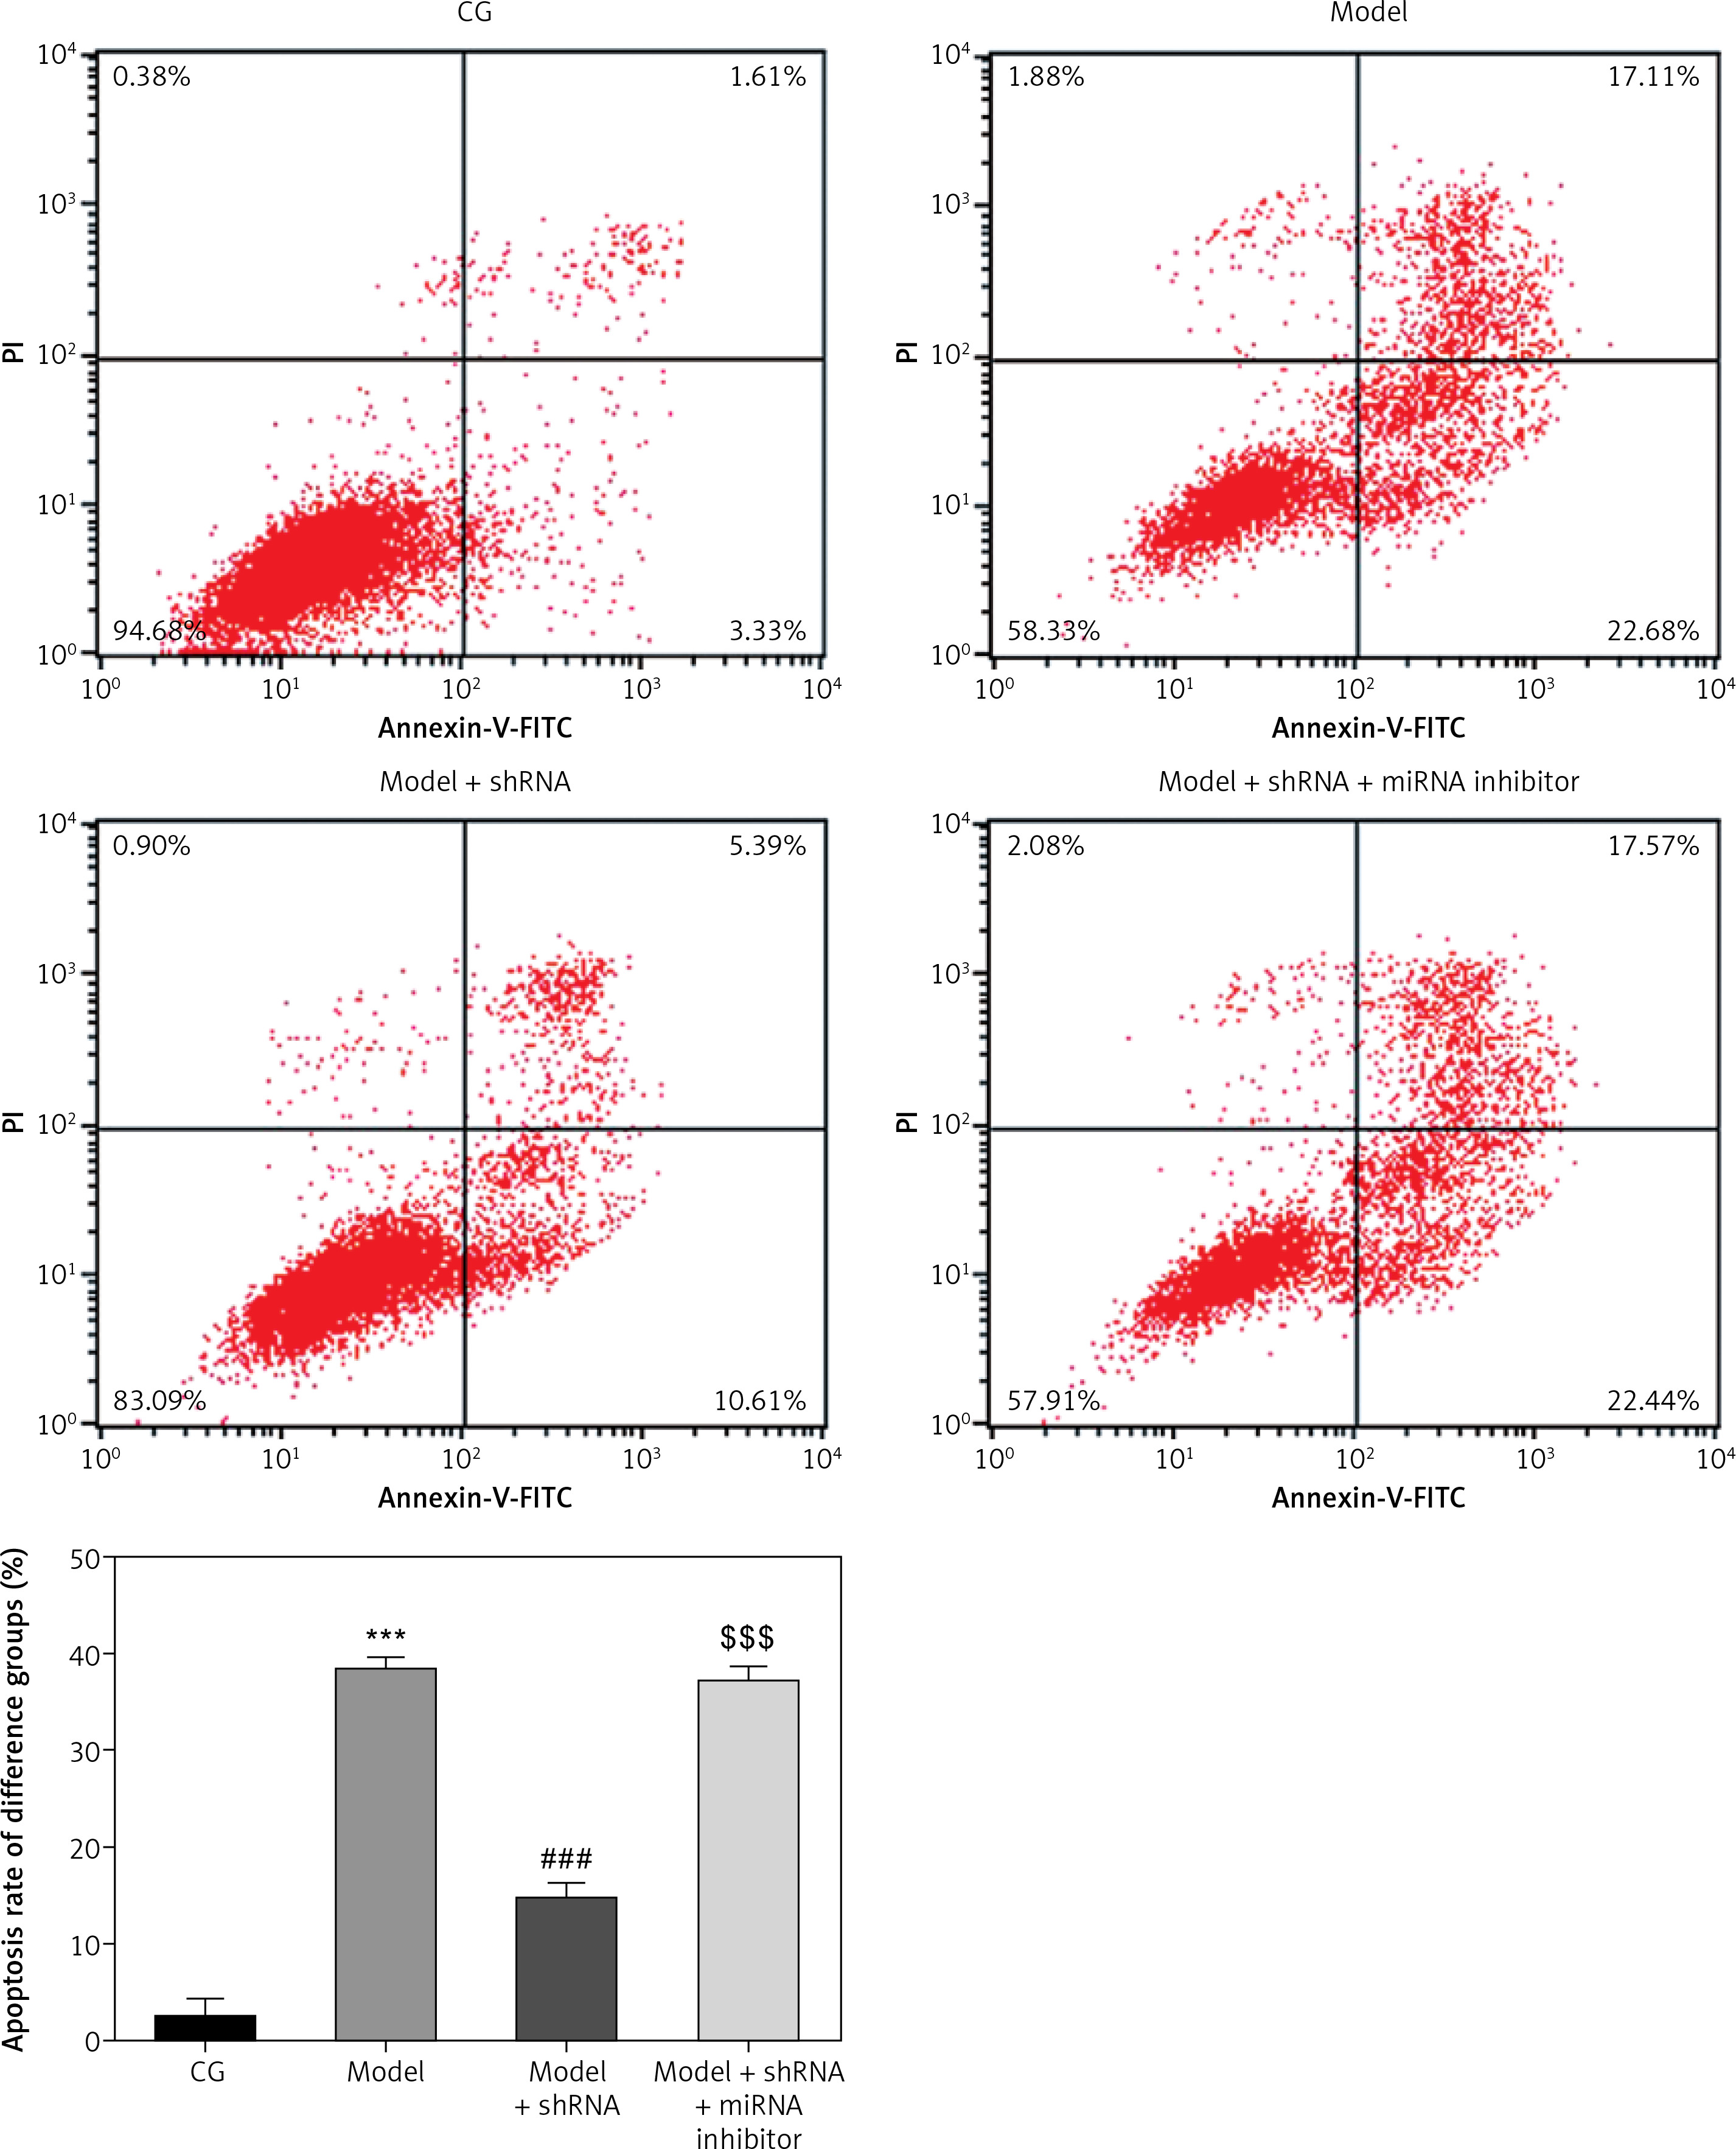
Flow cytometry analysis of cell apoptosis
Flow cytometry analysis revealed a significantly higher (p < 0.001) cell apoptosis rate in the model group compared with that of the CG, whereas the cell apoptosis rate of the model + shRNA group was significantly lower (p < 0.001) compared with that of the model group (Figure 7). The cell apoptosis rate of the model + shRNA + miRNA inhibitor group was significantly higher compared with that of the model + shRNA group (p < 0.001) (Figure 7).
Figure 7
Cell apoptosis in the different groups
CG – control group, Model – high-glucose model group, Model + shRNA – HK-2 cells transfected with shRNA UBE2R2-AS1 and treated with high-glucose medium, Model + shRNA + miRNA inhibitor – HK-2 cells transfected with shRNA UBE2R2-AS1 and miRNA-877-3p inhibitor and treated with high-glucose medium. ***P < 0.001 vs. NC group; ###p < 0.001 vs. Model group, $$$P < 0.001 vs. Model + shRNA group.
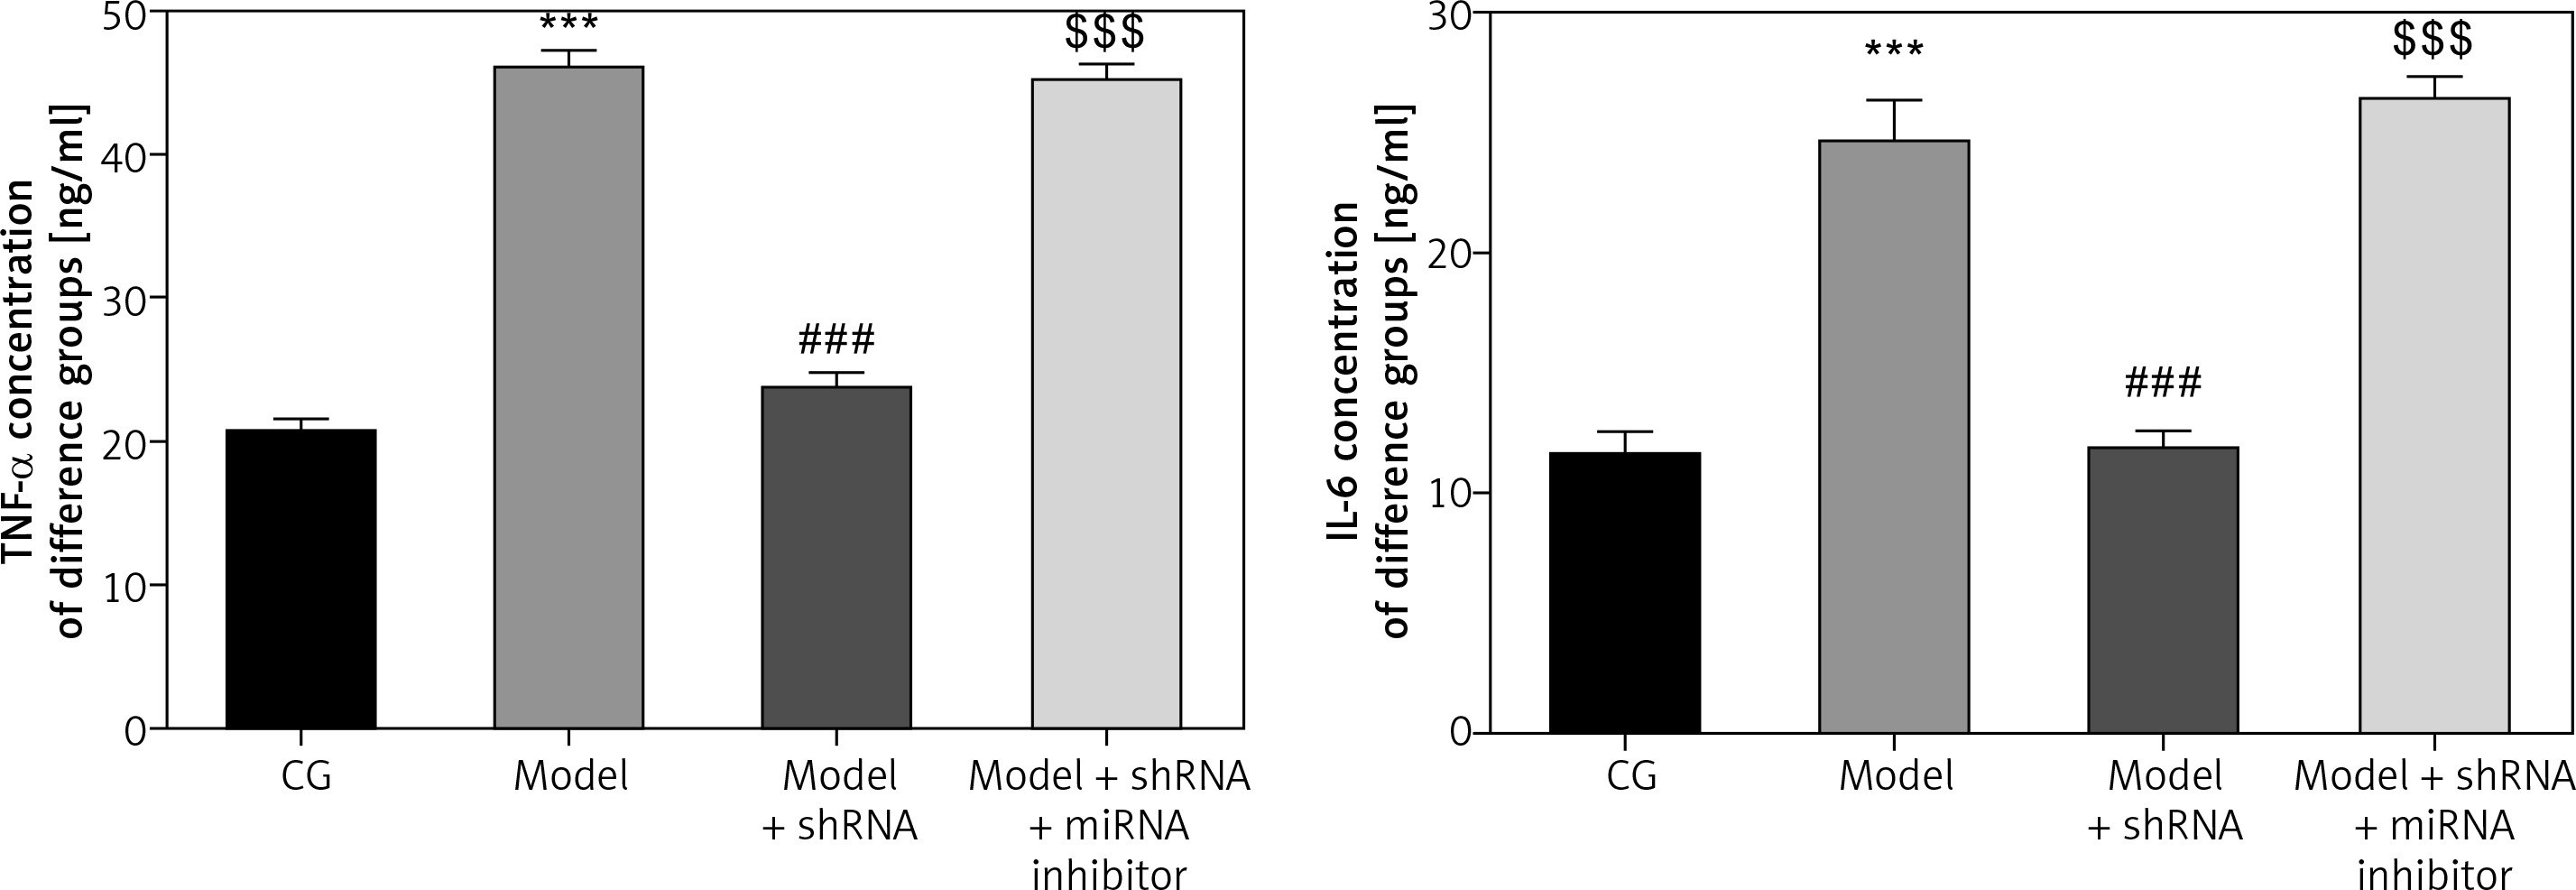
Measurement of inflammatory factors in the different groups
ELISA analysis revealed significant up-regulation in TNF-α and IL-6 levels in the model group compared with those of the CG (p < 0.001for both) (Figure 8). TNF-α and IL-6 levels were significantly down-regulated in the model + shRNA group compared with those of the model group (p < 0.001 for both). However, levels of these inflammatory markers were significantly higher (p < 0.001) in the model + shRNA + miRNA inhibitor group compared with those of the model + shRNA group (Figure 8).
Figure 8
Concentration of inflammatory factors in the different groups measured by ELISA
CG – control group, Model – high-glucose model group, Model + shRNA – HK-2 cells transfected with shRNA UBE2R2-AS1 and treated with high-glucose medium, Model + shRNA + miRNA inhibitor – HK-2 cells transfected with shRNA UBE2R2-AS1 and miRNA-877-3p inhibitor and treated with high-glucose medium. ***P < 0.001 vs. NC group; ###p < 0.001 vs. Model group, $$$P < 0.001 vs. Model + shRNA group.
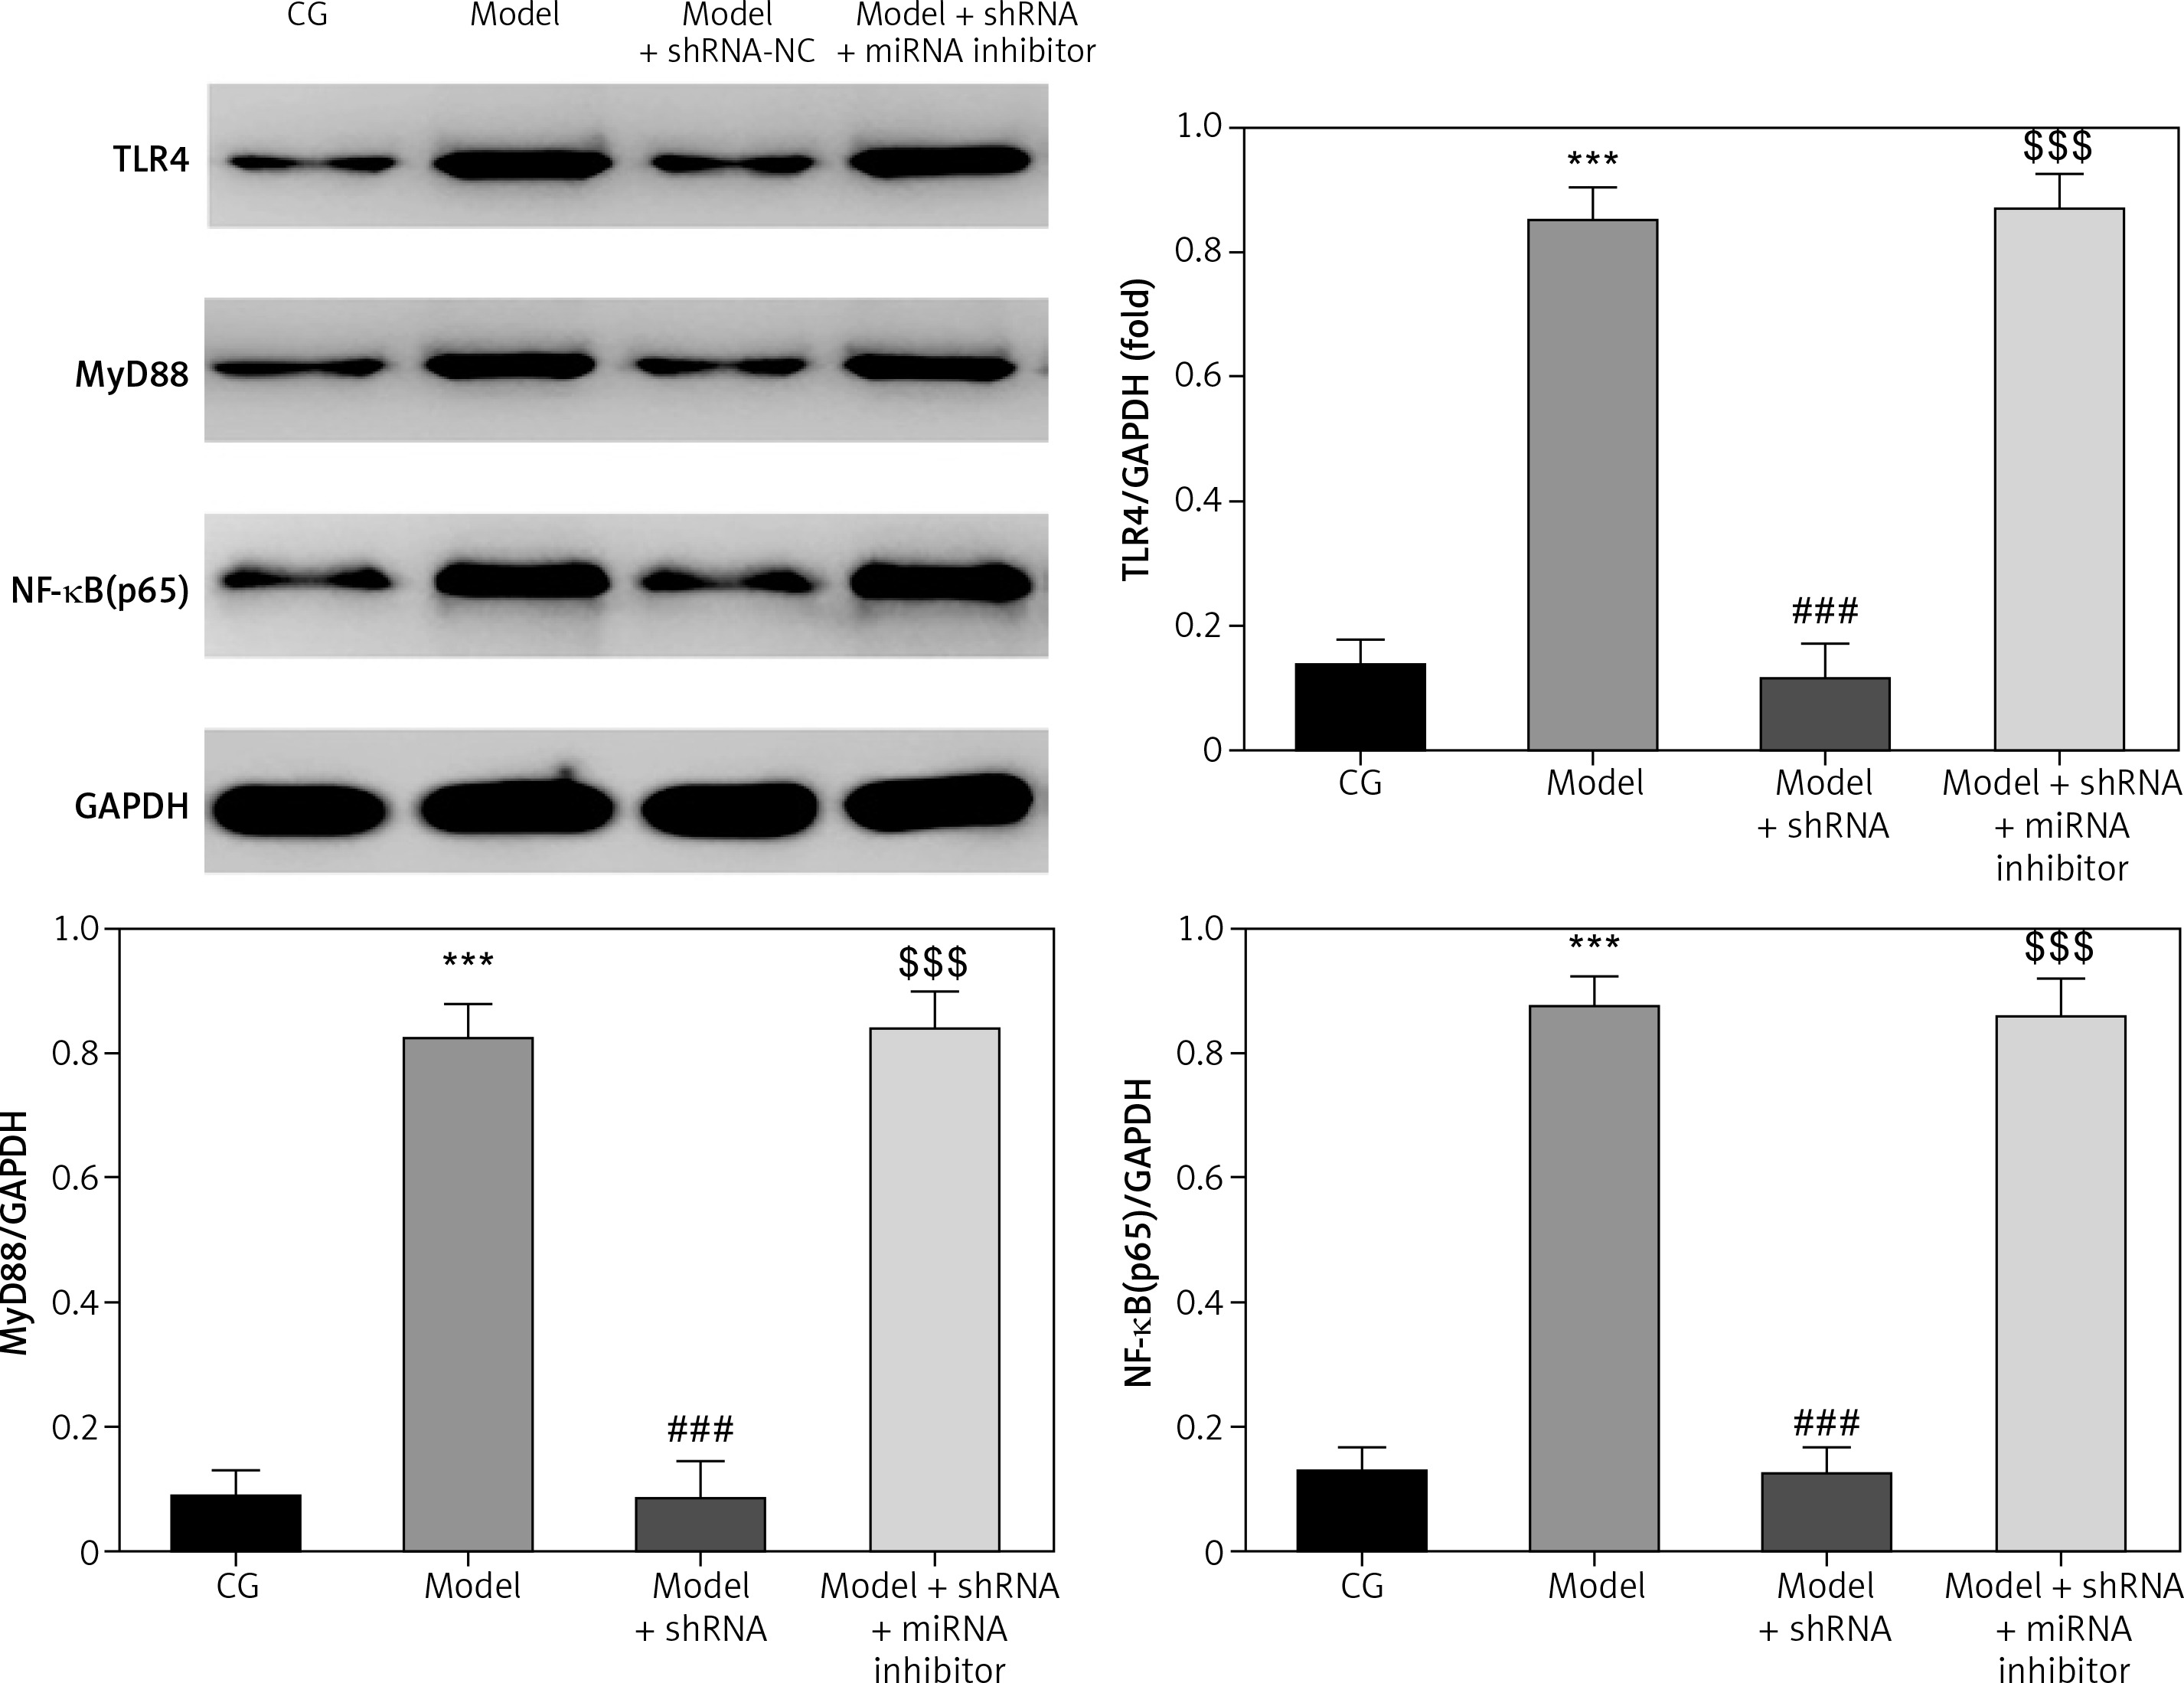
WB analysis of relative protein levels
TLR4, MyD88 and NF-κB(p65) proteins levels were significantly up-regulated in the model group compared with those of the CG (p < 0.001 for all) (Figure 9). Compared with the model group, TLR4, MyD88 and NF-κB(p65) proteins levels were significantly down-regulated (p < 0.001) in the model + shRNA group (Figure 9). However, the addition of miRNA-877-3p inhibitor significantly increased (p < 0.001) expression of these proteins in the model + shRNA + miRNA inhibitor group compared with the model + shRNA group (Figure 9).
Figure 9
Relative proteins expression measured by WB assay
CG – control group, Model – high-glucose model group, Model + shRNA – HK-2 cells transfected with shRNA UBE2R2-AS1 and treated with high-glucose medium, Model + shRNA + miRNA inhibitor – HK-2 cells transfected with shRNA UBE2R2-AS1 and miRNA-877-3p inhibitor and treated with high-glucose medium. ***P < 0.001 vs. NC group; ###p < 0.001 vs. Model group, $$$P < 0.001 vs. Model + shRNA group.
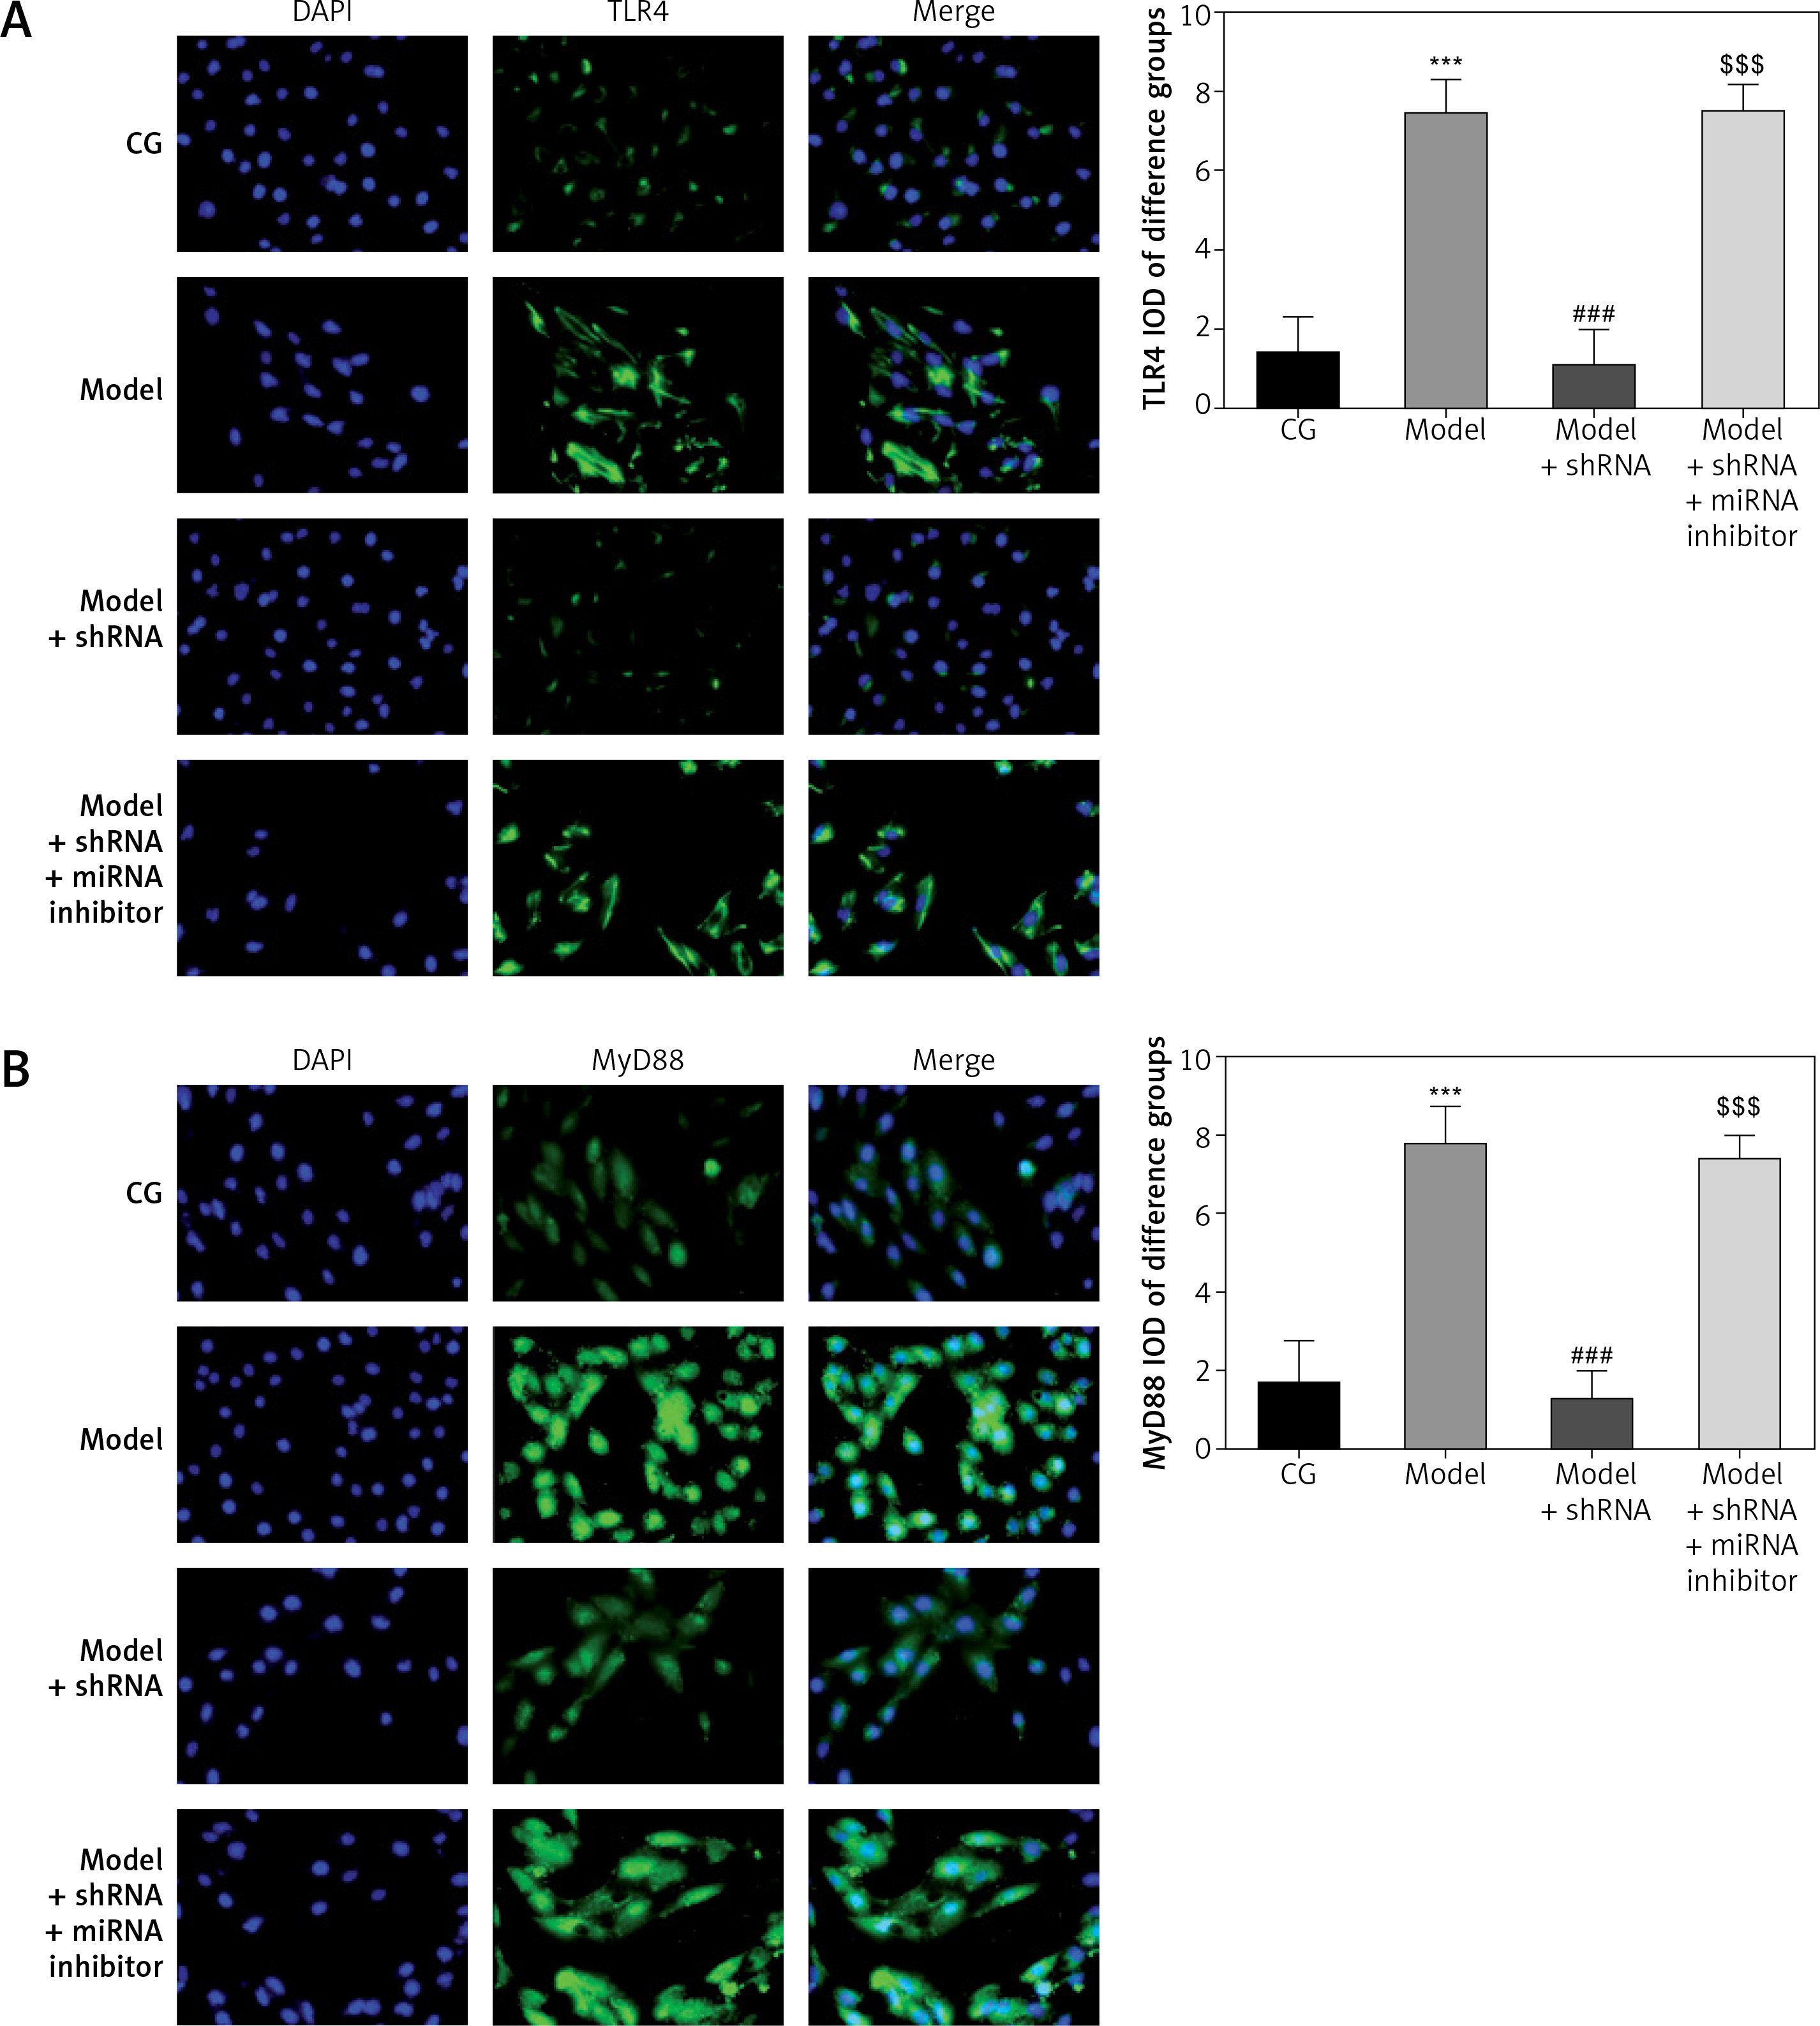
Amount of relative proteins among the different groups
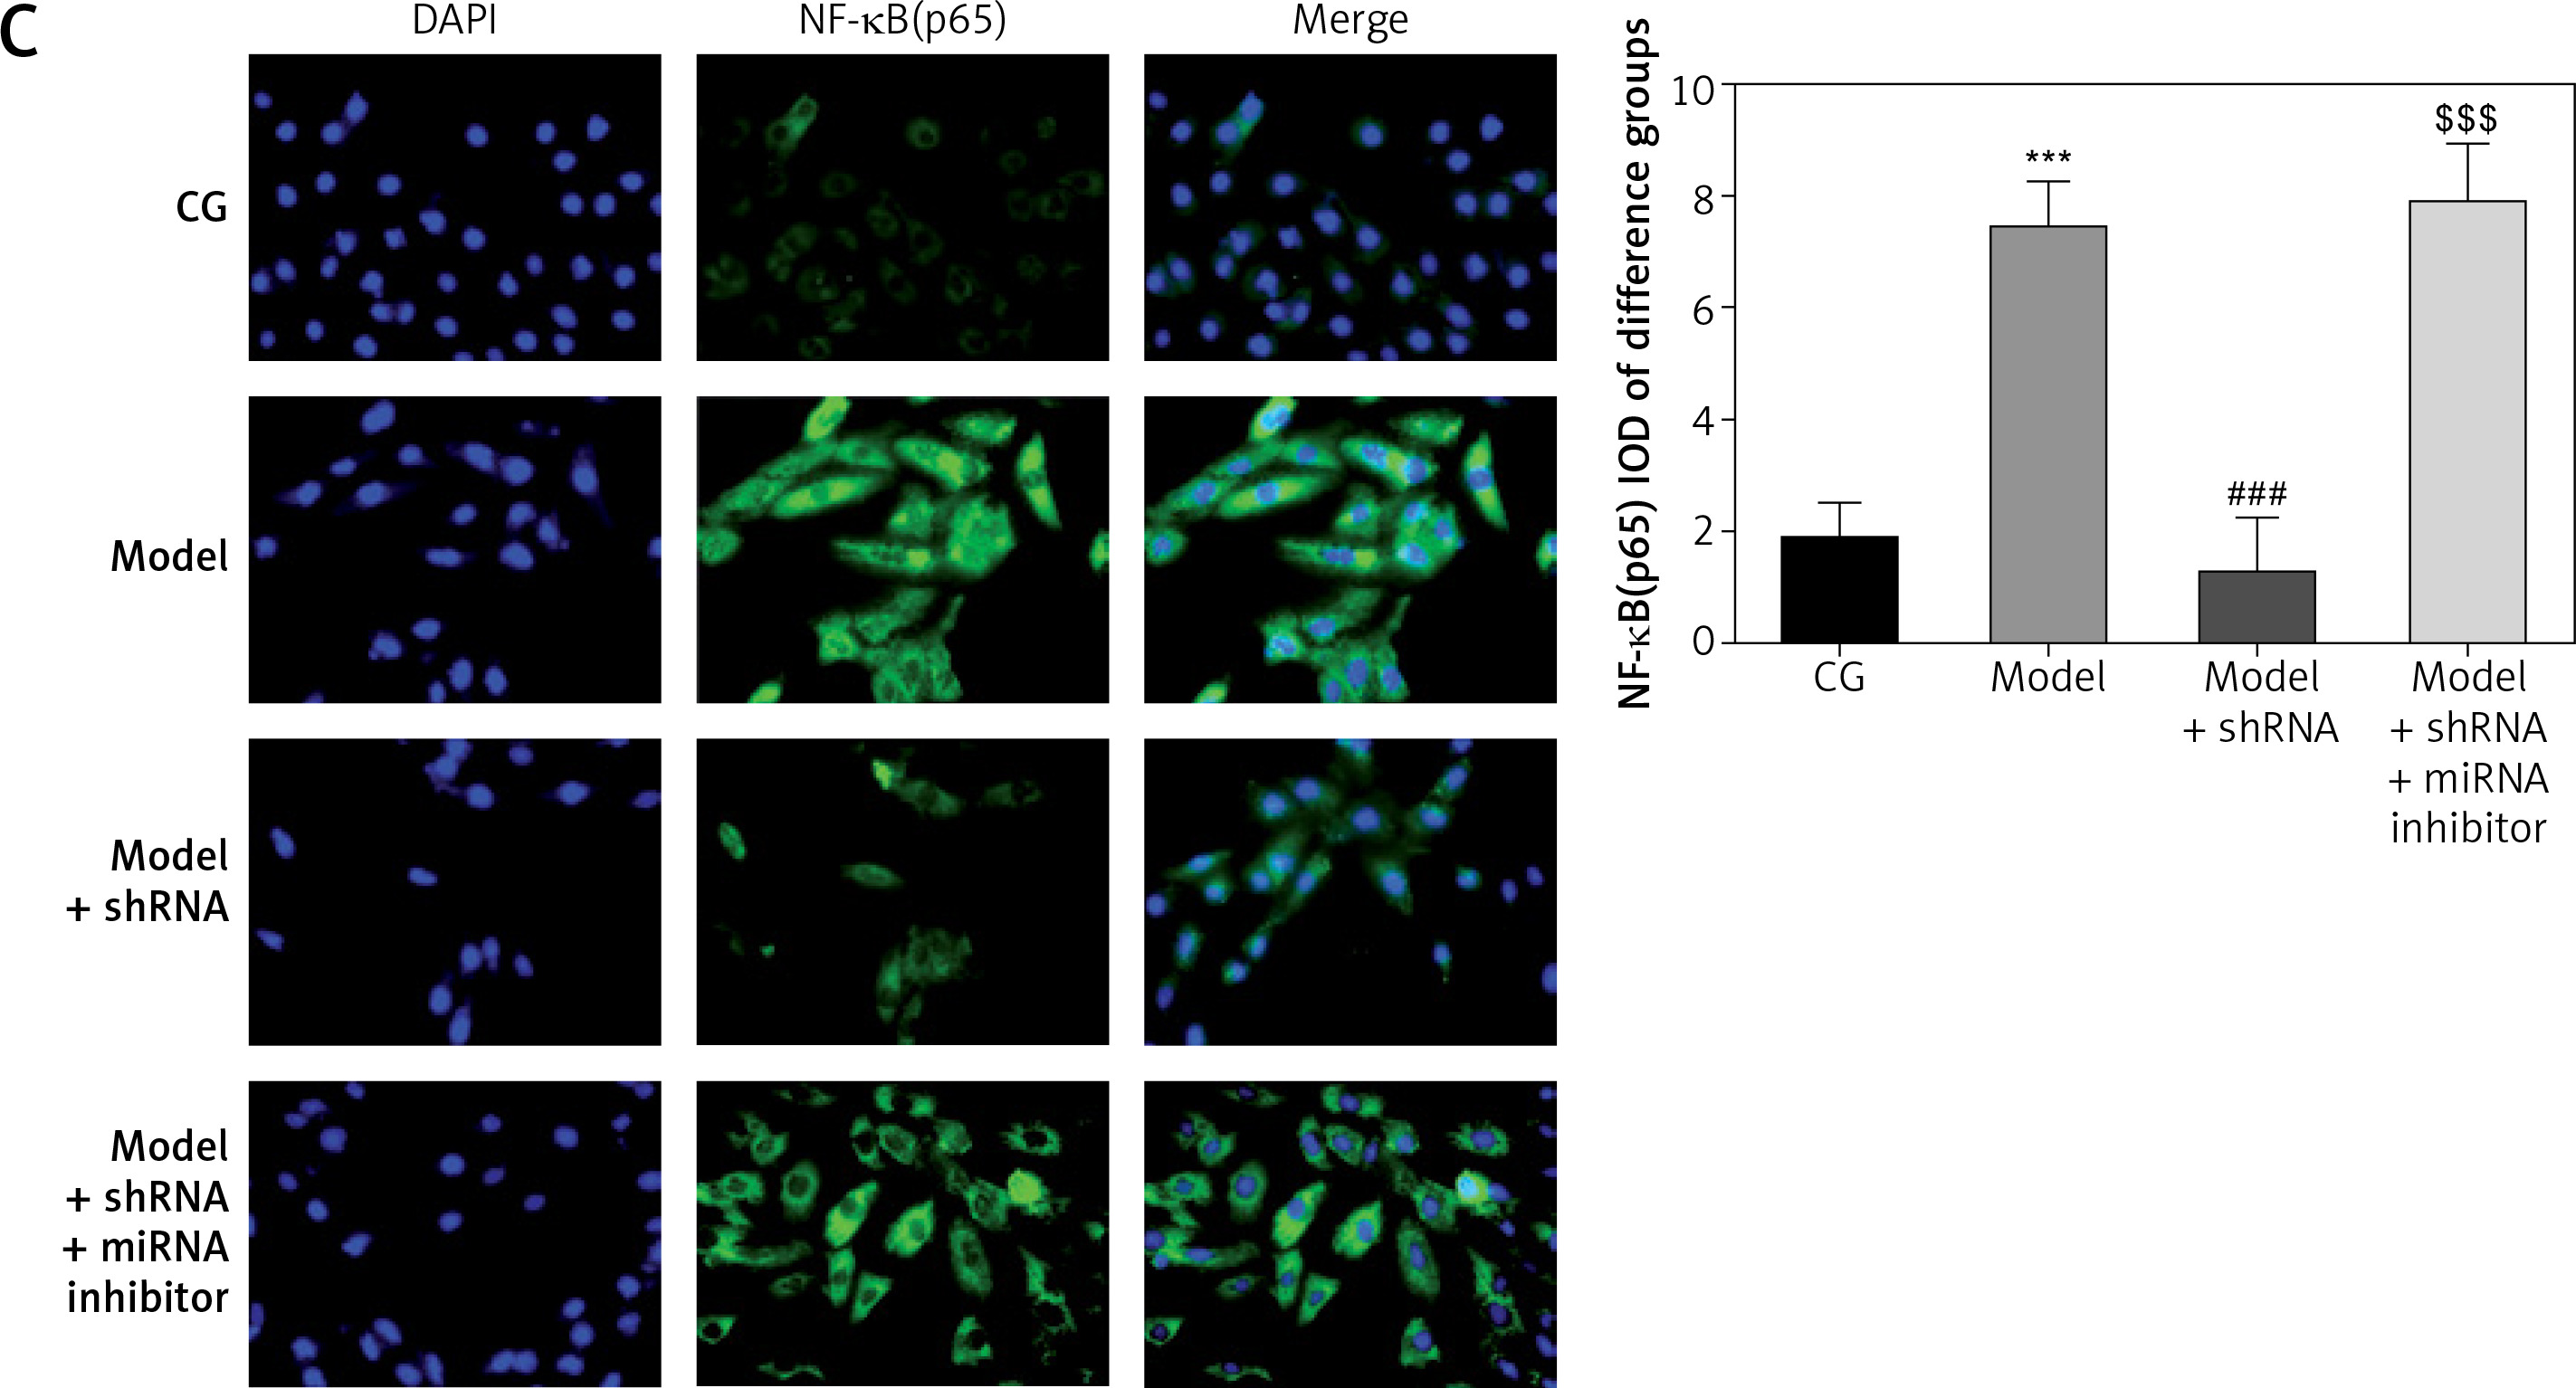
Immunocytochemistry showed significantly higher (p < 0.001) amounts of TLR4, MyD88 and NF-κB(p65) protein in the model group compared with the CG. Amounts of TLR4, MyD88 and NF-κB(p65) protein were significantly lower in the model + shRNA group compared with those of the model group (p < 0.001for all). However, addition of miRNA-877-3p inhibitor significantly decreased the amounts of TLR4, MyD88 and NF-κB(p65) protein in the model + shRNA + miRNA inhibitor group compared with those of the model + shRNA group (p < 0.001 for all) (Figure 10).
Figure 10
Relative protein amount in the different groups measured by immunocytochemistry
CG – control group, Model – high-glucose model group, Model + shRNA – HK-2 cells transfected with shRNA UBE2R2-AS1 and treated with high-glucose medium, Model + shRNA + miRNA inhibitor – HK-2 cells transfected with shRNA UBE2R2-AS1 and miRNA-877-3p inhibitor and treated with high-glucose medium. ***P < 0.001 vs. NC group; ###p < 0.001 vs. Model group, $$$p < 0.001 vs. Model + shRNA group.
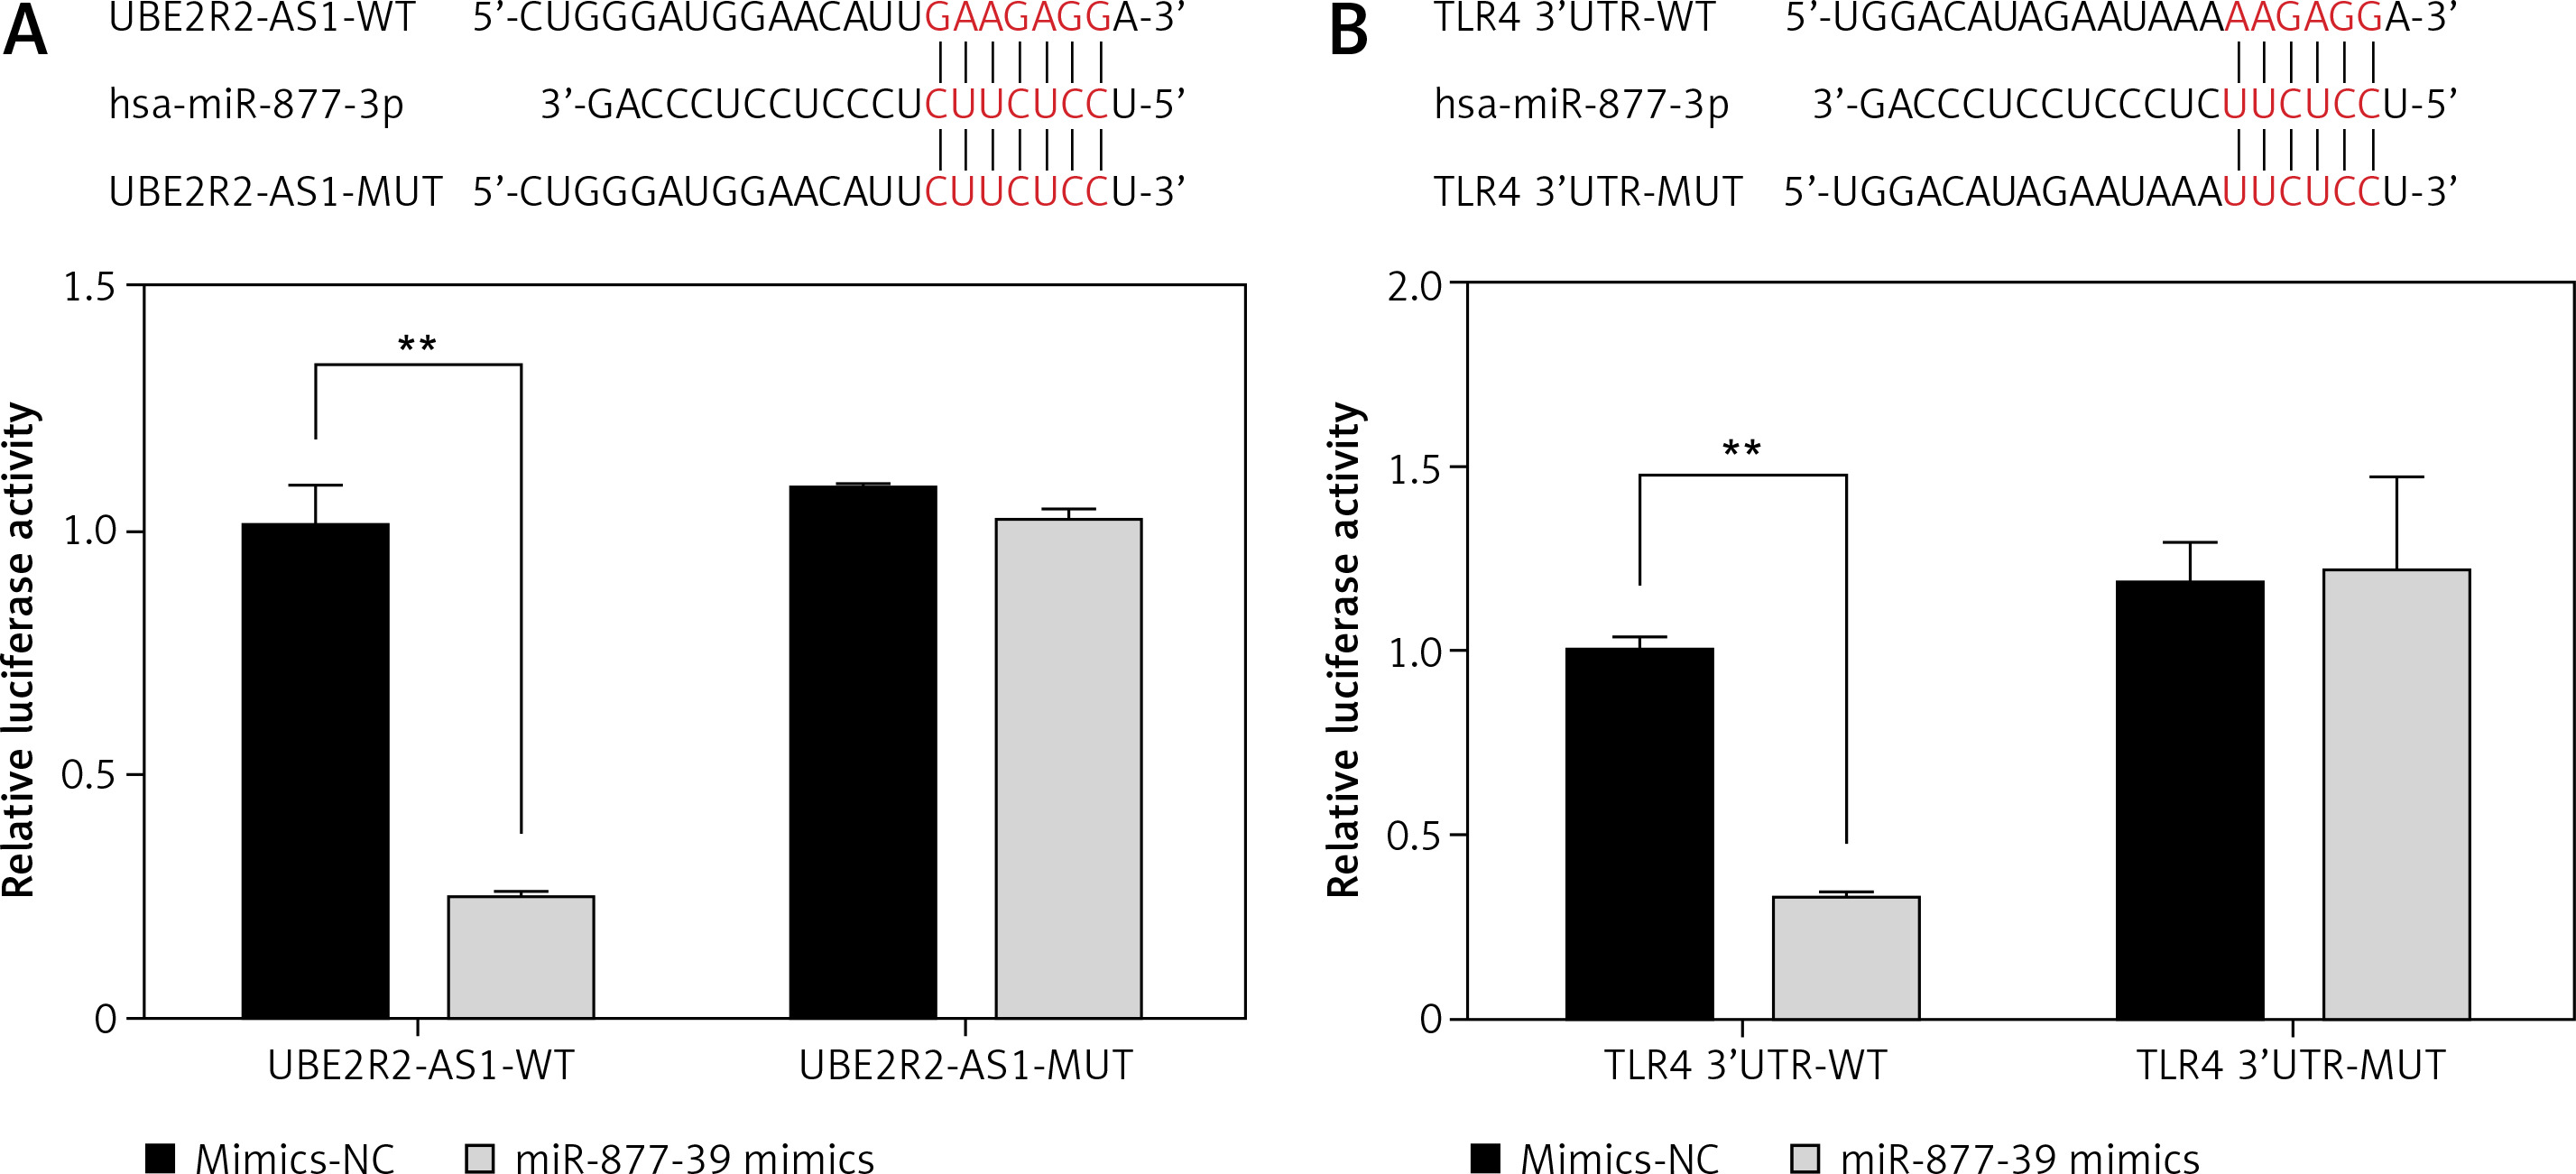
Correlations between UBE2R2-AS1, miRNA-877-3p and TLR4
Luciferase reporter assay demonstrated that miRNA-877-3p was the target gene of UBE2R2-AS1 in HK-2 cells and that TLR4 was the target gene of miRNA-877-3p in HK-2 cells (Figure 11).
Discussion
The biological functions of lncRNAs continue to be revealed, including cell cycle control and epigenetic regulation, as well as roles in transcription, alternative splicing, translation and genetic imprinting. Some lncRNAs have also been detected in urine and blood, enabling their use as biomarkers for in vitro diagnosis. For example, lncRNA PGA3 was detected in urine sediment from prostate cancer patients, and was demonstrated to be more sensitive and specific than prostate-specific antigen as a marker of prostate cancer [11–13]. The lncRNA HOTAIR was detected in the serum of colorectal cancer patients, and was shown to be a potential biological marker for this disease. In addition, analysis of a small RNA library of plasma exosomes also revealed 3.36% lncRNA content [14]. Novel techniques, such as RNA immunoprecipitation, sequencing technology, gene chips and RT-PCR have facilitated the clinical application of lncRNA as a non-invasive biomarker. Furthermore, lncRNAs may exist in a stable form in body fluids, suggesting their potential use as novel biomarkers for the clinical diagnosis and prognostic analysis of DKD patients. Related studies have shown that various lncRNAs have regulatory effects on the occurrence and development of DKD [15–20]. In our present study, the results showed that the cell apoptosis was suppressed and inflammation-related factors (TNF-α and IL-6) were improved with lncRNA UBE2R2-AS1 knockdown by shRNA; however, with miRNA-877-3p inhibitor transfection, the cell injury and TNF-α and IL-6 concentrations were increased. Based on those results, we inferred that lncRNA UBE2R2-AS1 knockdown had effects to improve diabetes-induced renal cell injury that might be correlated with miRNA-877-3p and the related pathway TLR4/MyD88/NF-κB(p65).
Toll-like receptor 4 (TLR4) is the main mediator of immune and inflammatory responses, and its expression in kidney tissue of diabetic kidney injury rats is significantly increased and closely related to proteinuria and renal function [21, 22]. Enhanced expression of TLR4 can increase the activity of NF-κB via activation of MyD88 activity [23, 24]. NF-κB is a transcription regulator that widely exists in various tissues and cells and regulates the expression of cytokines and inflammation-mediated genes, and also participates in the progress of various kidney injuries such as diabetic nephropathy [25–27]. The results of the present study suggest that activation of the TLR4/MyD88/NF-κB pathway was significantly stimulated by cell apoptosis in a high-glucose environment, indicating that activation of this pathway plays a key role in diabetes-induced kidney injury. Our study also revealed that mRNA levels of lncRNA UBE2R2-AS1 significantly increased in the model of high glucose-induced renal proximal tubular epithelial cell injury; therefore, UBE2R2-AS1 may play an important role in diabetic kidney injury. Knockdown of UBE2R2-AS1 expression in HK-2 cells using shRNA led to a significant decrease in high-glucose-induced apoptosis, significant down-regulation of inflammatory factors TNF-α and IL-6, and significant inhibition of the TLR4/MyD88/NF-κB signalling pathway. These results suggest that lncRNA UBE2R2-AS1 can inhibit secretion of inflammatory cytokines by inhibiting the TLR4/MyD88/NF-κB signalling pathway, thus alleviating high-glucose-induced renal cell injury.
In conclusion, studies have shown that lncRNAs plays a role in the regulation of miRNAs. Among these, lncRNA Tu1 downregulates expression of miR-377, alleviates its inhibition of the target gene PPARγ, and reduces ECM accumulation of mesangial cells [28]. Meanwhile, studies have also suggested that lncRNA MALAT1 can alleviate apoptosis in DKD by regulating miR-23c expression [29]. It was previously reported [12] that UBE2R2-AS1 can target miR-877-3p in glioma cells. In the present study, the Dual Luciferase assay confirmed that miR-877-3p is also a target of UBE2R2-AS1 in HK-2 cells, and that miR-877-3p can specifically target TLR4. In conclusion, the present study demonstrates that lncRNA UBE2R2-AS1 improves diabetic kidney injury by targeting miRNA-877-3p/TLR 4.