Introduction
Lipoprotein(a) is recognized as an independent risk factor for atherosclerotic cardiovascular diseases (ASCVD) [1]. Large epidemiological and genetic studies have proven a causal link between Lp(a) and ischemic heart disease (IHD) [2, 3]. Lipoprotein(a) contains apolipoprotein(a) (apo(a)), which is attached to an apoB-100-containing low-density lipoprotein (LDL)-like particle and oxidized phospholipids [4]. Various studies have demonstrated the atherogenic, thrombogenic, and pro-inflammatory properties of Lp(a) [5]. There is wide variation in Lp(a) concentration in blood serum, from trace amounts (< 0.1 mg/dl) to extremely high values (> 300 mg/dl), while the target Lp(a) level is considered to be 50 mg/dl in Europe [6] and 30 mg/dl in the US and Canada [7, 8]. In addition, in a large Danish observational study involving 45,000 subjects, Lp(a) was shown to increase the risk of myocardial infarction (MI) in men at values ≥ 10 mg/dl [9]. In the same population, the prevalence of hyperlipoproteinemia(a) (HLp(a)) (Lp(a) ≥ 50 mg/dl) was about 20% of adults, in both males and females [1]. In the Russian Federation, studies on the role of Lp(a) in atherosclerosis and its correction have been carried out for 30 years [10, 11], whereas information on the prevalence of HLp(a) and the association of Lp(a) with the presence of IHD, MI, and stroke, at the population level is lacking. The “Epidemiology of Cardiovascular Risk Factors and Diseases in Regions of the Russian Federation” Study (ESSE-RF) is a large multicenter population-based study that includes assessment of risk factors and ASCVD prevalence in Russian adults [12].
The aim of this sub-study was to assess the distribution of Lp(a) levels in a sample of adults aged 25–64 years from the Russian population and evaluate the association of Lp(a) level with the presence of IHD, MI, stroke, diabetes mellitus (DM), and arterial hypertension (AH).
Material and methods
The design of the ESSE-RF study was reported earlier [12]. Briefly, the ESSE-RF is a multicenter population-based study in randomly selected district outpatient departments (Trial Registration Clinicaltrials.gov (NCT04306822)). The study included 12 regions from all 8 federal areas in Russia: the North Ossetia (Alania) Republic (North Caucasus), Volgograd (South), Vologda (North-West), Voronezh (Central), Ivanovo (Central), Kemerovo (West Siberia), Krasnoyarsk (East Siberia), Orenburg (Volga Region), Vladivostok (Far East), St. Petersburg (North West), Tomsk (West Siberia), and Tyumen (Ural) with a total of 24,000 participants. In this sub-study, information from Vologda, Ivanovo, Tyumen, Tomsk, the Primorsky regions, and North Ossetia was included. From the total cohort 3% of subjects received lipid-lowering treatment. Of 8461 subjects for whom all data were completed and who were not taking lipid-lowering drugs, 5389 (63.7%) were women and 3072 (36.3%) were men.
The study was approved by the independent ethics committees of: the National Medical Research Centre of Therapy and Preventive Medicine, Approval # 07–03/12 dated 03.07.2012; the National Medical Research Centre of Cardiology, Approval #180, 26.11.2012; the Federal Centre of Heart, Blood and Endocrinology named after V.A. Almazov, Approval #193, 08.10.2012. All subjects gave signed informed consent. All subjects were surveyed using a standard questionnaire that included social and demographic characteristics, a history of diseases, and any therapy. The diagnosis of ASCVD was determined by self-reporting of the following: IHD, MI, stroke. Arterial hypertension and DM were registered in the case of elevated blood pressure and glucose level or appropriate treatment. Waist circumference, height, and weight measurements were taken in all subjects. Body mass index (BMI) was calculated by dividing weight by height squared (kg/m2).
Blood was drawn after overnight fasting; serum was obtained by low-speed centrifugation, aliquoted, frozen immediately and stored at –80°C. Analyses were performed at the central standardized laboratory using an Abbott Architect c8000 autoanalyser with Abbott Diagnostic kits (USA). Total cholesterol (TC), low-density lipoprotein cholesterol (LDL-C), high-density lipoprotein cholesterol (HDL-C) and triglycerides (TG) were measured by enzymatic methods; glucose level was determined by the hexokinase method, apolipoproteins (apo) AI and B concentration by immunoturbidimetric assay. For Lp(a) determination we used latex particle-enhanced turbidimetric immunoassay, which does not depend on the apo(a) isoform size. The LDL-C corrected for Lp(a)-cholesterol was calculated using the formula: LDL-Ccorr (mmol/l) = LDL-C (mmol/l) – 0.3 × (Lp(a) (mg/dl)/38.7) [13].
The cut-off values for parameters of lipid profiles indicating hyperlipoproteinemia were determined as follows: total cholesterol ≥ 5.0 mmol/l, LDL-C ≥ 3.0 mmol/l; TG ≥ 1.7 mmol/l; and HDL-C ≤ 1.0 mmol/l and ≤ 1.2 mmol/l, respectively, for men and women [6]. Prevalence of HLp(a) was described with two Lp(a) cut-off points: 30 mg/dl and 50 mg/dl. Standardization and quality control of the analyses were carried out in accordance with the requirements of the federal system for external quality assessment of clinical laboratory studies (IACCO).
Statistical analysis
Statistical analysis was performed using SPSS 26 (IBM, Armonk, NY, USA) and R 3.5.1 (R Foundation for Statistical Computing, Vienna, Austria). Pearson’s χ2 criterion was used to test the hypothesis of the normal distribution of variables. Continuous variables for which the hypothesis of normal distribution was not rejected are described by the mean and standard deviation; variables for which the hypothesis was rejected are described by the median and interquartile range (25%; 75%). Categorical variables are presented as a relative frequency and its 95% confidence interval (CI). For two independent groups, the hypothesis on the mean was tested using the unpaired Student’s t-test for unequal variances. The Mann-Whitney U test was used to compare the homogeneity of distribution in two groups. Contingency tables (2 × 2) were analyzed using Fisher’s two-sided exact test.
Univariate and multivariate logistic regression models were used to assess the relationships between Lp(a) and diseases. Continuous variables in a series of regression models were transformed into binary variables, where the value “0” corresponded to a level less than the threshold value (for HDL-C level less than the threshold value), and the value “1” was assigned otherwise. A hypothesis on the significance of the area under the curve in the ROC analysis was tested using a bootstrap from the pROC R library [14]. The threshold value for Lp(a) was obtained for diseases with a significant association with Lp(a). The Lp(a) threshold values with a maximal sum of sensitivity and specificity for each disease were determined using ROC analysis. The mean of these values was considered as the cutoff point of Lp(a) for univariate and multivariate regression analyses for all diseases. In multivariate regression models, the diseases were the dependent variables. Variables such as age, sex, LDL-Ccorr, HDL-C, TG, waist circumference, and glucose were used as covariates. A p-value less than 0.05 (p < 0.05) was considered to be statistically significant.
Results
Baseline characteristics are presented in Table I. The median Lp(a) level was higher in women. Mean Lp(a) levels and frequencies of elevated Lp(a) (≥ 30 mg/dl, n = 1871 and ≥ 50 mg/dl, n = 1228) for both sexes in the different age groups are presented in Table II. Lipoprotein(a) levels were higher in women than in men in the 45–54-year and 55–64-year age groups (p < 0.0011 for both).
Table I
Subjects’ characteristics
[i] AH – arterial hypertension, ApoAI – apolipoprotein AI, ApoB – apolipoprotein B, BMI – body mass index, DM – diabetes mellitus, HDL-C – high-density lipoprotein cholesterol, IHD – ischemic heart disease, LDL-C – low-density lipoprotein cholesterol, LDL-Ccorr – corrected for lipoprotein(a) cholesterol, Lp(a) – lipoprotein(a), MI – myocardial infarction, TC – total cholesterol, TG – triglycerides.
Table II
Lipoprotein(a) levels depending on age and gender
The prevalence of Lp(a) ≥ 30 mg/dl was 20.5% and 23%, and the prevalence of Lp(a) ≥ 50 mg/dl was 13.2% and 15.2%, in men and women, respectively. Regardless of sex, the prevalence of Lp(a) ≥ 30 mg/dl was 22.1% and prevalence of Lp(a) ≥ 50 mg/dl was 14.5%. Hyperlipoproteinemia(a) frequency increased with age in women. The remarkable differences between the mean and median levels of Lp(a) were due to its abnormal distribution.
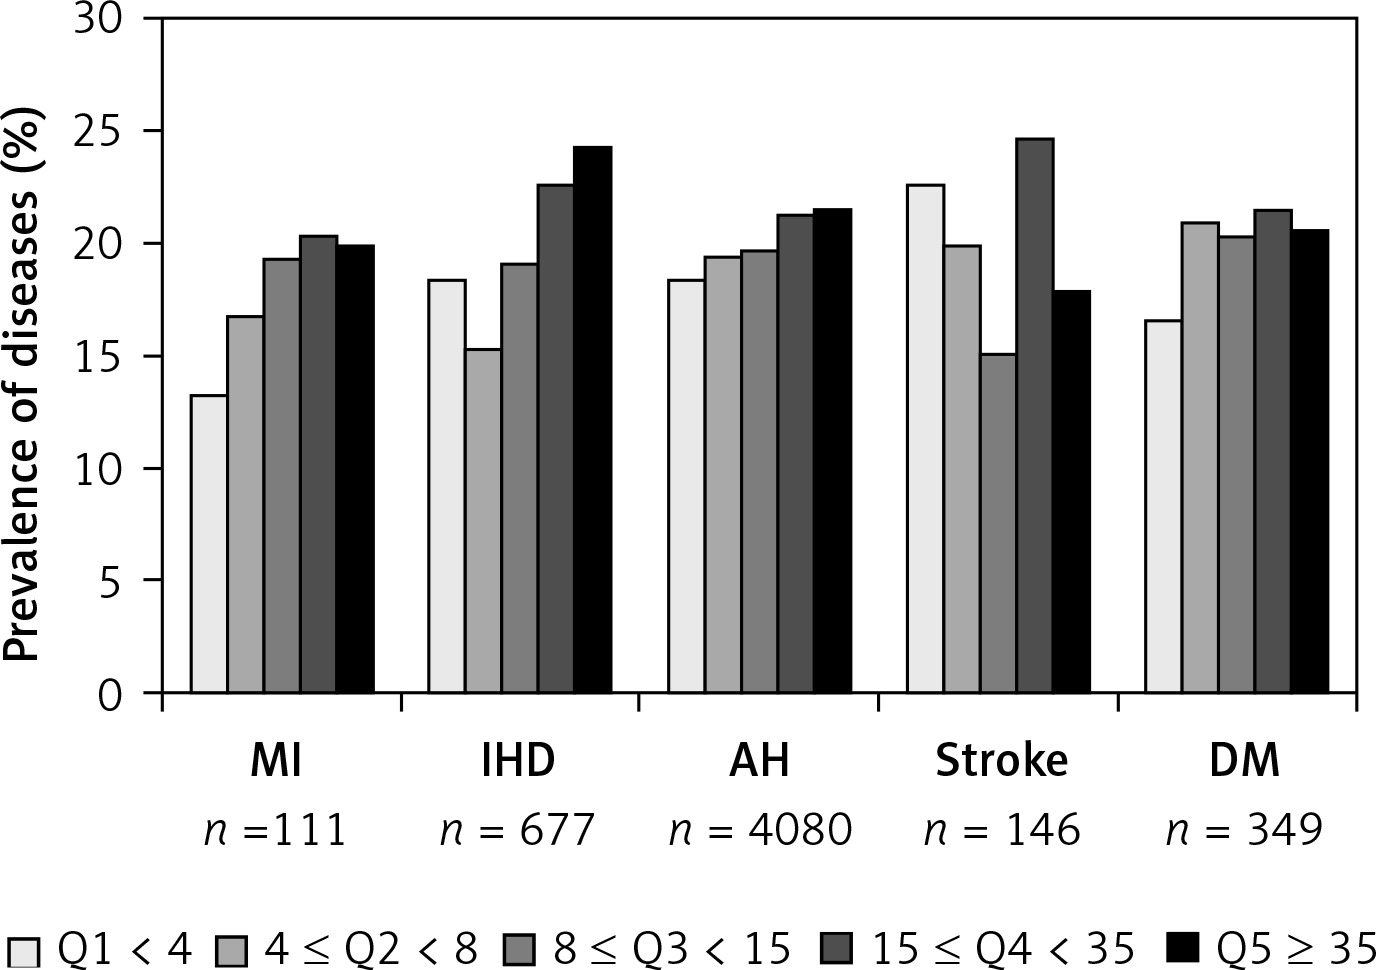
Atherosclerotic cardiovascular disease, AH, and DM distribution according to Lp(a) quintiles is shown in Figure 1. A positive association between Lp(a) and MI, IHD, and AH was found. The frequencies of MI, IHD, and AH were 13.3%, 18.3%, and 18.4%, respectively, in the first quintile, versus 19.9%, 24.2%, and 21.5%, respectively, in the fifth quintile (p < 0.001 for all three diseases). No association of Lp(a) with stroke or DM was found.
Figure 1
Disease distributions according to lipoprotein(a) quintiles
AH – arterial hypertension, DM – diabetes mellitus, IHD – ischemic heart disease, MI – myocardial infarction.
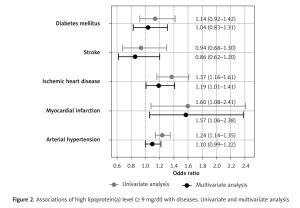
ROC analysis confirmed significant associations of Lp(a) with MI (AUC = 0.55, 95% CI: 0.50–0.60, p = 0.036), IHD (AUC = 0.54, 95% CI: 0.52–0.57, p < 0.001), and AH (AUC = 0.53, 95% CI: 0.52–0.55, p < 0.001), but not with stroke (AUC = 0.50, p = 0.851) or DM (AUC = 0.52, p = 0.221). Cut-off values for Lp(a) with maximal sum of sensitivity and specificity were 5.65, 9.45, and 11.15 mg/dl for MI, IHD, and AH, respectively. The average of these obtained values was 8.75 mg/dl, so for further analysis we used a cut-off level of 9 mg/dl. A univariate binary logistic model demonstrated that Lp(a) ≥ 9 mg/dl was associated with MI, IHD, and AH (Figure 2). Univariate and multivariate models of associations of Lp(a) and other risk factors with MI, IHD, AH, stroke, and DM are presented in Table III.
Table III
Univariate and multivariate logistic regression for Lp(a), risk factors and diseases (N = 8461)
| Disease/risk factor group* (with threshold value) | Univariate model | Multivariate model | ||
|---|---|---|---|---|
| OR (95% CI) | P-value | OR (95% CI) | P-value | |
| IHD: | ||||
| Age > 45 years | 11.57 (8.70–15.80) | < 0.001 | 9.29 (6.88–12.80) | < 0.001 |
| Sex, male | 0.73 (0.61–0.86) | < 0.001 | 1.01 (0.84–1.21) | 0.949 |
| LDL-Ccorr > 3 mmol/l | 1.70 (1.43–2.03) | < 0.001 | 1.02 (0.85–1.23) | 0.845 |
| HDL-C < 1 mmol/l for males, 1.2 mmol/l for females | 1.47 (1.21–1.77) | < 0.001 | 1.24 (1.01–1.52) | 0.040 |
| TG ≥ 1.7 mmol/l | 1.90 (1.61–2.23) | < 0.001 | 1.21 (1.01–1.45) | 0.038 |
| Waist ≥ 102 for males, ≥ 88 for females | 2.79 (2.38–3.27) | < 0.001 | 1.69 (1.42–2.01) | < 0.001 |
| Glucose ≥ 5.6 mmol/l | 1.91 (1.62–2.26) | < 0.001 | 1.18 (0.99–1.42) | 0.068 |
| Lp(a) ≥ 9 mg/dl | 1.37 (1.16–1.61) | < 0.001 | 1.19 (1.01–1.41) | 0.038 |
| MI: | ||||
| Age > 45 years | 41.43 (13.00–251.00) | < 0.001 | 44.53 (14.00–271.00) | < 0.001 |
| Sex, male | 3.43 (2.33–5.13) | < 0.001 | 4.79 (3.17–7.32) | < 0.001 |
| LDL-Ccorr > 3 mmol/l | 1.17 (0.80–1.74) | 0.433 | 0.70 (0.47–1.06) | 0.085 |
| HDL-C < 1 mmol/l for males, < 1.2 mmol/l for females | 1.26 (0.78–1.97) | 0.320 | 1.09 (0.65–1.76) | 0.721 |
| TG ≥ 1.7 mmol/l | 1.96 (1.33–2.87) | 0.001 | 1.28 (0.84–1.93) | 0.245 |
| Waist ≥ 102 for males, ≥ 88 for females | 1.86 (1.27–2.70) | 0.001 | 1.53 (1.01–2.32) | 0.042 |
| Glucose ≥ 5.6 mmol/l | 2.64 (1.80–3.85) | < 0.001 | 1.41 (0.94–2.11) | 0.090 |
| Lp(a) ≥ 9 mg/dl | 1.60 (1.08–2.41) | 0.020 | 1.57 (1.06–2.38) | 0.028 |
| Stroke: | ||||
| Age > 45 years | 6.65 (4.02–12.00) | < 0.001 | 6.44 (3.82–11.70) | < 0.001 |
| Sex, male | 1.38 (0.99–1.91) | 0.057 | 1.91 (1.34–2.70) | < 0.001 |
| LDL-Ccorr > 3 mmol/l | 1.23 (0.88–1.74) | 0.240 | 0.84 (0.59–1.20) | 0.328 |
| HDL-C < 1 mmol/l for males, < 1.2 mmol/l for females | 1.78 (1.21–2.55) | 0.002 | 1.52 (1.01–2.23) | 0.038 |
| TG ≥ 1.7 mmol/l | 1.74 (1.24–2.43) | 0.001 | 1.11 (0.77–1.60) | 0.580 |
| Waist ≥ 102 for males, ≥ 88 for females | 2.46 (1.77–3.43) | < 0.001 | 1.84 (1.28–2.66) | 0.001 |
| Glucose ≥ 5.6 mmol/l | 1.69 (1.18–2.38) | 0.003 | 1.00 (0.68–1.43) | 0.979 |
| Lp(a) ≥ 9 mg/dl | 0.94 (0.68–1.30) | 0.700 | 0.86 (0.62–1.20) | 0.382 |
| DM: | ||||
| Age > 45 years | 7.30 (5.19–10.61) | < 0.001 | 5.28 (3.70–7.78) | < 0.001 |
| Sex, male | 0.76 (0.60–0.95) | 0.019 | 1.12 (0.87–1.44) | 0.363 |
| LDL-Ccorr > 3 mmol/l | 1.23 (0.99–1.55) | 0.067 | 0.70 (0.55–0.89) | 0.004 |
| HDL-C < 1 mmol/l for males, < 1.2 mmol/l for females | 2.49 (1.97–3.13) | < 0.001 | 1.59 (1.24–2.04) | < 0.001 |
| TG ≥ 1.7 mmol/l | 3.77 (3.04–4.69) | < 0.001 | 2.33 (1.84–2.95) | < 0.001 |
| Waist ≥ 102 for males, ≥ 88 for females | 4.98 (3.95–6.33) | < 0.001 | 2.92 (2.27–3.78) | < 0.001 |
| Glucose ≥ 5.6 mmol/l | 16.99 (13.00–22.50) | < 0.001 | Not included | – |
| Lp(a) ≥ 9 mg/dl | 1.14 (0.92–1.42) | 0.24 | 1.04 (0.83–1.31) | 0.716 |
| AH: | ||||
| Age > 45 years | 6.00 (5.45–6.61) | < 0.001 | 4.53 (4.08–5.03) | < 0.001 |
| Sex, male | 0.97 (0.89–1.06) | 0.491 | 1.30 (1.17–1.45) | < 0.001 |
| LDL-Ccorr > 3 mmol/l | 2.09 (1.91–2.28) | < 0.001 | 1.17 (1.05–1.30) | 0.004 |
| HDL-C < 1 mmol/l for males, < 1.2 mmol/l for females | 1.30 (1.16–1.46) | < 0.001 | 0.97 (0.85–1.11) | 0.652 |
| TG ≥ 1.7 mmol/l | 2.90 (2.62–3.21) | < 0.001 | 1.77 (1.57–2.00) | < 0.001 |
| Waist ≥ 102 for males, ≥ 88 for females | 3.74 (3.40–4.12) | < 0.001 | 2.33 (2.09–2.60) | < 0.001 |
| Glucose ≥ 5.6 mmol/l | 3.24 (2.91–3.62) | < 0.001 | 1.85 (1.63–2.10) | < 0.001 |
| Lp(a) ≥ 9 mg/dl | 1.24 (1.14–1.35) | < 0.001 | 1.10 (1.00–1.22) | 0.053 |
* The value “0” corresponded to a factor level less than the threshold value, and the value “1” was assigned otherwise. *P-values for the Wald test for regression coefficients in univariate and multivariate logistic regression models. Abbreviations: see Table I.
Figure 2
Associations of high lipoprotein(a) level (≥ 9 mg/dl) with diseases. Univariate and multivariate analysis
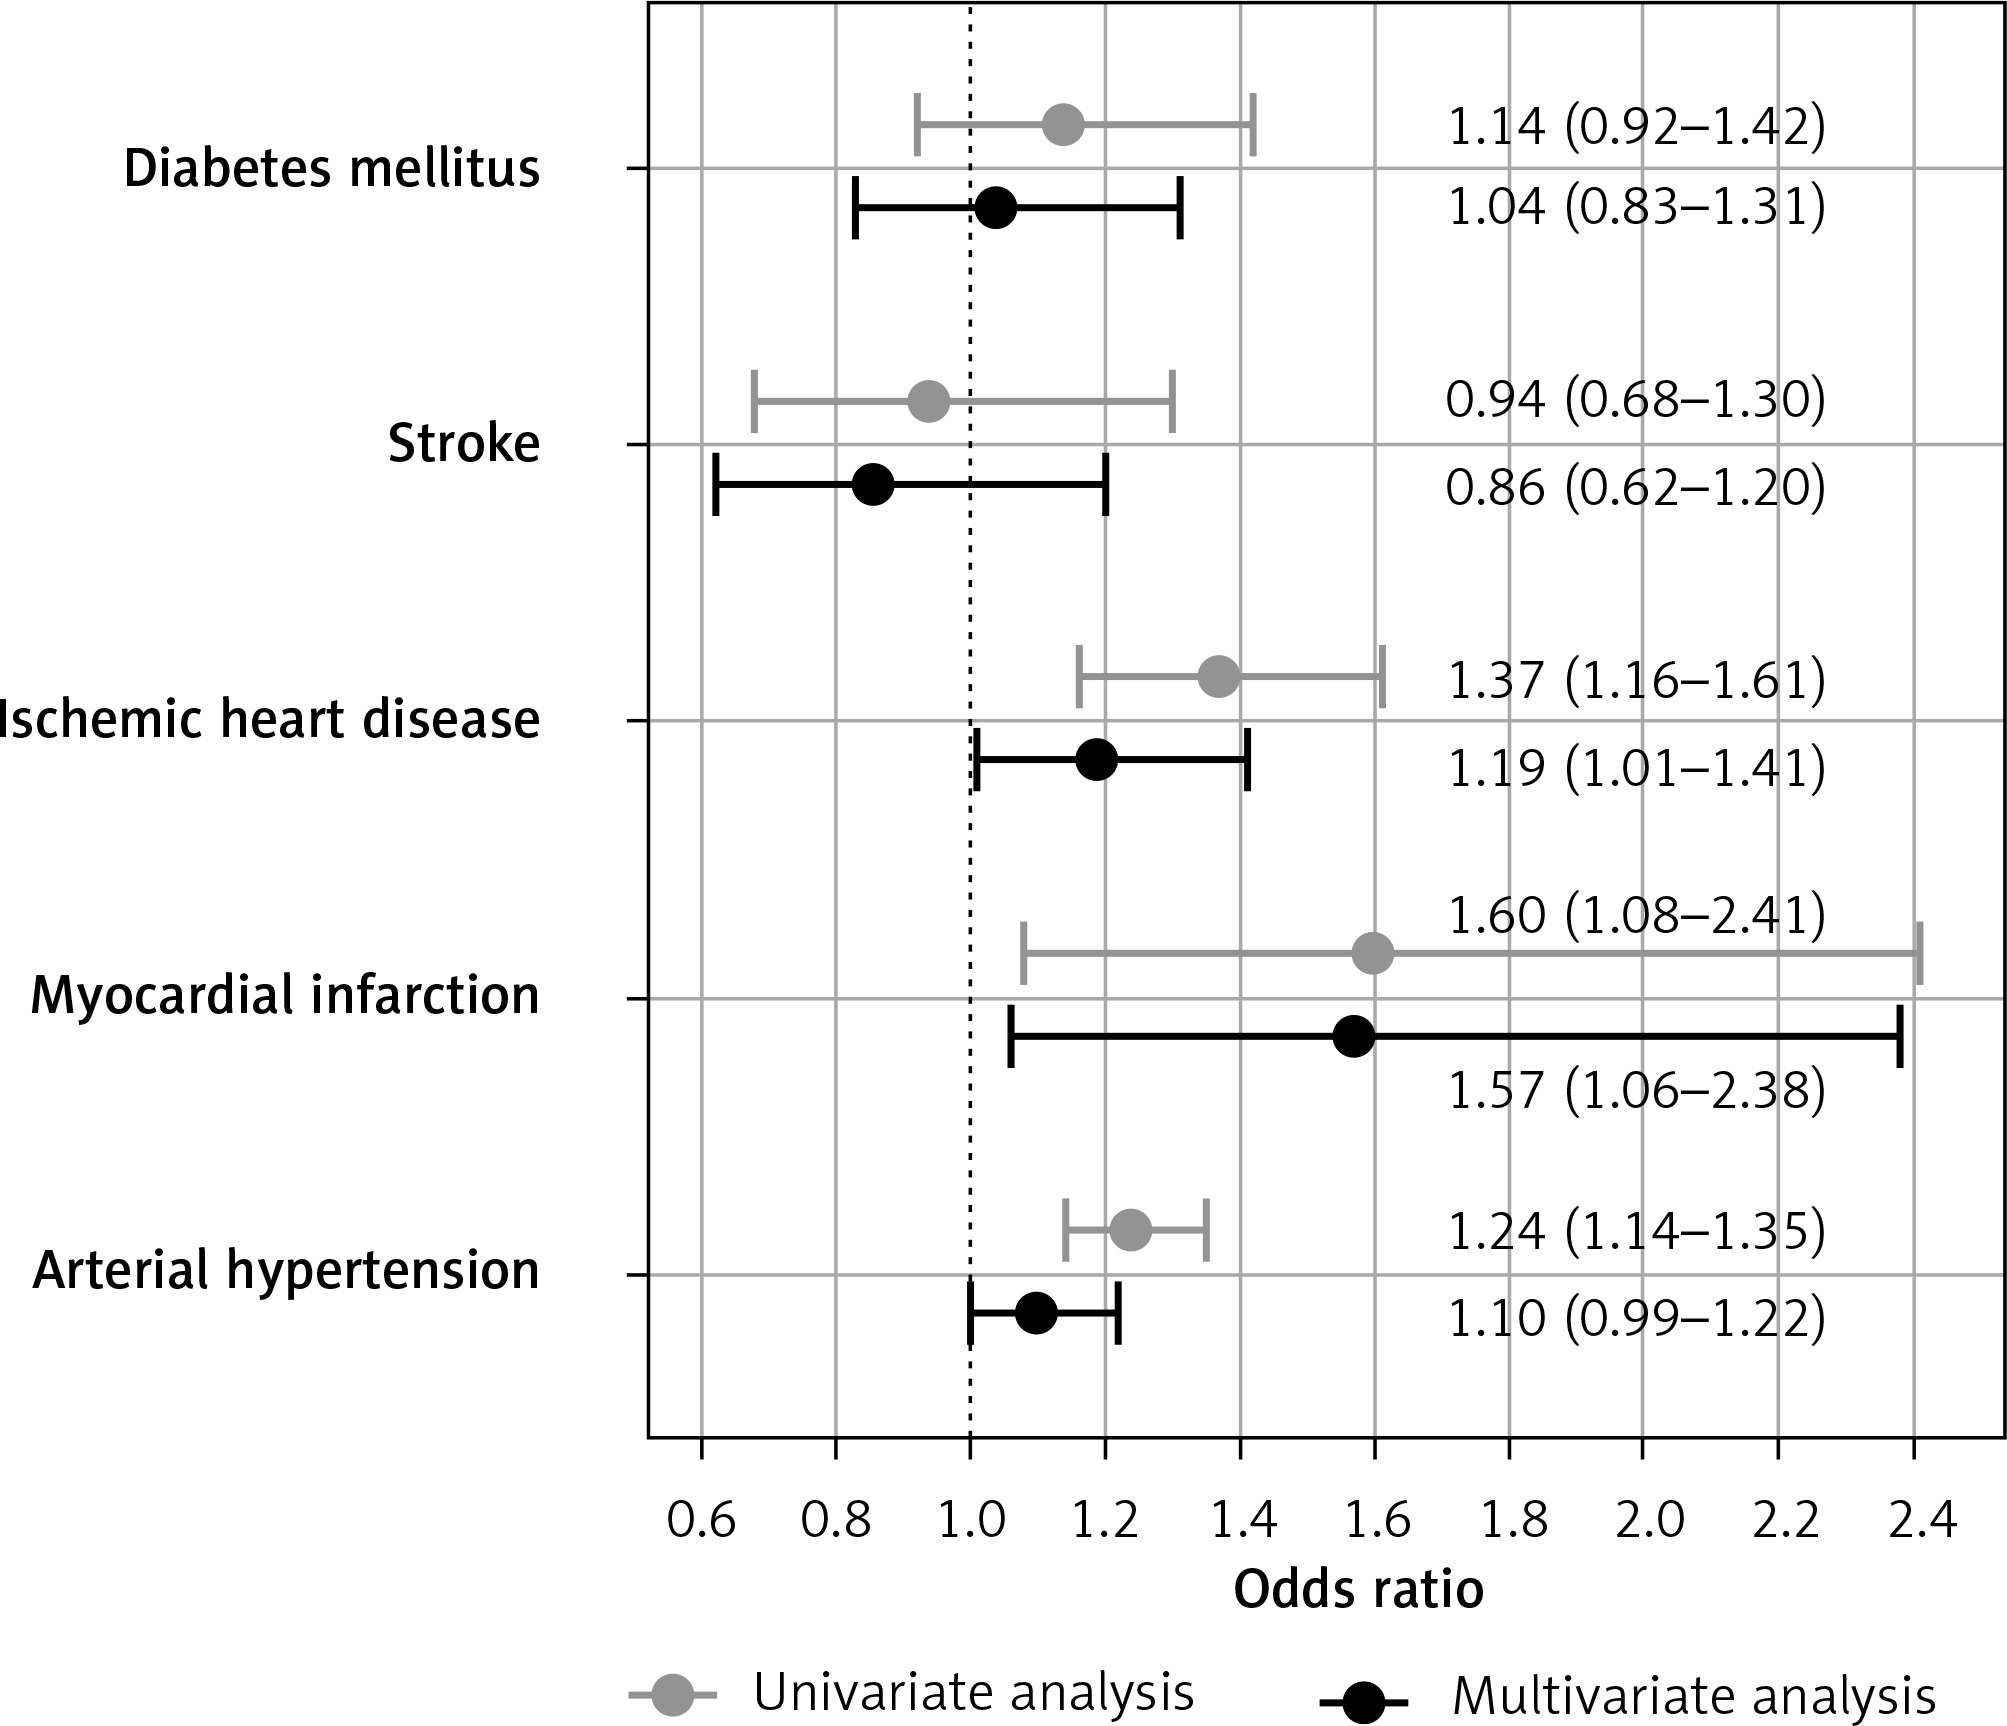
In the univariate model, all the risk factors listed in the methods were significantly associated with IHD and AH, excepting sex for AH. Age, sex, waist circumference and HDL-C level were significantly associated with MI and stroke. Age, lipid profile, and waist circumference but not sex and Lp(a) were significantly associated with DM. In the multivariate analysis, most associations weakened or disappeared; however, the association of Lp(a) with IHD (1.19 (1.01–1.41), p = 0.038) and MI (1.57 (1.06–2.38), p = 0.028) remained significant. After adjustment, Lp(a) remained significantly associated with IHD and MI, while the association of LDL-Ccorr was lost.
Discussion
This new analysis of the ESSE-RF epidemiology project revealed several important data concerning the large sample of adults from the Russian population. First, the prevalence of HLp(a) based on a 30 mg/dl threshold is 21%, whereas on a 50 mg/dl threshold it is about 13%. Second, the cut-off value for Lp(a) level, above which the risk of IHD and MI starts to increase, is 9 mg/dl. Third, Lp(a) level is associated with the presence of IHD and MI, but not stroke or DM or AH.
If we take the 50 mg/dl cut-off point proposed in the European guidelines for the management of dyslipidemia, the prevalence of HLp(a) in Russia is significantly lower than that in Denmark: 13 vs. 20%, respectively [1]. As in Denmark, the prevalence of elevated Lp(a) in Russia is comparable in men and women. However, the average level of Lp(a) and the prevalence of HLp(a) were higher in women after menopause than among younger women, as reported earlier [15].
The link between Lp(a) and IHD and its complications, including MI, has been established in many studies [2, 3, 9] and subsequently summarized [5, 7]. It should be emphasized that this relationship does not depend on classical risk factors, including elevated cholesterol level, and does not have clear threshold values. Moreover, Lp(a) level is relatively constant and is not affected significantly by statins [16] or ezetimibe [17] and is moderately decreased by proprotein convertase subtilisin/kexin type 9 inhibitors [18].
As shown previously and in our study, it is especially important to take into account the fact that the Lp(a) particle consists of LDL-C at a level of 30–45%. Therefore, in both clinical studies and real clinical settings it is necessary to calculate the LDL-C level corrected for Lp(a)-cholesterol content [19]. A Framingham study showed a positive correlation between LDL-C and Lp(a)-cholesterol in men (r = 0.146, p ≤ 0.0011), which disappeared when LDL-C was corrected for Lp(a)-cholesterol (r = –0.028, p = 0.3) [20]. The fact that the association of Lp(a) with IHD in our study starts at the 9 mg/dl level agrees with the data from the Copenhagen study [9]. In the Framingham Heart Study, the 75th percentile Lp(a)-cholesterol (> 10 mg/dl) was chosen as the threshold and corresponds to an Lp(a) mass > 34.4 mg/dl.
In our study, no relationship between Lp(a) level and stroke was established. Previously different studies have demonstrated an association of Lp(a) with stroke [21–23] or no association [24, 25]. Considering that we recently found a positive association between Lp(a) level and stenotic atherosclerosis of the carotid arteries [26], further studies in the Russian population, including subjects with cerebrovascular disease, are needed.
Univariate analysis revealed an association of Lp(a) with AH, which disappeared in multivariate analysis. This indicates, first, the absence of a direct relationship between these factors. Second, the presence of this correlation may be indirect and reflect a role of Lp(a) in damaging target organs in both AH and atherosclerosis [27, 28].
Finally, we did not establish a relationship between Lp(a) and DM. In contrast to the clear positive relationship between Lp(a) and ASCVD, a paradoxical inverse relationship between elevated Lp(a) and the risk of DM was previously observed [24, 25]. This phenomenon remains unexplained.
This is a cross-sectional study with self-reported disease outcomes in the past. Whilst this might be a serious limitation in a study of such design, it may not be so in our case because the Lp(a) level is genetically determined and fairly constant through life, and its observed association with ASCVD may be related to its lifelong effect on vessels. Taking into account recent data on the association of Lp(a) level with cardiovascular mortality in primary cardiovascular prevention [29–31], prospective observation is currently being performed within the framework of the ESSE-RF. This will provide invaluable information about Lp(a) as a prognostic factor in the Russian population.
In conclusion, an Lp(a) level more than 30 mg/dl is detected in every fifth adult aged 25–64 years. A significant association of Lp(a) level above 9 mg/dl with the presence of IHD and MI has been found.