Introduction
Gastric cancer (GC) remains one of the common causes of cancer-related death around the world, particularly in China [1]. At present, surgical resection is still the main therapeutic option for GC treatment. Despite great achievements made in diagnostic and therapeutic methods for GC over the past several decades, the prognostic outcomes of patients with GC remain unsatisfactory [2]. Therefore, there is an urgent need for both clinical surgeons and basic medical researchers to investigate molecular mechanisms that are involved in GC progression.
As a multistep process, gastric carcinogenesis is caused by the accumulation of numerous genetic and epigenetic aberrations. Long non-coding RNAs (lncRNAs) are a group of non-coding RNA molecules that are greater than 200 nucleotides in length [3], and a handful of published articles have implied that lncRNAs serve pivotal roles in many human diseases, including tumourigenesis [4]. OIP5-AS1, a newly identified lncRNA that is transcribed from Opa-interacting protein 5 (OIP5) gene in antisense orientation [5], has been identified as an oncogene in many types of human cancers, such as lung cancer [6, 7], glioma [8], and hepatoblastoma [9]. Nonetheless, the understanding about the role of OIP5-AS1 in GC progression is still limited.
Therefore, the purpose of the present research is to determine the expression profile and clinical significance of OIP5-AS1 in GC, and to confirm its biological functions in regulating GC cell phenotypes. We believe our study might contribute to the identification of lncRNA-directed diagnostic and therapeutic methods for GC.
Material and methods
Tissue samples
Paired GC and matched adjacent nontumour tissues were collected from 89 patients who underwent primary surgical resection at the Affiliated Zhongshan Hospital of Dalian University (Dalian, China) 2015–2017. All patients did not receive chemotherapy or radiotherapy prior to the surgery. The clinicopathological characteristics of these patients are listed in Table I. The tissue samples were snap-frozen in liquid nitrogen and then stored at –80°C for further analysis. The research protocols were approved by the Ethics Committee of the Affiliated Zhongshan Hospital of Dalian University, and every patient was asked to sign a written, informed consent form.
Table I
Relationship between OIP5-AS1 expression and clinicopathological characteristics of GC patients (n = 89)
Cell culture and transfection
Five GC cell lines (AGS, HGC-27, BGC-823, MGC-803, and SGC-7901) and normal human gastric mucosa cells GES-1, purchased from the Cell Bank of the Chinese Academy of Sciences (Shanghai, China), were culture in RPMI 1640 medium (KeyGene, Nanjing, China) containing 10% foetal bovine serum (FBS; Invitrogen, Carlsbad, CA, USA) in a 37°C humidified atmosphere of 5% CO2.
Human miR-186 mimics, miR-186 inhibitor, and mimics/inhibitor control were purchased from GenePharma (Shanghai, China), and their sequences were listed in Table II. Knockdown of OIP5-AS1 in cells was obtained by transfection with shRNAs. Chemically synthesised siRNA sequence targeting OIP5-AS1 and the control sequence were inserted into to the shRNA expression vector pGPH1/Neo (GenePharma). The sequences of sh-OIP5-AS1 were sense: 5’-CACCGCTCCTAGGATTCCAGTTATCCGAAGATAACTGGAATCCTAGGAGC-3’; antisense: 5’-AAAAGCTCCTAGGATTCCAGTTATCTTCGGATAACTGGAATCCTAGGAGC-3’. Cell transfection was performed using Lipofectamine 3000 (Invitrogen) following the manufacturer’s protocol.
Table II
The sequences of oligonucleotides and PCR primers
RT-qPCR analysis
Total RNA samples were extracted from tissues and cells using TRIzol reagent (Invitrogen). After reverse transcription of the total RNA using a PrimeScript RT reagent Kit (TaKaRa, Dalian, China), qPCR analysis was performed using SYBR Premix Ex Taq (TaKaRa) on an ABI 7500 real-time PCR system (Life Technologies, Carlsbad, CA, USA). GAPDH or U6 was used as an endogenous control. Expression fold changes were calculated by the 2–ΔΔCt method [10]. The formula is as follows:
ΔΔCt = [Cttarget gene – CtGAPDH/U6]experimental – [Cttarget gene – CtGAPDH/U6]control.
The sequences of PCR primers are listed in Table II.
Western blot analysis
Total proteins were extracted using a protein extraction kit (CWBIO, Beijing, China). Equal amounts of protein were run on SDS-PAGE and then transferred onto PVDF membranes (Millipore, Bedford, MA, USA). The membranes were blocked with 5% milk at room temperature for 1 h, incubated with specific primary antibodies overnight at 4°C, and then incubated with appropriate HRP-conjugated secondary antibodies for 1 h at room temperature. The signals were visualised using an enhanced chemiluminescent detection kit (Pierce, Rockford, IL, USA), and GAPDH was considered as an internal loading control
Xenograft animal model
Twelve male athymic BALB/c nude mice (4–6 weeks old) were purchased from Vital River Laboratory Animal Technology Co., Ltd. (Beijing, China). AGS cells (5 × 10⁶) stably transfected with sh-OIP5-AS1 or sh-NC were resuspended in 150 μl of medium and injected subcutaneously into the flank region of the nude mice (n = 6/group). When the tumour volume reached approximately 100 mm3, the tumour growth was monitored every 3 days, and the tumour volume was calculated using the formula: volume = length × (width)2/2. Three weeks later, mice were sacrificed by carbon dioxide asphyxiation and tumours were dissected. All experimental procedures were approved by the Ethics Committee of Zhongshan Hospital Affiliated of Dalian University, and all efforts were made to minimise animal suffering.
Cell counting kit-8 assay
Cell proliferation was analysed by cell counting kit-8 (CCK-8) assay (Beyotime, Shanghai, China). Following transfection, cells were seeded at a density of 5 × 10³ cells/well in 96-well plates and cultured for indicated periods. 10 μl of CCK-8 solution was added to each well, and the plate was incubated at 37°C for an additional 2 h. The absorbance values were detected at 450 nm using a microplate reader (BioTek Instruments, Inc., Winooski, VT, USA).
Colony formation assay
Approximately 1000 cells were plated into six-well plates and allowed to grow in RPMI-1640 medium containing 10% FBS at 37°C. Culture medium was replaced every 3 days. Twelve days later, the cells were fixed with methanol, stained with 0.1% crystal violet, and observed.
Cell apoptosis analysis
Cell apoptosis was detected using an Annexin V-FITC Apoptosis Detection Kit (Beyotime, Shanghai, China). Briefly, cells were harvested and resuspended in 100 µl binding buffer containing 5 µl of Annexin V-FITC and 5 µl of PI, and then incubated at room temperature in the dark for 15 min. The percentage of apoptotic cells was analysed by flow cytometry (BD Biosciences, Franklin lakes, NJ, USA).
Glucose consumption and lactate production assay
To detect the levels of glucose and lactate, the cellular supernatants were collected after centrifugation and analysed using glucose and lactate assay kits (BioVision, Milpitas, CA, USA) following the manufacturer’s protocol. Glucose consumption and lactate production were calculated based on the standard curve.
Dual luciferase reporter assay
The OIP5-AS1 fragment containing the miR-186 binding site was amplified by PCR and cloned into the psiCHECK-2 vector (Promega, Madison, WI, USA). The binding site of OIP5-AS1 and miR-186 was mutated from AUUCUUU to AAUCAAU using a QuickChange® Site-Directed Mutagenesis Kit (Stratagene, La Jolla, CA, USA). Cells were co-transfected with luciferase reporter vectors comprising WT-OIP5-AS1 or MUT-OIP5-AS1 and miR-186 mimics or mimics control using Lipofectamine 3000. The luciferase activities were measured 48 h post-transfection using a dual-luciferase reporter assay system (Promega).
Statistical analysis
Graphpad Prism (version 6.01) software (GraphPad Software, Inc., La Jolla, CA, USA) and SPSS version 18.0 software (SPSS Inc., Chicago, IL, USA) were used for statistical analysis. Experimental data were presented as means ± standard deviation (SD). The differences among the groups were estimated by Student’s t-test, χ2 test or one-way ANOVA. Correlation of OIP5-AS1 expression with that of miR-186 was performed by Pearson correlation test. A two-sided p-value < 0.05 was considered as statistically significant.
Results
OIP5-AS1 is upregulated in gastric cancer tissues and cell lines
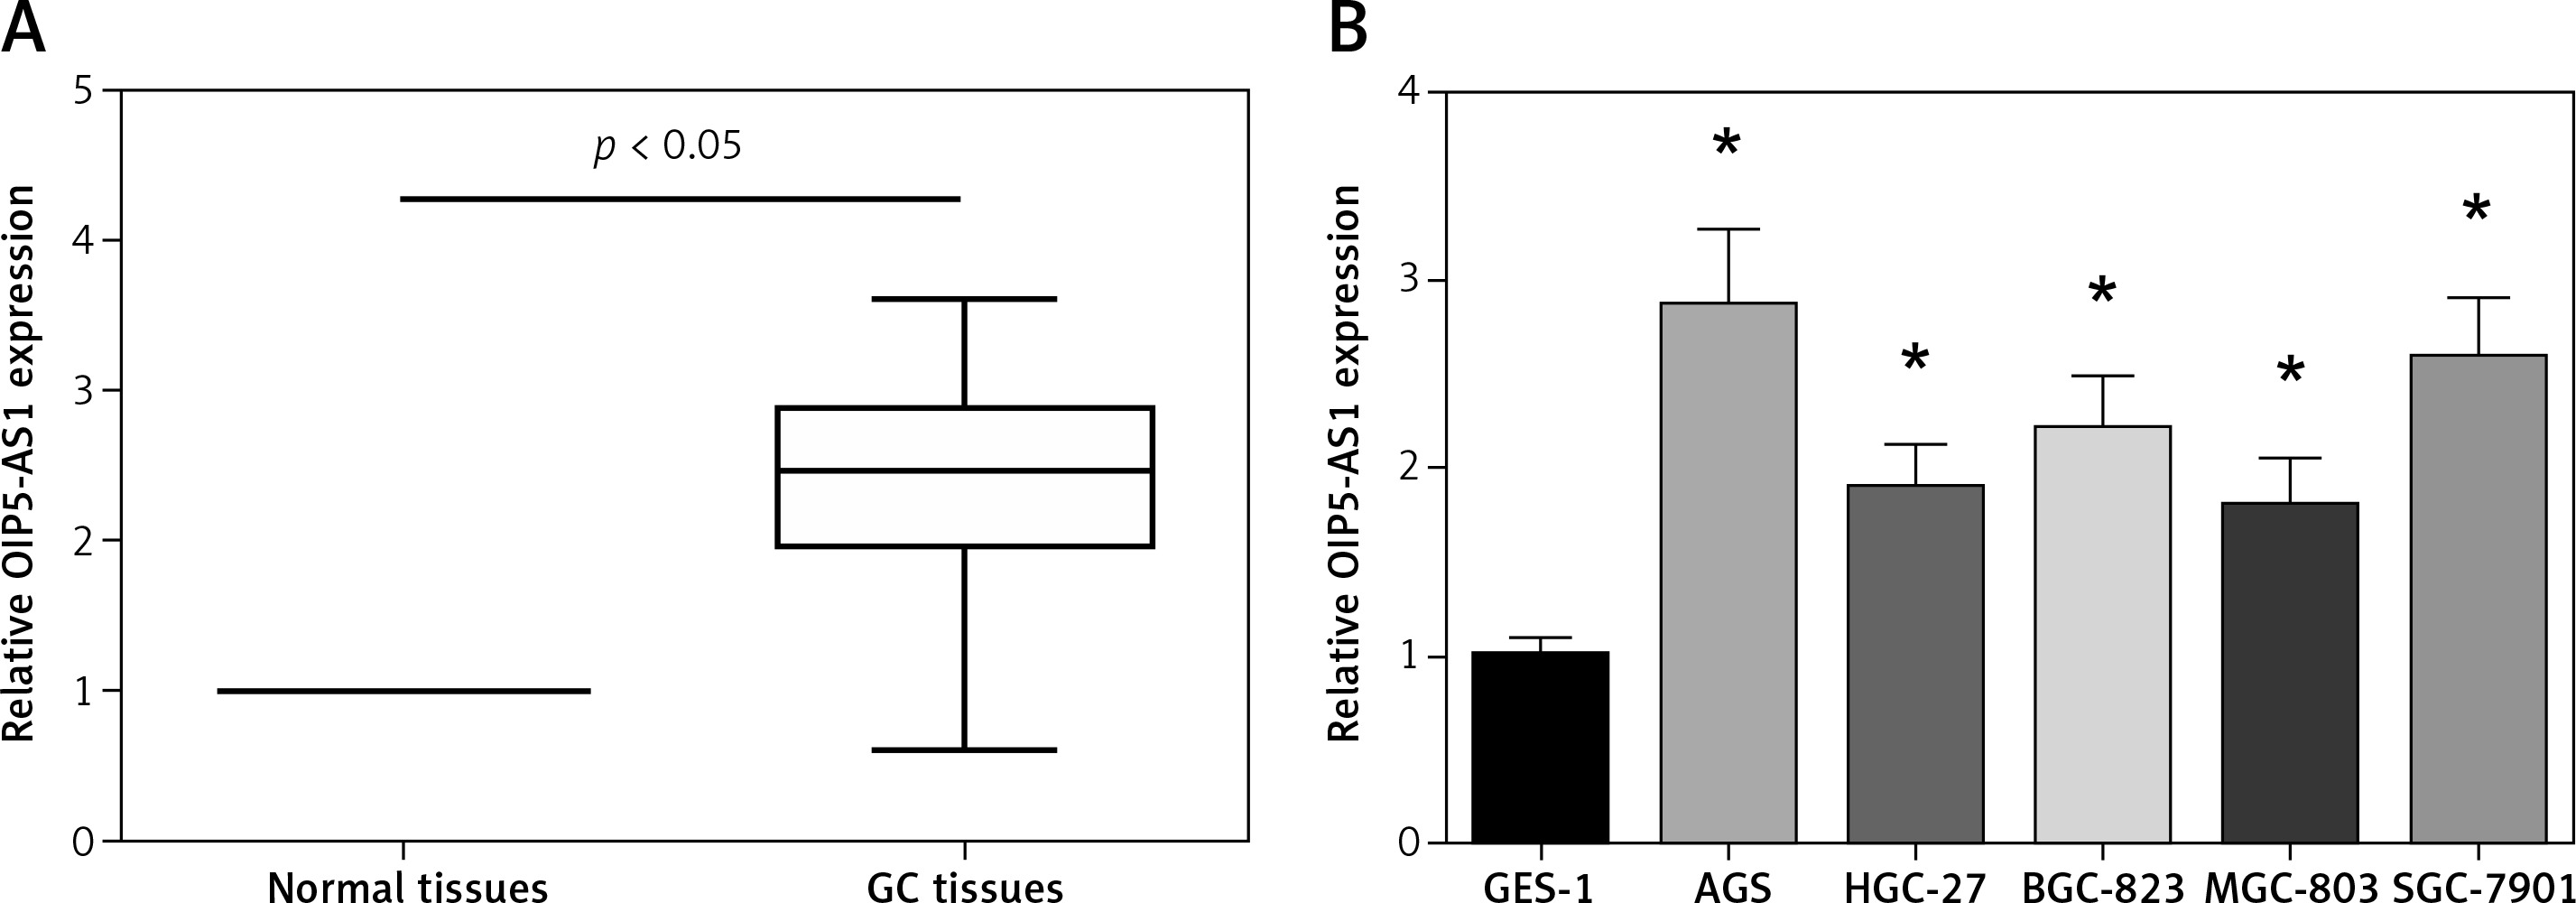
OIP5-AS1 expression was tested in tumour tissues and adjacent nontumor tissues of 89 GC patients by RT-qPCR analysis. Remarkably higher OIP5-AS1 expression was found in GC tissues than that in the adjacent normal tissues (Figure 1 A). We then analysed the association between the OIP5-AS1 expression and clinicopathological features of GC patients. 89 GC patients were allocated into two groups, including a low-expression group (< mean, n = 43) and a high-expression group (≥ mean, n = 46), according to the cut-off value of OIP5-AS1 expression. Our data showed that high OIP5-AS1 expression was notably correlated with increased tumour size (p = 0.036) and advanced TNM stage (p = 0.007) (Table I). Then we determined OIP5-AS1 expression in five human GC cell lines. As demonstrated in Figure 1 B, all the GC cell lines showed a notable higher expression level of OIP5-AS1 compared to the normal GES-1 cells.
Figure 1
OIP5-AS1 is upregulated in GC tissues and cell lines. A – The expression levels of OIP5-AS1 in GC tissues and adjacent nontumour tissues were examined by RT-qPCR analysis. B – The expression levels of OIP5-AS1 in five GC cell lines and normal human gastric mucosa cells GES-1 were examined by RT-qPCR analysis
*p < 0.05 vs. GES-1 cells.
Knockdown of OIP5-AS1 inhibits gastric cancer cell proliferation and induces cell apoptosis in vitro
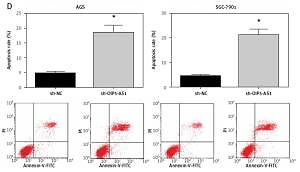
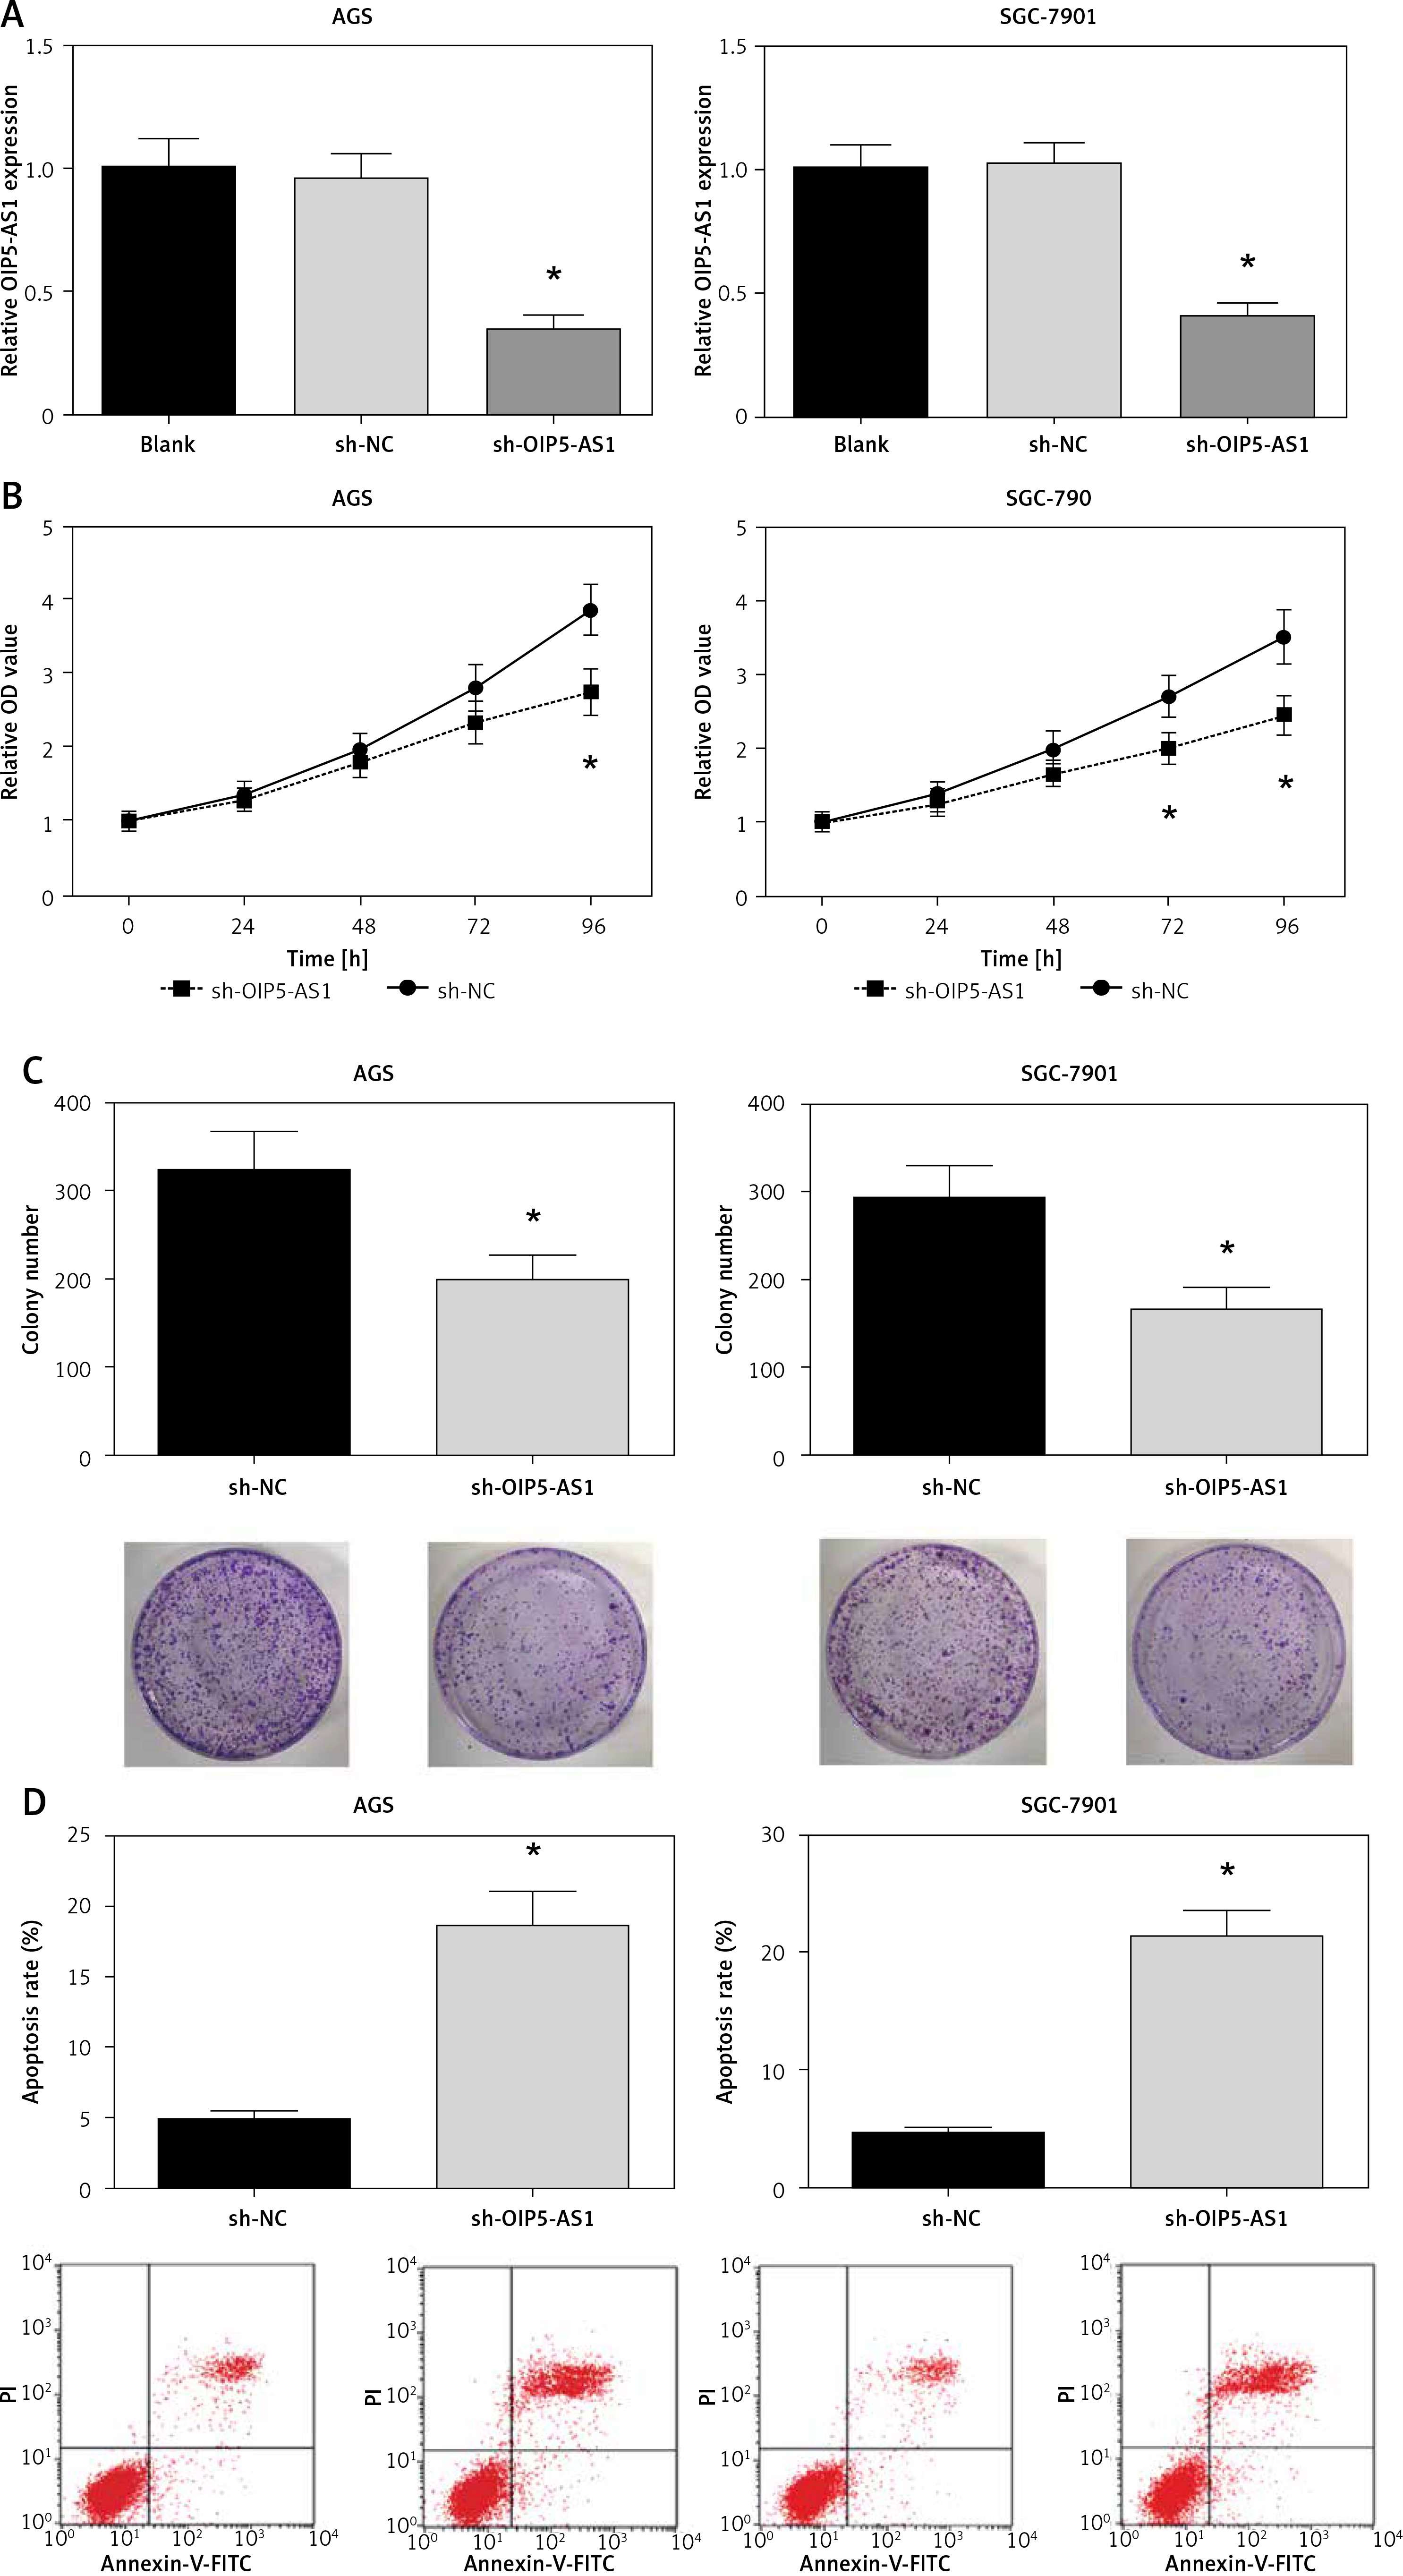
AGS and SGC-7901 cells showed relatively high expression of OIP5-AS1; therefore, we knocked down the expression of OIP5-AS1 by stable transfection with shRNAs in these cells. As shown in Figure 2 A, OIP5-AS1 expression was significantly reduced after transfection with sh-OIP5-AS1 in AGS and SGC-7901 cells. After OIP5-AS1 knockdown, the proliferation abilities of AGS and SGC-7901 cells were significantly repressed (Figure 2 B). Moreover, the results of colony formation assay indicated that the colony formation rates of AGS and SGC-7901 cells were also markedly suppressed by OIP5-AS1 knockdown (Figure 2 C). Moreover, we also found that OIP5-AS1 knockdown significantly enhanced the apoptosis of AGS and SGC-7901 cells (Figure 2 D).
Figure 2
Knockdown of OIP5-AS1 inhibits GC cell proliferation and induces cell apoptosis in vitro. A – The transfection efficacies in AGS and SGC-7901 cells were determined by RT-qPCR analysis. B – The proliferation of AGS and SGC-7901 cells after transfection was determined by CCK-8 assay C – The colony formation ability of AGS and SGC-7901 cells after transfection was detected by colony formation assay. D – The apoptotic rates of AGS and SGC-7901 cells after transfection were measured by flow cytometry following Annexin-V/PI staining
*p < 0.05 vs. sh-NC-transfected cells.
Knockdown of OIP5-AS1 inhibits GC tumour growth in vivo
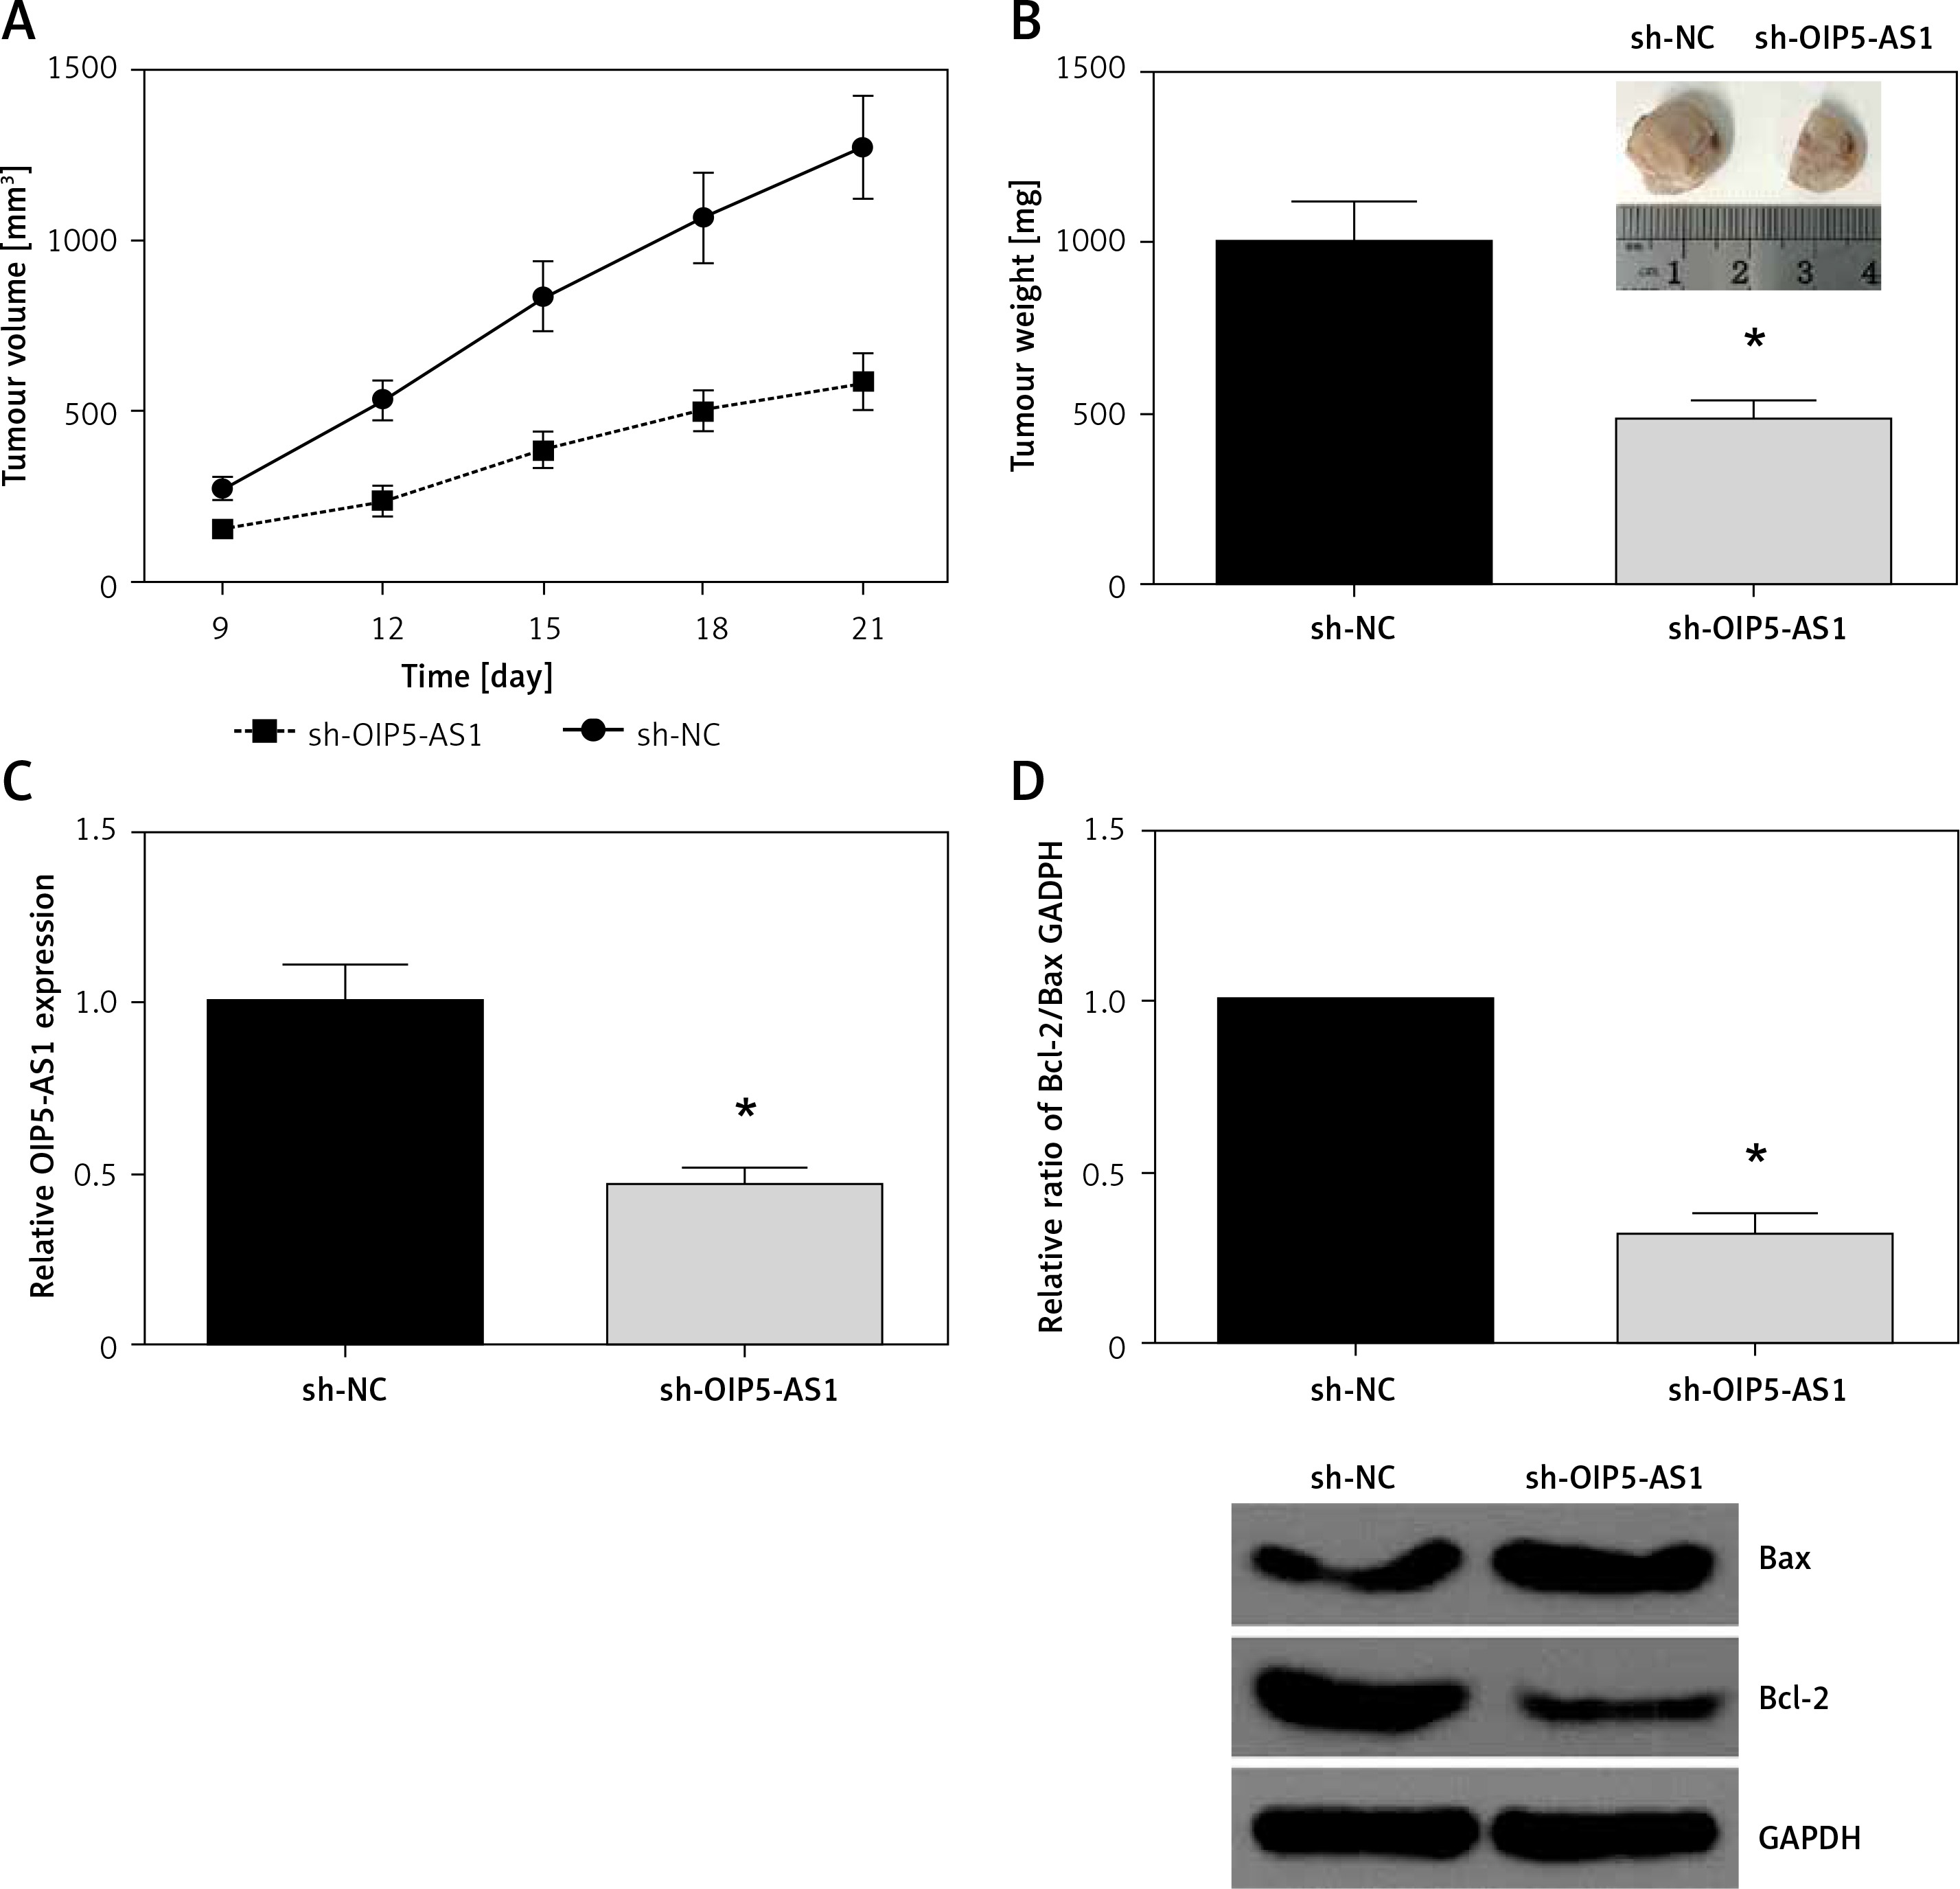
To further examine the oncogenic role of OIP5-AS1 in vivo, a xenograft tumour model was then established. In line with in vitro analysis, we found that OIP5-AS1 knockdown remarkably reduced the volume and weight of xenograft tumours (Figures 3 A, B). As confirmed by RT-qPCR analysis, OIP5-AS1 expression was significantly decreased in the tumours formed by sh-OIP5-AS1-transfected cells (Figure 3 C). We also detected the expression levels of apoptosis-associated proteins by western blot analysis, and we found that OIP5-AS1 knockdown increased Bax expression and decreased Bcl-2 expression in the xenograft tissues (Figure 3 D).
Figure 3
Knockdown of OIP5-AS1 inhibits GC tumour growth in vivo. A – Tumour volumes were measured every 3 days, and growth curves of tumours were plotted. B – The average weights of tumours were measured. C – The expression levels of OIP5-AS1 in the tumour tissues were examined by RT-qPCR analysis. D – The expression levels of Bax and Bcl-2 in the tumour tissues were detected by western blot analysis
*p < 0.05 vs. sh-NC group.
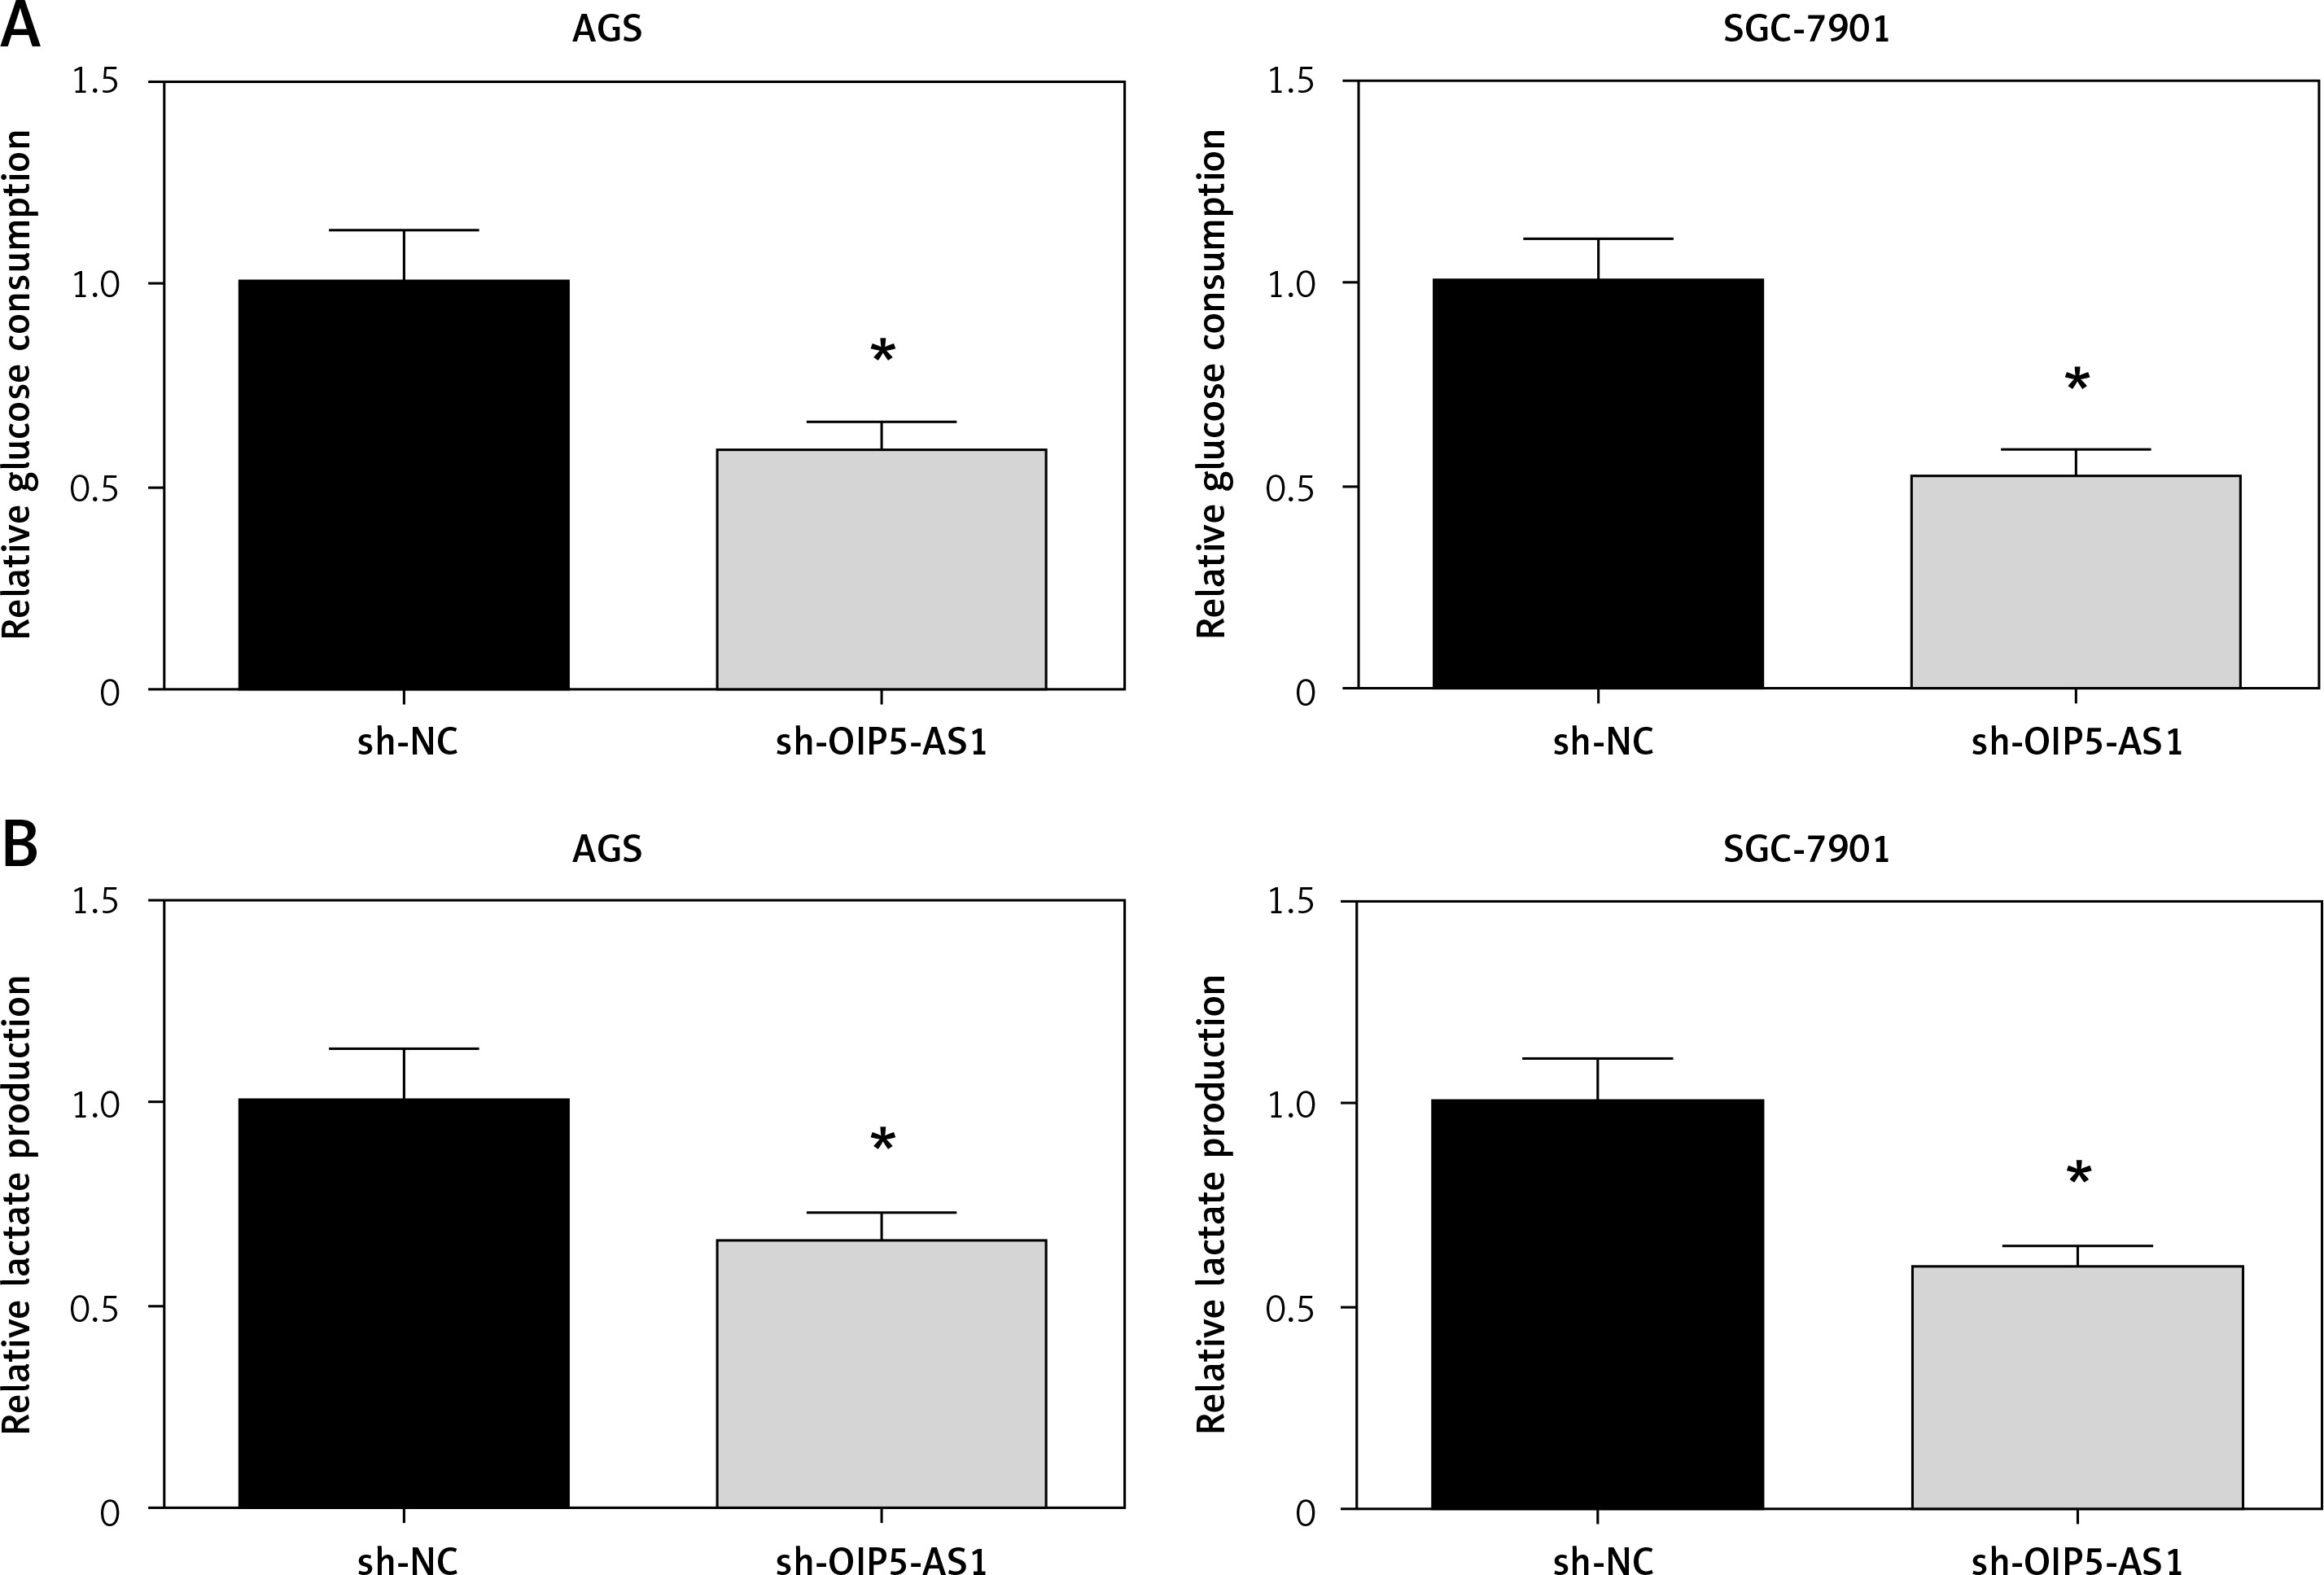
Knockdown of OIP5-AS1 suppresses aerobic glycolysis in gastric cancer cells
Aerobic glycolysis is one of the characteristic phenotypes of cancer cells [11]. As demonstrated in Figures 4 A, B, the glycolytic markers, including glucose consumption and lactate production, were all reduced when OIP5-AS1 was knocked down in AGS and SGC-7901 cells.
OIP5-AS1 acts as a ceRNA for miR-186 in gastric cancer cells
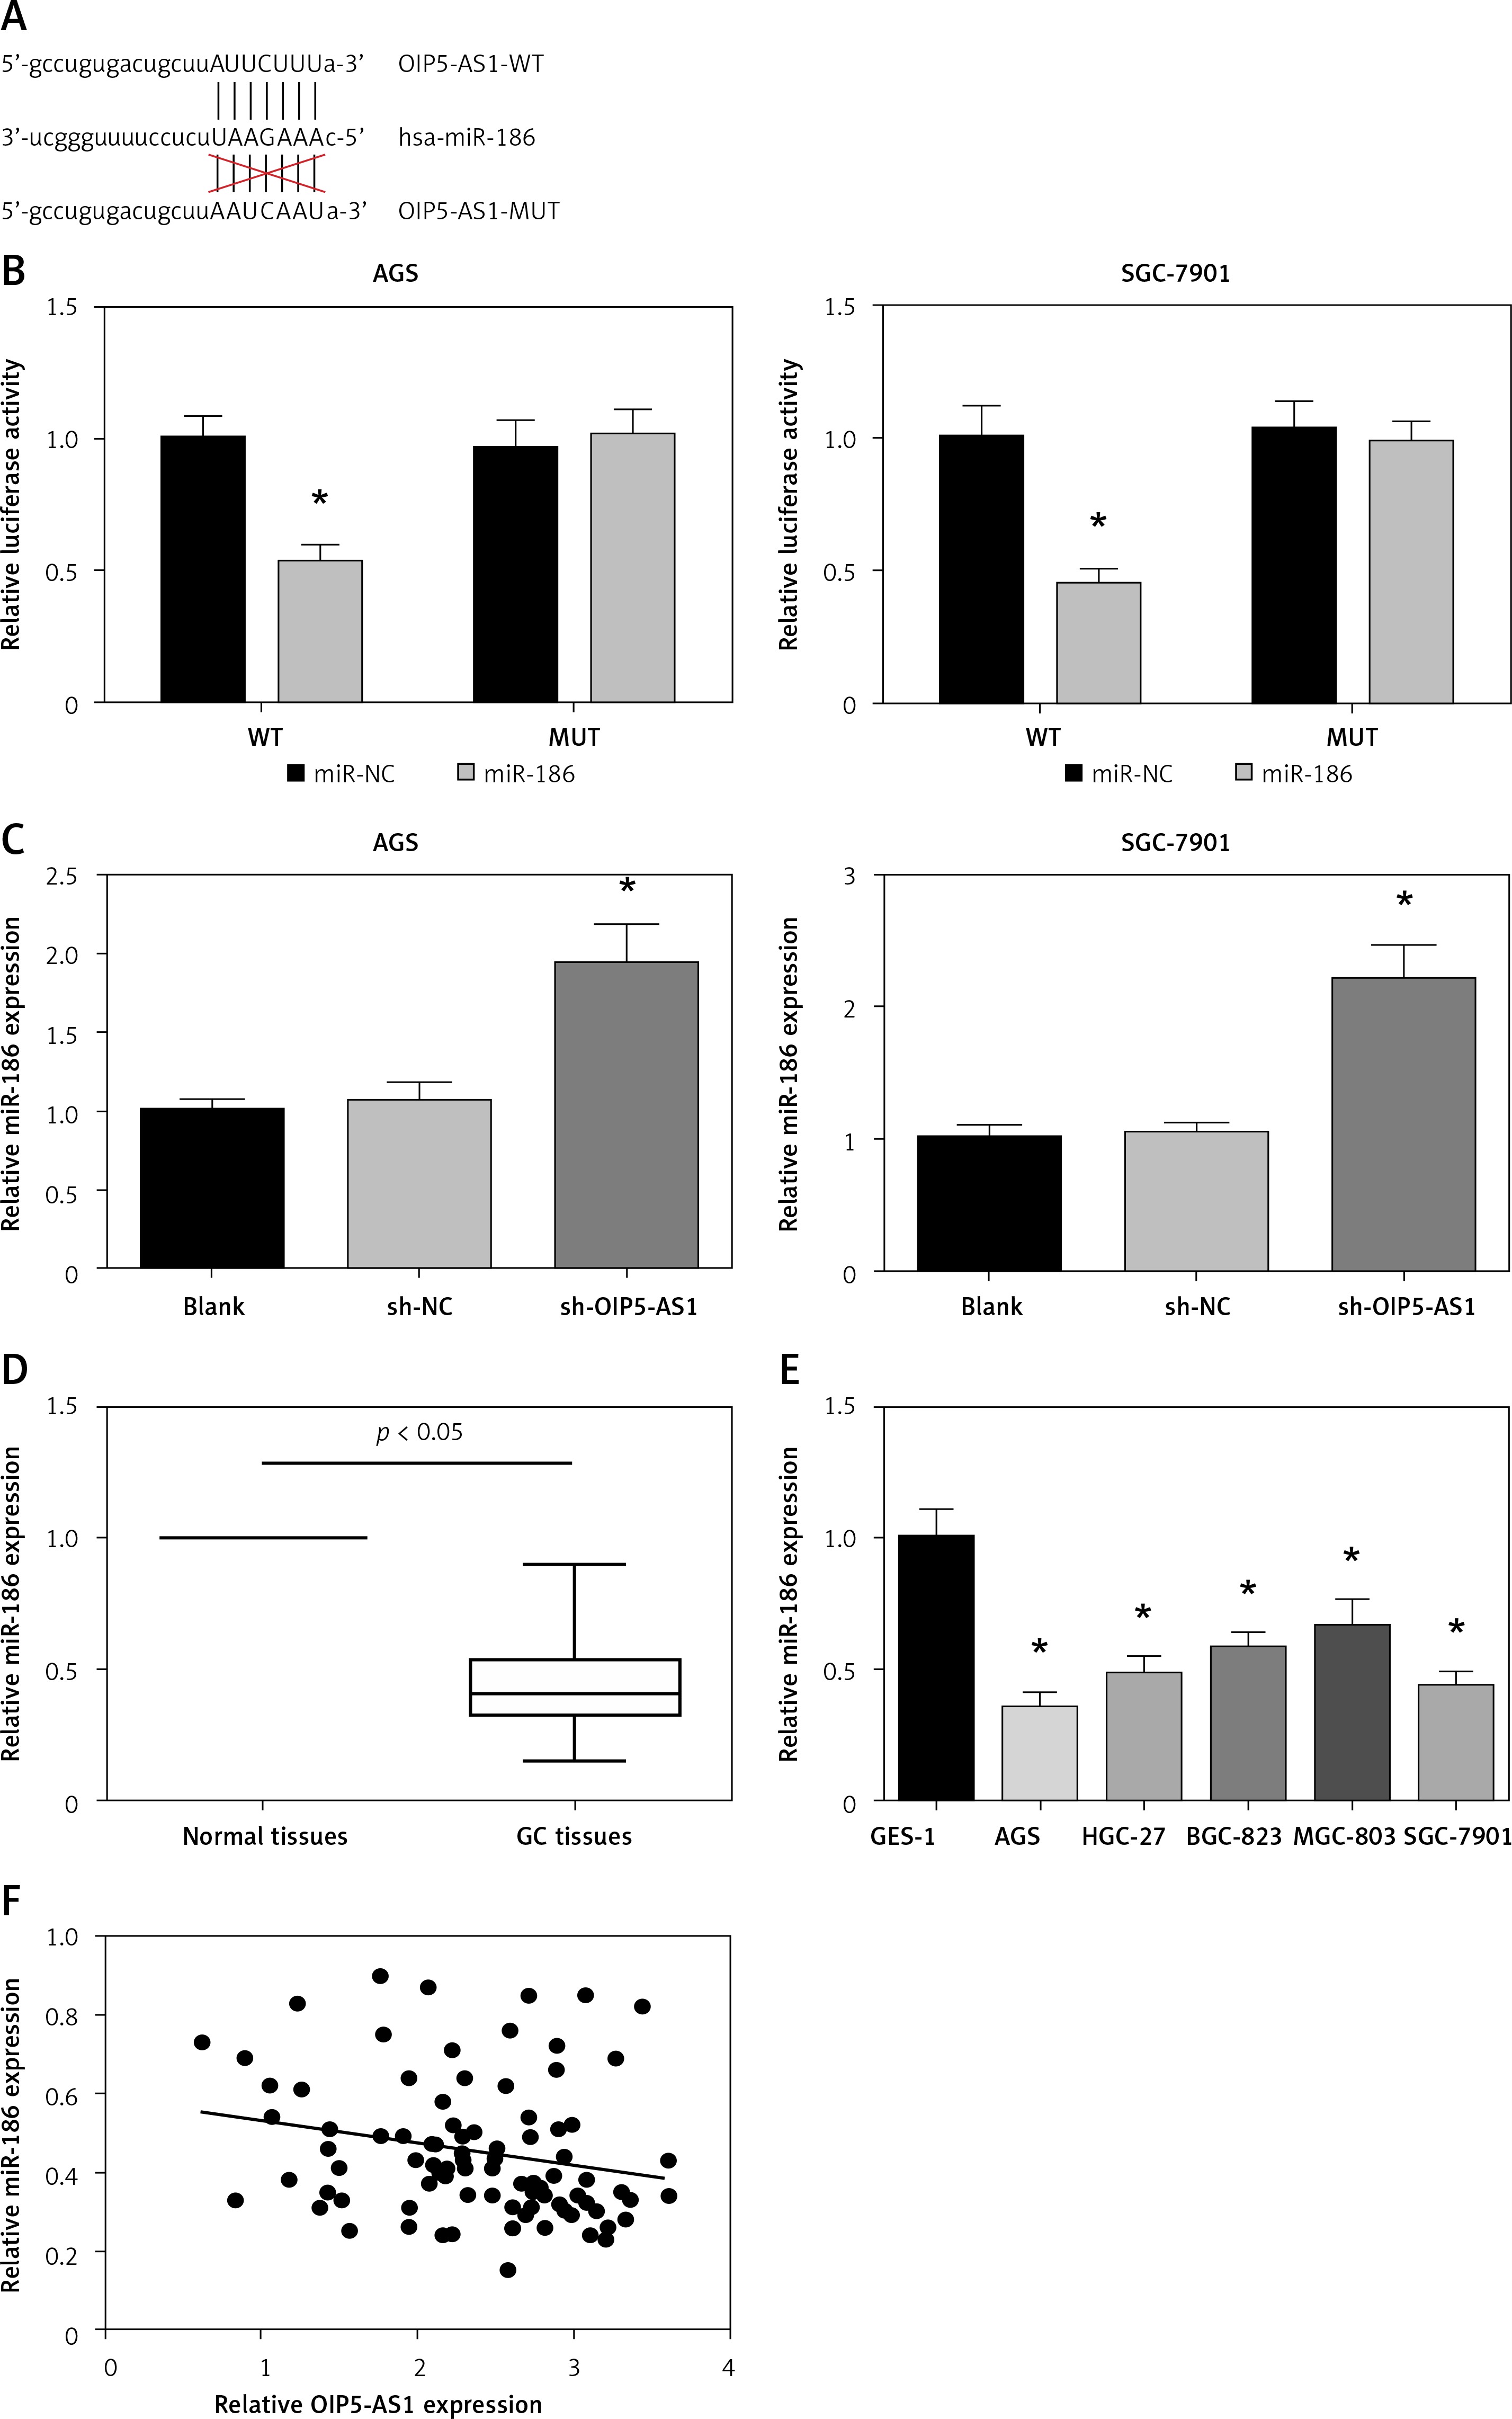
Next, we investigated the mechanisms underlying the role of OIP5-AS1. Through starBase v3.0 (http://starbase.sysu.edu.cn/), we found that miR-186 contains a binding site for OIP5-AS1 (Figure 5 A). We further performed dual luciferase reporter assay, and the results indicated that co-transfection with miR-186 mimics markedly inhibited the luciferase activity of OIP5-AS1-WT but not that of OIP5-AS1-MUT in both AGS and SGC-7901 cells (Figure 5 B). Also, as shown in Figure 5 C, knockdown of OIP5-AS1 remarkably increased miR-186 expression in AGS and SGC-7901 cells. We also observed that miR-186 was downregulated in GC tissues and cell lines (Figures 5 D, E). Moreover, as demonstrated in Figure 5 F, the expression of OIP5-AS1 and miR-186 showed a significantly negative correlation in GC tissues (p = 0.037).
Figure 5
OIP5-AS1 acts as a ceRNA for miR-186 in GC cells. A – Bioinformatical predication of interaction between OIP5-AS1 and miR-186. B – Dual luciferase reporter assay showed that miR-186 mimics reduced the luciferase activity of OIP5-AS1-WT in AGS and SGC-7901 cells. C – The expression levels of miR-186 in AGS and SGC-7901 cells after transfection were examined by RT-qPCR analysis. *p < 0.05 vs. sh-NC-transfected cells. D – The expression levels of miR-186 in GC tissues and adjacent nontumour tissues were examined by RT-qPCR analysis. E – The expression levels of miR-186 in five GC cell lines and normal human gastric mucosa cells GES-1 were examined by RT-qPCR analysis. *p < 0.05 vs. GES-1 cells. F – Pearson correlation analysis between OIP5-AS1 and miR-186 expression levels in GC tissues
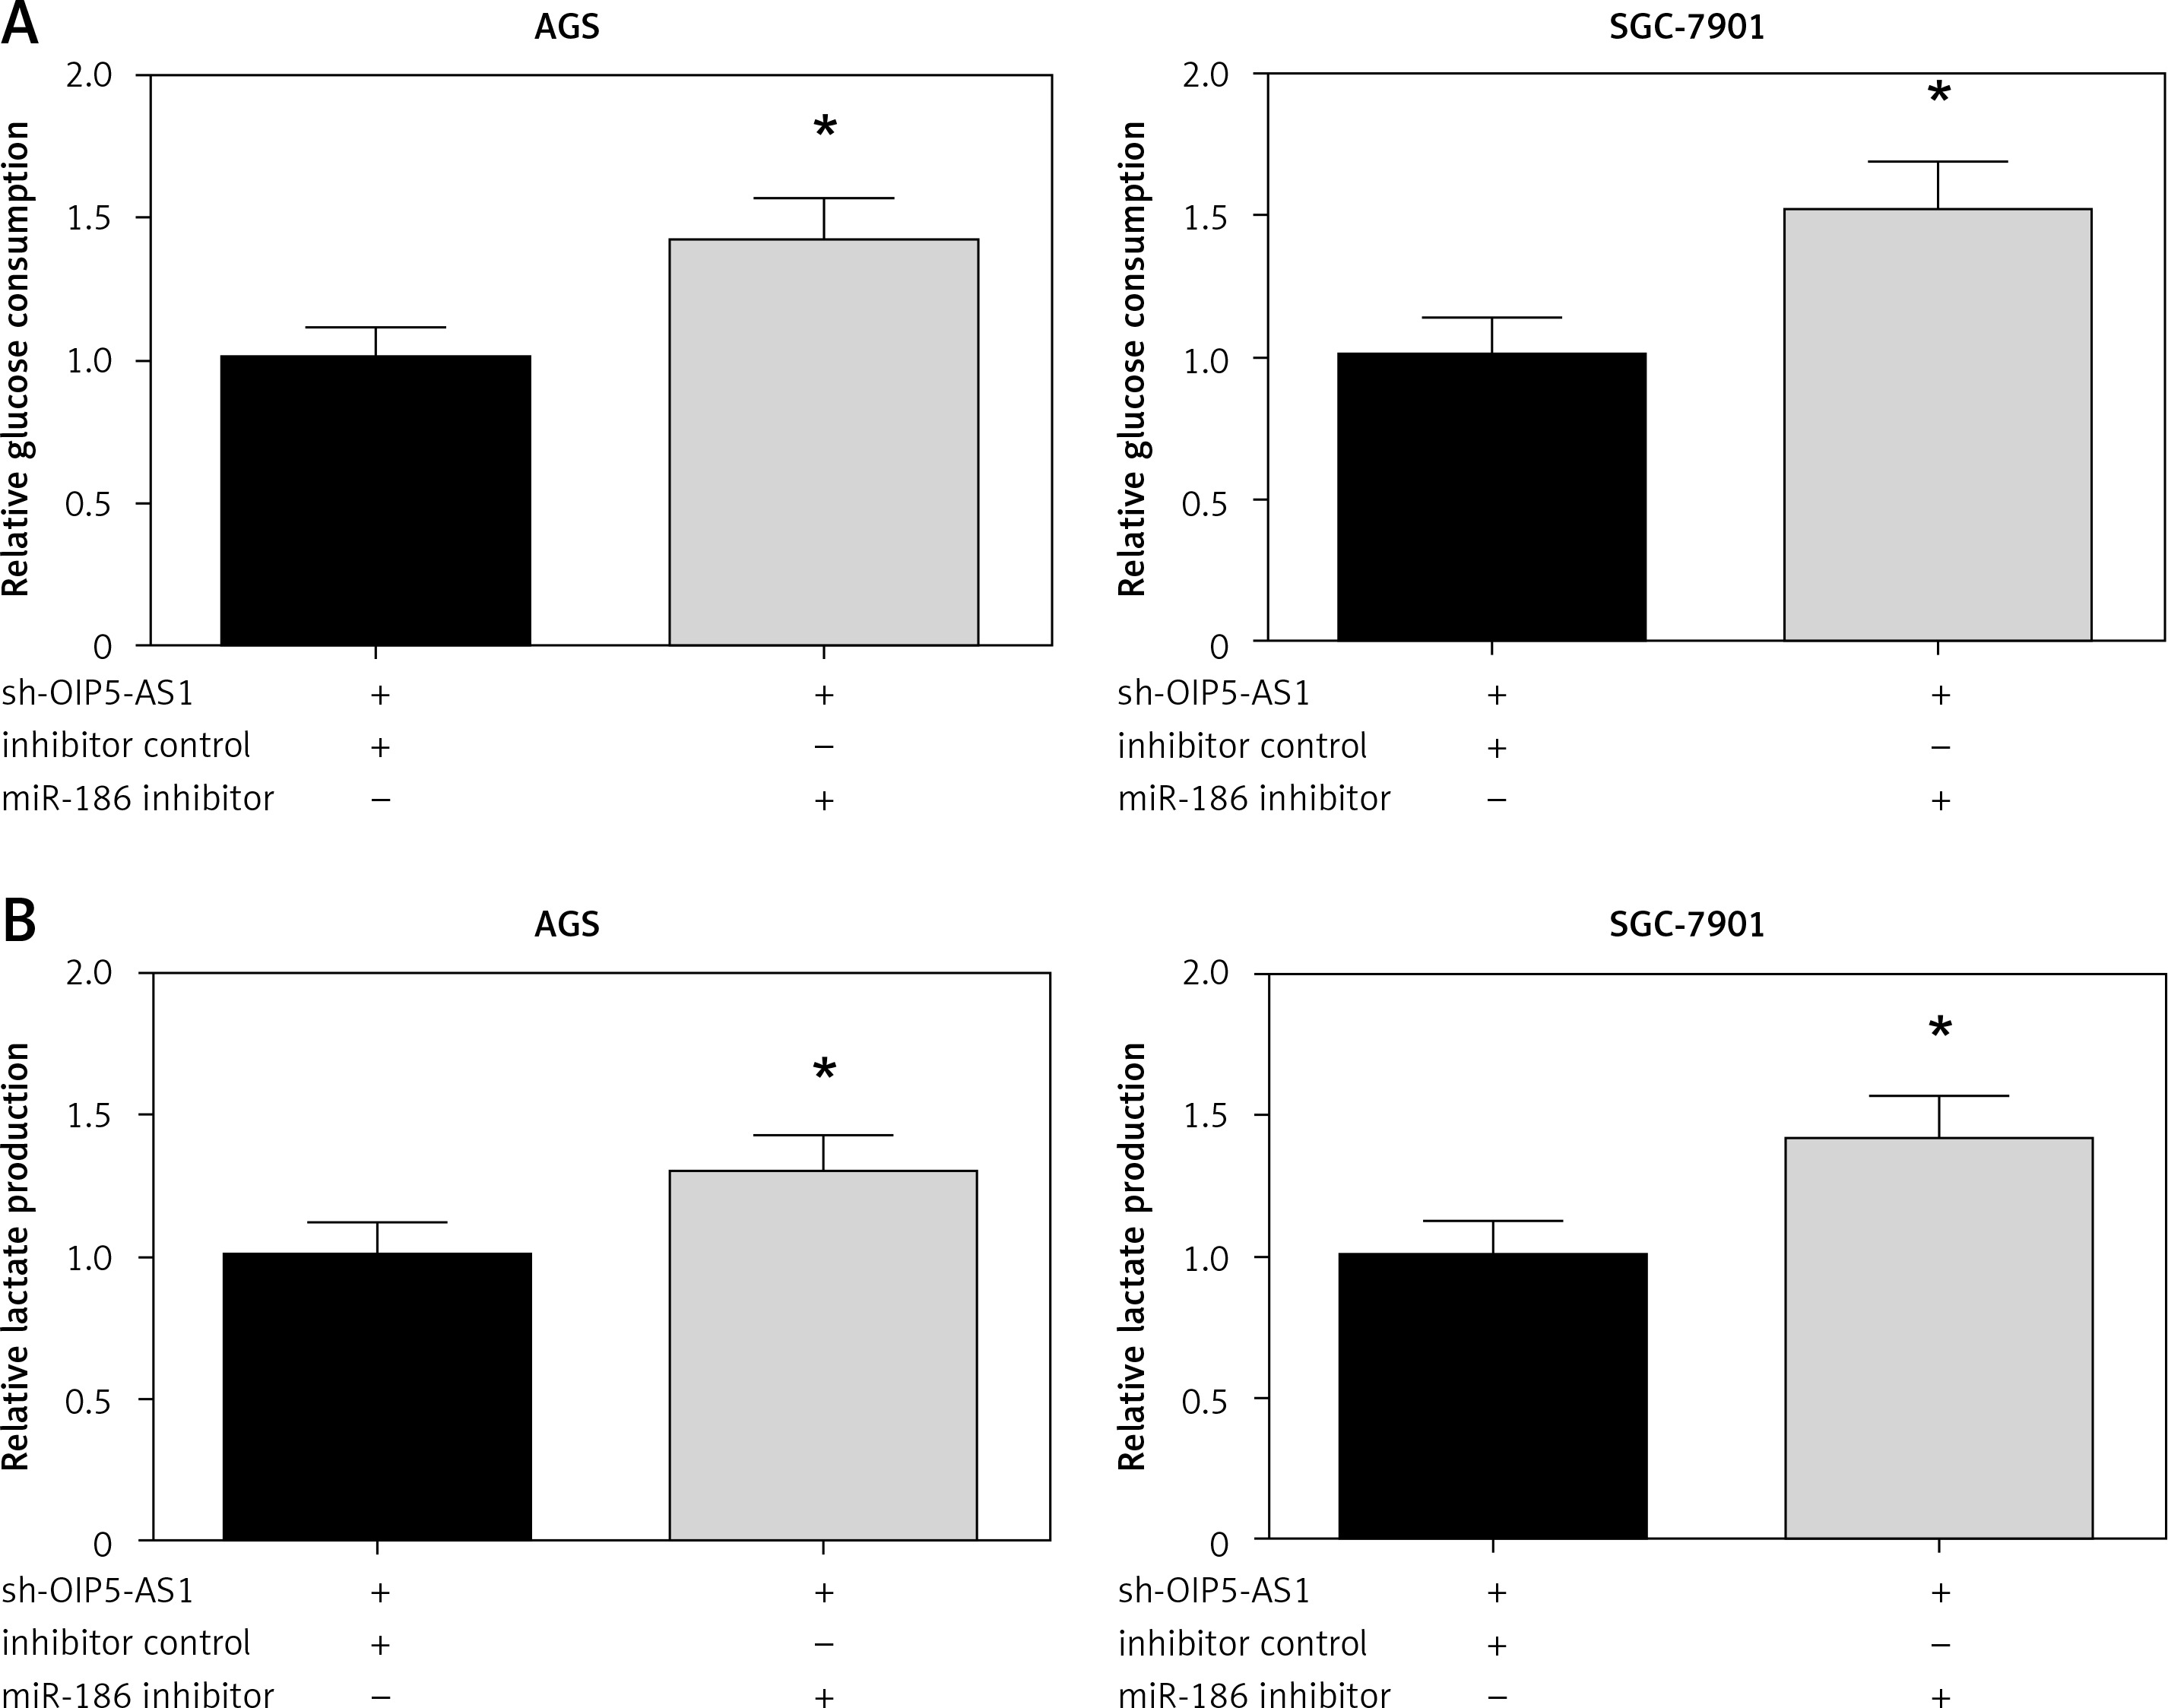
Inhibition of miR-186 attenuates the effect of OIP5-AS1 knockdown on aerobic glycolysis in gastric cancer cells
We then validated the role of miR-186 in aerobic glycolysis of GC cells. The results demonstrated that co-transfection with miR-186 inhibitor remarkably restored the impaired glucose consumption and lactate production in AGS and SGC-7901 cells with OIP5-AS1 knockdown (Figures 6 A, B).
Discussion
Gastric cancer is a major threat to human health, and lncRNAs are important players in GC initiation and development [12]. For example, lncRNA CCAT1 was overexpressed in GC tissue samples compared to adjacent normal tissue samples [13], and lncRNA AFAP1-AS1 promotes the proliferation, migration, and invasion of GC cells [14]. In the present study, high expression of OIP5-AS1 in GC tissues and cell lines indicated that OIP5-AS1 might be an oncogene in GC. To further investigate the effects of OIP5-AS1 on GC cell phenotypes, OIP5-AS1 was knocked down in AGS and SGC-7901 cells, and we observed that OIP5-AS1 knockdown significantly inhibited GC cell proliferation and promoted GC cell apoptosis. In line with these findings in vitro, animal experimental study also validated the growth-inhibiting role of OIP5-AS1 knockdown.
The competing endogenous RNA (ceRNA) hypothesis is gaining attention for revealing the regulatory role of lncRNAs in GC [15, 16]. MicroRNAs (miRNAs), a class of small non-coding RNAs, also play a pivotal role in cancer biology [17], and lncRNAs may function as a ceRNA to bind to miRNAs and negatively modulate their functions. In lung cancer, OIP5-AS1 functions as a ceRNA of miR-378a-3p [7]. This study identified miR-186 as a direct target of OIP5-AS1 by bioinformatic prediction based on sequence complementarity. The miR-186 was previously reported to be down-regulated in GC [18], and many lncRNAs, including PVT1 and ANRIL, play oncogenic roles through interaction with miR-186 [19, 20]. Here, we also observed that an inverse correlation existed between OIP5-AS1 and miR-186 expression in GC tissues. The interaction between lncRNAs and miRNAs provides new insights to elucidate the underlying mechanisms underlying GC progression.
Aerobic glycolysis, also termed the Warburg effect, is one of main metabolic characteristics of tumour cells, which is highlighted by the consumption of more glucose and the production of more lactate compared with normal cells, and therefore targeting aerobic glycolysis is a potential anticancer strategy [21, 22]. As indicated in our results, knockdown of OIP5-AS1 inhibited the glucose consumption and lactate production in GC cells. Liu et al. previously reported that overexpressed miR-186 inhibited aerobic glycolysis in GC cells [23], and consistently in this study we also found that miR-186 inhibition reversed the impaired aerobic glycolysis induced by OIP5-AS1 knockdown in GC cells. These findings clearly certified that OIP5-AS1 promotes aerobic glycolysis in GC cells partly through a manner found in ceRNA of miR-186.
In conclusion, the present study provided the first evidence that OIP5-AS1 was upregulated in GC tissues and cell lines. Moreover, knockdown of OIP5-AS1 inhibited GC cell proliferation in vitro and GC tumour growth in vivo. We further found that OIP5-AS1 might act as a ceRNA of miR-186, and the OIP5-AS1/miR-186 axis regulates aerobic glycolysis in GC cells. Our results indicate that OIP5-AS1 might serve as a potential therapeutic target for the treatment of GC.