Introduction
Gastric cancer (GC) is a substantial global health concern, ranking fifth in incidence and fourth in mortality on a global scale [1]. In mainland China, many patients are diagnosed at advanced stages due to inadequate screening rates and mild symptoms, resulting in missed opportunities for surgery and diminished prognoses [2]. The existing treatment approaches for GC predominantly depend on TNM staging, which includes surgical resection or gastrectomy for resectable cases, with the possibility of adjuvant chemo/radiotherapy based on the staging [3].
The advent of immune checkpoint inhibitors (ICIs) targeting the PD-1/PD-L1 axis has revolutionized cancer therapy by restoring anti-tumor immunity [4, 5]. Multiple PD-1/PD-L1 inhibitors (including nivolumab, pembrolizumab, and sintilimab) have received regulatory approval across various malignancies, including gastroesophageal cancers [6]. However, significant interpatient variability in treatment responses persists, creating an urgent need for reliable predictive biomarkers capable of reflecting real-time changes in tumor-immune interactions during treatment. Circulating cytokines, as dynamic indicators of immune activity, could bridge this gap by capturing biological responses earlier than traditional methods. The PD-1/PD-L1 interaction normally suppresses T-cell activity, enabling tumor immune evasion [7], and while PD-L1 expression remains the primary predictive biomarker for immunotherapy response [8], its limitations are well recognized. Despite FDA approvals for several PD-1 inhibitors in advanced gastric cancer (AGC) [9–11], response rates remain suboptimal (approximately 40–60% even in PD-L1-positive cases), highlighting the insufficiency of PD-L1 testing alone. Current clinical monitoring relies on imperfect tools including tumor markers, radiographic imaging, and tissue-based immune marker analysis [12–14], underscoring the need for more robust assessment methods.
Peripheral blood biomarkers offer distinct advantages due to their minimally invasive nature and capacity for serial monitoring [15]. Among potential candidates, cytokines have emerged as particularly promising predictors given their established roles in modulating tumor immunity [16–20] and the GC microenvironment [21–23]. These small signaling proteins influence critical processes including immune cell recruitment, angiogenesis, and metastatic progression through receptor-mediated effects [21–23]. However, the predictive value of cytokine dynamics during PD-1 blockade in GC remains insufficiently characterized [24, 25].
This investigation sought to characterize the predictive potential of cytokine dynamics in AGC patients undergoing PD-1 inhibitor-based immunochemotherapy. Building on established evidence of cytokine-mediated immune regulation, we aimed to determine whether baseline cytokine levels could stratify patients by treatment response likelihood, while assessing how cytokine changes might correlate with therapeutic efficacy. Furthermore, we sought to evaluate whether comprehensive cytokine profiling could outperform conventional biomarkers in predicting clinical outcomes. Through systematic evaluation of these cytokine-response relationships, this study endeavors to establish a clinically actionable approach for monitoring immunochemotherapy response, potentially enabling earlier treatment adaptations and improved patient management through minimally invasive blood-based assessment.
Material and methods
Patient characteristics
This study evaluated a cohort of 241 patients diagnosed with AGC from August 2023 to September 2024 at the Affiliated Hospital of Jiangsu University. The investigation involved a comparative analysis between two distinct treatment groups. The experimental group consisted of 136 patients who received a combination of immunochemotherapy integrating chemotherapy with anti-PD-1 monoclonal antibody (mAb) treatment. In contrast, the control group included 105 AGC patients who underwent chemotherapy alone (Table I).
Table I
Clinical characteristics of patients
Strict inclusion criteria were implemented, including:
American Joint Committee on Cancer’s GC staging guidelines; AGC is classified as stage III/IV clinically.
Eligibility required patients to have undergone immunochemotherapy, with an expected survival prognosis of over 3 months.
Patients were evaluated based on their Eastern Cooperative Oncology Group (ECOG) performance status scores, considering only scores ranging from 0 to 2 points, in accordance with the guideline reference provided [26].
Thorough evaluations, such as blood analyses, liver and kidney function assessments, and electrocardiograms, were performed to ensure patients’ eligibility for the study. The evaluation results needed to fall within normal ranges or show minimal deviations without any indications of organ issues.
The research was carried out with the approval of the Ethics Committee of Jiangsu University’s Affiliated Hospital, and informed consent was obtained from all participants prior to their inclusion.
Chemotherapy and immunochemotherapy regimens
The patients underwent a 21-day treatment course consisting of chemotherapy and anti-PD-1 monoclonal antibodies (mAbs). Intravenous injections of different anti-PD-1 mAb replacements, including 200 mg of sintilimab, 200 mg of camrelizumab, and 200 mg of nivolumab, were administered on the first day of each treatment cycle. The chemotherapy regimens included the following procedures:
Oxaliplatin and capecitabine: An intravenous dose of 130 mg/m2 of oxaliplatin was given on the first day of the cycle, along with an oral dose of 1,000 mg/m2 of capecitabine taken twice daily for 14 days starting on the first day.
Oxaliplatin and tegafur: On the first day of the cycle, an intravenous dose of 130 mg/m2 of oxaliplatin was administered along with oral tegafur for 14 days, with a daily dose of 40 mg/m2 requiring two tablets.
Albumin-bound paclitaxel and tegafur: An intravenous dose of albumin-bound paclitaxel (120 mg/m2) was given on the first and eighth days of the cycle in combination with oral tegafur, which was taken twice daily for 14 days at a dosage of 40 mg/m2 starting from the first day of treatment.
Blood sample collection
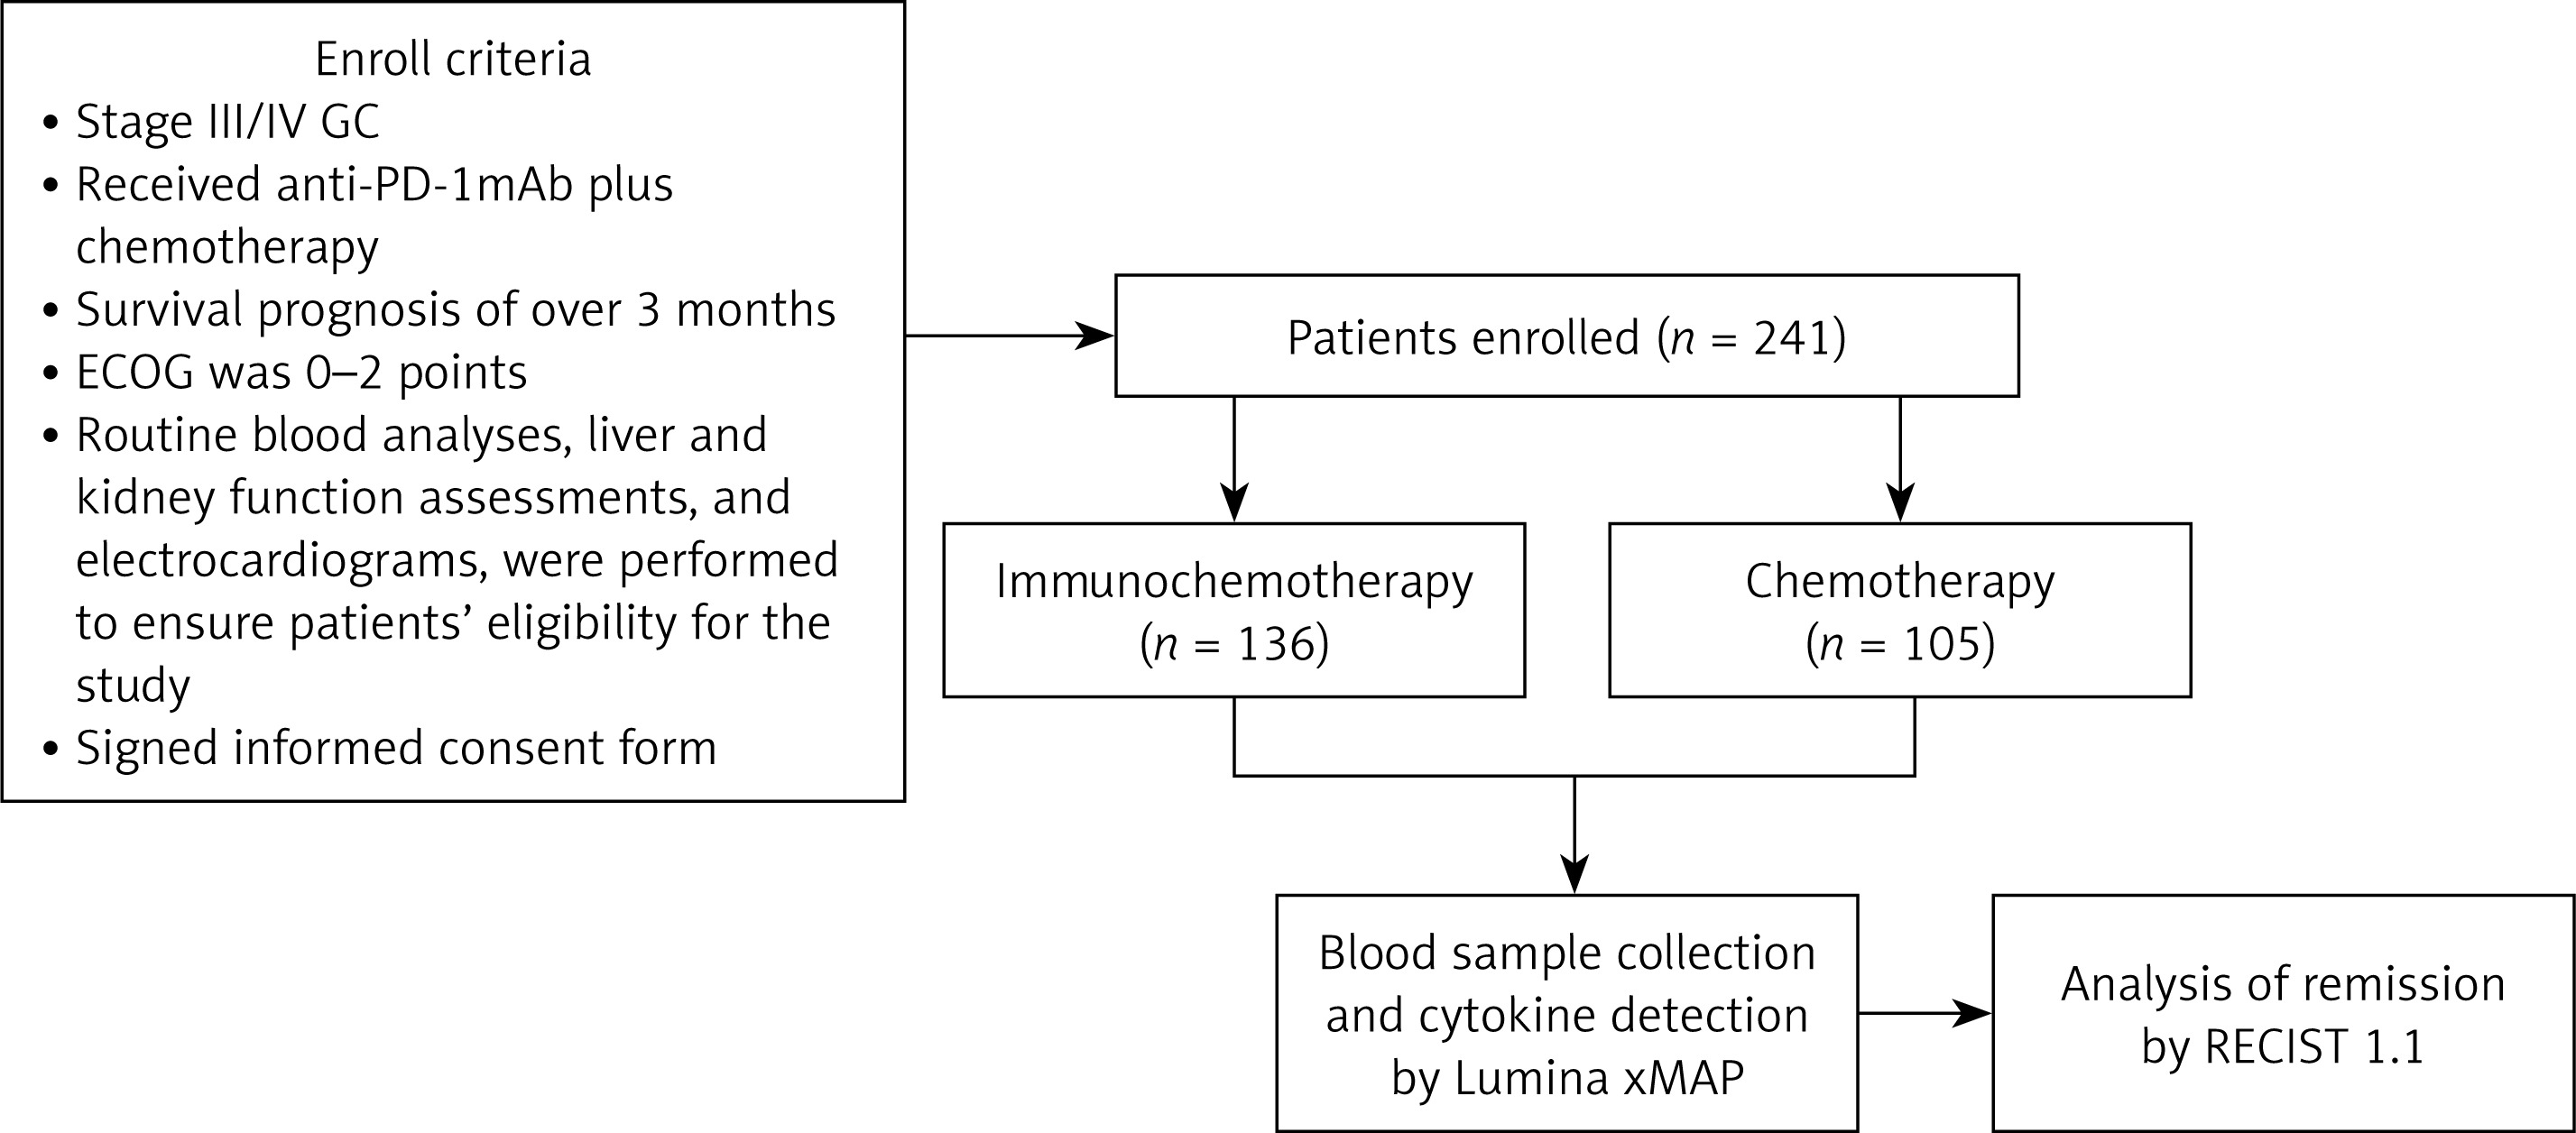
Patients’ blood samples were collected via venipuncture using serum separator tubes to isolate serum components. The collected samples were then centrifuged at 3,000g for 10 min to separate the serum from other blood components. The serum was divided into smaller aliquots and stored at –80°C until further immunoassay analysis. Precautions were taken to avoid repeated freeze-thaw cycles, as they could impact sample integrity and the accuracy of subsequent analyses. A schematic representation of the experimental approach is shown in Figure 1.
Serum cytokine detection
Cytokine analysis was performed using the Luminex xMAP platform (Luminex Corporation, Austin, TX, USA) to assess serum samples from all participants. Following the manufacturer’s protocol, we measured multiple cytokines including IL-2, IL-4, IL-5, IL-6, IL-8, IL-10, IL-1β, IL-17A, IFN-α2, IFN-γ, TNF-α, and IL-12p70. To ensure accuracy, all assays were carefully executed according to the established guidelines. For each test, we combined 25 µl of serum with 75 µl of prepared solution containing assay buffer, premixed magnetic beads, and detection antibodies targeting the specified cytokines. The mixture underwent continuous agitation (400–500 rpm) for 2 h at room temperature (25°C). Following this incubation, we added 25 µl of Streptavidin-PE to each reaction tube and continued shaking under the same conditions for an additional 30 min. The samples then underwent a washing procedure: 500 µl of 1X wash buffer was added, followed by centrifugation (300–500 × g, 5 min) and supernatant removal. The remaining pellet was resuspended in 100 µl of fresh wash buffer using 30 s of vortex mixing. Final fluorescence readings were obtained using the Luminex MAGPIX instrument with xPONENT analysis software.
Analysis of remission
In order to assess the effectiveness of the treatment, patients with measurable lesions were evaluated using the Response Evaluation Criteria in Solid Tumors version 1.1 (RECIST 1.1) guidelines [27]. A complete response (CR) was described as the disappearance of all target lesions, while a partial response (PR) was defined as a reduction of more than 30% in the total number of target lesions. On the other hand, an increase of over 20% in the total number of target lesions indicated progressive disease (PD), and a decrease of less than 30% or an increase of less than 20% suggested stable disease (SD).
Statistical analysis
Statistical analysis and graph creation were conducted using GraphPad Prism 10 (GraphPad Software Inc.). The nonparametric Mann-Whitney U test was employed for group comparisons, as this method is particularly well suited for analyzing measurement data that may not conform to a normal distribution. Correlation analyses were performed using the nonparametric Spearman correlation method, which assesses relationships between variables without requiring linearity assumptions. Receiver operating characteristics (ROC) curve analysis was implemented to evaluate the predictive accuracy of diagnostic modalities. Binary logistic regression analysis provided additional insights into variable relationships and predictive values. For statistical comparison of ROC curves, DeLong’s test was applied, offering a robust framework for evaluation. A significance threshold of p < 0.05 was set throughout the analysis, serving as the criterion for determining statistical significance. This approach ensured reliable identification of meaningful patterns and relationships within the data.
Results
Cytokine levels in response and non-response groups after immunochemotherapy and the control group
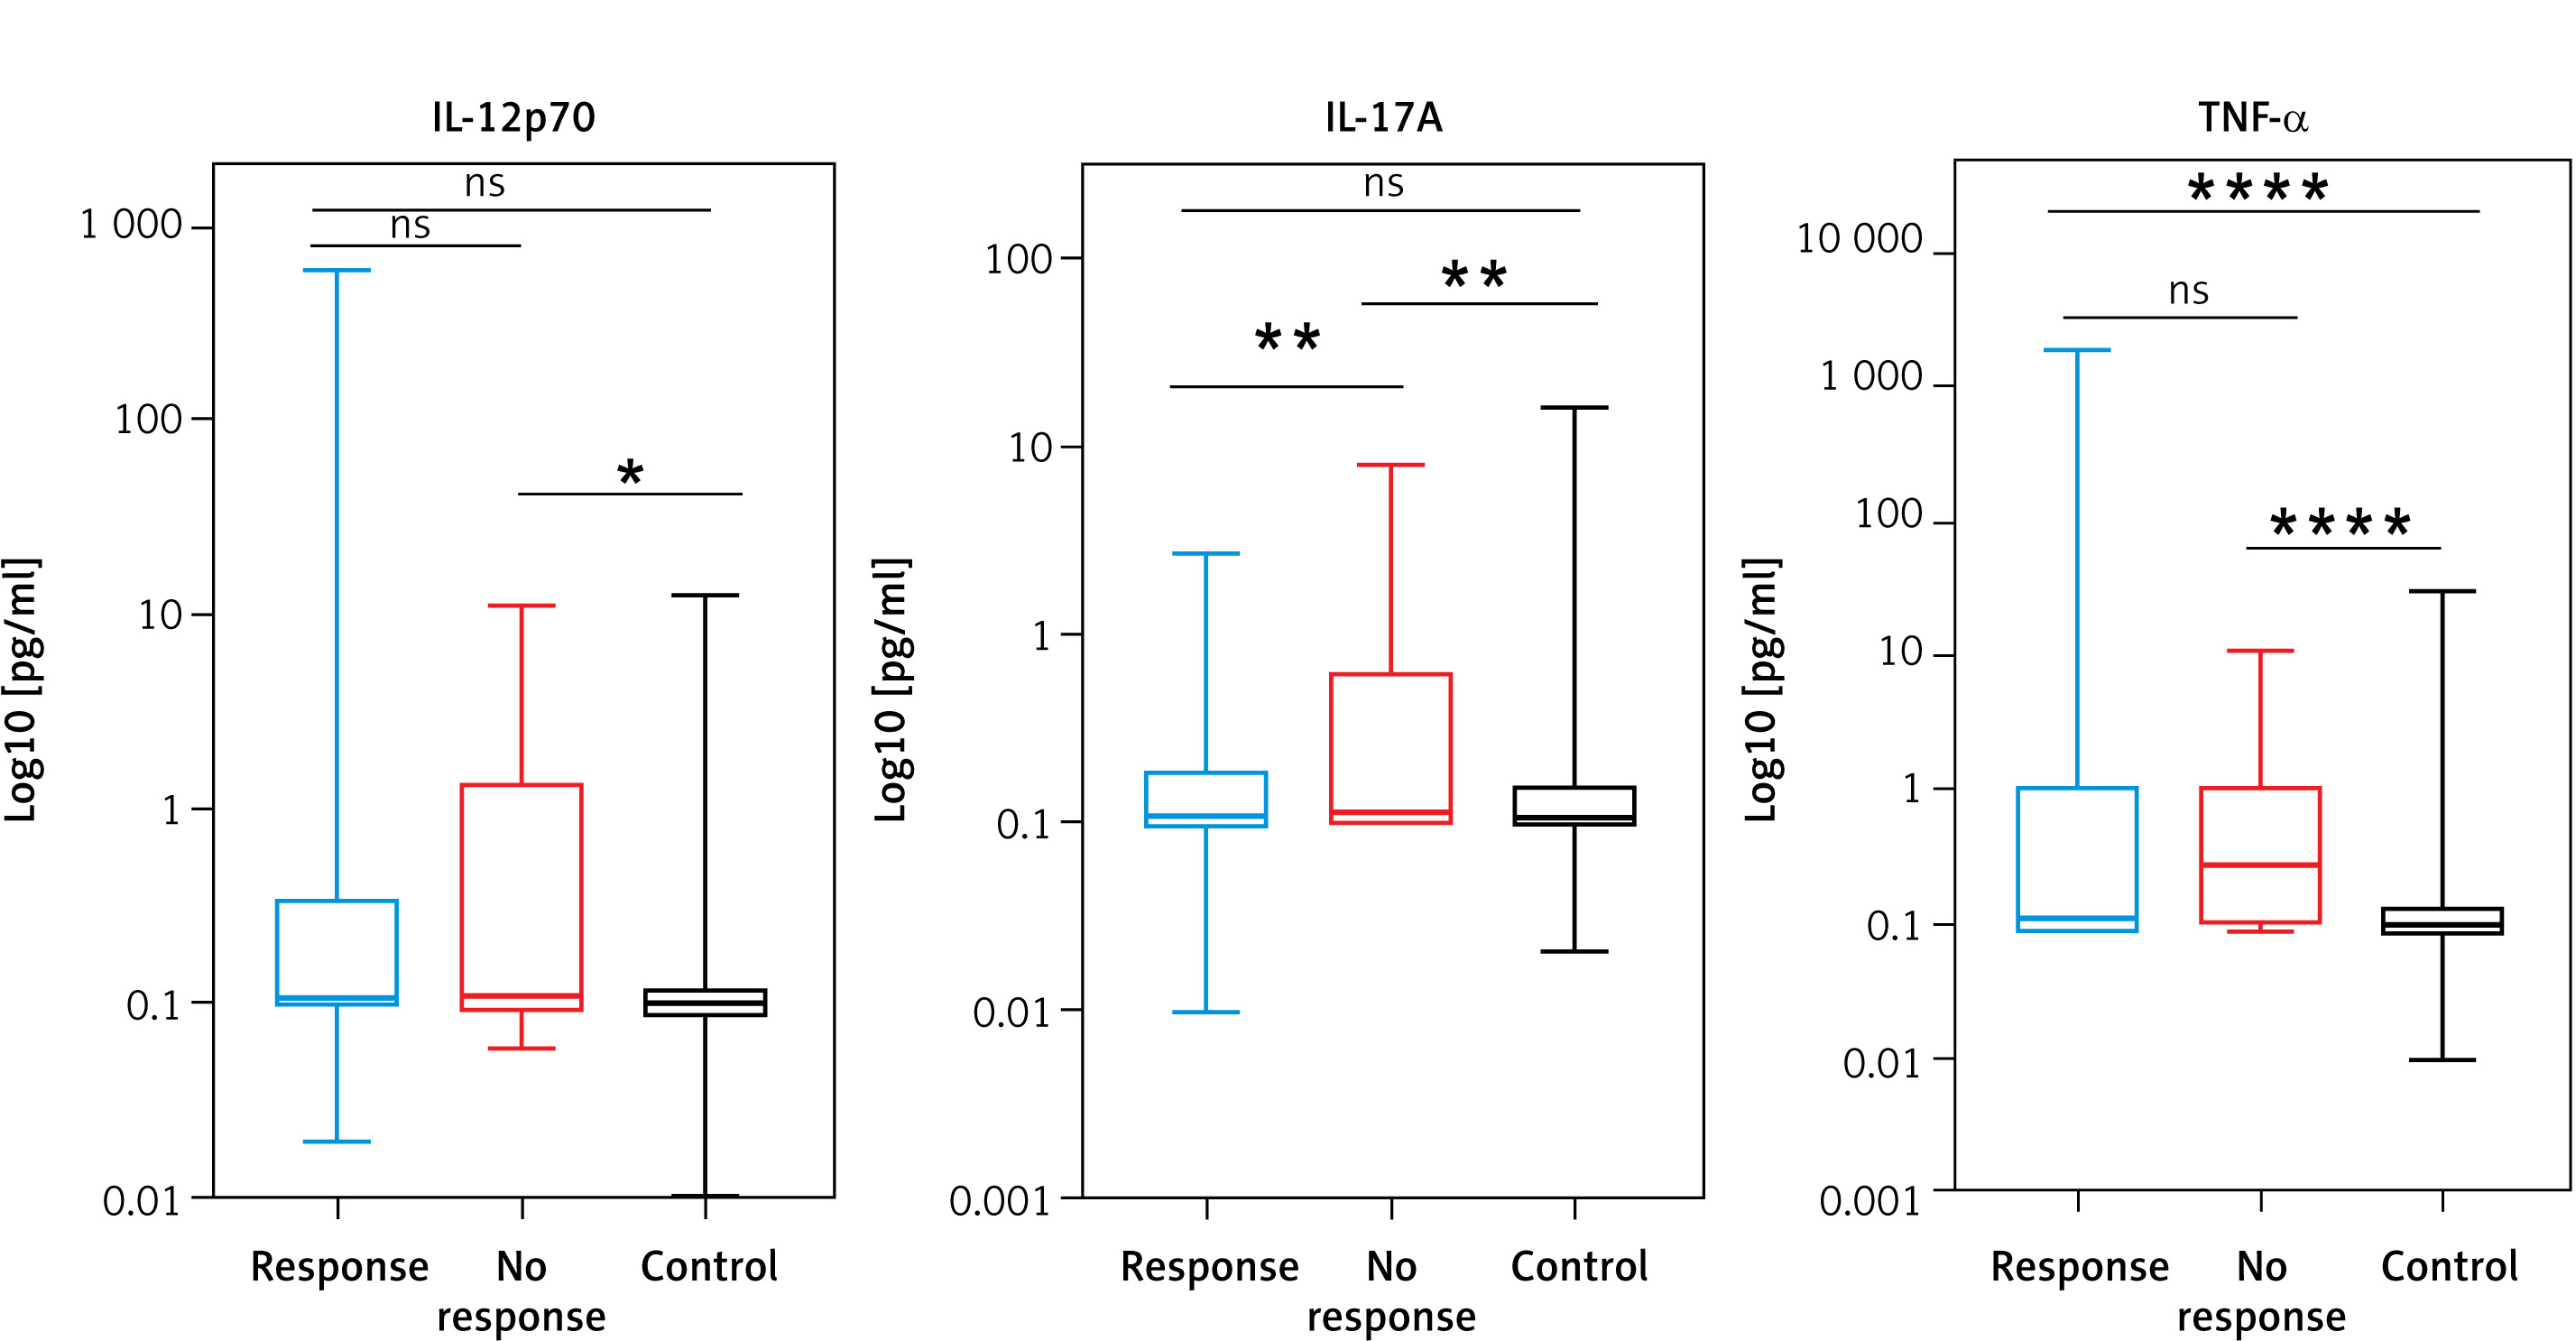
To investigate the impact of PD-1 blockade immunotherapy on cytokine levels, we measured serum cytokine concentrations across 3 patient groups: the control group (n = 105), the response group (n = 97), and the non-response group (n = 39). As illustrated in Figure 2, significant differences were observed in the levels of IL-5, IL-2, IL-8, IL-10, and TNF-α between the control group and the response group (p = 0.0450, p = 0.0090, p = 0.0242, p = 0.0113, and p < 0.0001, respectively), suggesting diminished cytokine levels in AGC patients treated solely with chemotherapy. In contrast, the expression levels of IL-6, IL-4, IL-1β, IL-17A, IFN-α2, IFN-γ, and IL-12p70 showed no significant differences between the control group and the response group (p = 0.1051, p = 0.1634, p = 0.0813, p = 0.9674, p = 0.1401, p = 0.1697, and p = 0.1113). Interestingly, the response group exhibited significantly lower levels of IL-6, IL-8, and IL-17A compared to the non-response group (p = 0.0003, p = 0.0002, and p = 0.0058, respectively). The serum levels of these cytokines were higher in the non-response group. These findings suggest that specific cytokines, such as IL-6, IL-8, and IL-17A, may serve as potential biomarkers for distinguishing between response and non-response to PD-1 blockade immunotherapy. However, no significant variation was found in the levels of IL-2, IL-4, IL-5, IL-10, IL-1β, IFN-α2, IFN-γ, IL-12p70, and TNF-α (p = 0.3209, p = 0.1528, p = 0.0868, p = 0.5881, p = 0.2074, p = 0.9728, p = 0.6535, p = 0.2559, and p = 0.1266, respectively). There was a significant difference between the control group and the non-response group in the expression of IL-2, IL-4, IL-5,IL-6, IL-1β, IL-6, IL-8, IL-17A, and TNF-α (p = 0.0007, p = 0.0095, p = 0.0004, p ≤ 0.0001, p ≤ 0.0001, p = 0.0051, p ≤ 0.0001, p = 0.0065, and p < 0.0001, respectively). However, no significant variations were observed for IL-10, IFN-α2, and IFN-γ (p = 0.1848, p = 0.3085, and p = 0.1848, respectively). These findings suggest that the cytokine profile may differ significantly between control subjects and non-response, indicating potential pathways involved in treatment failure with PD-1 blockade immunotherapy. Overall, the observed patterns in cytokine expression imply that immunochemotherapy facilitates the release of certain cytokines in patients with AGC.
Figure 2
Analyzing serum cytokine levels in AGC patients undergoing control in comparison to immunochemotherapy, divided into response and non-response subgroups. A visual representation using box plots shows discrepancies in cytokine profiles between the control group and individuals in the response group or non-response group. Statistical assessments were performed using the Mann-Whitney U test, with significance set at p < 0.05
Tumor markers in response and non-response groups after immunochemotherapy
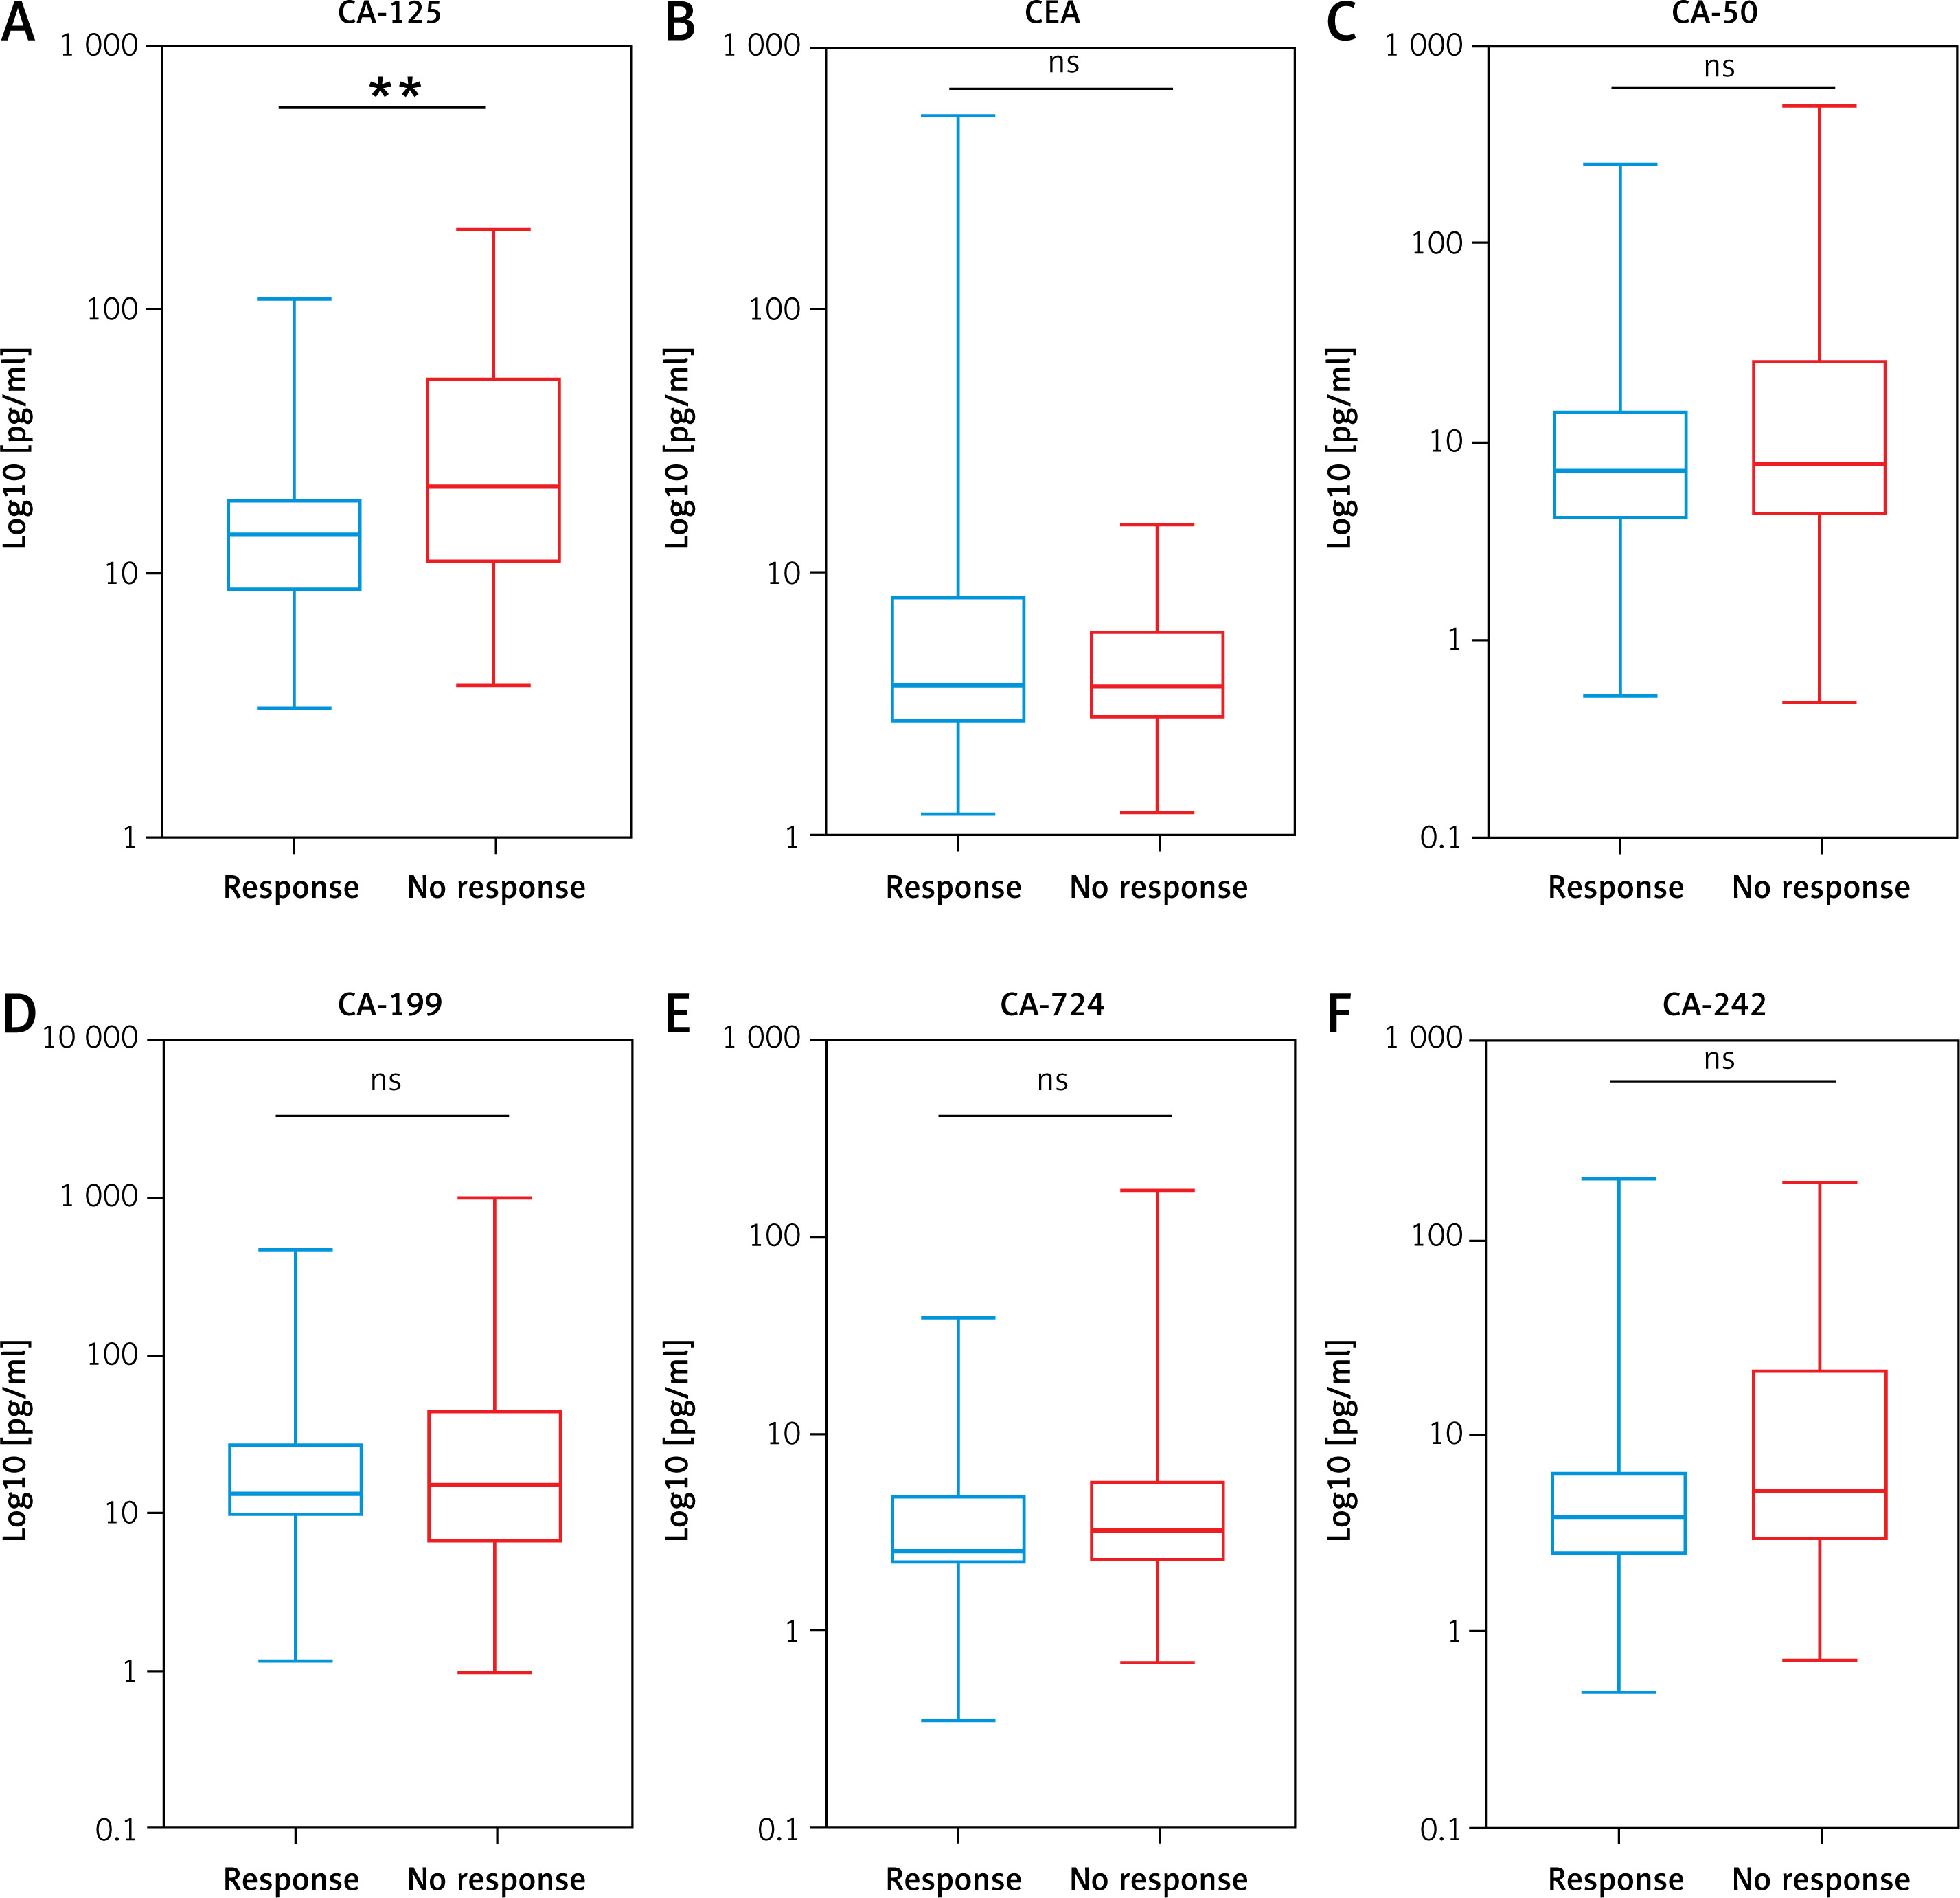
According to the National Cancer Institute (http://www.cancer.gov/dictionary), biomarkers are biological substances present in blood, body fluids, or tissues that indicate normal or abnormal processes, conditions, or diseases. They serve as indicators of how well the body is responding to treatment for a particular illness. In our study, we investigated gastric cancer-related tumor markers across all patients undergoing immunochemotherapy. Our analysis revealed a lower CA-125 level in the response group than the non-response group (p = 0.0092). However, there were no differences between responders and non-responders for other tumor markers, including CEA (p = 0.4178), CA-50 (p = 0.5916), CA-199 (p = 0.9795), CA-724 (p = 0.3758), and CA-242 (p = 0.0927) (Figure 3).
Figure 3
Tumor marker levels in AGC patients after immunochemotherapy, divided into response and non-response groups. A visual representation using box plots shows discrepancies in CA-125 (A), CEA (B), CA-50 (C), CA-199 (D), CA-724 (E), and CA-242 (F) levels between the response group and the non-response group. Statistical assessments were performed using the Mann-Whitney U test, with significance set at p < 0.05
Correlation investigation of tumor markers with blood levels of IL-6, IL-8, and IL-17A
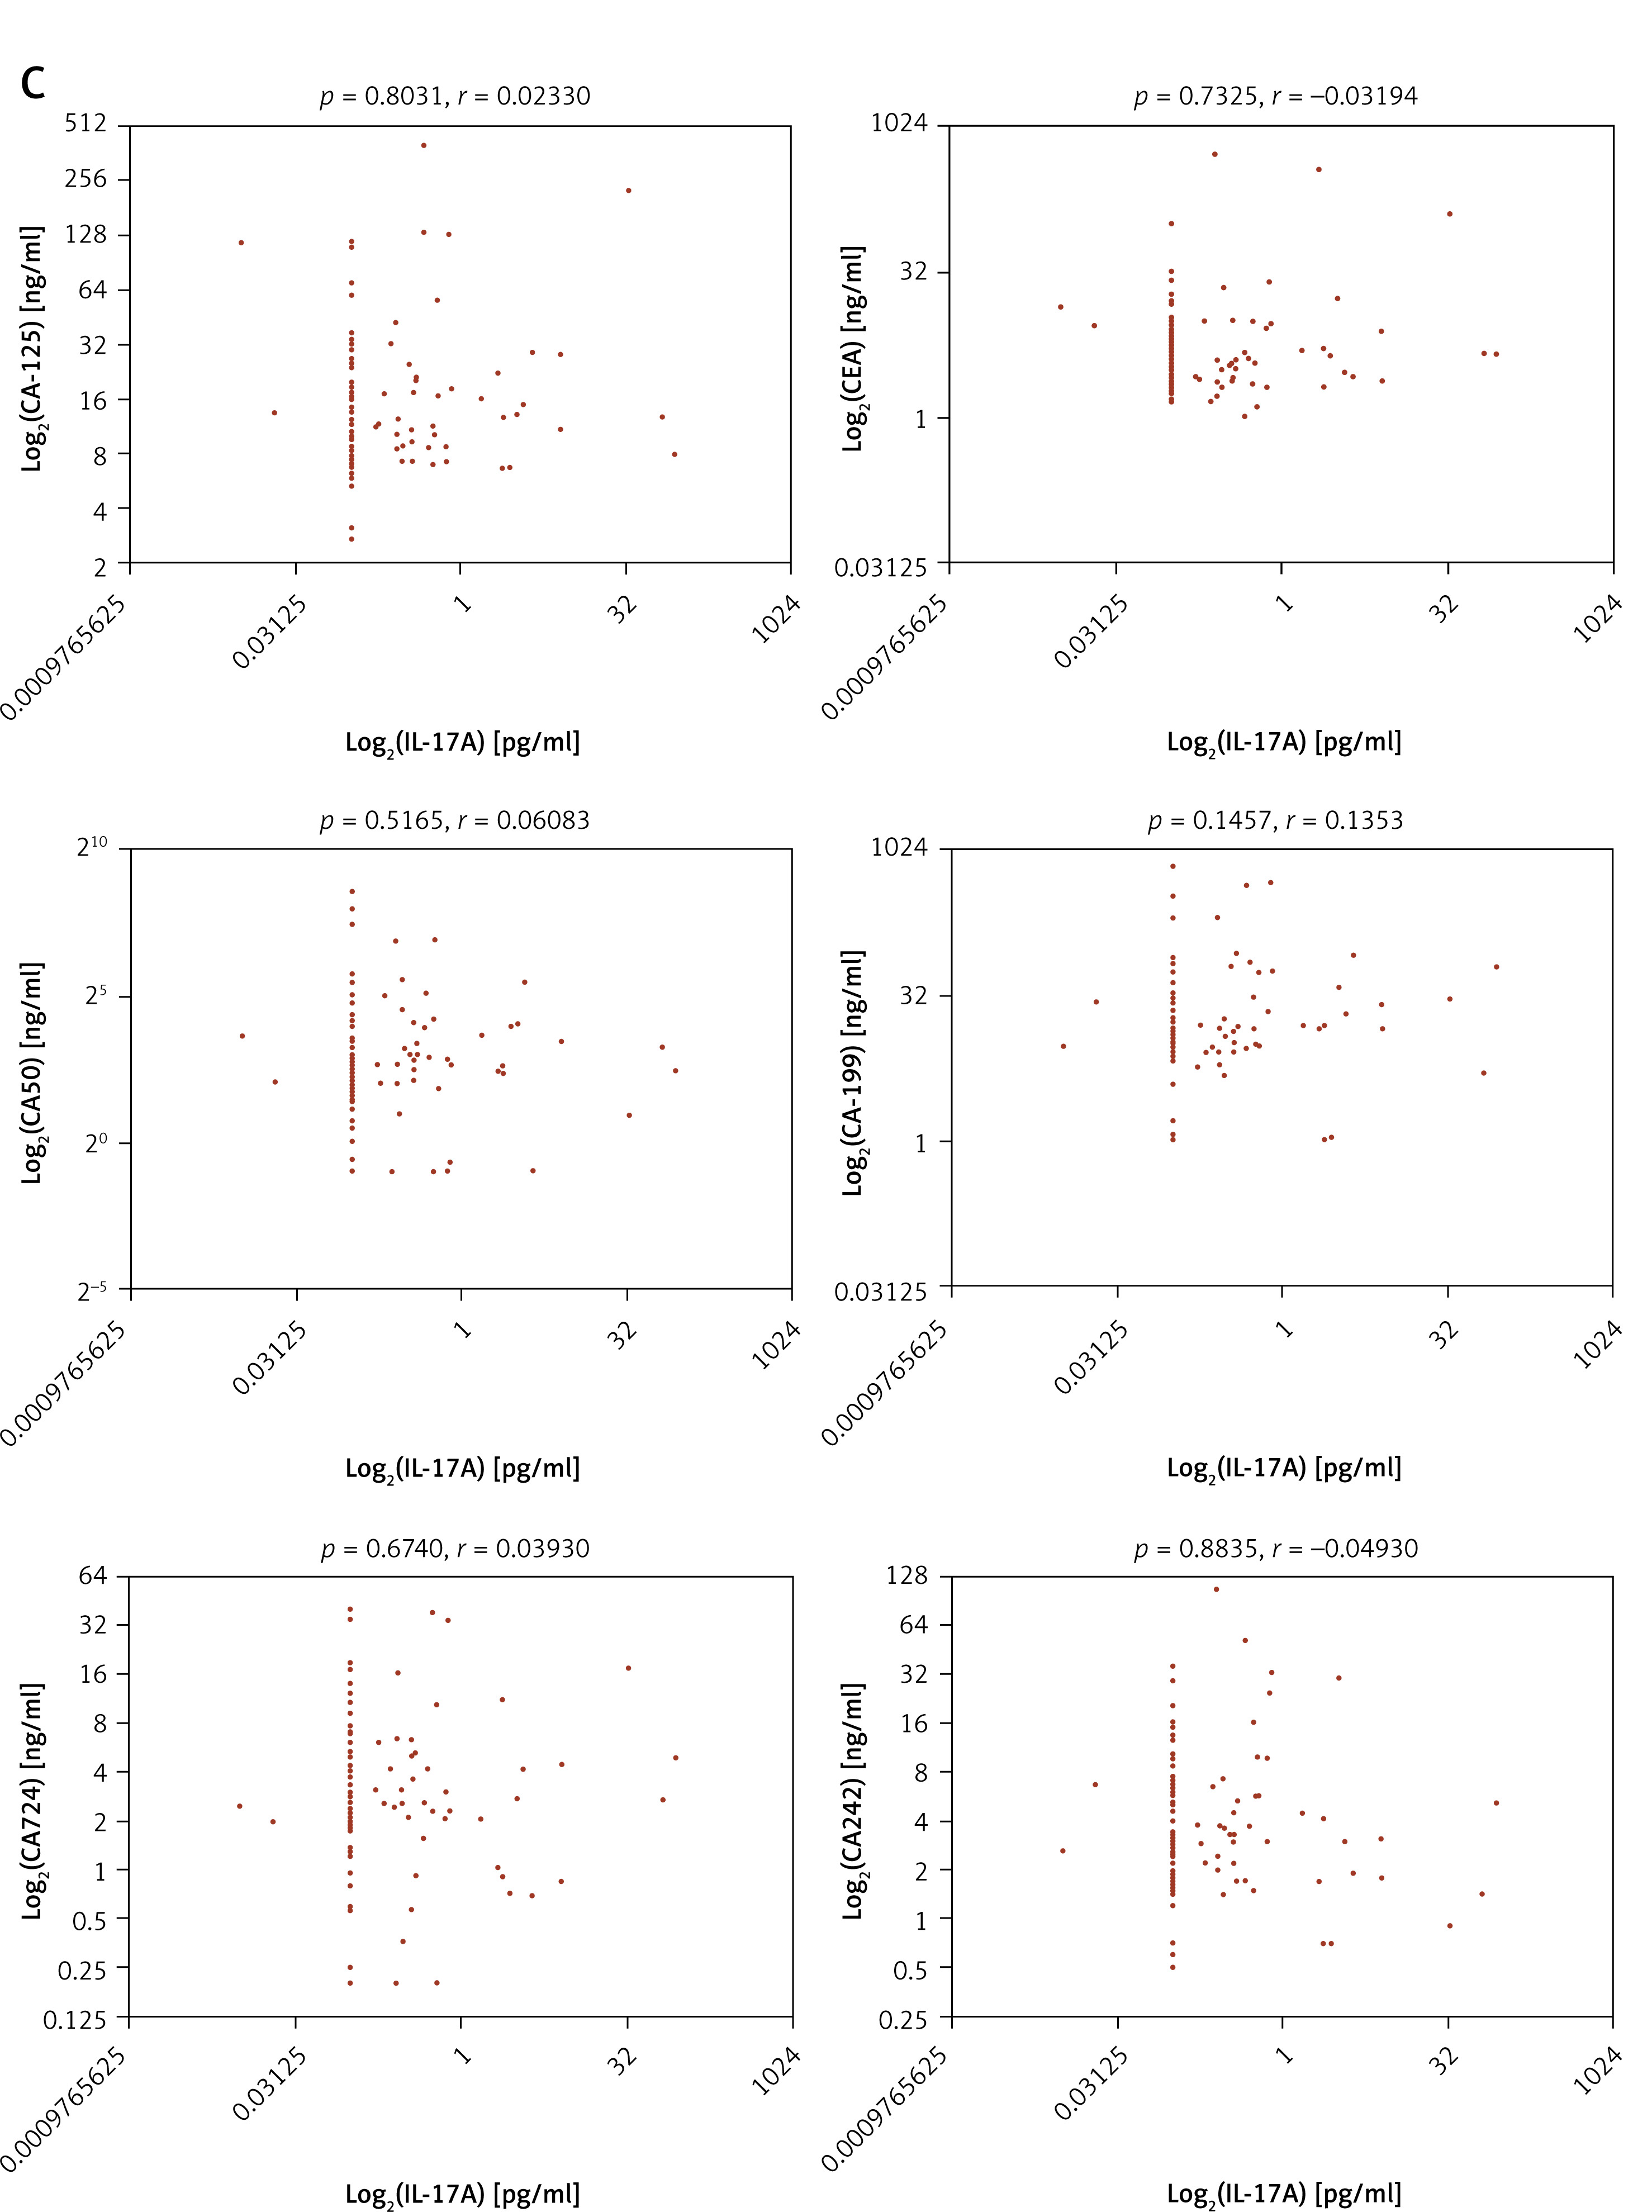
In our study, we explored the potential predictive role of cytokines and tumor markers in the effectiveness of immunotherapy for patients with AGC. We specifically analyzed the correlations between blood concentrations of IL-6, IL-8, and IL-17A, and various tumor markers in AGC patients undergoing immunochemotherapy. The results of our investigation revealed no significant correlations between serum IL-6 levels and the tumor markers CA-125 (r = –0.04464, p = 0.6327), CEA (r = –0.1094, p = 0.2402), CA50 (r = 0.09384, p = 0.3164), CA724 (r = –0.1459, p = 0.1166) and CA242 (r = 0.04950, p = 0.6008). However, we did find a significant association between IL-6 and CA-199 (r = 0.1943, p = 0.0358) (Figure 4 A). This suggests that IL-6 may serve as a predictive marker and an independent indicator of the efficacy of immunochemotherapy in patients with AGC, particularly in relation to the tumor marker CA-199. On the other hand, no notable relationships were observed between serum IL-8 levels and CA-125 (r = 0.02713, p = 0.7716), CEA (r = –0.001551, p = 0.98668), CA-50 (r = –0.1695, p = 0.0689), CA-199 (r = 0.07372, p = 0.4296), CA-724 (r = –0.1562, p = 0.0927), and CA-242 (r = 0.1081, p = 0.2501) (Figure 4 B). Similarly, no significant correlations were found between serum IL-17A levels and CA-125 (r = 0.02330, p = 0.8031), CEA (r = –0.03194, p = 0.7325), CA-50 (r = 0.06083, p = 0.5165), CA-199 (r = 0.1353, p = 0.1457), CA-724 (r = 0.03930, p = 0.6740), and CA-242 (r = –0.04930, p = 0.8835) (Figure 4 C). This suggests that IL-6, IL-8, and IL-17A could serve as independent predictors of the efficacy of immunotherapy and could complement the use of tumor markers such as CA-125, CEA, CA-50, CA-199, CA-724, and CA-242 in predicting the effectiveness of immunotherapy in AGC patients.
Figure 4
Correlation analysis of serum IL-6, IL-8, and IL-17A with tumor markers in AGC patients undergoing immunochemotherapy. A–C – Scatter plot showing the relationship between IL-6, IL-8, and IL-17A levels and CA-125, CEA, CA-50, CA-199, CA-724 and CA-242 levels for all outcomes of treatment for response and non-response groups. Statistical analysis included the Mann-Whitney U test for each pair of datasets and nonparametric Spearman correlation analysis to assess correlations; p < 0.05 indicates statistical significance
Evaluation of combined serum IL-6, IL-8, and IL-17A and tumor biomarkers in clinical response to immunochemotherapy in AGC patients
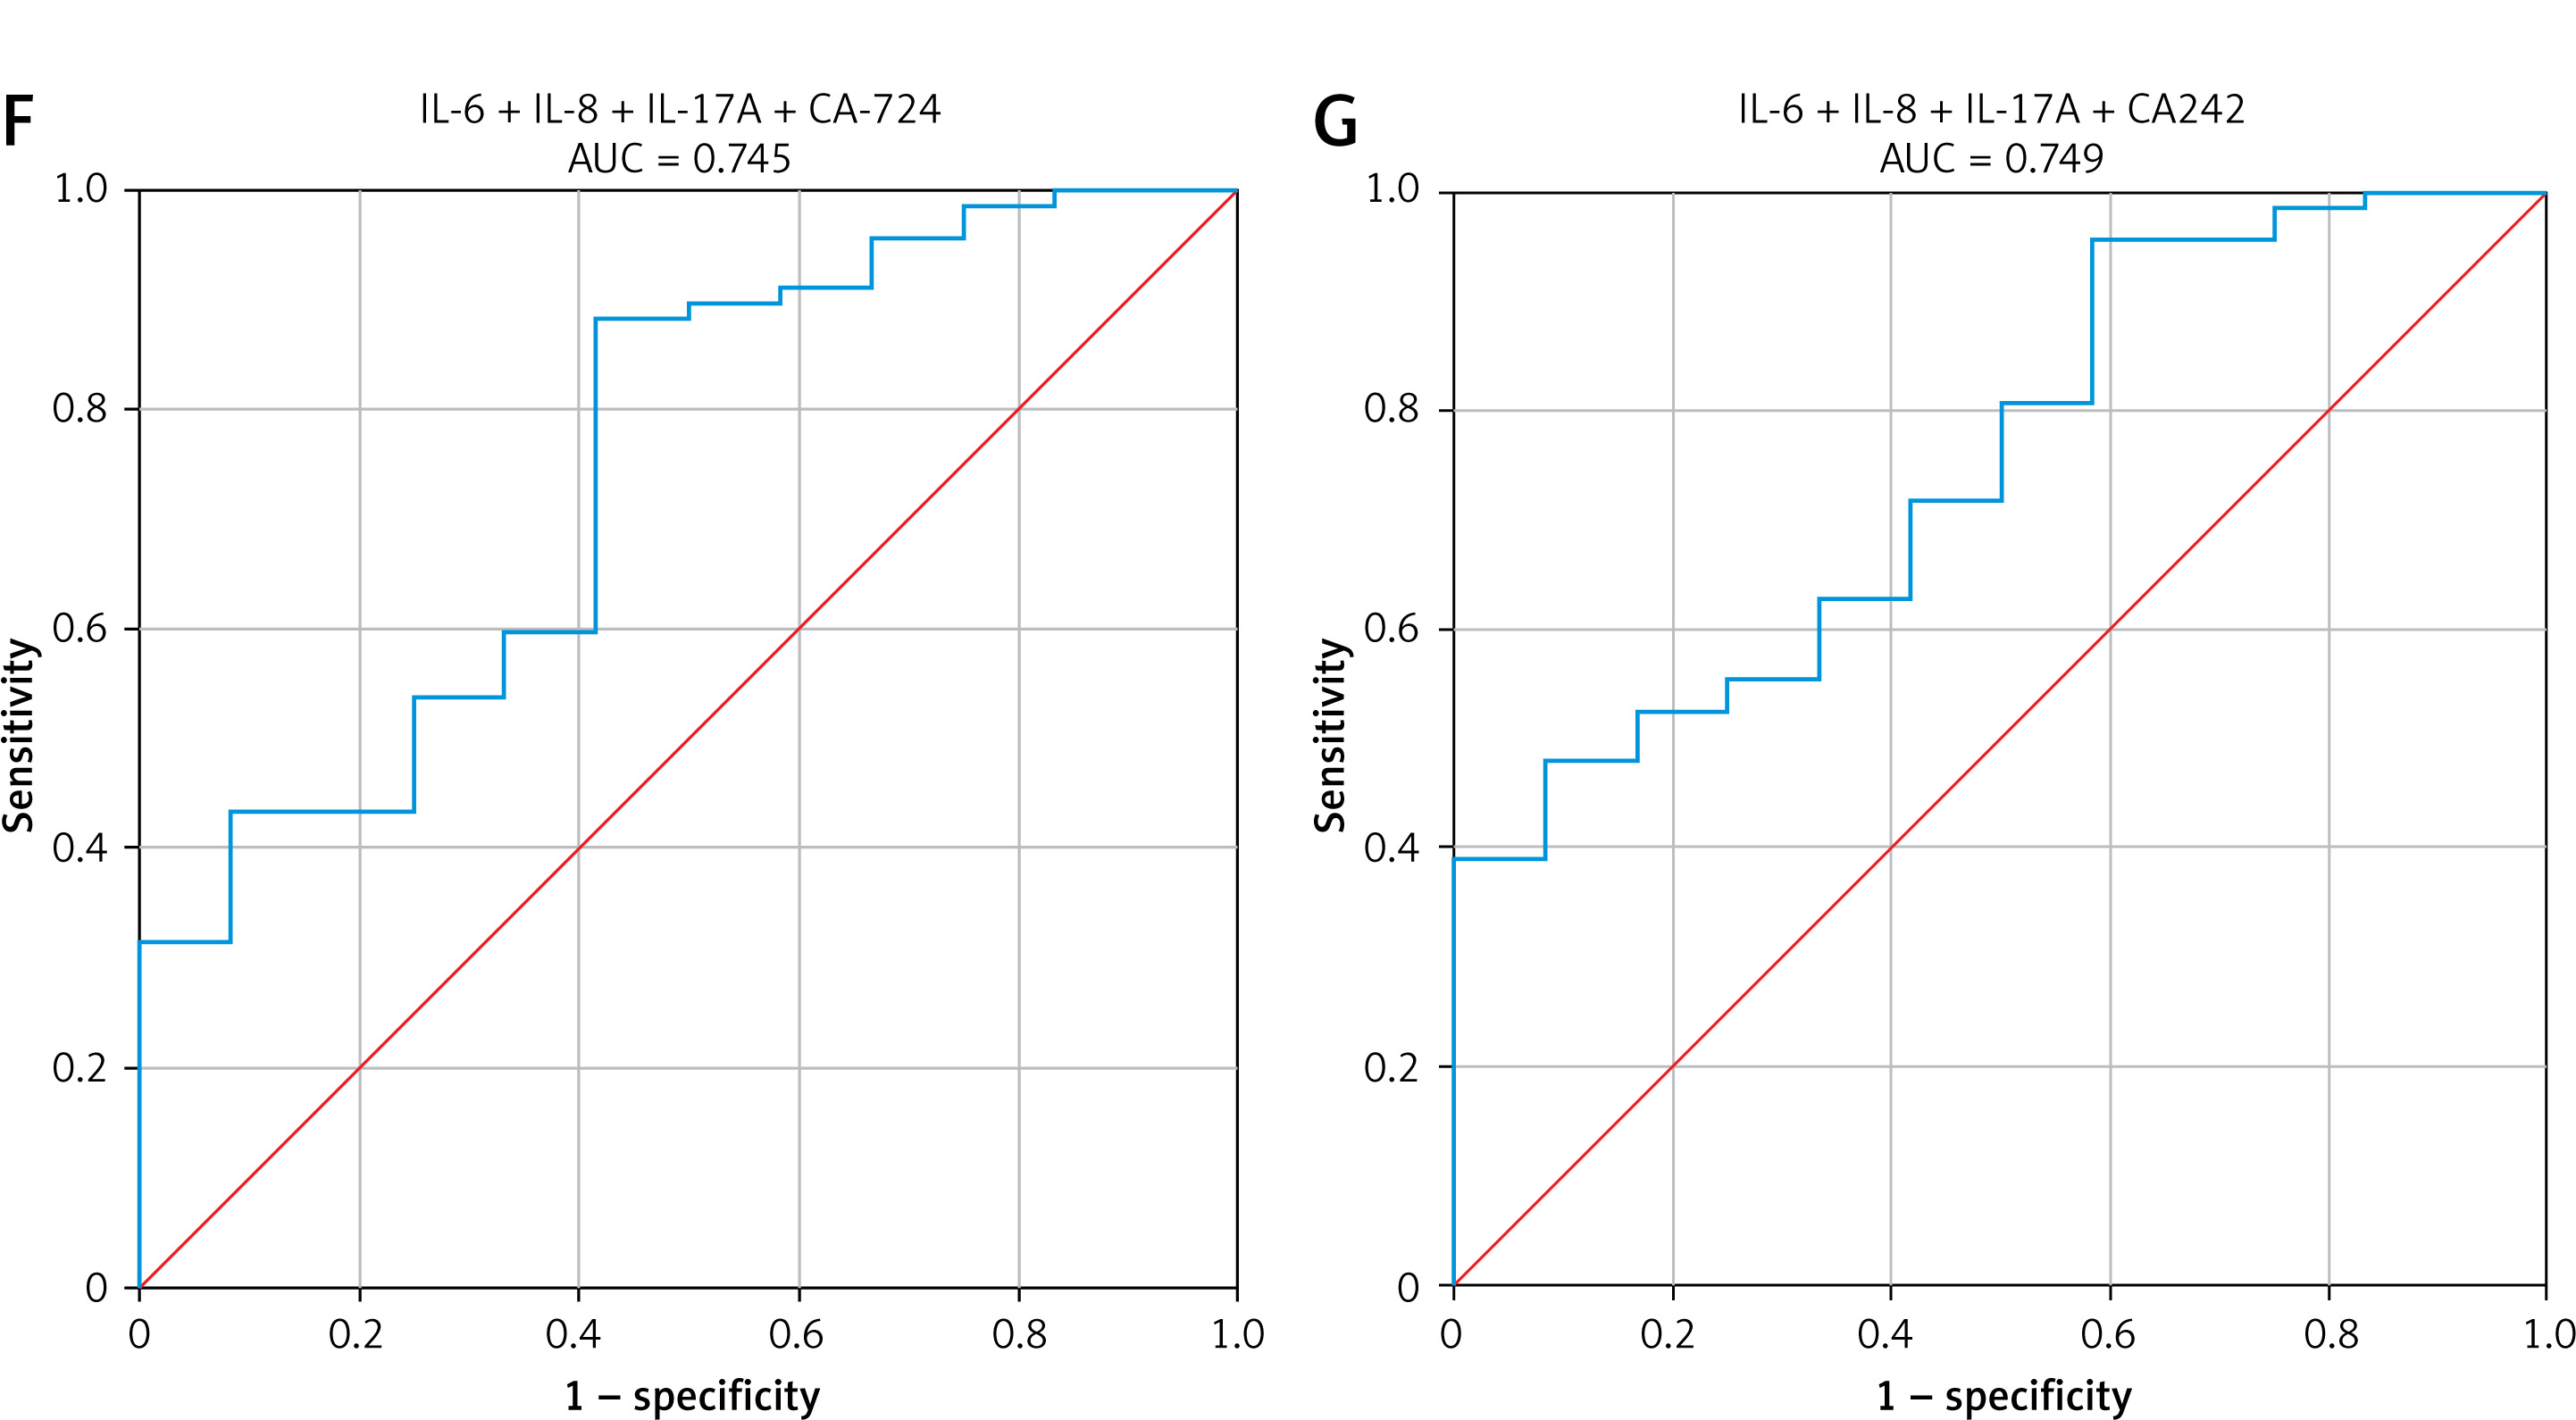
Receiver operating characteristic (ROC) curves are valuable tools for comparing the diagnostic performance of multiple screening tests for a specific disease, with the test featuring a higher area under the curve (AUC) often considered superior. In our investigation into the synergistic relationship between IL-6, IL-8, and IL-17A, and tumor markers for predicting the effectiveness of immunochemotherapy in patients with AGC, ROC curves played a pivotal role in evaluating the efficacy of these markers individually and in various combinations. The primary objective was to determine whether the combination of IL-6, IL-8, and IL-17A, and tumor markers could enhance predictive power. Analysis of the ROC curves for the combination of IL-6, IL-8, and IL-17A yielded an AUC of 0.716 (p = 0.017), demonstrating the superior predictive ability of IL-6, IL-8, and IL-17A in forecasting the efficacy of immunochemotherapy (Figure 5 A). Subsequently, when CA-125, CEA, CA-50, CA-199, CA-724, and CA-242 were integrated into the IL-6, IL-8, and IL-17A combination, the AUC values showed improvements, with values of 0.756 (p = 0.005), 0.734 (p = 0.010), 0.752 (p = 0.006), 0.754 (p = 0.005), 0.745 (p = 0.007), and 0.749 (p = 0.006), respectively (Figures 5 B–G). Notably, the combination of IL-6, IL-8, IL-17A, and CA-125 emerged as a superior predictor for assessing the efficacy of immunochemotherapy in AGC patients compared to using the markers individually or in combination with other tumor markers.
Figure 5
ROC curves were used to evaluate the clinical response in AGC patients undergoing immunochemotherapy, with the AUC analysis focusing on combinations of IL-6, IL-8, and IL-17A along with CA-125, CEA, CA-50, CA-199, CA-724, and CA- 242. A – The combinations assessed included IL-6, IL-8, and IL-17A alone. B–E – IL-6, IL-8, and IL-17A in combination with specific tumor markers. These ROC curves were constructed using the binary logistic regression model, and statistical significance was determined using the DeLong test, with p < 0.05 considered significant. F–G – IL-6, IL-8, and IL-17A in combination with specific tumor markers. These ROC curves were constructed using the binary logistic regression model, and statistical significance was determined using the DeLong test, with p < 0.05 considered significant
High serum IL-6, IL-8, and IL-17A levels are associated with worse clinical outcomes of patients treated with immunochemotherapy
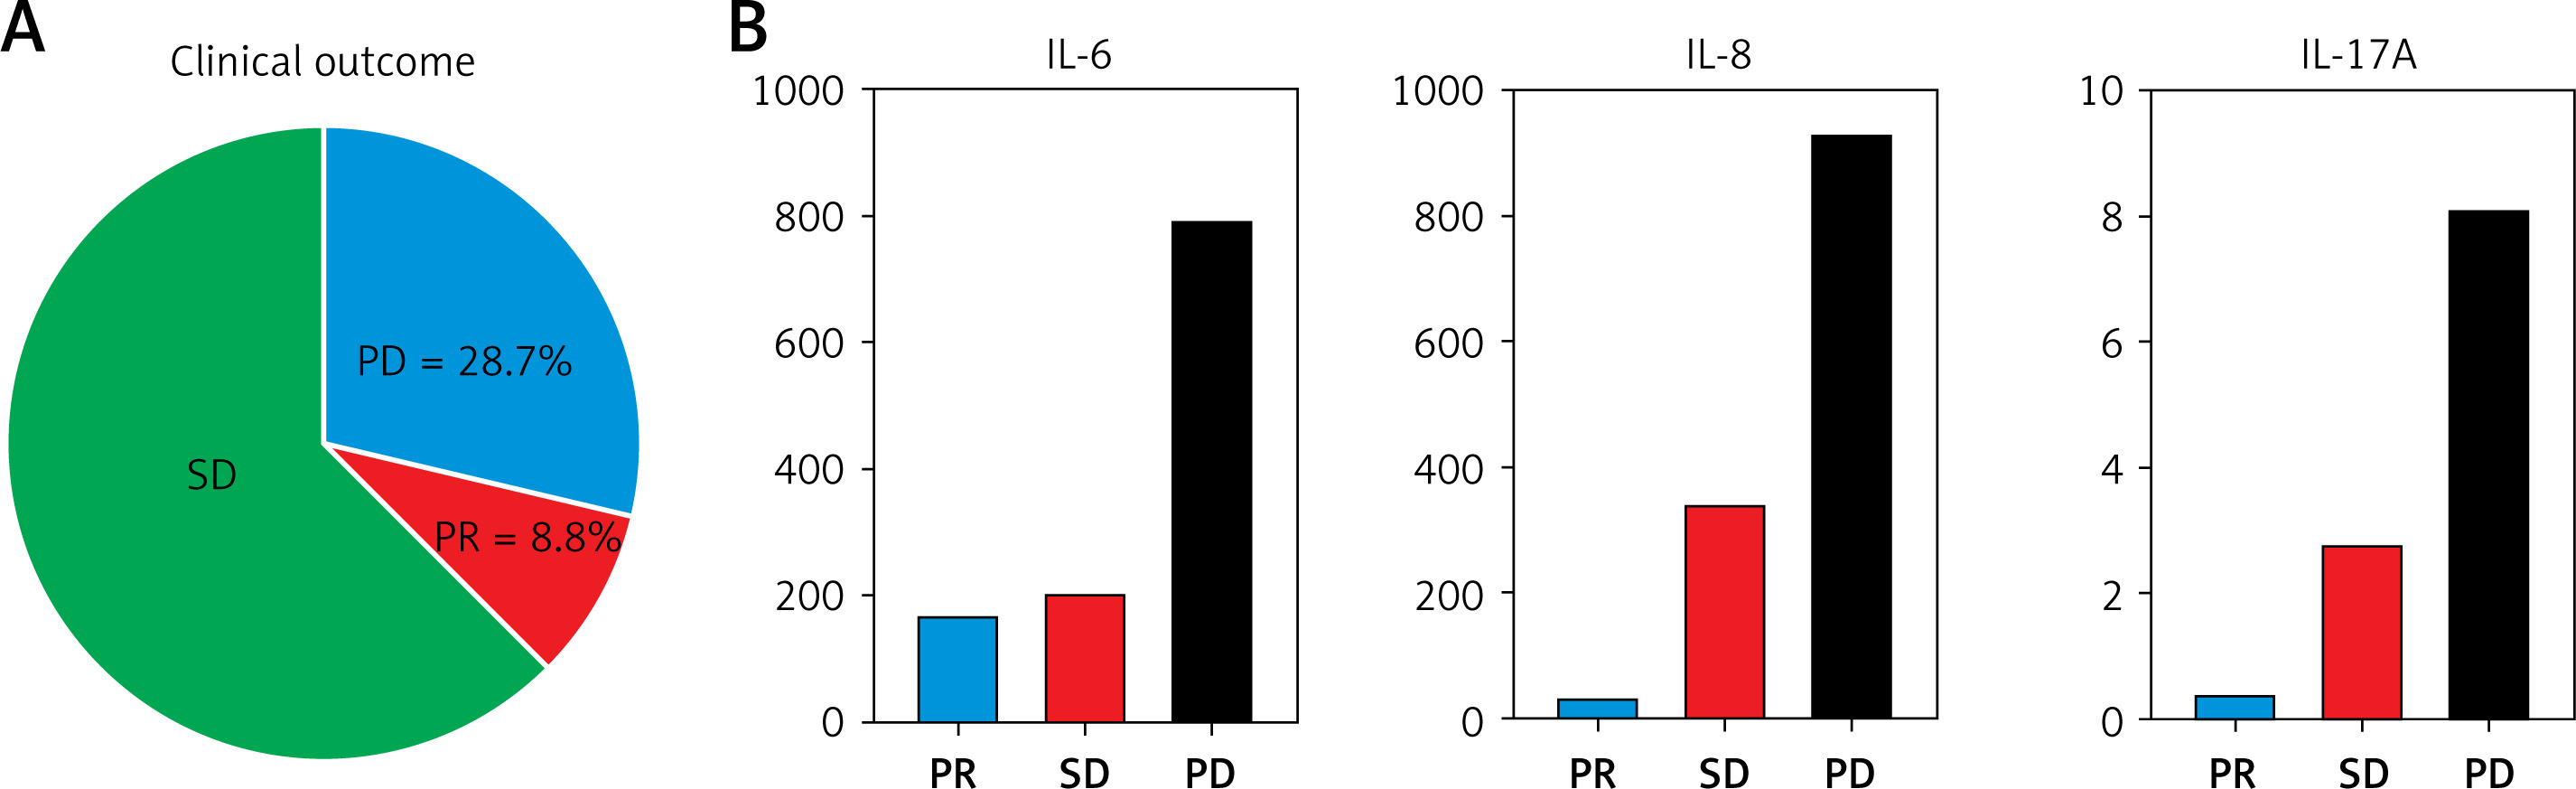
In our study, we investigated the immunological characteristics and imaging outcomes of patients diagnosed with AGC, along with their response to immunochemotherapy. As illustrated in Figure 6, we outlined the diagnostic progression and treatment results in AGC, incorporating histopathological, immunohistochemistry (IHC), and computed tomography (CT) imaging findings. H&E staining shows irregular glandular structures and nuclear atypia. IHC analysis reveals (i) high Ki67 expression (75%+) indicating increased cell proliferation, and (ii) CD34 staining highlighting increased microvessel density suggestive of angiogenesis (Figure 6 A). The histopathological analysis highlighted key features such as cellularity and inflammatory infiltrates, which are crucial for understanding the tumor’s immune landscape. These findings emphasize the significant relationship between the tumor’s histopathological traits and its immune environment, which could inform treatment strategies for AGC. We documented three significant cases of AGC patients who initially exhibited poor responses to chemotherapy alone. Following the introduction of an anti-PD-1 antibody in conjunction with chemotherapy, patients demonstrated marked clinical responses. CT scans of patients with AGC revealed concerning trends, with a subset of individuals demonstrating PD despite treatment (Figures 6 B–D). These patients not only showed tumor progression but also exhibited elevated levels of pro-inflammatory cytokines, specifically IL-6, IL-8, and IL-17A. The increased levels of these cytokines may reflect a heightened inflammatory response, which could contribute to the poor treatment outcomes observed. This correlation suggests that monitoring cytokine levels, alongside imaging results from CT scans, could be critical in predicting disease progression in AGC patients. We noted that higher serum levels of IL-6, IL-8, and IL-17A in patients were significantly linked to a reduced objective response rate (ORR). Additionally, the treatment response profiles of AGC patients undergoing immunochemotherapy are presented in Figure 7 A, showing the ORR and specific cytokine profiles associated with treatment response. A more detailed analysis of the IL-6, IL-8, and IL-17A profiles in responders and non-responders is shown in Figure 7 B.
Figure 6
The relationship between serum levels of IL-6, IL-8, and IL-17A and clinical outcomes in patients with advanced gastric cancer, along with findings from imaging and immunological assessments. A – Histopathological and immunohistochemical evaluations of AGC patients. B–D – Computed tomography scans showing elevated IL-6, IL-8, and IL-17A levels AGC patients, correlating with poor post-treatment clinical outcomes
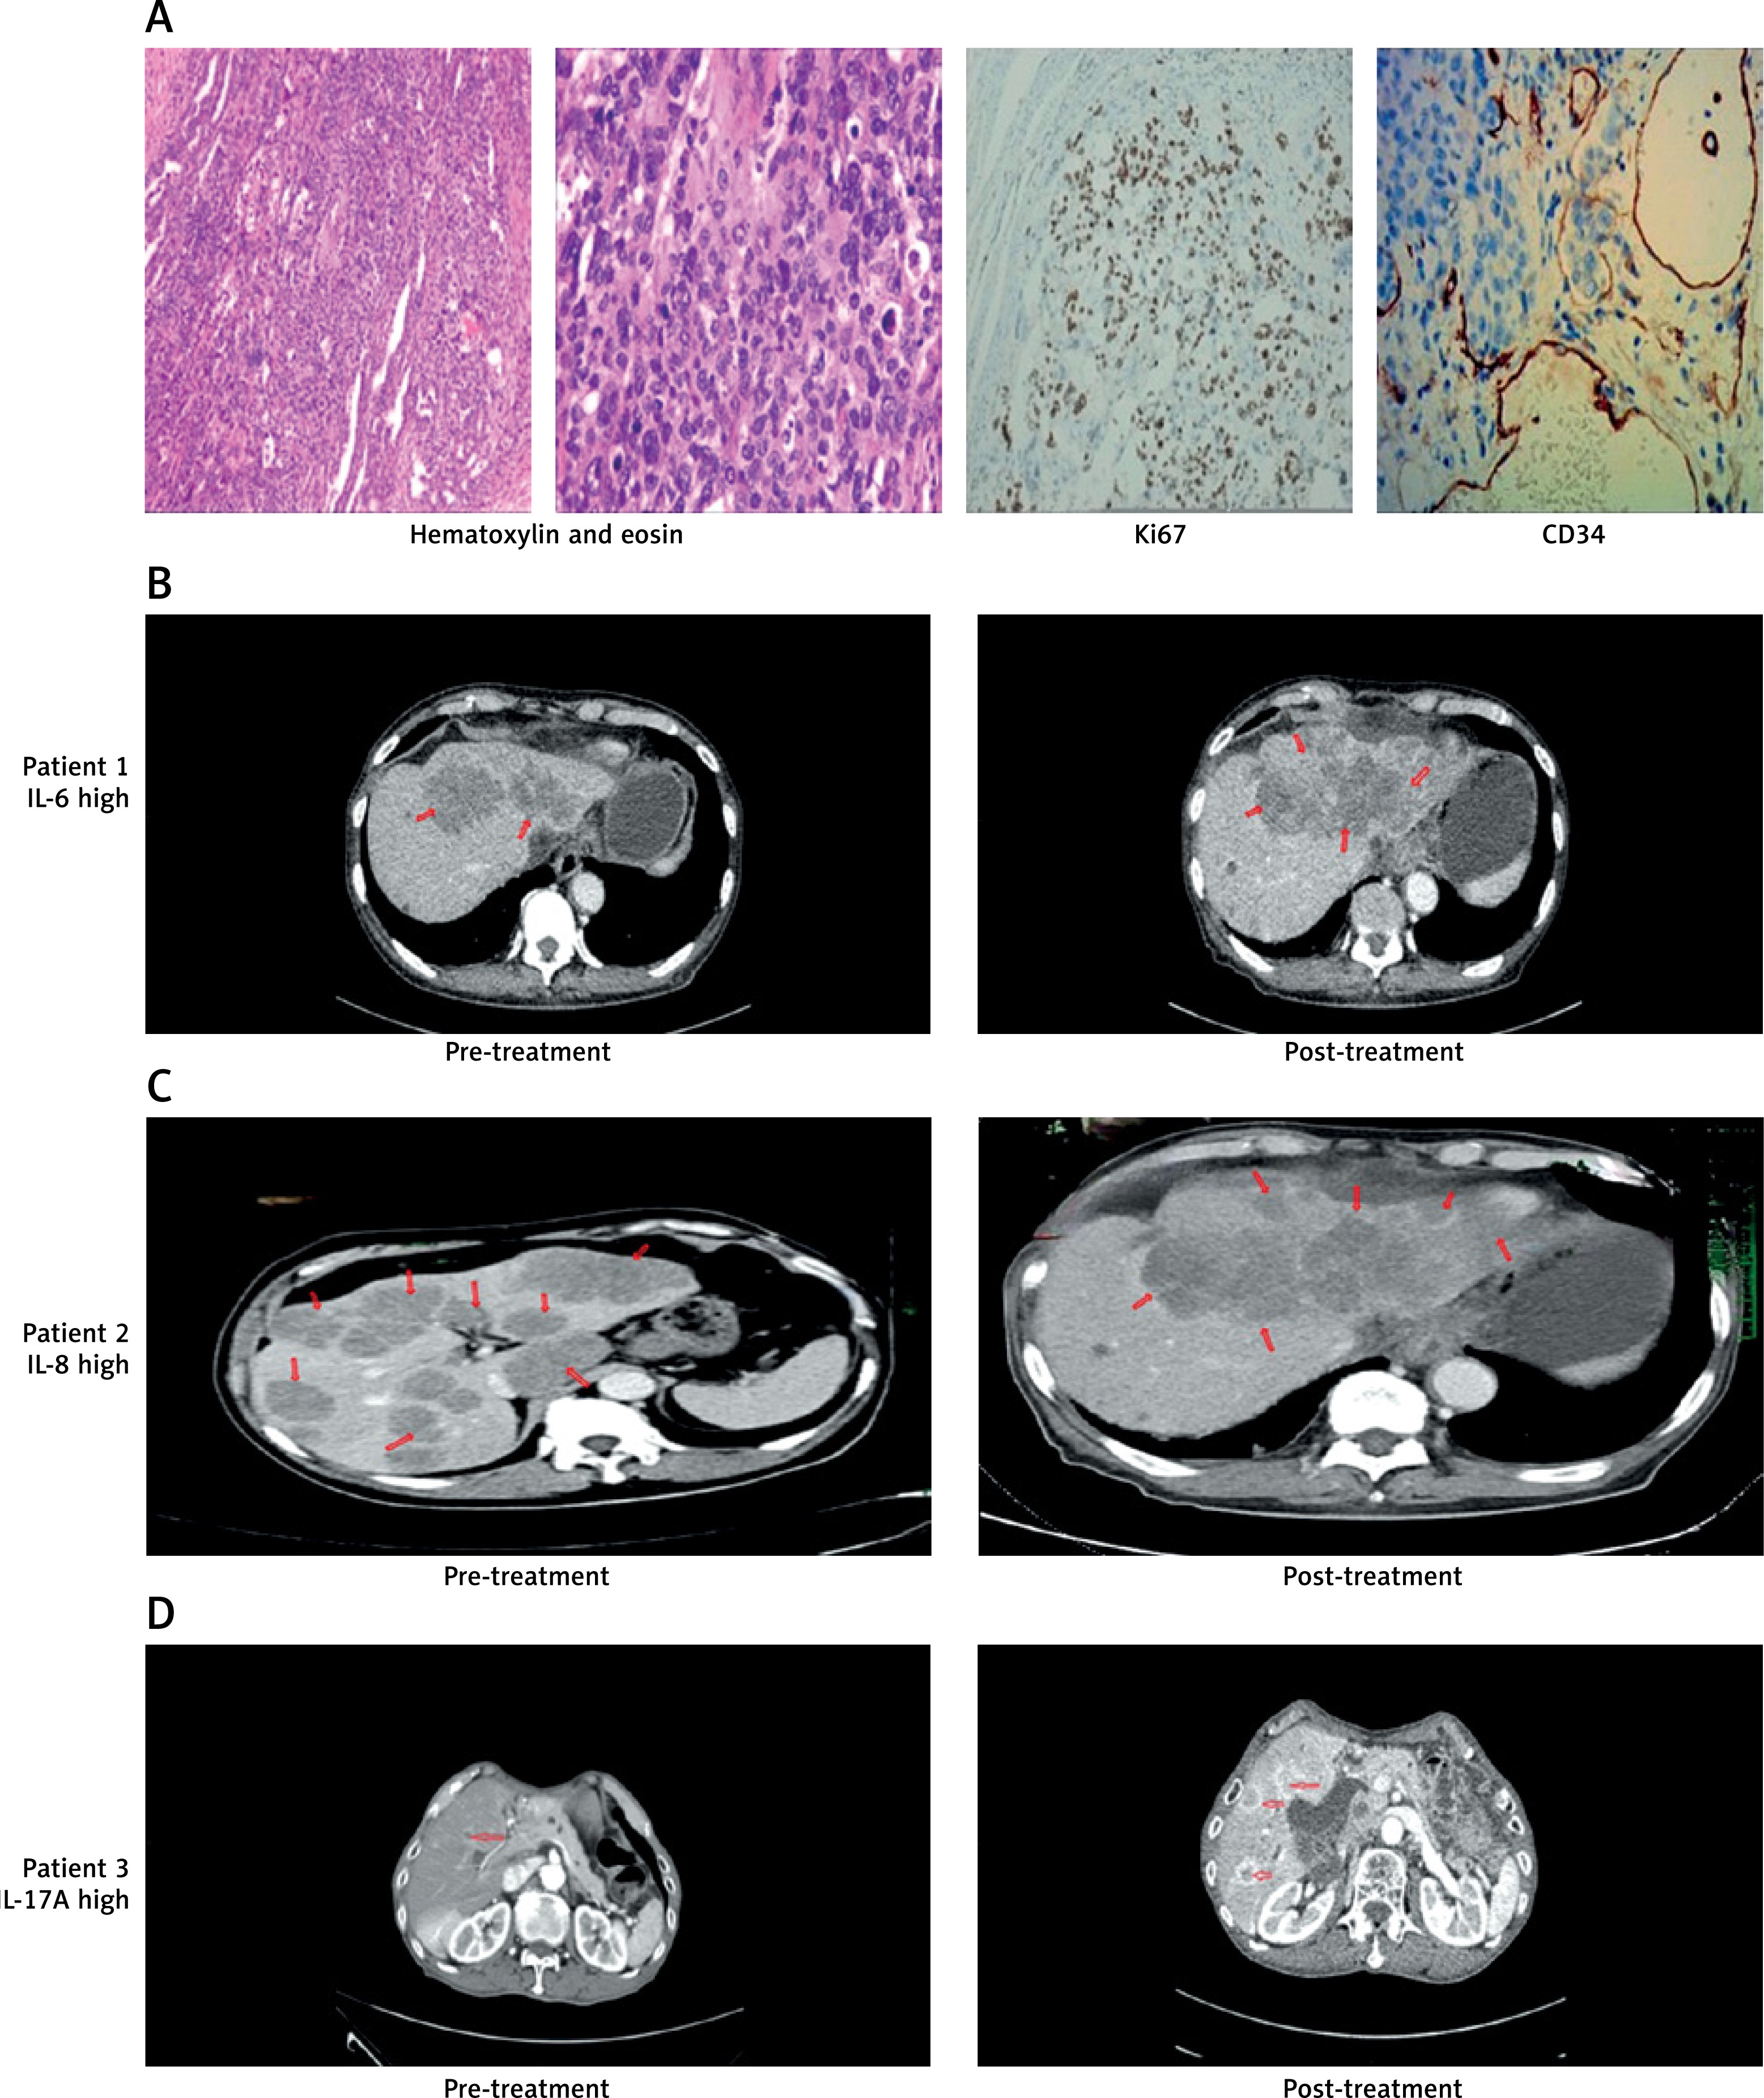
Figure 7
Overview of treatment response in AGC patients undergoing immunochemotherapy. A – Clinical outcome assessments of the cohort of 136 AGC patients treated with anti-PD-1-based immunotherapy combined with chemotherapy. PR = 12 (8.8%), SD = 85 (62.5%), PD = 20 (28.7%) referring to the RECIST guidelines. B – Correlation of serum IL-6, IL-8, and IL-17A levels and patient responses to PD-1 antibody treatment in AGC
Discussion
The investigation of cytokine dynamics in AGC is critical for optimizing patient treatment strategies. While PD-1 checkpoint inhibitors have become a cornerstone of modern cancer therapy [28], reliance on imaging for early response assessment remains problematic due to delays in detecting therapeutic effects [29]. The ability to assess therapeutic effectiveness within initial treatment cycles holds significant clinical value, as timely intervention may reduce exposure to ineffective therapies, minimize adverse effects, and decrease healthcare expenditures [30]. While modified evaluation protocols such as immune-related response criteria (irRC) [31] have been developed, these approaches remain constrained by their dependence on radiographic imaging and its well-documented challenges in detecting early treatment effects [29]. Our findings offer practical guidance for immunotherapy management in AGC. By monitoring IL-6, IL-8, and IL-17A trends during treatment, clinicians can identify which patients are responding to therapy and which may require alternative approaches. This blood-based strategy provides treatment response signals significantly earlier than standard imaging methods, helping to optimize clinical decisions and resource use. Traditional tumor markers, though convenient, suffer from low accuracy and positivity rates, underscoring the need for more reliable biomarkers to predict anti-PD-1 therapy success. Identifying responders and non-responders early could significantly enhance therapeutic efficiency and patient outcomes.
Anti-PD-1 treatment enhances cytokine release, which alleviates immune suppression and allows for cytokine level monitoring as a surrogate marker for anti-tumor immune response activation [32]. Through comprehensive evaluation of AGC patients using multi-modal assessment (imaging, pathology, tumor markers, and cytokine monitoring), we found that while chemotherapy alone maintained low baseline cytokine levels, immunochemotherapy induced an initial cytokine surge followed by distinct response patterns. Responders showed progressive declines in IL-6, IL-8, and IL-17A levels, consistent with a previous report of cytokine dynamics predicting treatment response [33], while non-responders exhibited sustained elevation. These patterns suggest that cytokine monitoring could serve as an early efficacy biomarker, potentially enabling personalized treatment adjustments before radiographic changes become apparent.
Elevated IL-6 levels in poor responders align with its established role in GC biology, where it correlates with advanced disease and poor prognosis [34, 35]. Patients with GC demonstrate significantly higher systemic IL-6 levels compared to healthy controls and those with other gastric neoplasms [35]. This gastric-specific finding aligns with broader oncological evidence that IL-6 serves as an independent prognostic factor in gastrointestinal malignancies [36]. The consistent association between IL-6 elevation and advanced disease stages across cancers [35, 36] underscores its fundamental role in tumor progression. For IL-8, our findings reflect its multifaceted role in GC pathogenesis, including angiogenesis, metastasis, and immune evasion. IL-8 recruits myeloid-derived suppressor cells (MDSCs) and upregulates PD-L1 [37], which may explain its association with treatment resistance. Sustained IL-8 elevation in non-responders suggests that it is a key mediator of immune suppression. High serum IL-8 levels show a strong association with lymph node metastasis and tumor recurrence in gastric adenocarcinoma [38], particularly mediated through cancer-associated fibroblast production in the tumor microenvironment [39]. While IL-8 appears not to directly influence GC cell proliferation [40], its role in promoting immune evasion and metastasis [38, 39] makes it a valuable monitoring parameter. The dual behavior of IL-17A presents both challenges and opportunities in cancer immunity. IL-17A not only promotes tumor progression via Th17 signaling but also stimulates IL-8 secretion, creating a feedforward loop that sustains pro-tumor inflammation [41]. This cascade may further enhance PD-L1 expression, exacerbating immune evasion and explaining its association with a poorer PD-1 blockade response. In GC, IL-17A demonstrates the capacity to induce tumor cell pyroptosis through mitochondrial dysfunction [42]. However, elevated IL-17A levels have also been associated with disease progression in various malignancies, including GC and colorectal cancers (CRC) [43, 44]. This paradoxical behavior exhibiting both anti-tumor and pro-tumor effects across different cancer types requires careful interpretation in clinical contexts, particularly when considering its role in tumor microenvironment modulation. Our results corroborate emerging evidence that elevated IL-6, IL-8, and IL-17A levels predict diminished ICI efficacy [33, 37, 45–49], with particular relevance as independent biomarkers in GC [37, 46, 50, 51]. While the strong correlation between cytokine trajectories and clinical outcomes suggests practical utility for treatment monitoring, the paradoxical roles of these cytokines, especially IL-8 and IL-17A, highlight the need for further research to optimize their clinical implementation.
Clinical retrospective studies have demonstrated that tumor-associated or serum cytokines inhibit antitumor immunity and correlate with reduced clinical benefits of ICIs [52, 53], but none has specifically addressed GC. Our investigation filled this knowledge gap, revealing associations between cytokine expressions in GC tissue and patient outcomes. Notably, higher IL-6, IL-8, and IL-17A expression levels correlated with worse OS in GC patients, suggesting a potential prognostic role. Our findings align with existing research linking IL-6 to poor outcomes in liver cancer patients receiving PD-1 inhibitors [54], and gastric or gastroesophageal junction cancer [34]. Elevated IL-6 levels are also associated with shorter OS in GC patients [55]. Similarly, high IL-8 levels predict poor treatment outcomes, including OS, across various cancers [56, 57]. Although one study found that high IL-8 gene expression correlated with improved GC survival [58], we propose that complex IL-8 regulation and excessive production contribute to GC progression and poor prognosis. Furthermore, IL-17A promotes GC development, treatment failure, and resistance to anti-tumor immunity [59, 60], upregulates PD-L1 expression, hindering anti-PD-1 therapy, and its blockade improves treatment efficacy in microsatellite stability CRC models [41]. Clinical research also suggests that IL-17A signaling is associated with a poor response to anti-PD-1 therapy in CRC patients [61]. Our study underscores the prognostic significance of cytokines in the GC microenvironment, providing vital insights for immunochemotherapy strategies and patient outcomes.
Biomarkers serve as biological markers to help identify patients suitable for systemic anticancer treatments, including immunotherapy. However, a significant challenge in the broad application of immunotherapies is the scarcity of clinically effective biomarkers to forecast treatment responses [62]. While IL-6, IL-8, and IL-17A did not show significant correlations with CA-125, CEA, CA-50, CA-199, and CA-724, IL-8 displayed associations with CA-50, CA-199, and CA-724. Notably, we did find a significant association between IL-6 and CA-199. This suggests that these markers could independently and complementarily predict the effectiveness of immunotherapy, potentially indicating links to tumor biology and treatment response. To further investigate, we analyzed whether serum IL-6, IL-8, and IL-17A, alongside tumor markers, could accurately predict clinical benefits. Our results revealed a strong predictive ability in forecasting clinical efficacy in AGC patients receiving anti-PD-1 mAb treatment, particularly when combining IL-6, IL-8, and IL-17A with CA-125 (AUC = 0.756), highlighting the reliability of these biomarkers.
Several limitations of this study warrant consideration. First, the retrospective design may introduce selection bias, necessitating prospective validation of our findings. Second, while the Luminex xMAP technology enabled comprehensive cytokine profiling, its high sensitivity may contribute to measurement variability, particularly for low-abundance cytokines, potentially affecting result reproducibility. Third, our cohort of patients provided meaningful insights but became limited when analyzing subgroups, and the diagnostic model requires validation in larger, independent cohorts. Fourth, treatment heterogeneity may influence cytokine dynamics, suggesting the need for standardized protocols. Additional limitations include the single-center design, fixed timepoint measurements rather than continuous monitoring, unaccounted confounding factors, and the need for mechanistic studies to elucidate how these cytokines mediate treatment resistance. Despite these limitations, our findings using Luminex xMAP technology provide valuable preliminary evidence supporting cytokine monitoring in immunochemotherapy.
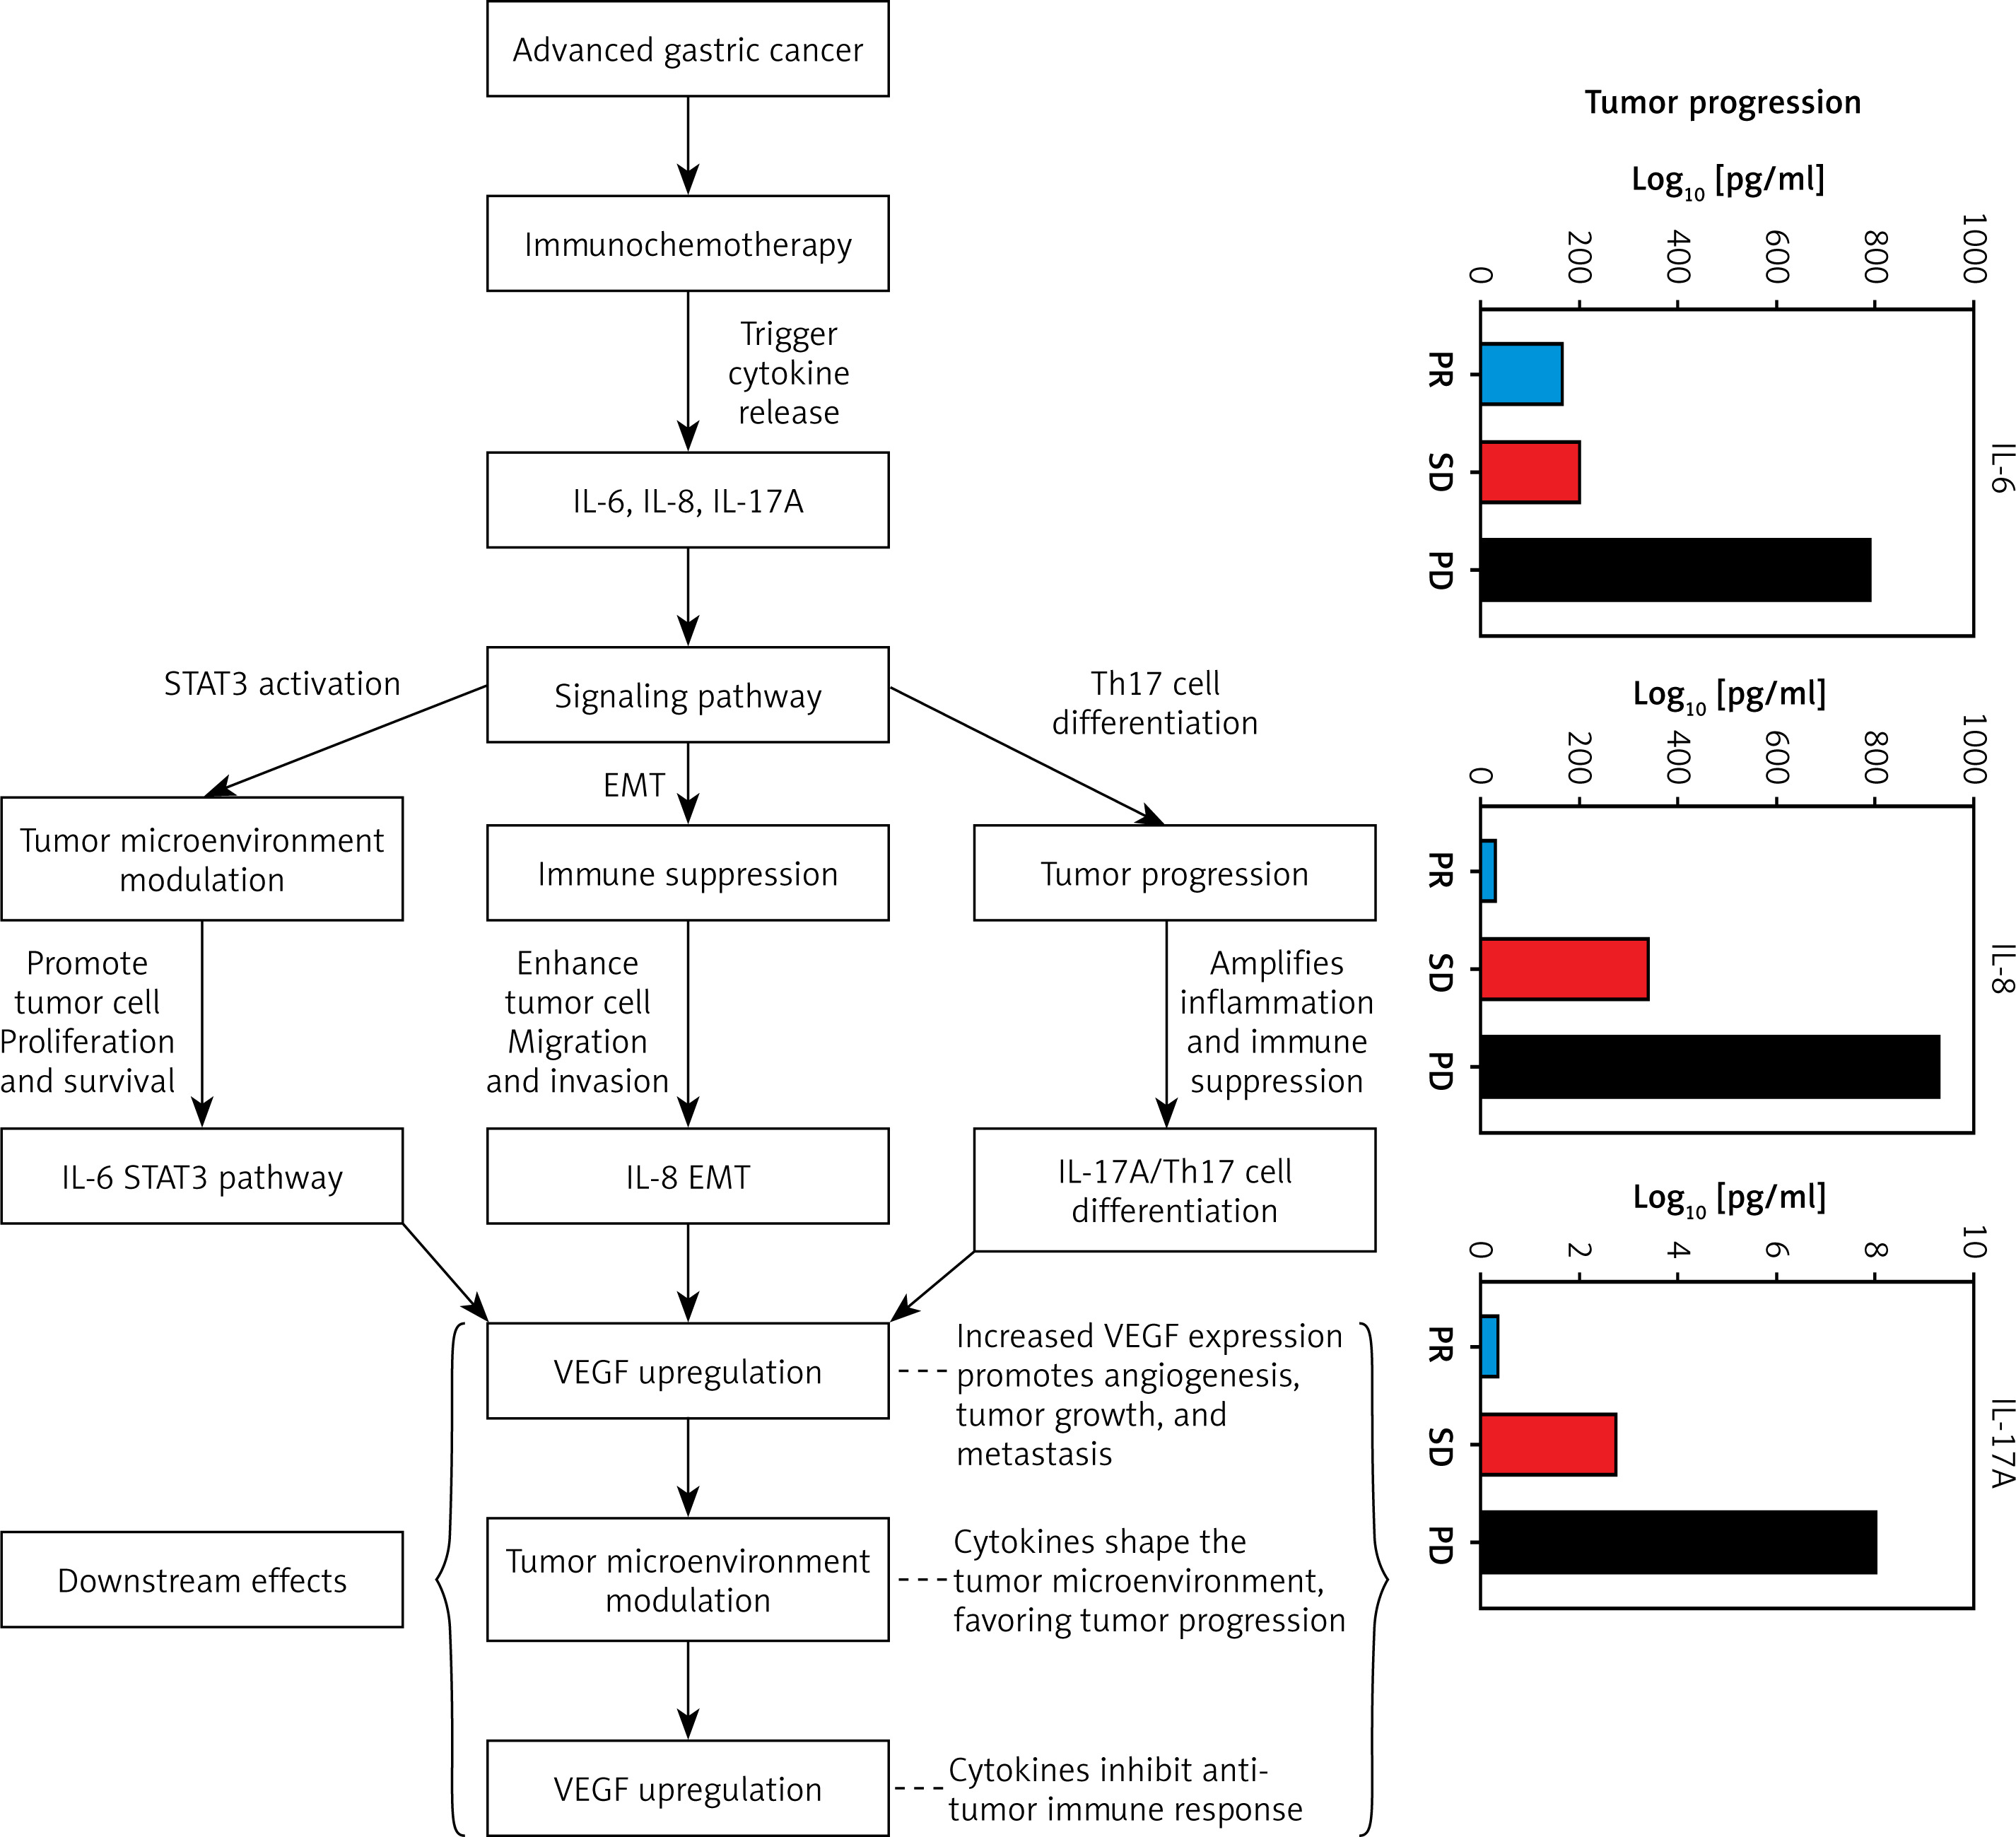
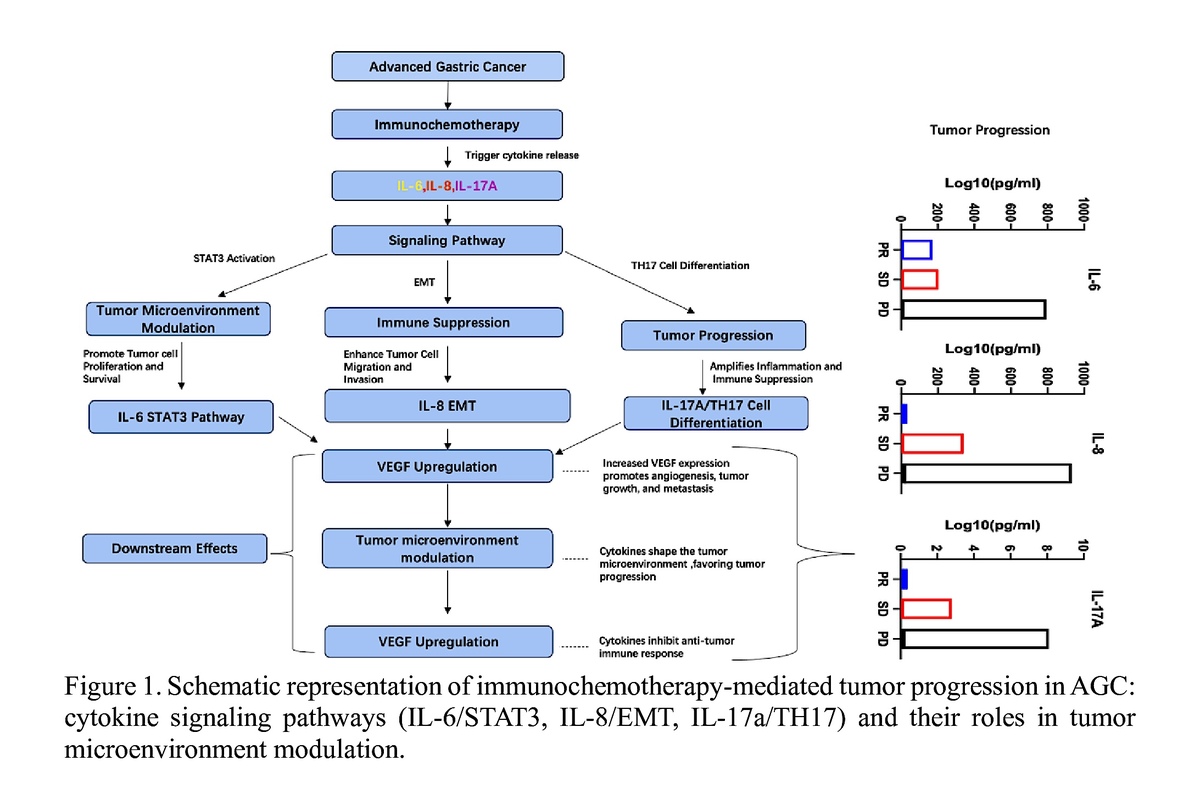
In conclusion, our study underscores the pivotal role of cytokines as biomarkers in predicting treatment outcomes in AGC patients receiving immunochemotherapy. Specifically, blood levels of IL-6, IL-8, and IL-17A are associated with treatment response. The combined evaluation of IL-6, IL-8, and IL-17A with CA-125 has shown the greatest predictive accuracy for determining immunochemotherapy outcomes. By monitoring these cytokine profiles during therapy, clinicians can early identify patients likely to benefit from PD-1 blockade while avoiding unnecessary treatment costs and toxicities in those unlikely to respond. These findings support the integration of cytokine monitoring into clinical practice to optimize AGC management. Future studies should investigate the clinical utility of this cytokine panel in guiding treatment decisions and improving patient outcomes (Figure 8).