Introduction
Autosomal dominant polycystic kidney disease (ADPKD) is the most common hereditary form of chronic kidney disease (CKD) [1]. The cysts increase in size and destroy functional renal parenchyma, leading to end stage renal disease (ESRD) in about 50% of patients with ADPKD [2]. The age of ESRD occurrence is widely variable; however, for PKD1 gene mutation median age of entering ESRD is 58.1 years and for PKD2 it is 79.7 years [3]. In comparison, other forms of CKD are estimated to progress to ESRD in only 2% of cases [4, 5]. This makes ADPKD one of the leading causes of ESRD [6] despite its low prevalence (< 5/10 000 in the European Union [7]).
Despite advances in renal replacement therapy and care of patients on hemodialysis, ESRD-ADPKD, there is still an increased risk of death among ESRD-ADPKD patients, with almost 10% of patients dying within 2 years since the start of renal replacement therapy [8]. The distribution of the causes of death among ESRD-ADPKD changed as the frequency of cardiovascular disease and cerebrovascular deaths decreased, with infections and cancers becoming the primary causes of death [9]. Recently discovered short non-coding RNAs molecules, microRNAs (miRNAs), influence many of the cancer-relevant cellular processes, including cell proliferation, apoptosis, cell cycle control, cell differentiation, migration and dysregulation of metabolism [10].
MiRNA are small non-protein coding RNA molecules that regulate gene expression by targeted binding to 3′untranslated regions of mRNAs. Altered cellular expression of miRNA is observed in multiple pathological states from cancer types to cardiovascular diseases and psychiatric disorders. Their role in kidney tissue during ADPKD development has been widely studied. Microarray analysis of the miRNA profile of kidney tissue of PKD/Mhm rats showed up-regulation of 8 miRNAs and a strong overlap of functional pathways between deregulated miRNAs and mRNAs [11]. Additionally, the miR-17 family was indicated as a promising drug target for ADPKD [12] eventually proving the crucial role of miRNAs in ADPKD development.
Many miRNA are abundant not only in solid tissues but also in the bloodstream, with a surprisingly stable concentration [13]. MiRNAs may be present in the bloodstream in several different forms that protect them from RNase activity: lipid-associated transporters (exosomes, microvesicles, apoptotic bodies and lipoproteins) and nonlipid-associated transport (Ago1/2-bound) [14]. It is estimated that the protein-bound form of miRNA is the most abundant in the bloodstream and only 5–25% of extracellular miRNA are lipid-bound [15]. Among lipid carriers, exosomes attract the most attention due to their suggested participation in intercellular communication and resulting impact on different physiological processes [16].
Thus, the aim of this study was to evaluate the impact of ADPKD on the circulating miRNA profile among patients with different stages of CKD and identify the impact of the hemodialysis procedure on their serum expression levels. Also, we wanted to establish whether the observed changes are observed both in total and exosomal fraction of circulating miRNAs and whether they can be attributed to disease progression or rather to different treatment schemes (hemodialysis).
Material and methods
Patient recruitment
Three groups of patients were recruited to the study: a non-dialyzed ADPKD group, a dialyzed ADPKD group and healthy controls. Non-dialyzed patients with a clinical diagnosis of ADPKD (from unrelated families) and stage 1 and 2 CKD were recruited from the nephrology outpatient clinic between June and December 2014. A second group of 10 individuals with ESRD due to ADPKD, treated with maintenance hemodialysis, was recruited from the Dialysis Department of University Hospital No. 1 of the Medical University of Lodz. Patients were treated with chronic hemodialysis using low flux dialyzers, via arteriovenous fistula as a hemodialysis access. Dialysate parameters were adjusted to individuals patients’ needs based on their current electrolytes levels. All patients received heparin infusion during hemodialysis, the dose of which was individually titrated. Glomerular filtration was estimated with the CKD-EPI formula [17]. A third group of 33 healthy controls (10 for the profiling experiment and pre-post analysis, 23 for the validation study), matched for age with the non-dialyzed ADPKD patients, was recruited from healthy family members of patients treated in the Department of Pediatrics, Oncology, Hematology and Diabetology. The study was approved by the Bioethical Committee of the Medical University of Lodz, Poland. All patients gave their informed consent prior to the study.
Serum miRNA measurements
Fasting serum samples were analyzed in the study. MiRNA was extracted from previously unthawed serum samples with the total miRNA isolation protocol (miRCURY RNA Isolation Kit, Exiqon, Vedbaek, Denmark) as in our previous study on circulating miRNA biomarkers [18]. Additionally, for pre/post-dialysis samples, we used the exosome isolation protocol according to the manufacturer’s instructions (miRCURY Exosome Isolation Kit – Serum and Plasma, Exiqon, Vedbaek, Denmark): this was found to be a feasible alternatives to the ultracentrifugation technique [19].
We used real-time PCR arrays with locked nucleic acid-containing primers (miRCURY LNA; Exiqon, Copenhagen, Denmark) for serum profiling [20]. RNA spike-in control (UniSp6) was used to test the efficiency of the reverse transcription reaction and was added to the samples before reverse transcription. Exiqon real-time PCR human miRNA arrays I and II quantify expression of 752 miRNAs detectable in serum and provide very high sensitivity and reproducibility in comparison with other methods [20]. Data from the healthy control group profiling was previously published in a study on monogenic diabetes biomarkers [21]. The profiling assay was transformed by Global Mean Normalization of miRNAs detectable on all tested arrays [22].
Samples from dialyzed patients with ADPKD were collected before and immediately after the dialysis session. For the pre-/post-dialysis study, we selected six miRNAs, the three most up-regulated and three most down-regulated in dialyzed patients (fold difference for dialyzed vs non-dialyzed ADPKD patients). As two miRNAs from the same family – miR-320a and miR-320b – fulfilled those criteria and had very similar expression profile between the samples (Pearson correlation coefficient exceeded 0.84), we selected the one with the higher fold change: miR-320b. The reference miRNAs for evaluation of relative expression were selected from array profiling data using the NormFinder algorithm [23]. Four miRNAs (let-7b-5p, miR-30b-5p, miR-148b-3p, miR-151a-5p) were identified and the average of their threshold cycles (Ct) was used as the reference for normalization performed using the formula [24]:
Relative expression = 2–(CtmiR – mean Ctof reference miRs)
Undetectable expression (negative result) was reported if expression was not detected after 37 PCR cycles. One patient was withdrawn from the analysis as none of the selected miRNAs were detected in his pre-dialysis serum sample.
Statistical analysis
MiRNAs detectable in at least 6/10 samples in each of the three groups and in more than 60% of all samples were selected for statistical analysis. Differentially expressed miRNAs between groups were called significant if their p-values were lower than 0.05 in analysis of variance with an associated false discovery rate (FDR) < 0.05 (Benjamini-Hochberg procedure). Post hoc comparisons were performed with Student’s t test with a Bonferroni correction. Hierarchical clustering analysis with Euclidean distance and average linkage was used to show grouping of miRNAs and samples. The relationship between expression of different miRNAs was calculated with Pearson coefficient correlation. The ranks between cancer and non-cancer KEGG pathways were compared with the Mann-Whitney test. For paired comparisons, Wilcoxon’s signed rank test was used. Missing data in exosome miRNA expression measurements were recoded as zeroes – the total miRNA isolation protocol yielded no missing values. Diagnostic performance of selected miRNAs was evaluated using area under the receiver operating characteristic (ROC) curve.
Statistical analyses were performed with Statistica 13.1 PL (StatSoft, Tulsa, OK, USA) and MultiExperiment Viewer (Dana-Farber Cancer Institute, Boston, MA, USA).
Bioinformatic prediction of associations between differentially expressed miRNA with miRNA targets (TarBase v7.0), and further with KEGG pathways, was performed with DIANA-mirPath version 3 [25]. Bioinformatic prediction of differentially expressed miRNAs’ associations with diseases was performed using the miR2Disease database [26]. Hsa-miR-423-5p and hsa-miR-423-3p were analyzed together as the miR2Disease database does not provide information about both variants’ associations (6 records for “hsa-miR-423” (no specification on -3p and -5p variant) and only one record for “hsa-miR-423-5p”).
All experiments were performed in accordance with relevant guidelines and regulations.
Power analysis
For the miRNA profiling experiment, the sample size was calculated in order to achieve 80% power with a desired fold change no less than two or less than 0.5, standard deviation 0.5 and with an acceptable one false positive miRNA discovered.
Comparing values obtained before and after the dialysis experiment, we planned our analysis to be able to detect a difference no smaller than one standard deviation of the relative expression. We calculated that we would need to study 10 pairs of subjects to be able to reject the null hypothesis that this response difference is zero with a probability of 0.804 with a type I error probability associated with this test of 0.05.
Results
For the high-throughput profiling experiment, we recruited 30 patients: 10 with early stage of CKD due to ADPKD, 10 with ADPKD and ESRD treated with dialysis and 10 healthy volunteers. The clinical characteristics of the study participants are presented in Table I. Additionally, mean total kidney volume for non-dialyzed patients equaled 1079.31 ±705.42 ml and was significantly lower than in the dialyzed group – 1813.91 ±707.96 ml (p = 0.0390). Most of the patients with ADPKD were diagnosed with arterial hypertension (60% from non-dialyzed group and 90% for dialyzed one). There were no significant differences in mean systolic (SBP) and diastolic blood pressure (DBP) between the groups (SBP: for non-dialyzed patients 130.20 ±17.15 mm Hg vs. 129.09 ±22.12 mm Hg for dialyzed patients, p = 0.9000; DBP: for non-dialyzed patients 84.70 ±12.37 mm Hg vs. 74.55 ±12.14 mm Hg, p = 0.0731).
Table I
Clinical characteristics of the three analyzed groups
Seventy-one miRNAs were found to meet the detectability criteria using miRNA expression profiling data. A comparison of miRNA expression levels between the three groups (Supplementary Table SI) yielded 47 miRNA statistically significant ones (p < 0.05; FDR < 0.05) that perfectly separated the three studied groups (Supplementary Figure S1).
The severity of chronic kidney disease correlates positively with age: our group of dialyzed patients were older than the non-dialyzed ones (Table I). In order to exclude the possibility that the serum miRNA profiles were affected by clinical confounding factors such as age, sex and body mass index (BMI), we adjusted the three-group comparison for those variables and reported the results in Supplementary Table SI. Out of 47 miRNA, ten miRNAs (miR-15a-5p, miR-106a-5p, miR-93-5p, miR-15b-5p, miR-342-3p, miR-335-5p, miR-142-3p, miR-16-2-3p, miR-590-5p, miR-23a-3p) lost their significance after adjusting for confounders and were excluded from further analysis (Figure 1 A).
Figure 1
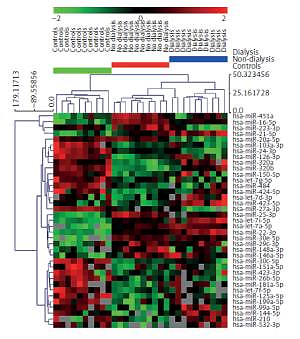
MiRNAs selection procedure performed on serum profiling data (A) and hierarchical clustering of 37 miRNAs whose serum expression data were significant among three groups with ANOVA and after adjustment for age, sex and BMI (B)
On the remaining 37 miRNAs, we performed hierarchical clustering analysis to confirm whether we are able to separate analyzed groups adequately (Figure 1 B). Group separation was maintained, but the dialyzed group split into two clusters, with one (n = 5) more resembling the non-dialyzed group. Nevertheless, patients from the control and non-dialyzed group still constituted separate clusters. The 37 miRNAs entered bioinformatics analyses to evaluate their potential functions and role in biological pathway regulation.
Pathways associated with selected miRNAs
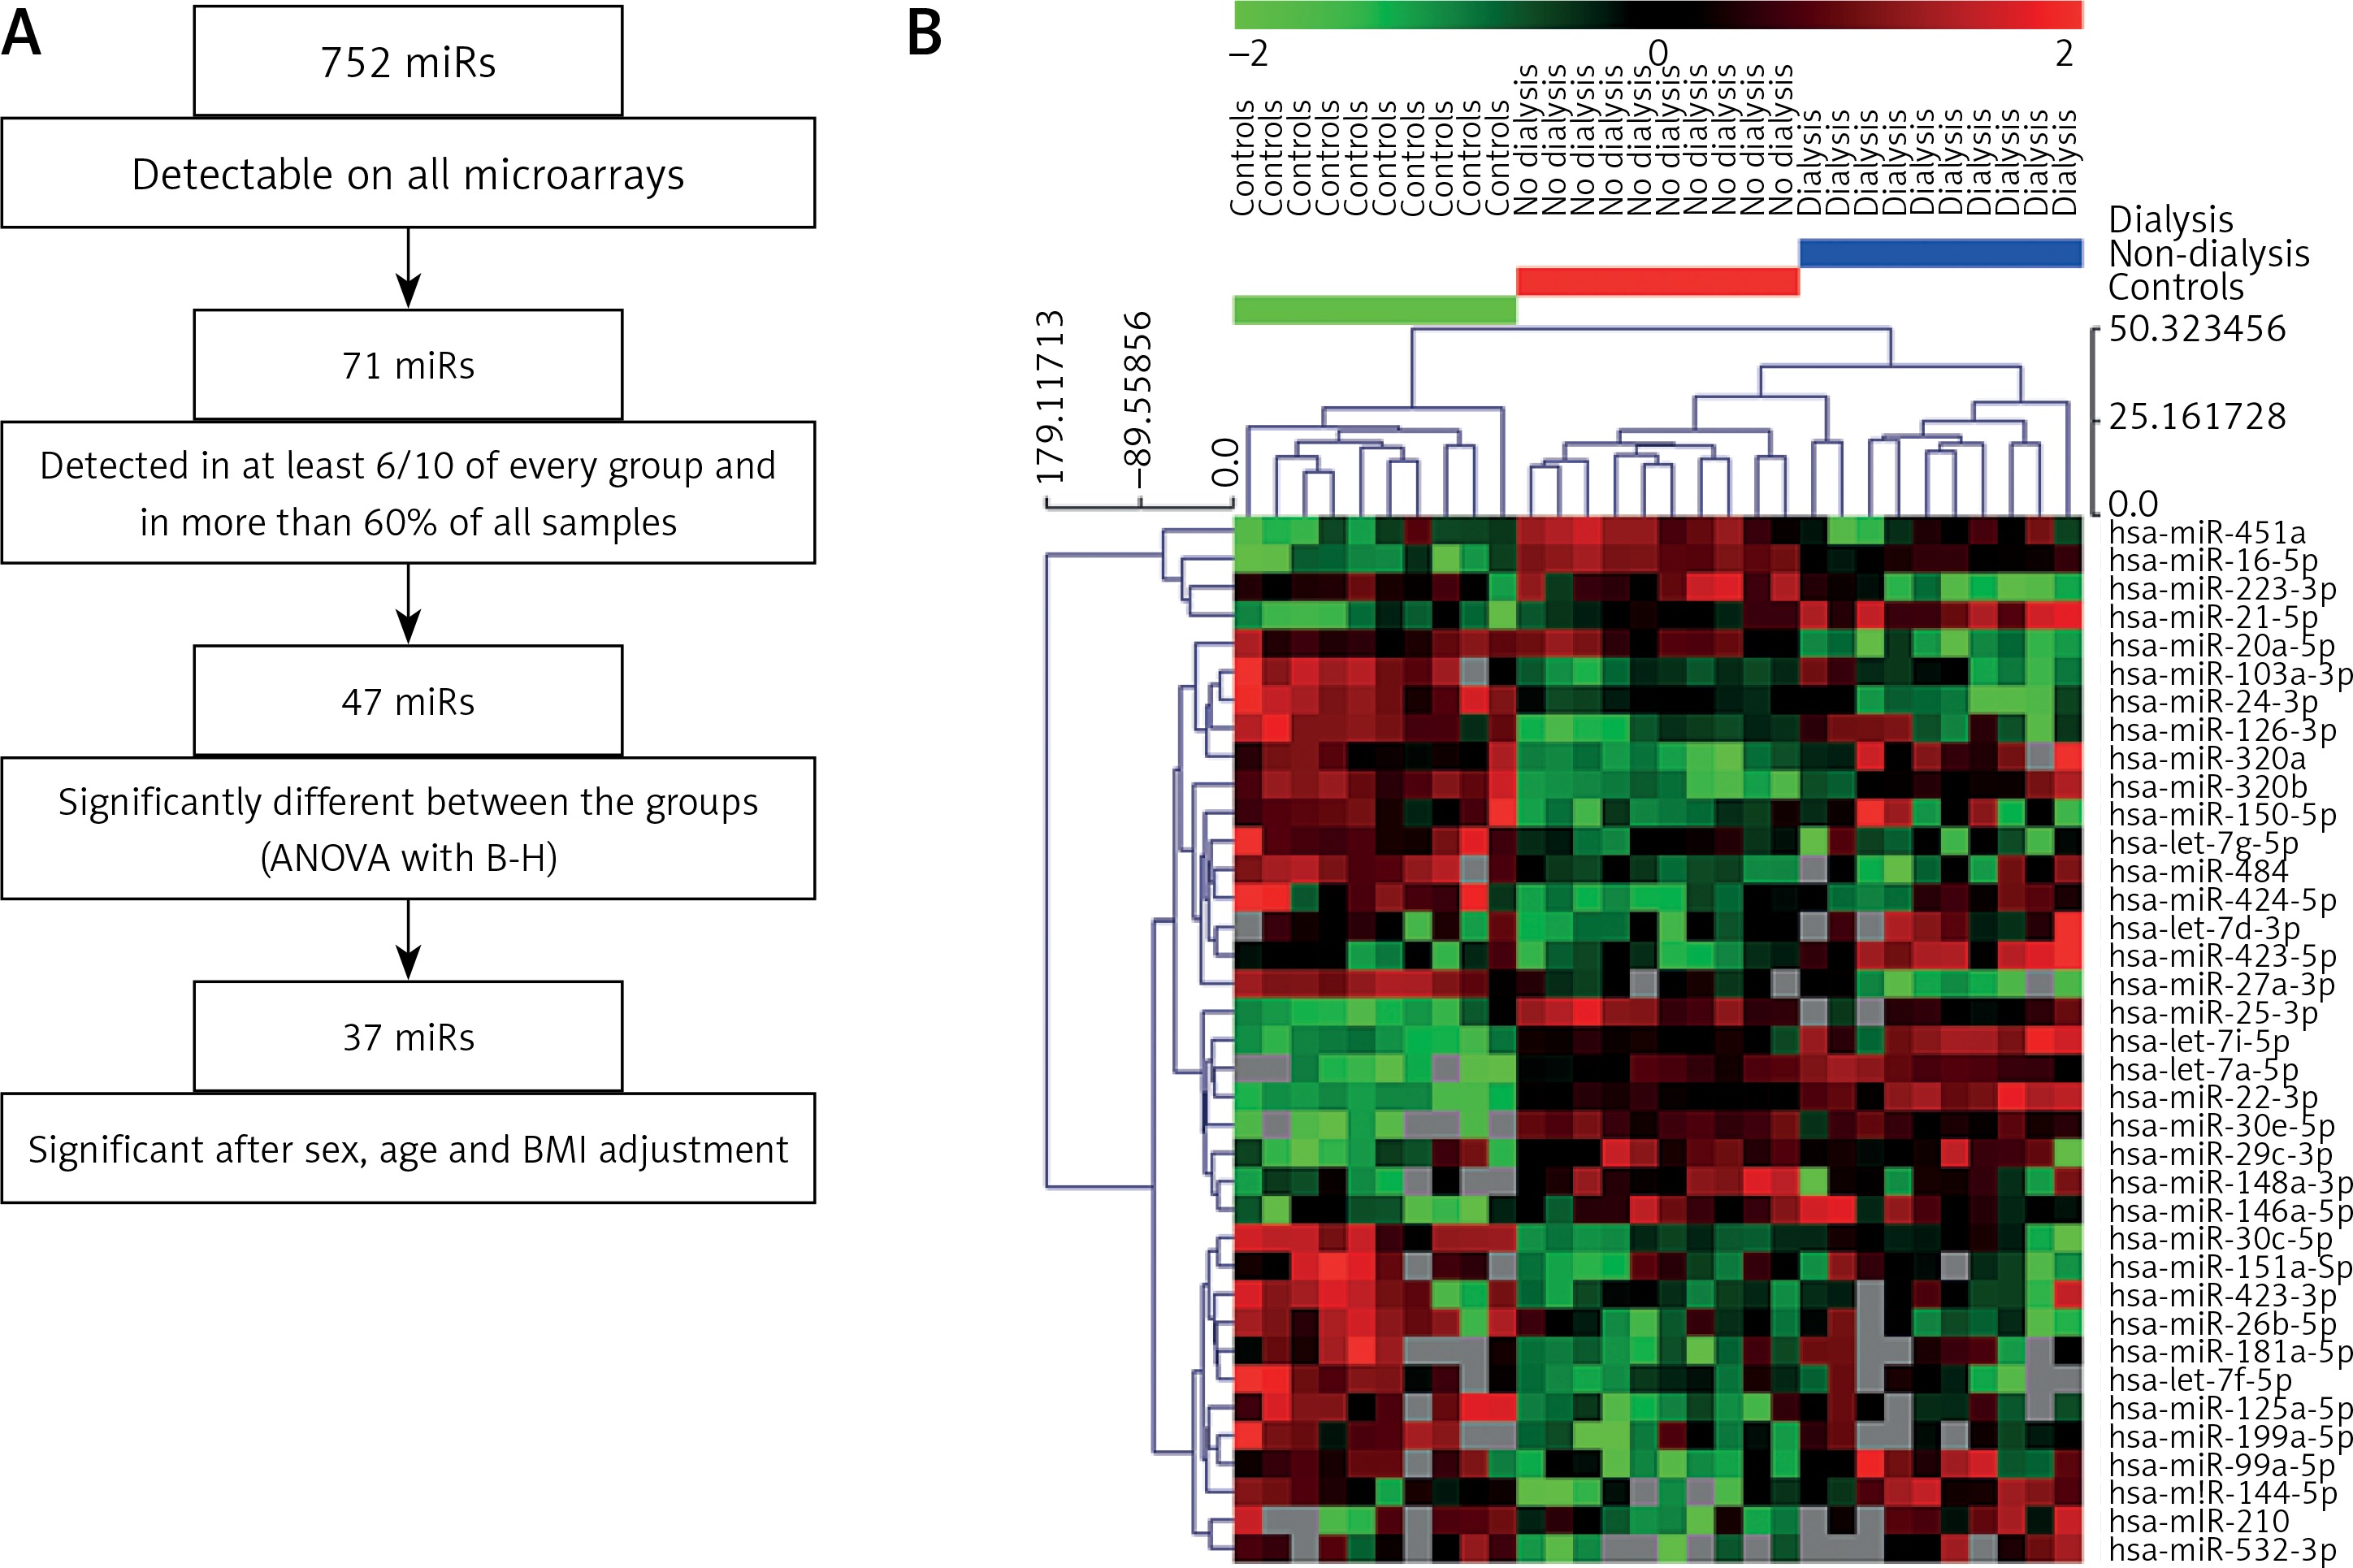
Thirty-seven selected miRNAs were introduced to the DIANA-mirPath v.3 tool [25] in order to search for their targets genes and further commonly regulated pathways. We identified 77 KEGG pathways that were significantly associated with our set of 37 miRNAs. The three highest ranked KEGG pathways (Figure 2 A, Supplementary Table SII) associated with our set of miRNAs were: miRNAs in cancer (35/37 miRNAs associated, p = 2.68E-50), proteoglycans in cancer (35/37 miRNAs associated, p = 7.01E-14) and protein processing in endoplasmic reticulum (36/37 miRNAs, p = 4.92E-11). Together, out of 77 significant KEGG pathways, 19 were cancer-associated pathways and those were significantly higher ranked than other pathways (p = 0.0006 in Mann-Whitney test).
Bioinformatic analysis of diseases related to selected miRNAs
By using the miR2Disease database [26] we identified human diseases that were associated with miRNAs that significantly differed between the analyzed groups. Thirty-five out of the original 37 miRNAs entered into the analysis as two pairs of miRNAs were analyzed together: miR-320a and miR-320b, miR-423-3p and miR-423-5p. We found 769 associations between the 35 miRNAs and 106 diseases. Selected diseases were then grouped in 14 categories (Figure 2 B, Supplementary Table SIII). Most of the dysregulated miRNAs in ADPKD patients were associated with solid malignant tumors (34/35, 97.1%), leukemia/lymphoma/myeloma (24/35, 68.6%) and cardiovascular system diseases (21/35, 6%) (Supplementary Table SIII). In summary, both tools yielded convergent results confirming that the observed dysregulation of miRNA expression may be associated with carcinogenesis. Determining whether the miRNAs play a functional role in the process or are merely passengers of intracellular changes of gene expression will necessitate further, in depth mechanistic studies. Having established that the serum miRNA profile is strongly associated with renal insufficiency, we investigated whether the observed changes are reversed with hemodialysis or are unaffected by the procedure and reflect the general health status of the patient with ADPKD.
miRNAs with the greatest pre- and post-dialysis serum expression differences
We focused our attention on miRNAs that were the most altered between non-dialyzed and dialyzed ADPKD patients and remained significant after age, sex and BMI adjustments: the three with the largest expression difference between dialyzed vs non-dialyzed (miR-532-3p, miR-320b and miR-144-5p) and the three with the greatest decrease of expression between the groups (miR-20a-5p, miR-27a-3p and miR-16-5p). The mean expression of selected reference miRNAs’ Ct values did not change significantly after dialysis either in the total miRNA fraction (p = 0.0843) or in the exosome fraction (p = 0.7178).
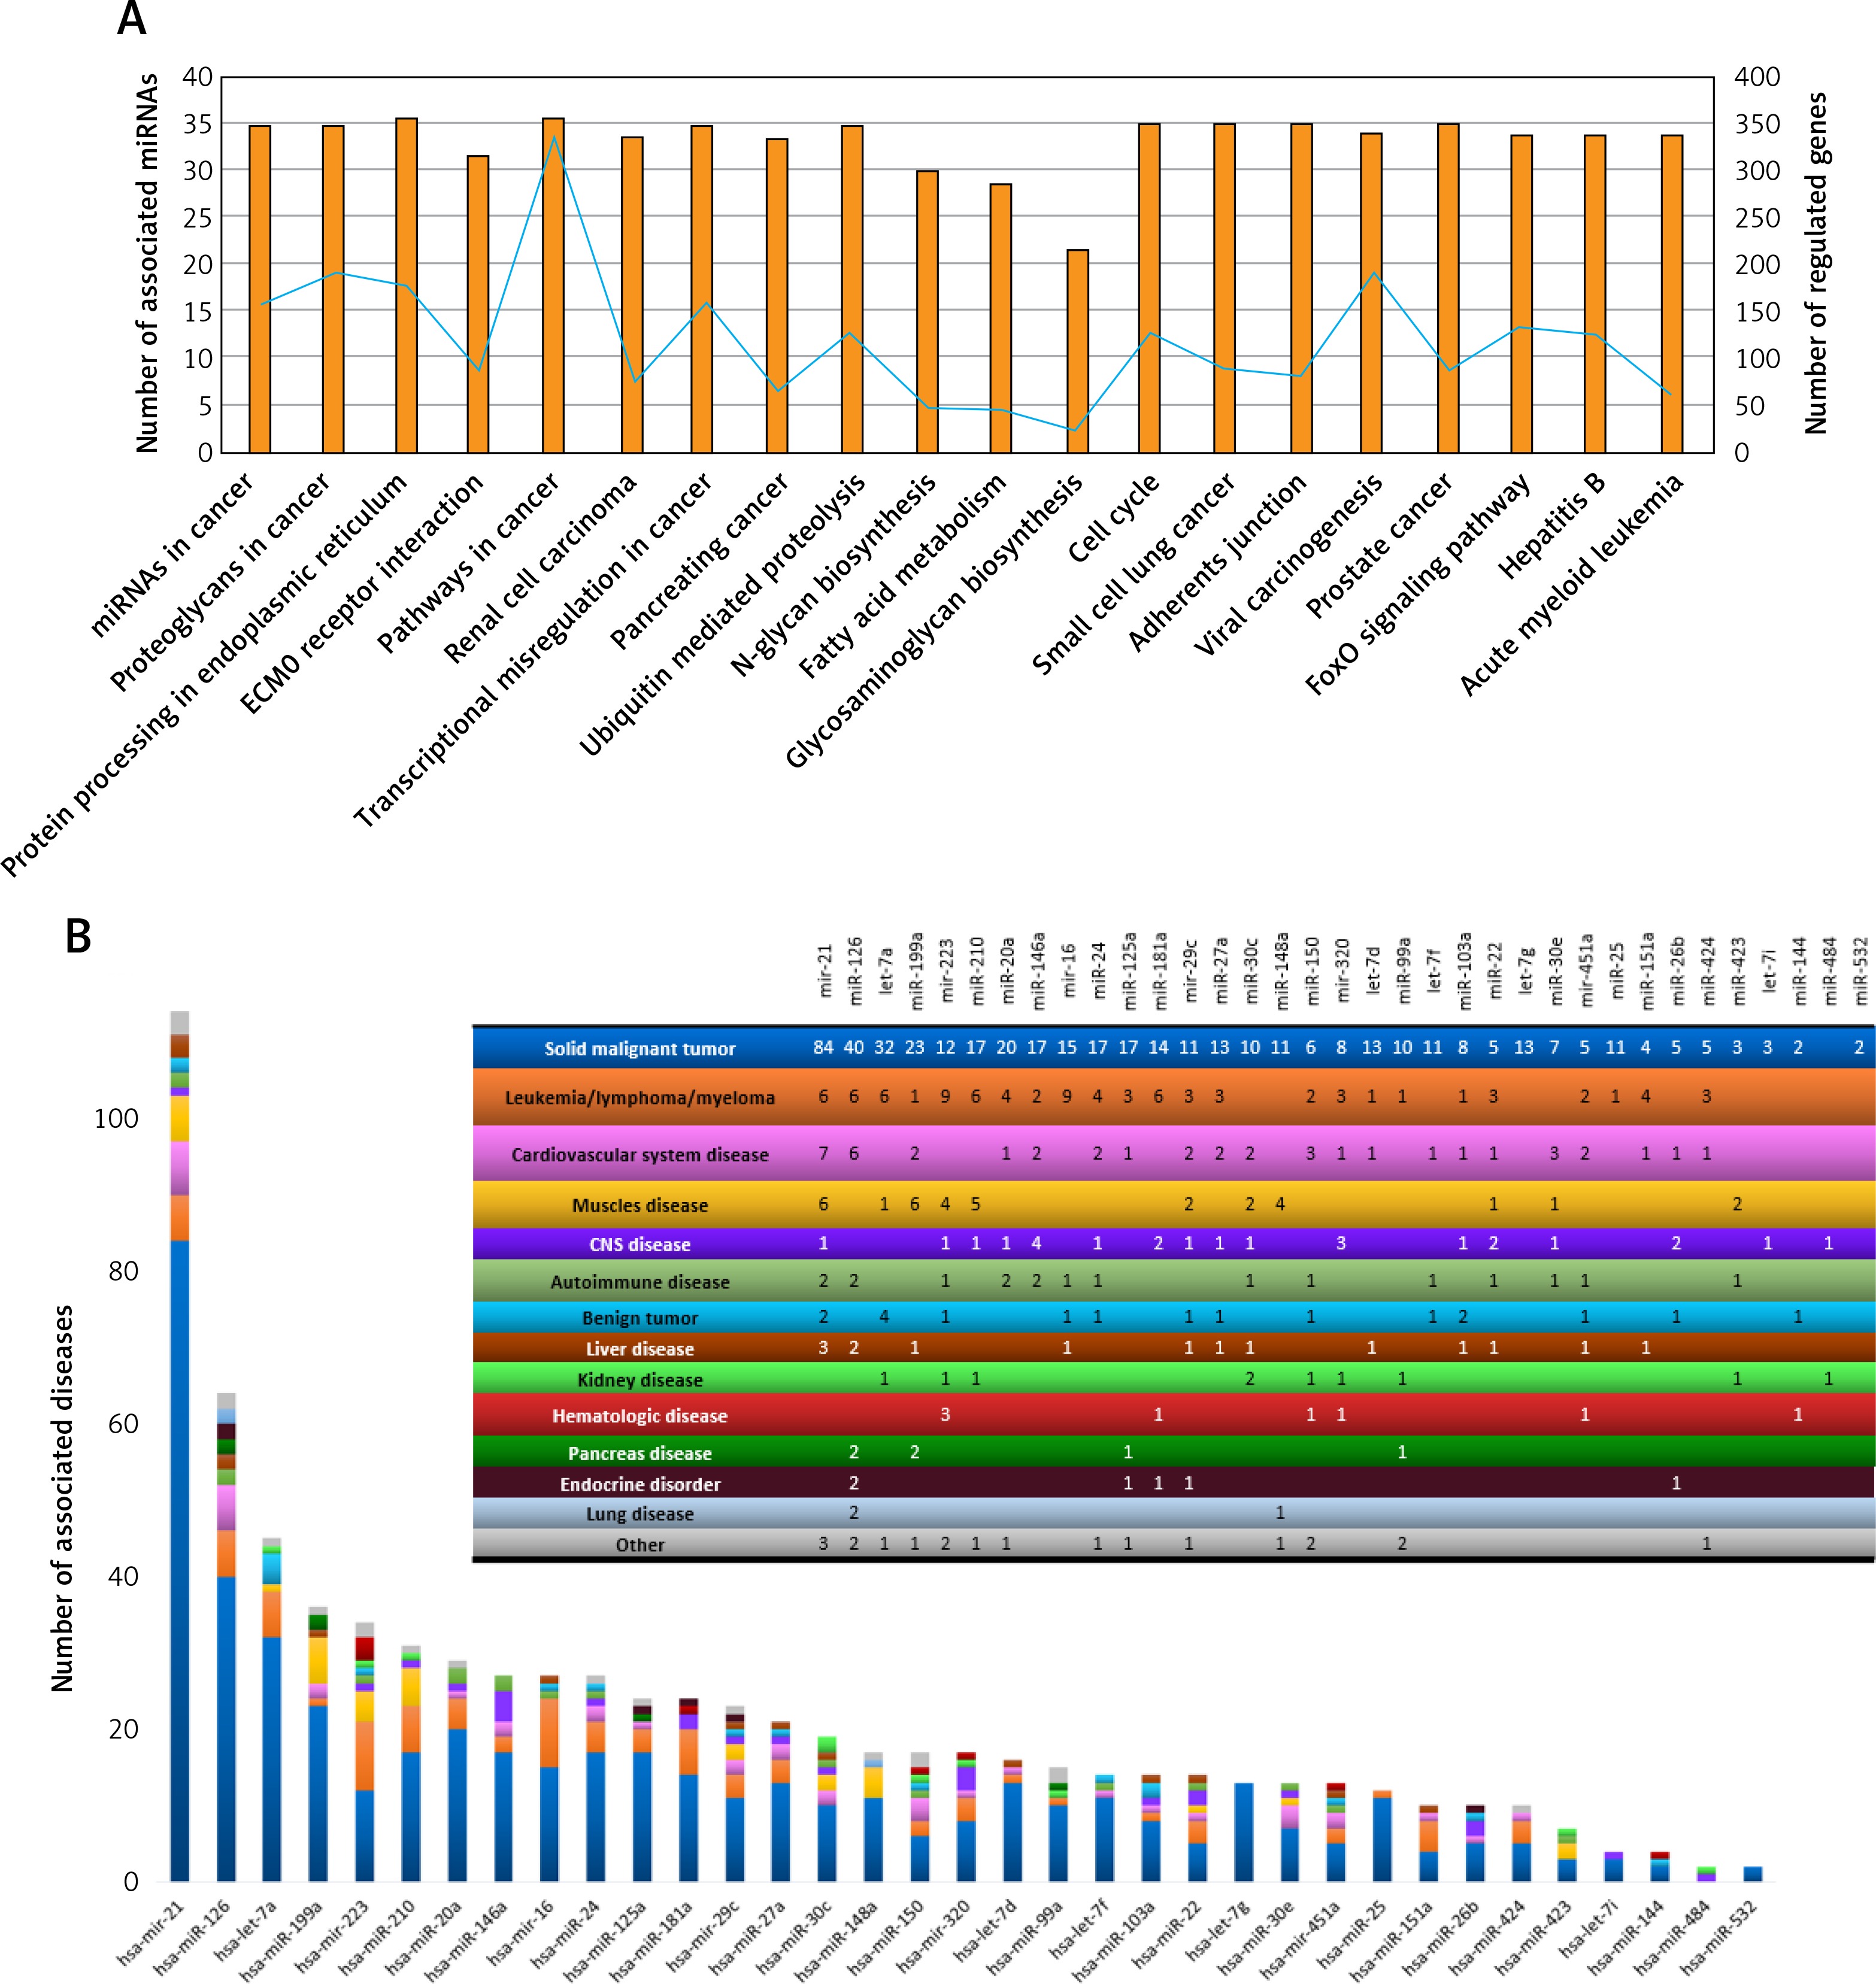
All three miRNAs with increased expression in dialyzed patients in comparison to non-dialyzed ones were not altered significantly by the hemodialysis procedure: miR-532-3p FCtotal = 1.1 ±0.6, p = 0.5147 and FCexosomes = 1.8 ±2.5, p = 0.8886 (Figures 3 A, B); miR-320b FCtotal = 1.34 ±1.1, p = 0.9526 and FCexosomes = 2.6 ±4.9, p = 0.6784 (Figures 3 C, D); miR-144-5p FCtotal = 1.5 ±1.1, p = 0.5940 and FCexosomes = 1.0 ±0.8, p = 0.5002 (Figures 3 E, F).
Figure 3
Relative expression of three miRNAs before and after dialysis with highest fold change between dialyzed vs non-dialyzed patients in serum profiling data (dialyzed vs. non-dialyzed ADPKD patients). Expression level was measured after standard RNA isolation protocol (total) and after exosome isolation (exosomes); hsa-miR-532-3p: total (A), exosomes (B); hsa-miR-320b: total (C), exosomes (D); hsa-miR-144-5p: total (E), exosomes (F)
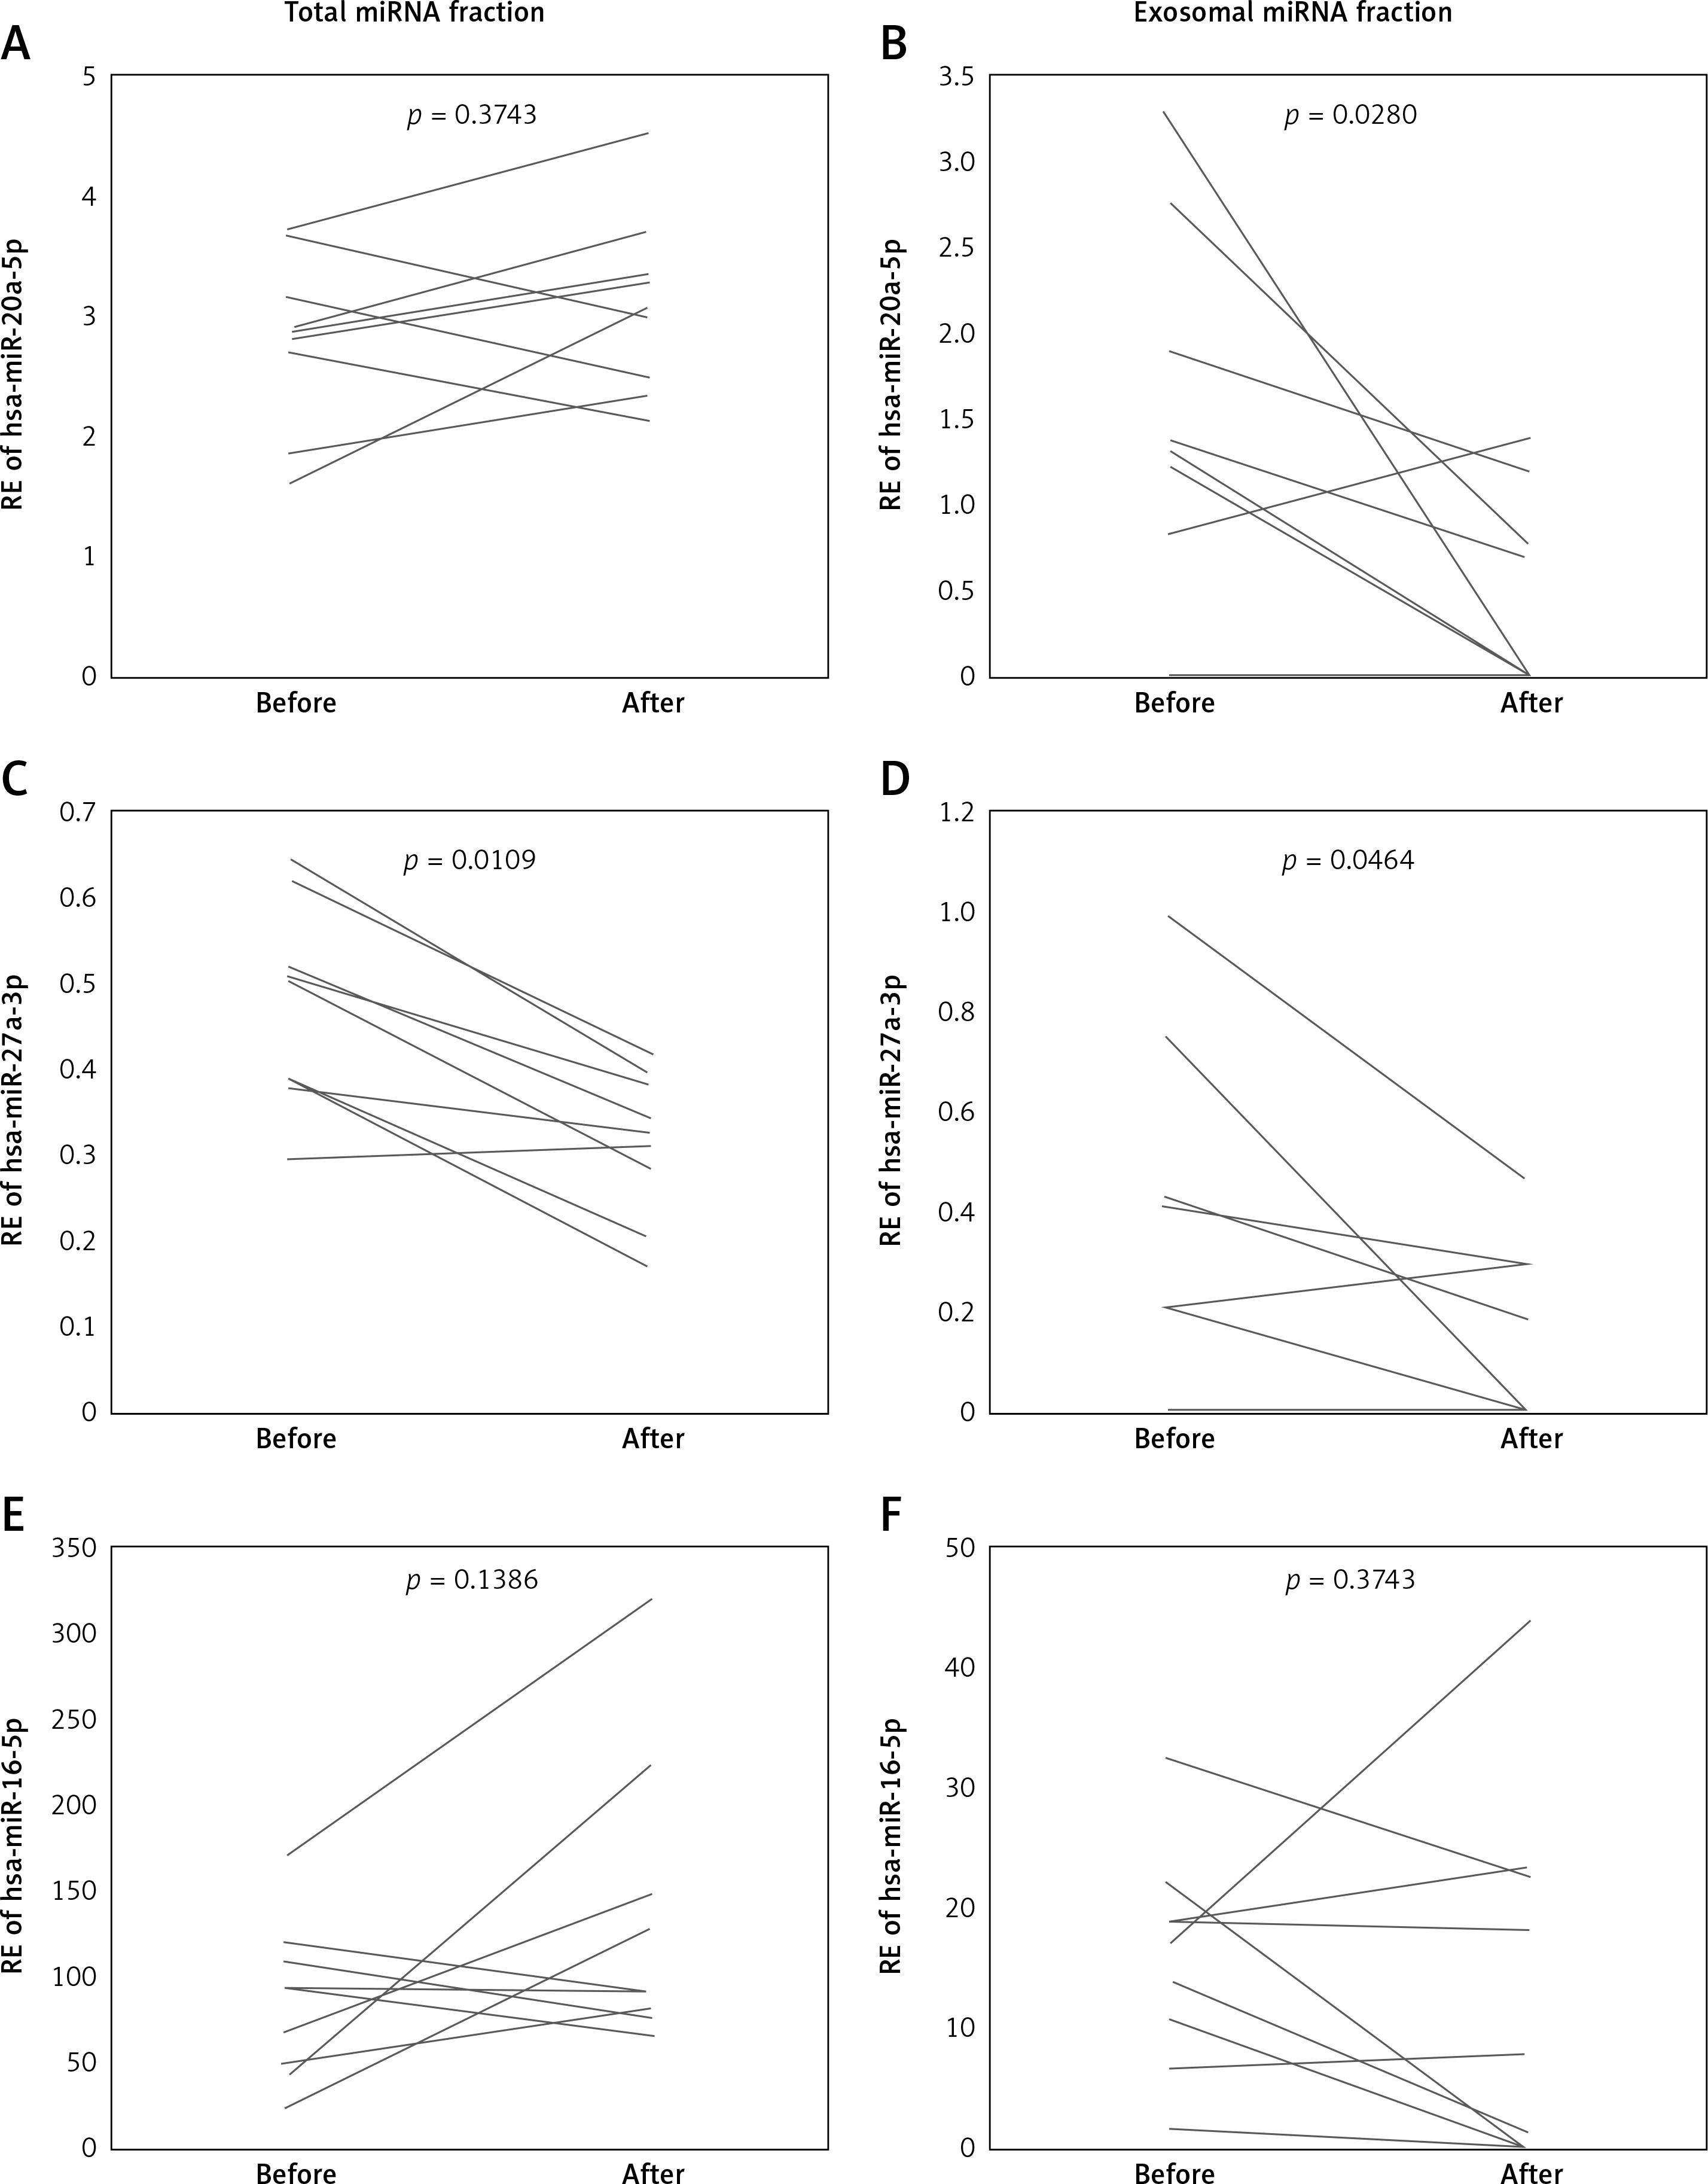
Among the miRNAs which decreased in dialyzed patients, serum expression of miR-27a-3p decreased significantly after the dialysis procedure in both total and exosomal fractions (FCtotal = 0.7 ±0.2, p = 0.0109 and FCexosomes = 0.7 ±0.5, p = 0.0464, Figures 4 A, B). MiR-20a-5p serum expression decreased after dialysis but only in the exosomal fraction (FCtotal = 1.2 ±0.3, p = 0.3743 and FCexosomes = 0.6 ±0.6, p = 0.0280, Figures 4 C, D). Serum levels of miR-16-5p were unaffected by hemodialysis in both total and exosomal fractions (FCtotal = 2.0 ±1.6, p = 0.1383 and FCexosomes = 0.7 ±0.8, p = 0.3743, Figures 4 E, F).
Figure 4
Pre- and post-dialysis relative expression level of three miRNAs with lowest fold change between dialyzed vs non-dialyzed (patients in serum profiling data (dialyzed vs. non-dialyzed ADPKD patients). Expression level was measured after standard RNA isolation protocol (total) and after exosome isolation (exosomes); hsa-miR-20a-5p: total (A), exosomes (B); hsa-miR-27a-3p: total (C), exosomes (D); hsa-miR-16-5p: total (E), exosomes (F)
Alteration in circulating members of miR-17 family
The miR-17 family was recently recognized as a therapeutic target for ADPKD treatment [12], which urged us to investigate its representatives in our study. Among miRNAs belonging to the miR-17~92 cluster (miR-17, miR-18a, miR-19a, miR-20a, miR-19b-1, miR-92-1) only miR-20a was found to be decreased among dialyzed ADPKD patients compared to non-dialyzed patients (FC = 0.3, p = 0.0054) but it did not differ between non-dialyzed and healthy controls (FC = 1.0, p = 1.0) (Supplementary Table SI). We looked into the evolution paralogues of the miR-17~92 cluster: miR-106a~363 cluster (miR-106a, miR-18b, miR-20b, miR-19b-2, miR-92-2, miR-363) and miR-106b~25 cluster (miR-106b, miR-93 and miR-25) [27]. We found that miR-106a-5p was altered among dialyzed patients vs non-dialyzed (FC = 0.4, p = 0.0142 for miR-106a) and miR-93-5p was at the border of statistical significance (FC = 0.4, p = 0.0538 for miR-93). The expression of these two miRNAs did not differ significantly between non-dialyzed and control patients (FC = 1.0, p = 1.0 for miR-106a-5p and FC = 1.1, p = 1.0 for miR-93-5p), similarly to miR-20a. Interestingly, miR-20a, miR-106a and miR-93 are from the same seed family (AAAGUG), which may suggest their similar biological functions. Also, the expression of the three miRNAs was strongly correlated: r = 0.79, p < 0.0001 for miR-20a-5p and miR-106a-5p; r = 0.63, p < 0.0001 for miR-20a-5p and miR-93-5p; r = 0.63, p < 0.0001 for miR-106a-5p and miR-93-5p. Considering all this, we decided to validate whether miR-106a-5p and miR-93-5p changed significantly due to hemodialysis in parallel to miR-20a-5p. MiR-106a-5p and miR-93-5p did not show significant dialysis-dependent changes in total RNA fraction (FCtotal = 1.0 ±0.3, p = 0.9528 for miR-106a-5p, FCtotal = 1.01 ±0.1, p = 0.2135). However, their expression in the exosomal fraction decreased strongly after dialysis (FCexosomes = 0.5 ±0.9, p = 0.0506 for miR-106a-5p; FCexosomes = 0.5 ±0.4, p = 0.0117). Thus, we found that miR-20a-5p, miR-106a-5p and miR-93-5p change similarly due to CKD progression among ADPKD patients on hemodialysis, suggesting their common functional role as circulating molecules.
miRNAs as biomarkers of ADPKD
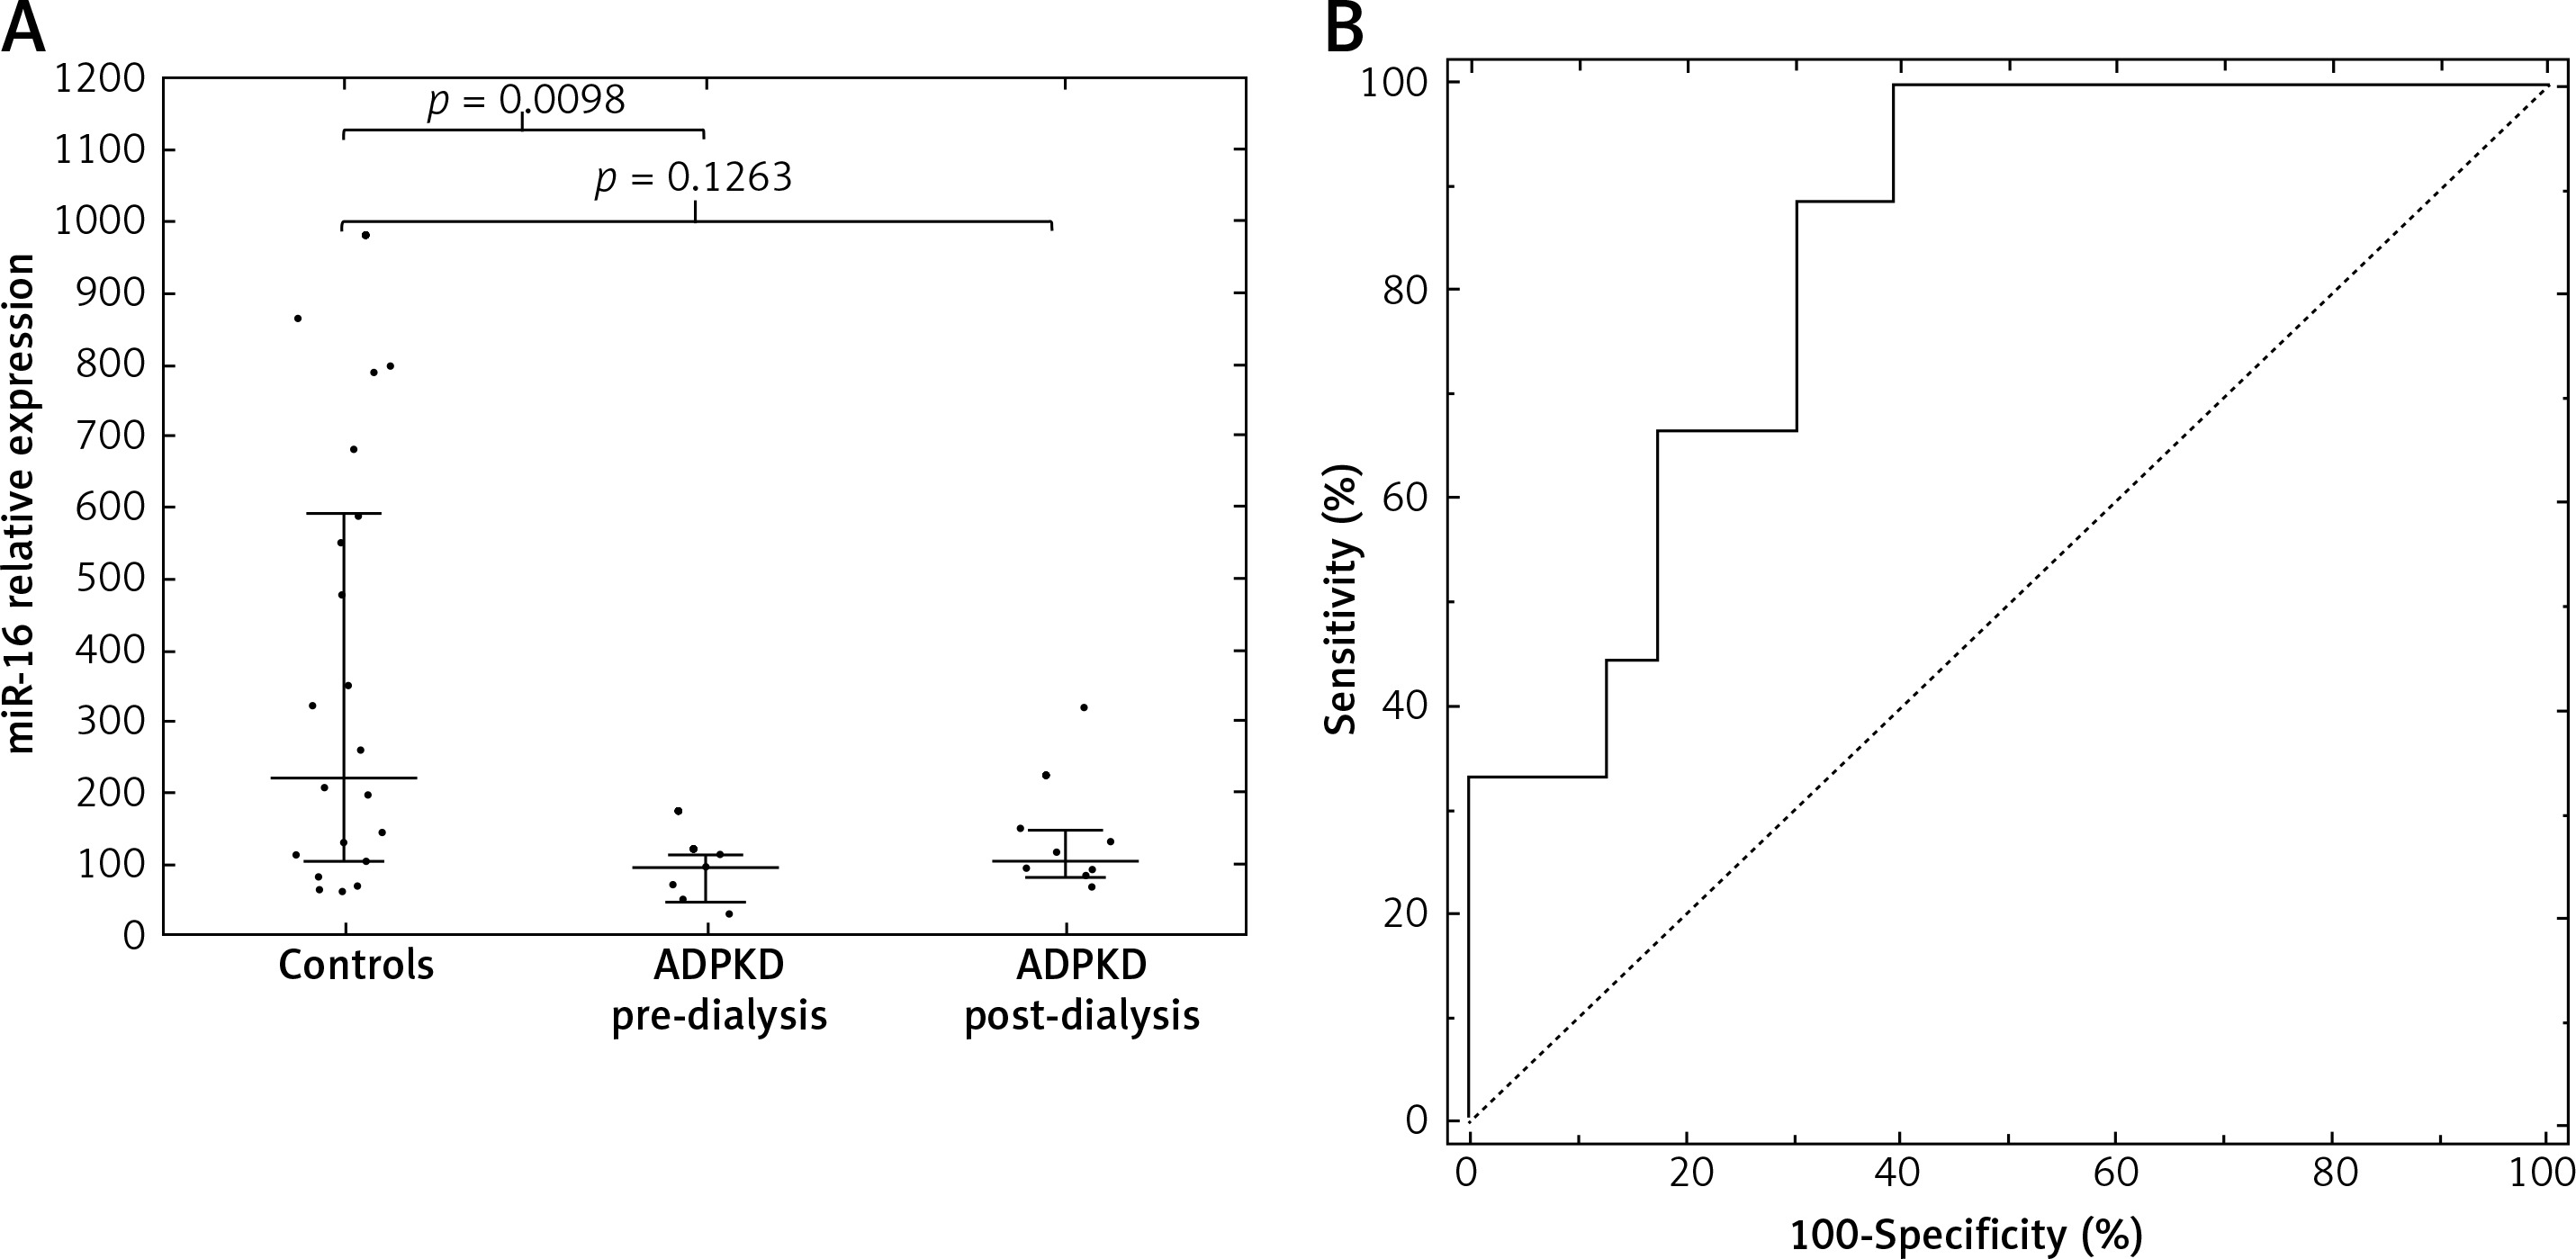
To identify the best miRNA biomarker of ADPKD, 37 significant miRNAs were searched for those in more than 90% of all samples (17 miRNAs) and those with an AUROC (area under receiver operating curve) equaling 1.0 (95% CI: 1.0–1.0) were selected (Supplementary Table SI, Supplementary Figure S2). Thus, we selected four miRNAs: miR-22-3p, miR-16-5p, let-7i-5p, miR-24-3p. By using logistic regression modeling with 10-fold cross-validation and backward stepwise variables selection we chose miR-16-5p as the best biomarker of ADPKD with perfect separation of the groups and good fit (p from Hosmer-Lemeshow test = 1.0). Notably, miR-16-5p was one of the miRNAs unaffected by dialysis in the pre/post-dialysis experiment. To evaluate whether the differences were group specific, we measured the expression of miR-16-5p (and the four reference miRs) in an independent group of 23 healthy controls (12M/11F, average age 28.2 ±5.3 years). Both the dialyzed and non-dialyzed groups showed lower miR-16-5p serum levels than those noted in controls, with a significant difference observed between the control and non-dialyzed groups (Figure 5 A) and the primary group. Moreover, using miR-16-5p as a biomarker allowed efficient discrimination between the non-dialyzed ADPKD patients and controls, with an area under the ROC of 0.84 (95% CI: 0.70–0.98, Figure 5 B).
Discussion
Our results show profound alterations in the serum miRNA profiles of ADPKD patients. We also found that the representatives of the miR-17 family sharing the same seed region change are down-regulated in their exosomal fraction due to hemodialysis. Finally, we identified miR-16-5p as a widely detected biomarker of ADPKD or kidney dysfunction.
The search for circulating biomarkers for various diseases expanded from cancer prediction studies to many different disease [28–30]. The direct link between pathophysiology of the disease and the disease biomarkers may however be elusive and hard to isolate as there are numerous mechanisms associated with changes within the bloodstream, especially when taking into consideration that miR-16, according to miRTarBase [31], is not directly associated with regulation of expression of PKD1 or PKD2.
In contrast to our study, among patients with chronic kidney disease caused by type 1 diabetes mellitus, circulating miR-16-5p was found to be down-regulated [32]. This may suggest that miR-16-5p is not a general CKD biomarker but rather could be specific to ADPKD-CKD. However, it can also be caused by CKD-associated comorbidities, especially involving the cardiovascular system [33]. In fact, circulating miR-16-5p was previously found to be predictive for left ventricle dysfunction after acute myocardial infarction [34].
Taking into consideration the overlapping function of miRNAs, their functional impact should be analyzed for set of a changed miRNAs rather than a single biomarker.
The highest ranked KEGG pathway associated with our set of altered miRNAs was the MicroRNA in the Cancer pathway, which may suggest that a changed serum miRNA profile may be associated with altered cancerogenesis among ADPKD patients. Polycystic kidney disease was associated with both an increased and decreased risk of cancer. In a recent epidemiological study where patients with ADPKD without ESRD were found to have almost twice the probability of developing cancer compared to patients with non-polycystic kidney disease, the most frequent types of malignancies observed were cancers of the liver, colon and kidneys [35]. But in the study of ADPKD kidney transplant recipients after adjusting for potential confounders their cancer risk seemed lower than in non-ADPKD transplant recipients [36]. One possible explanation is that the altered risk of cancer among ADPKD patients might be attributable to changes in miRNA expression occurring due to the malfunction of PKD1 and PKD2 proteins, implicating miRNAs as secondary mediators of tumorigenesis. However, as those changes are associated with tissue expression of miRNA and serum expression does not usually correlate with the one within cells [37] those results are speculative.
The functional implications of altered serum expression of miRNAs merit attention, as the serum levels were already reported to be reflective of the intracellular milieu, where they exert their biological action [38]. Recently, the microRNA-17 family was selected as a promising drug target to treat ADPKD [12]. This family includes members of the miR-17~92 cluster, miR-106a~363 cluster and miR-106b~25 cluster. Three of these miRNAs differed significantly in our initial comparison (miR-20a-5p, miR-106a-5p and miR-93-5p). Interestingly, according to miRTarBase [31] miR-20a-5p directly targets the PKD1 gene, as confirmed by a reporter assay experiment. After adjustment for age, sex and BMI only miR-20a-5p remained statistically significant and after dialysis its serum exosome expression decreased significantly. However, miR-93 and miR-106a also dropped significantly after dialysis in the exosomal fraction, as did miR-20a-5p. In living organisms, a drop in the level of circulating levels of a miRNA is generally due to two mechanisms: the lowering of its expression within cells or its increased internalization. As the time of dialysis is short, it is more probable that the decrease of these three miR-17 family miRNAs is due to internalization if assuming that dialysis itself does not wash out those miRNAs or that the miRNAs were not absorbed on a filter membrane. This may be associated with different types of cells: from tubular cells, podocytes, inflammatory cells to mesenchymal stem cells [39].
Given the fact that typical biomarkers of ADPKD progression used in drug clinical trials (eGFR, kidney volume or cyst volume) typically need a long observation time (approximately 1 year) [40–41] serum miRNAs may be useful, more rapid indicators of kidney function as soon as 24 h after a stimulus [42].
There are some limitations in our study due to its exploratory nature. The number of patients, established using power analysis, was planned to assure discovery of the most pronounced differences in serum miRNAs (doubling or reducing by half). As this number of patients was adequate for the exploratory study, further investigations of the functional impact or biomarker utility of the CKD-associated miRNAs should validated in a much larger cohort. Additionally, our dialyzed patients were significantly older than other analyzed groups; as this could affect the results, we had to adjust the comparisons to age. We also cannot exclude effects of other cofounding factors such as comorbidities [43], hemodialysis settings or supporting treatment, on observed difference in serum miRNAs profile. Patients on hemodialysis received erythropoietin and heparin treatment, which could affect miRNA expression. As we did not profile miRNAs among patients with an underlying cause other than ADPKD, we cannot attribute observed miRNA changes to ADPKD directly as they may also be uniform for all CKD diseases – this needs further investigation at the cellular level. However, recent research of Hajarnis et al. on the miR-17 family in ADPKD seems to support our hypothesis that some observed circulating miRNA changes may be specific to ADPKD [12].
In conclusion, we report vast dysregulation of serum miRNA among ADPKD patients and its possible links with cancer risk and ESRD comorbidities. The exosomal fraction of miRNA was more affected by dialysis than the total one, suggesting that miRNAs are internalized and exosomes play a functional role or are lost during dialysis. Among the dialyzed patients there was a common pattern of down-regulation for three circulating miR-17 family members (miR-20a, miR-106a-5p and miR-93-5p) sharing the same seed region. Additionally, the hemodialysis procedure itself decreased exosomal expression of those miRNAs.