Introduction
Thyroid cancer (TC) is the most prevalent malignancy of endocrine system. According to the newest official estimates of the American Cancer Society [1], 64,300 new patients were diagnosed with TC in 2016, out of a total of 66,730 new cancer cases in the endocrine system. There was a higher incidence in females, with the estimate of 49,350 new diagnosed TC female patients. It is predicted that TC will become the third most common cancer in women by 2019 [2]. The average annual growth in the incidence of TC was about 5.3% in males and 3% in females, from 2008 to 2012. The growing incidence partially results from the advanced clinical detection of occult cancers through imaging and pathology [3]. Papillary thyroid cancer (PTC) accounts for the majority of TC and is characterized by its morphology [4]. Although the 5-year survival rate of PTC is higher than 90% and several treatments have been investigated [5, 6], effective treatments and diagnostic strategies based on the molecular mechanism are still needed.
MicroRNAs (miRNAs) are small non-coding RNAs consisting of 20 to 22 nucleotides. In most cases, they are excised from fold-back RNA precursors consisting of 60 to 110 nucleotides [7, 8]. MiRNAs have been identified to be crucial in some biological processes, such as development, differentiation, apoptosis and proliferation [9], by means of pairing imperfectly with target protein-coding messenger RNAs (mRNAs) and regulating their expression during or after transcription [10, 11]. Abnormal expression of miRNAs has been found by researchers in many types of human tumors, after B-cell chronic lymphocytic leukemia was initially detected to be relevant with miRNA regulation [12]. For example, Iorio et al. investigated the deregulation of miRNAs in breast cancer [13] and Ciafre et al. reported on glioblastoma and the corresponding miRNAs [14]. In some specific tumors, both abnormally expressing protein-coding genes and miRNAs have been observed [15]. With the emergence of further studies, more and more linkages between miRNAs and carcinoma cells are identified. It has become clear that both over-expressed and down-expressed miRNAs exist in cancer cells. With respect to PTC, there is a considerable amount of studies published in the recent years. For instance, miR-663 and miR-199a-5p were reported to target transforming growth factors and suppressed TC progression [16, 17], and miR-96 is identified to be oncogenic by targeting tumor suppressors [18]. It is possible that miRNAs are involved in the initiation process of PTC cells [19, 20]. The fold change of aberrantly expressed miRNAs in PTC could vary from 10 to 20 fold, which has been considered as a biologically significant characteristic of PTC [19]. This is due to the fact that a large quantity of genes could be the targets of a specific kind of miRNA, and a specific gene could be targeted by many miRNAs [15]. Moreover, the interaction between miRNAs may lead to antagonistic or accumulating consequences [21].
Recent studies have revealed the role of miR-509 in some aspects. Xing et al. reported that miR-509 suppressed breast cancer cells from metastasizing to brain by modulating RhoC and TNF-α [22]. Su et al. clarified the proliferation-inhibiting effect of miR-509-3p in renal cell carcinoma [23]. Ren et al. identified that miR-509-5p could be a regulator involved in the Mdm2/p53 feedback loop [24]. There have been some studies that correlated cancers with secreted frizzled-related protein 1 (SFRP1). For instance, Kalmár et al. revealed that hyper-methylation of SFRP1 could contribute to the formation of colorectal cancer by reducing gene expression [25]. Jiang et al. confirmed that SFRP1 plays an oncogenic role in glioblastoma [26]. We found that miR-509-5p and SFRP1 could potentially be matching in PTC cells, according to TargetScan. In this study, it was discovered that miR-509-5p promoted the proliferation and invasion of PTC cells by directly suppressing SFRP1.
Material and methods
Tissue samples
Samples from PTC tumors (n = 40) and paired adjacent thyroid tissues (n = 40) (located more than 3 cm from tumor borders) were taken from patients who underwent their first surgical excision at Linzi District People’s Hospital, from 2014.10 to 2015.10. Fresh tissue samples were frozen in liquid nitrogen and stored in refrigerator at –80°C. All the patients were diagnosed with PTC by three pathologists and did not receive other treatments including radioisotopes I131 and thyroid-stimulating hormone suppression.
Cell culture, transfection and grouping
Human PTC cell lines (K1, TPC-1 and BCPAP), normal thyroid cell line HT-ori3 and human embryonic kidney cell line 293T were all purchased from ATCC (American Type Culture Collection, USA).
TPC-1 cells were assigned to five groups: (1) Control group; (2) miR-509-5p mimic group; (3) negative control (NC-1) group; (4) miR-509-5p inhibitor group; (5) miR-inhibitor-NC group. Cell transfection was conducted 24 h after cell inoculation by Lipofectamine 2000 reagent (Invitrogen, USA) strictly following the kit instructions. Mimics and inhibitors as well as negative controls were purchased from GeneChem company.
TPC-1 cells were assigned to three groups: (1) cDNA-NC (NC-2); (2) SFRP1 cDNA group; (3) Mix group (co-transfected with SFRP1 cDNA and miR-509-5p). Cell transfection was conducted 24 h after cell inoculation using Pgcsil-008 lentiviral reagent (GeneChem, China) strictly following the manufacturer’s instructions.
Real-time PCR (RT-PCR)
Total RNA was extracted from the tissues and cells using TRIZOL solution (Invitrogen, USA). A RT-PCR kit (Invitrogen, USA; product code: C10572-014) was used to conduct reverse transcription and RT-PCR. The amount of each transcript was quantified using the2–(–ΔΔC_t) method. The primers for the PCR of miR-509-5p, SFRP1 and the internal reference U6 and GAPDH are given in Table I. Gene expression changes were quantified using the ΔΔCT method.
Western blot
Transfected cells were cultured for 48 h and then total protein was extracted. The total proteins were separated by SDS-PAGE. The proteins were then transferred to a PVDF membrane (Millipore, USA). PBST containing 5% skim milk was used to block the membrane for 2 h at 37°C. The membranes were then cultured for 12 h at 4°C with the primary antibodies against related proteins (1 : 4000, Abcam, UK). HRP-conjugated secondary antibodies (Abcam, UK) diluted at 1 : 900 were incubated with the membrane. All experiments were normalized to GAPDH.
MTT assay
Transfected TPC-1 cells were suspended to 1.5 × 10⁴ cells/ml and then seeded into 96-well plates at the density of 100 μl/well. Cell viability was respectively evaluated after incubation for 24 h, 48 h and 72 h. Briefly, 20 μl of 5 mg/ml MTT solution (Sigma, USA) was added to every well and 150 μl DMSO (Sigma, USA) was used to dissolve the excessive dye solution. The optical density (OD) of cells in each well was detected by a microplate reader (BioTek) at 450 nm. Each sample was tested with three replicates.
Plate clone formation assays
Well-grown TPC-1 cells after transfection were trypsinized and seeded in 6-well plates at 400 cells per well, followed by incubation at 37°C, 5% CO2 for 2 weeks. The colonies on plates were washed three times with PBS, fixed with 95% ethanol and stained with 0.1% crystal violet. When the plate was dried, the number of visible colonies was counted (250 cells for one clone).
Transwell assays
Transwell migration assays
Transwell chambers without coated Matrigel were used to investigate the migration behavior of transfected TPC-1 cells. All cells were grown as adhesive monolayers in a humidified atmosphere of 5% CO2 in air at 37°C using Dulbecco’s modified Eagle’s medium (DEME) medium fortified with 10% fetal bovine serum. Cells were added to upper chambers and 500 μl of DMEM containing 10% fetal bovine serum was added to the lower chamber. After incubation for 24 h, the TPC-1 cells that invaded through the membrane were dyed and counted under a microscope (200×).
Dual luciferase reporter assay
PmirGLO-SFRP1 3′-UTR vectors were constructed by cloning SFRP1 3′-UTR sequences containing miR-509-5p binding site into the pmirGLO vectors and co-transfected into human embryo kidney 293T cells together with miR-509-5p mimics or mimics NC and Renilla Luciferase internal plasmids (pRL-CMV) using Lipofectamine 2000. Similarly, PmirGLO-SFRP1 3′-UTR-mut vectors were constructed by cloning mutated SFRP1 3′-UTR to the pmirGLO vectors, which were co-transfected with miR-509-5p mimics or mimics NC and Renilla Luciferase internal plasmids (pRL-CMV) using Lipofectamine 2000. Then we measured the luciferase activity using the dual-Luciferase Reporter assay kit (Promega, USA) 48 h after transfection. Firefly luciferase activities were presented as Sample Firefly/Renilla/Control Firefly/Renilla.
TCF/LEF luciferase assay
Transfected TPC-1 cells were seeded to 96-well plates (1.5 × 10⁵ cells/well). TOPFlash, FOPFlash or pRL-TK vectors were transfected to the cells 48 h after the seeding. Then the dual-Luciferase Reporter assay kit (Promega, USA) was adopted to measure the luciferase activity. Firefly luciferase activities were normalized to Renilla luciferase activities and the luciferase activity was presented as Sample Firefly/Renilla/Control Firefly/Renilla.
Tumor formation in nude mice
The experimental protocol was approved by the local institution. Four-week old female BALB/C nude mice (Chinese Academy of Sciences, Shanghai, China) were injected subcutaneously with a total of 1 × 10⁷ cells suspended in 100 μl 1×PBS. Mice injected with TPC-1 cells transfected with miR-509-5p mimics and inhibitors were sacrificed at 36 days after injection, and the tumors were excised, measured and photographed. The length and width of the tumors were measured every 4 days using a caliper, and tumor volumes (mm3) were calculated using the following formula: tumor volume = (length × width2) × 0.5 mm3 [27].
Ethics approval and consent to participate
Samples from PTC tumors (n = 40) and paired adjacent thyroid tissues (n = 40) (located more than 3 cm from tumor borders) were taken from patients who underwent their first surgical excision at Linzi District People’s Hospital, from 2014.10 to 2015.10. Fresh tissue samples were frozen in liquid nitrogen and stored in a refrigerator at –80°C. All the patients were diagnosed with PTC by three pathologists and did not receive other treatments including radioisotopes I131 and thyroid-stimulating hormone suppression.
Statistical analysis
GraphPad Prism 6.0 software (GraphPad Software, USA) and SPSS 21.0 (IBM Corporation, USA) were used for statistical analyses and data were all presented as mean ± standard deviation. Unpaired t-test, one-way ANOVA and two-way ANOVA were used for the comparisons. P < 0.05 was regarded as statistically significant.
Results
MiR-509-5p and SFRP1 expression in PTC tissues and cells
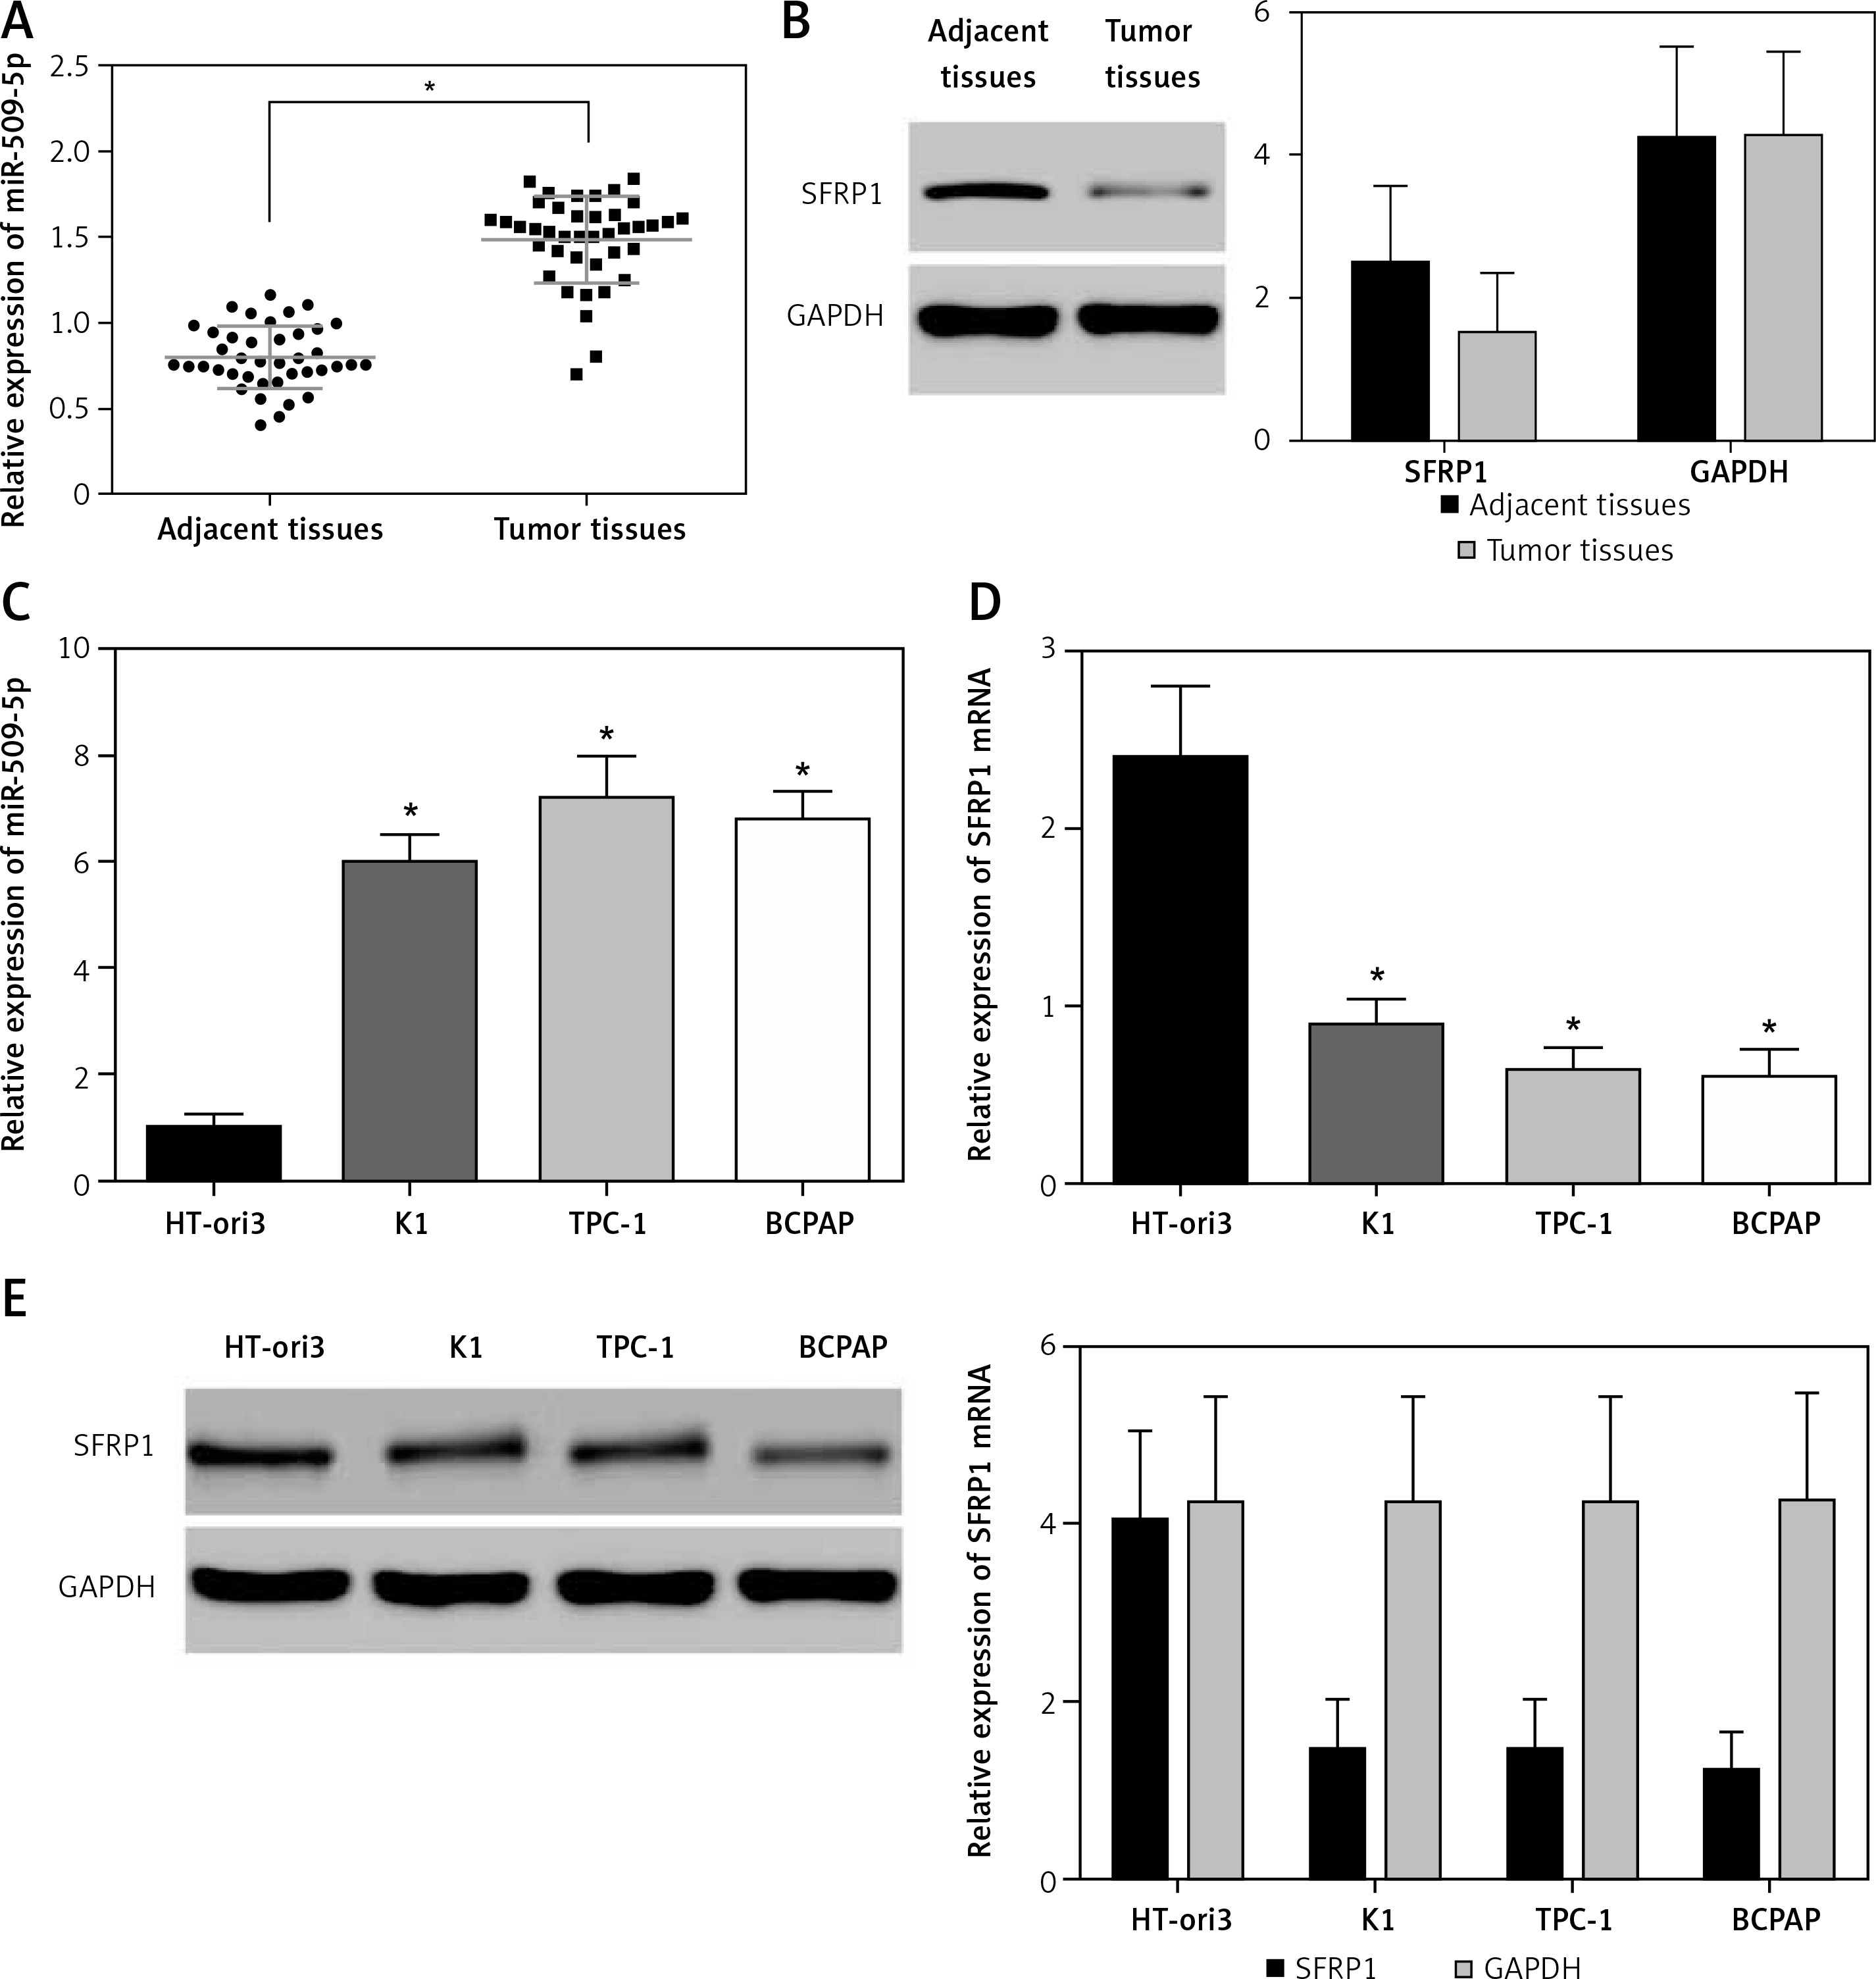
Western blot and RT-PCR were used to investigate the miR-509-5p and SFRP1 expression in 40 pairs of PTC and adjacent tissues and in normal thyroid cell line HT-ori3 and PTC cell lines K1, TPC-1, BCPAP.
The results showed that miR-509-5p was significantly higher in PTC tissues than in adjacent tissues (p < 0.05) and SFRP1 was lower in PTC tissues than in adjacent tissues (p < 0.05) (Figures 1 A, B). The RT-PCR results also revealed significant differences in the relative mRNA or miRNA expression of SFRP1 and miR-509-5p between PTC cells and normal thyroid cells (p < 0.05) (Figures 1 C, D). And the Western blot results showed a significant difference in the protein expression of SFRP1 between PTC cells and normal thyroid cells (Figure 1 E). MiR-509-5p level was the highest in the TPC-1 cell line, so this cell line was chosen for following assays.
Figure 1
MiR-509-5p and SFRP1 expression in PTC tissues and cell lines. A – RT-PCR was used to detect the miR- 509-5p expression in PTC and adjacent tissues. B – Expression of SFRP1 in PTC and adjacent tissues was evaluated by Western blot, using GAPDH as the internal reference. C – RT-PCR was used to detect the miR-509-5p expression in normal thyroid cell line HT-ori3 and PTC cell lines. D – RT-PCR was used to detect the SFRP1 mRNA expression in normal thyroid cell line HT-ori3 and PTC cell lines. E – Western blot assay was used to detect the SFRP1 protein expression in normal thyroid cell line HT-ori3 and PTC cell lines, using GAPDH as the internal reference
*P < 0.05, compared with the control group.
MiR-509-5p affected PTC cell proliferation, migration and invasion
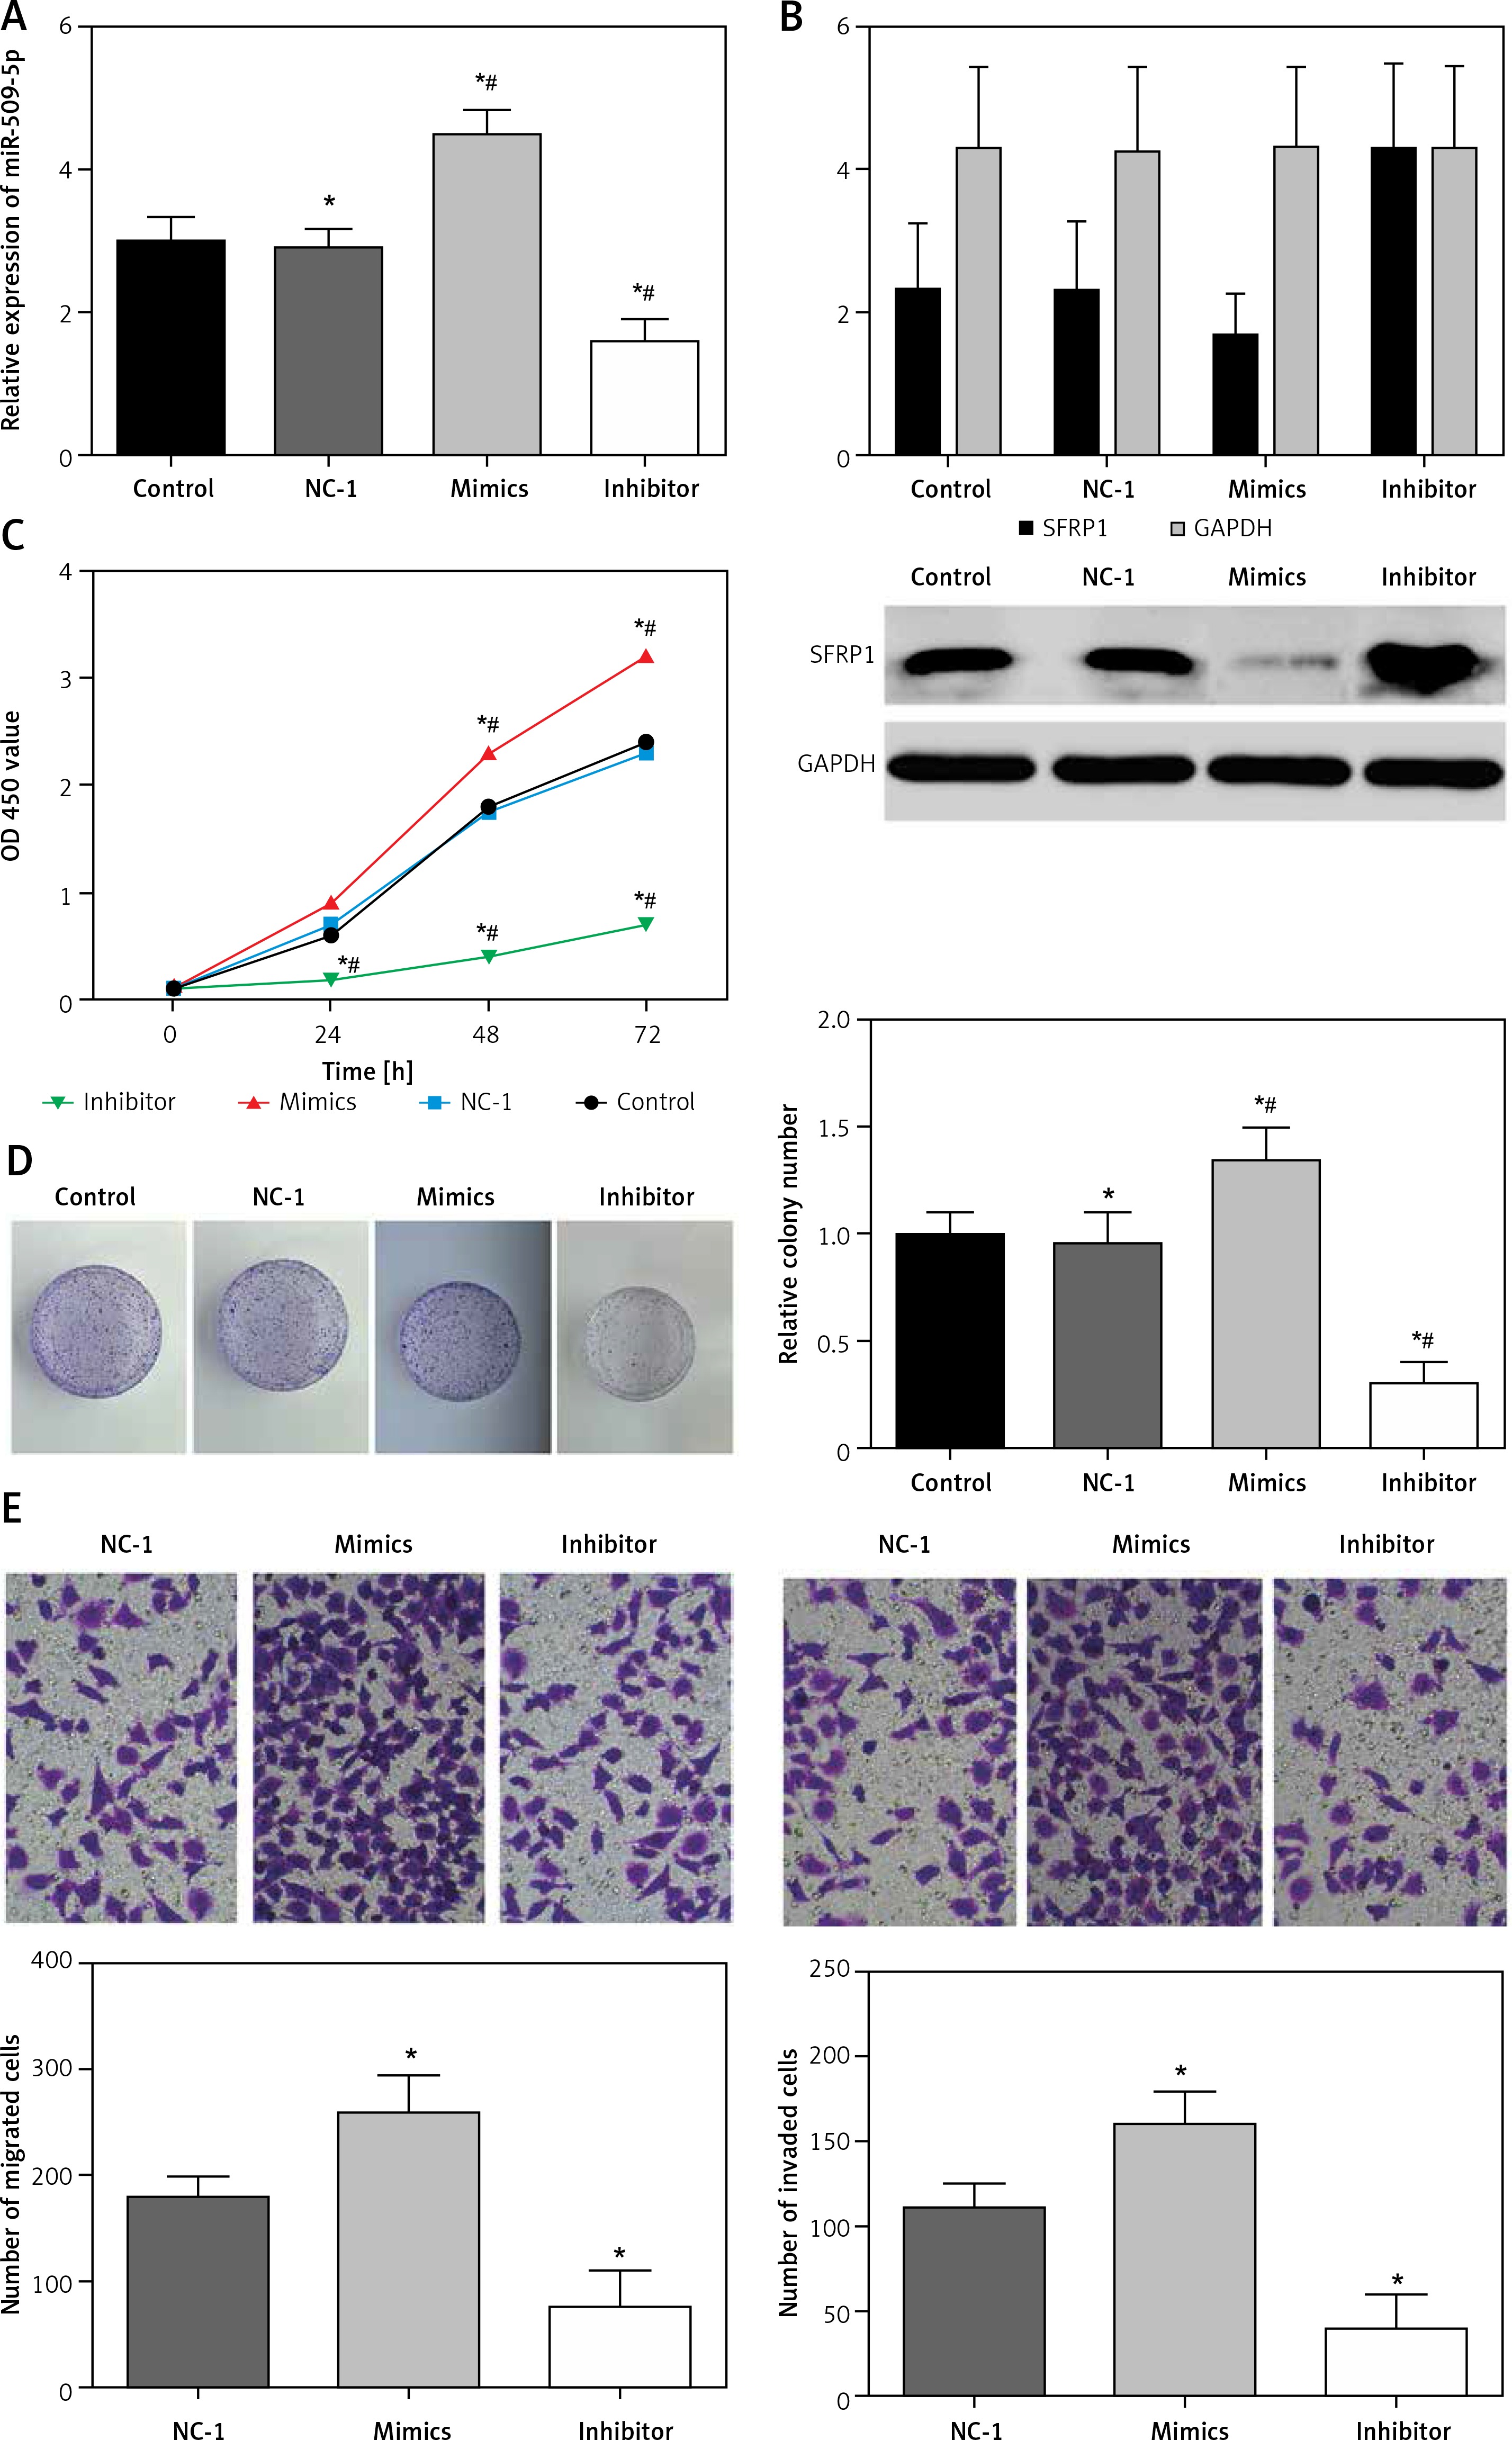
The transfection of miR-509-5p mimics or inhibitors was confirmed to be successful (Figure 2 A). The exogenous miR-509-5p dramatically suppressed the expression of SFRP1, whereas the miR-209-5p inhibitors significantly induced SFRP1 expression (Figure 2 B). The results of the MTT assay showed that cells transfected with miR-509-5p inhibitors had significantly lower viability rates than cells in Control and NC groups (p < 0.05) (Figure 2 C). Meanwhile, the results of the clone formation assay confirmed that the cells transfected with miR-509-5p inhibitors showed significantly fewer colonies than Control and NC groups (p < 0.05) (Figure 2 D). All the above results indicated that inhibiting miR-509-5p expression could suppress the proliferation and clone formation of TPC cells. TPC-1 cells transfected with miR-509-5p inhibitors showed significantly less migration or invasion than the control or the NC group (Figure 2 E).
Figure 2
Down-regulating miR-509-5p influenced the biological activities of TPC cells. A – RT-PCR was conducted to detect the miR-509-5p expression in TPC-1 cells after transfection to confirm the transfection efficiency. B – Expression of SFRP1 protein in cells in different groups determined by western blot. C – The influence of down-regulating miR-509-5p on TPC cell proliferation was evaluated by MTT assays. D – Clone formation assays were conducted to investigate the influence of down-regulating miR-509-5p on TPC cell clone formation. E – Transwell assays were conducted to investigate the influence of down-regulating miR-509-5p on TPC cell migrating and invasive abilities
*P < 0.05, compared with the control group.
MiR-509-5p directly targeted SFRP1
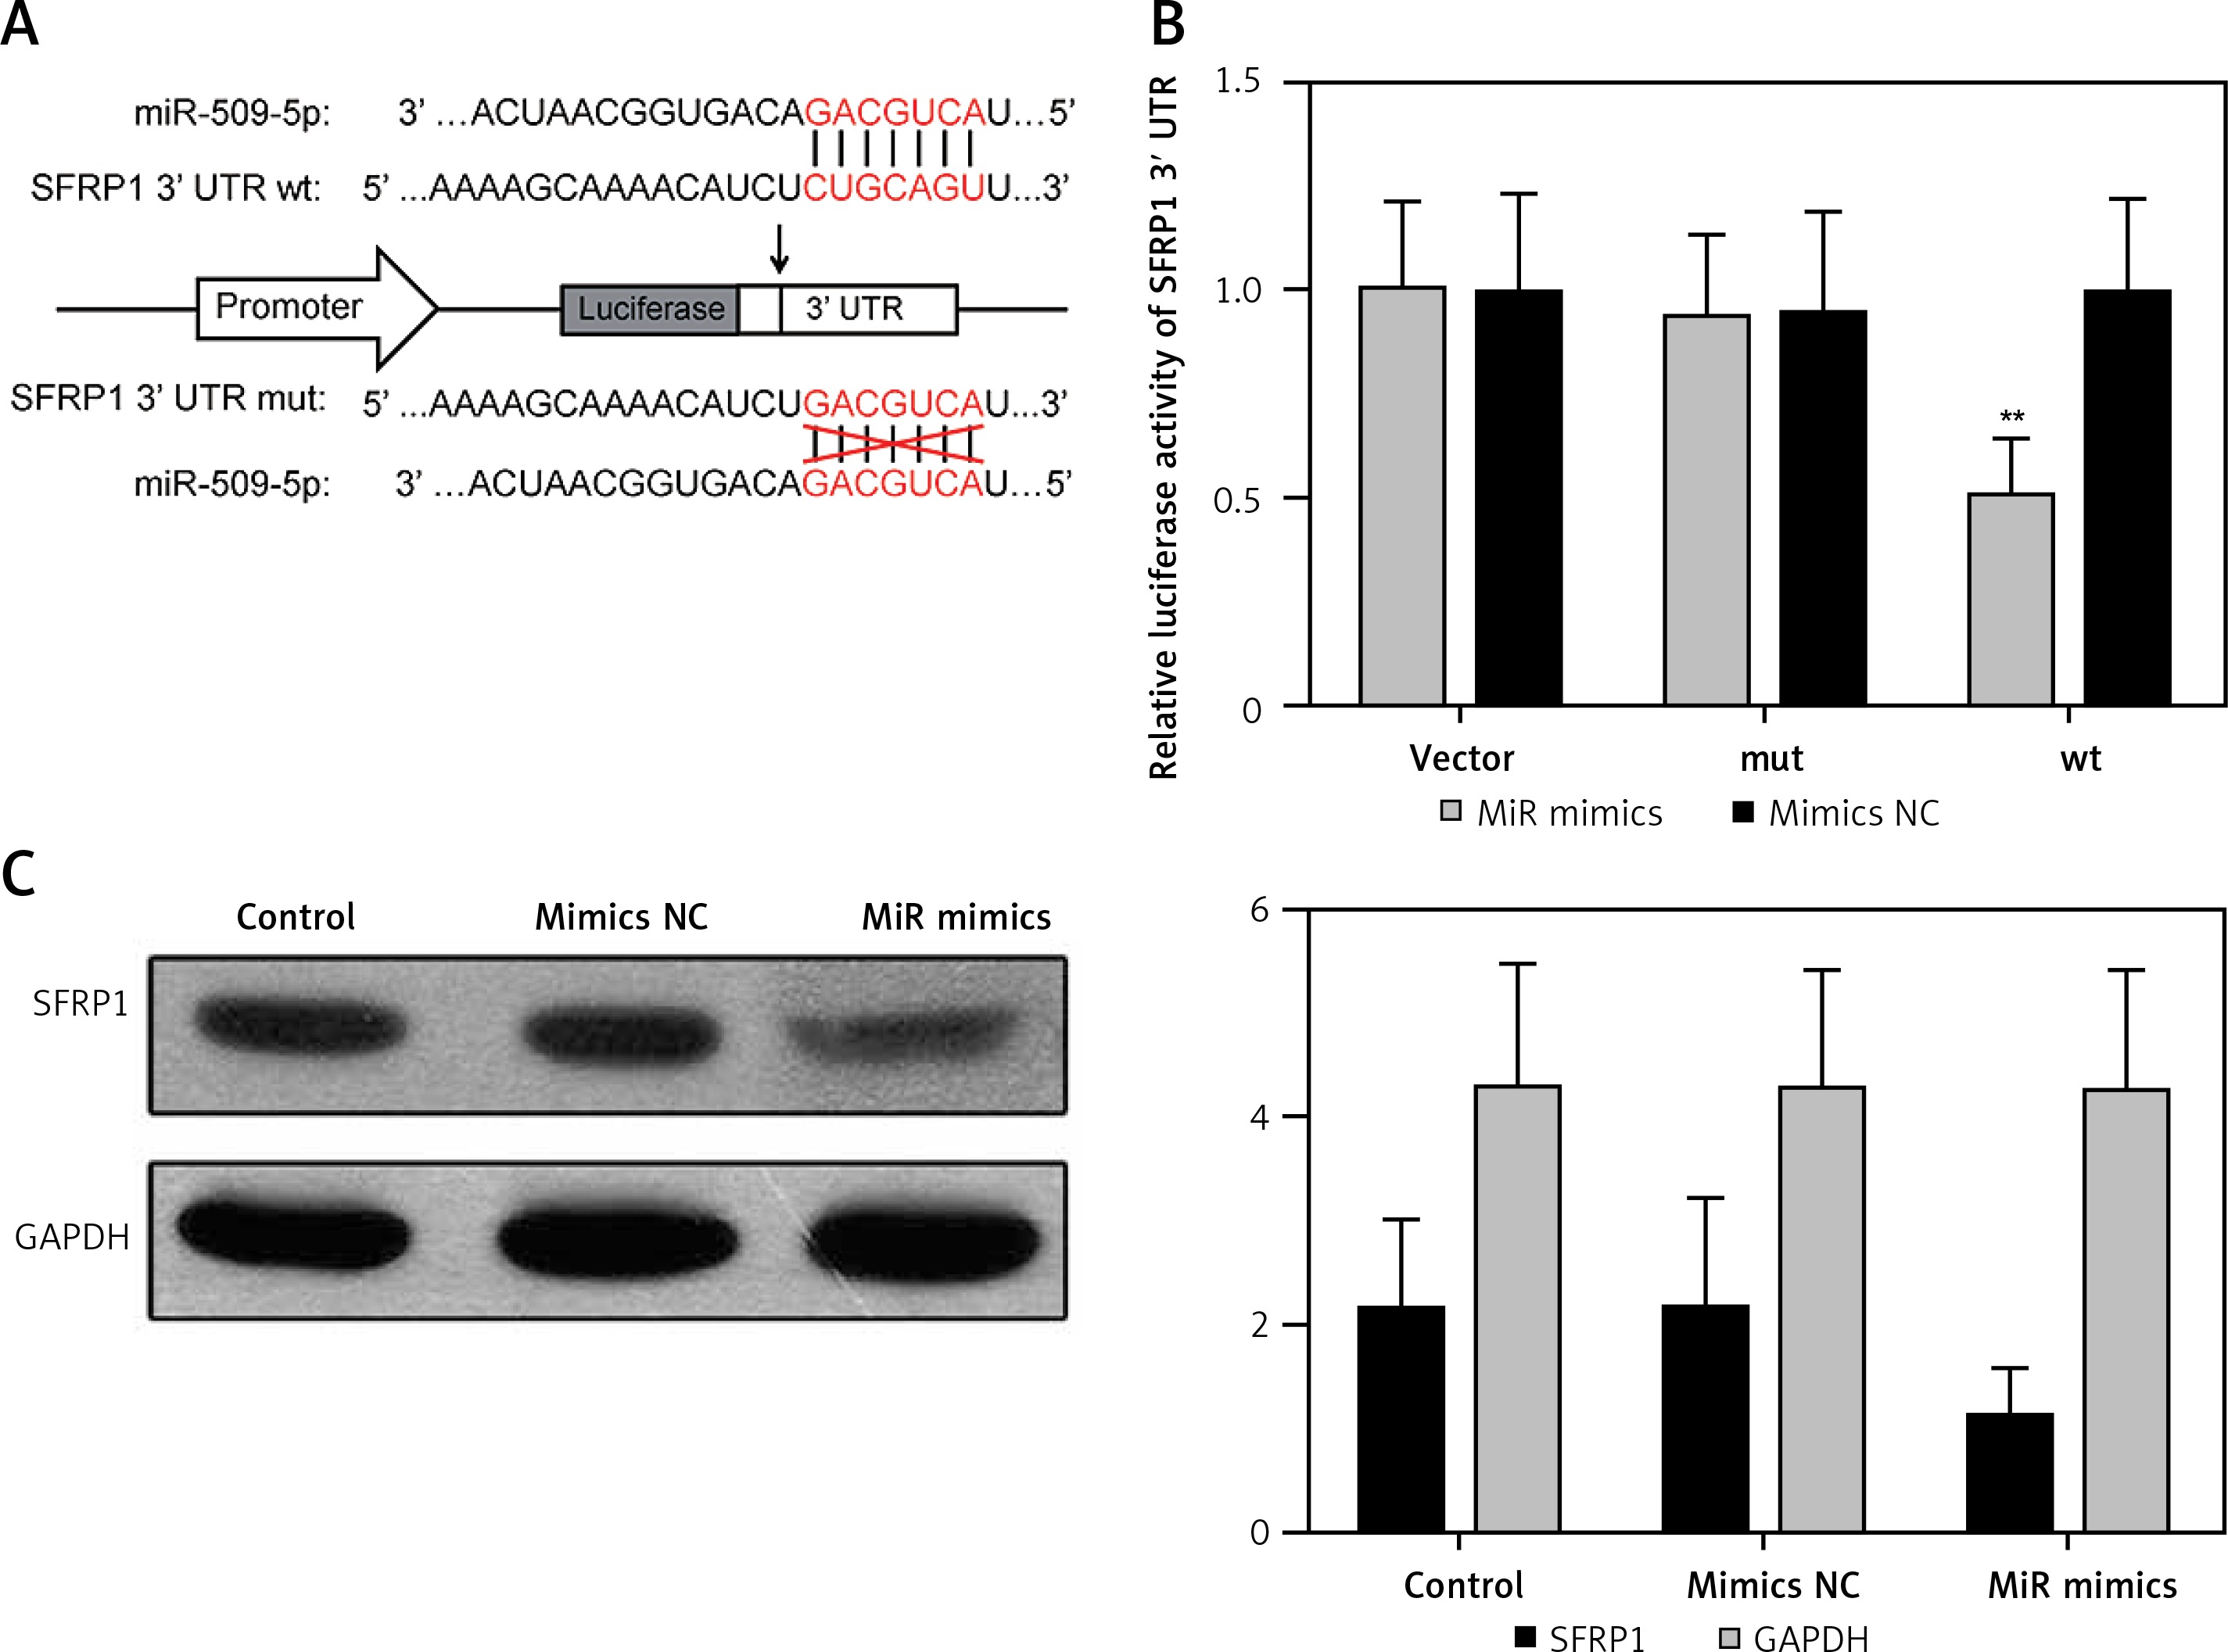
The gene sequences of wild-type miR-509-5p binding site SFRP1 3′-UTR (wt) and the corresponding mutated one (mut) in which the “CUGCAGU” was mutate into “GACGCA” are illustrated in Figure 3 A. The simultaneous presence of miR-509-5p and wild-type SFRP1 3′-UTR (wt) dramatically decreased the relative luciferase activity compared with the Control group (p < 0.05), whereas the simultaneous presence of mutated SFRP1 3′-UTR (mut) or miR-509-5p mimics/inhibitors showed no significant difference compared with the Control group (Figure 3 B). The overexpression of miR-509-5p inhibited the expression of SFRP1 in the TPC-1 cell line (Figure 3 C). Above all, miR-509-5p directly targeted SFRP1 and inhibited its expression.
Figure 3
Using dual luciferase reporter gene assay to prove that miR-509-5p directly targeted SFRP1. A – Scheme and gene sequence of wild-type miR-509-5p binding site SFRP1 3′-UTR (wt) and the corresponding mutated one (mut). B – Dual luciferase reporter gene assays were conducted to confirm that miR-509-5p directly targeted SFRP1. C – Western blot assays were conducted to detect the SFRP1 expression after transfection
*P < 0.05, compared with the control group.
MiR-509-5p promoted TPC cell proliferation, migration and invasion through inhibiting SFRP1
Over-expression of SFRP1 inhibited PTC cell proliferation and clone formation
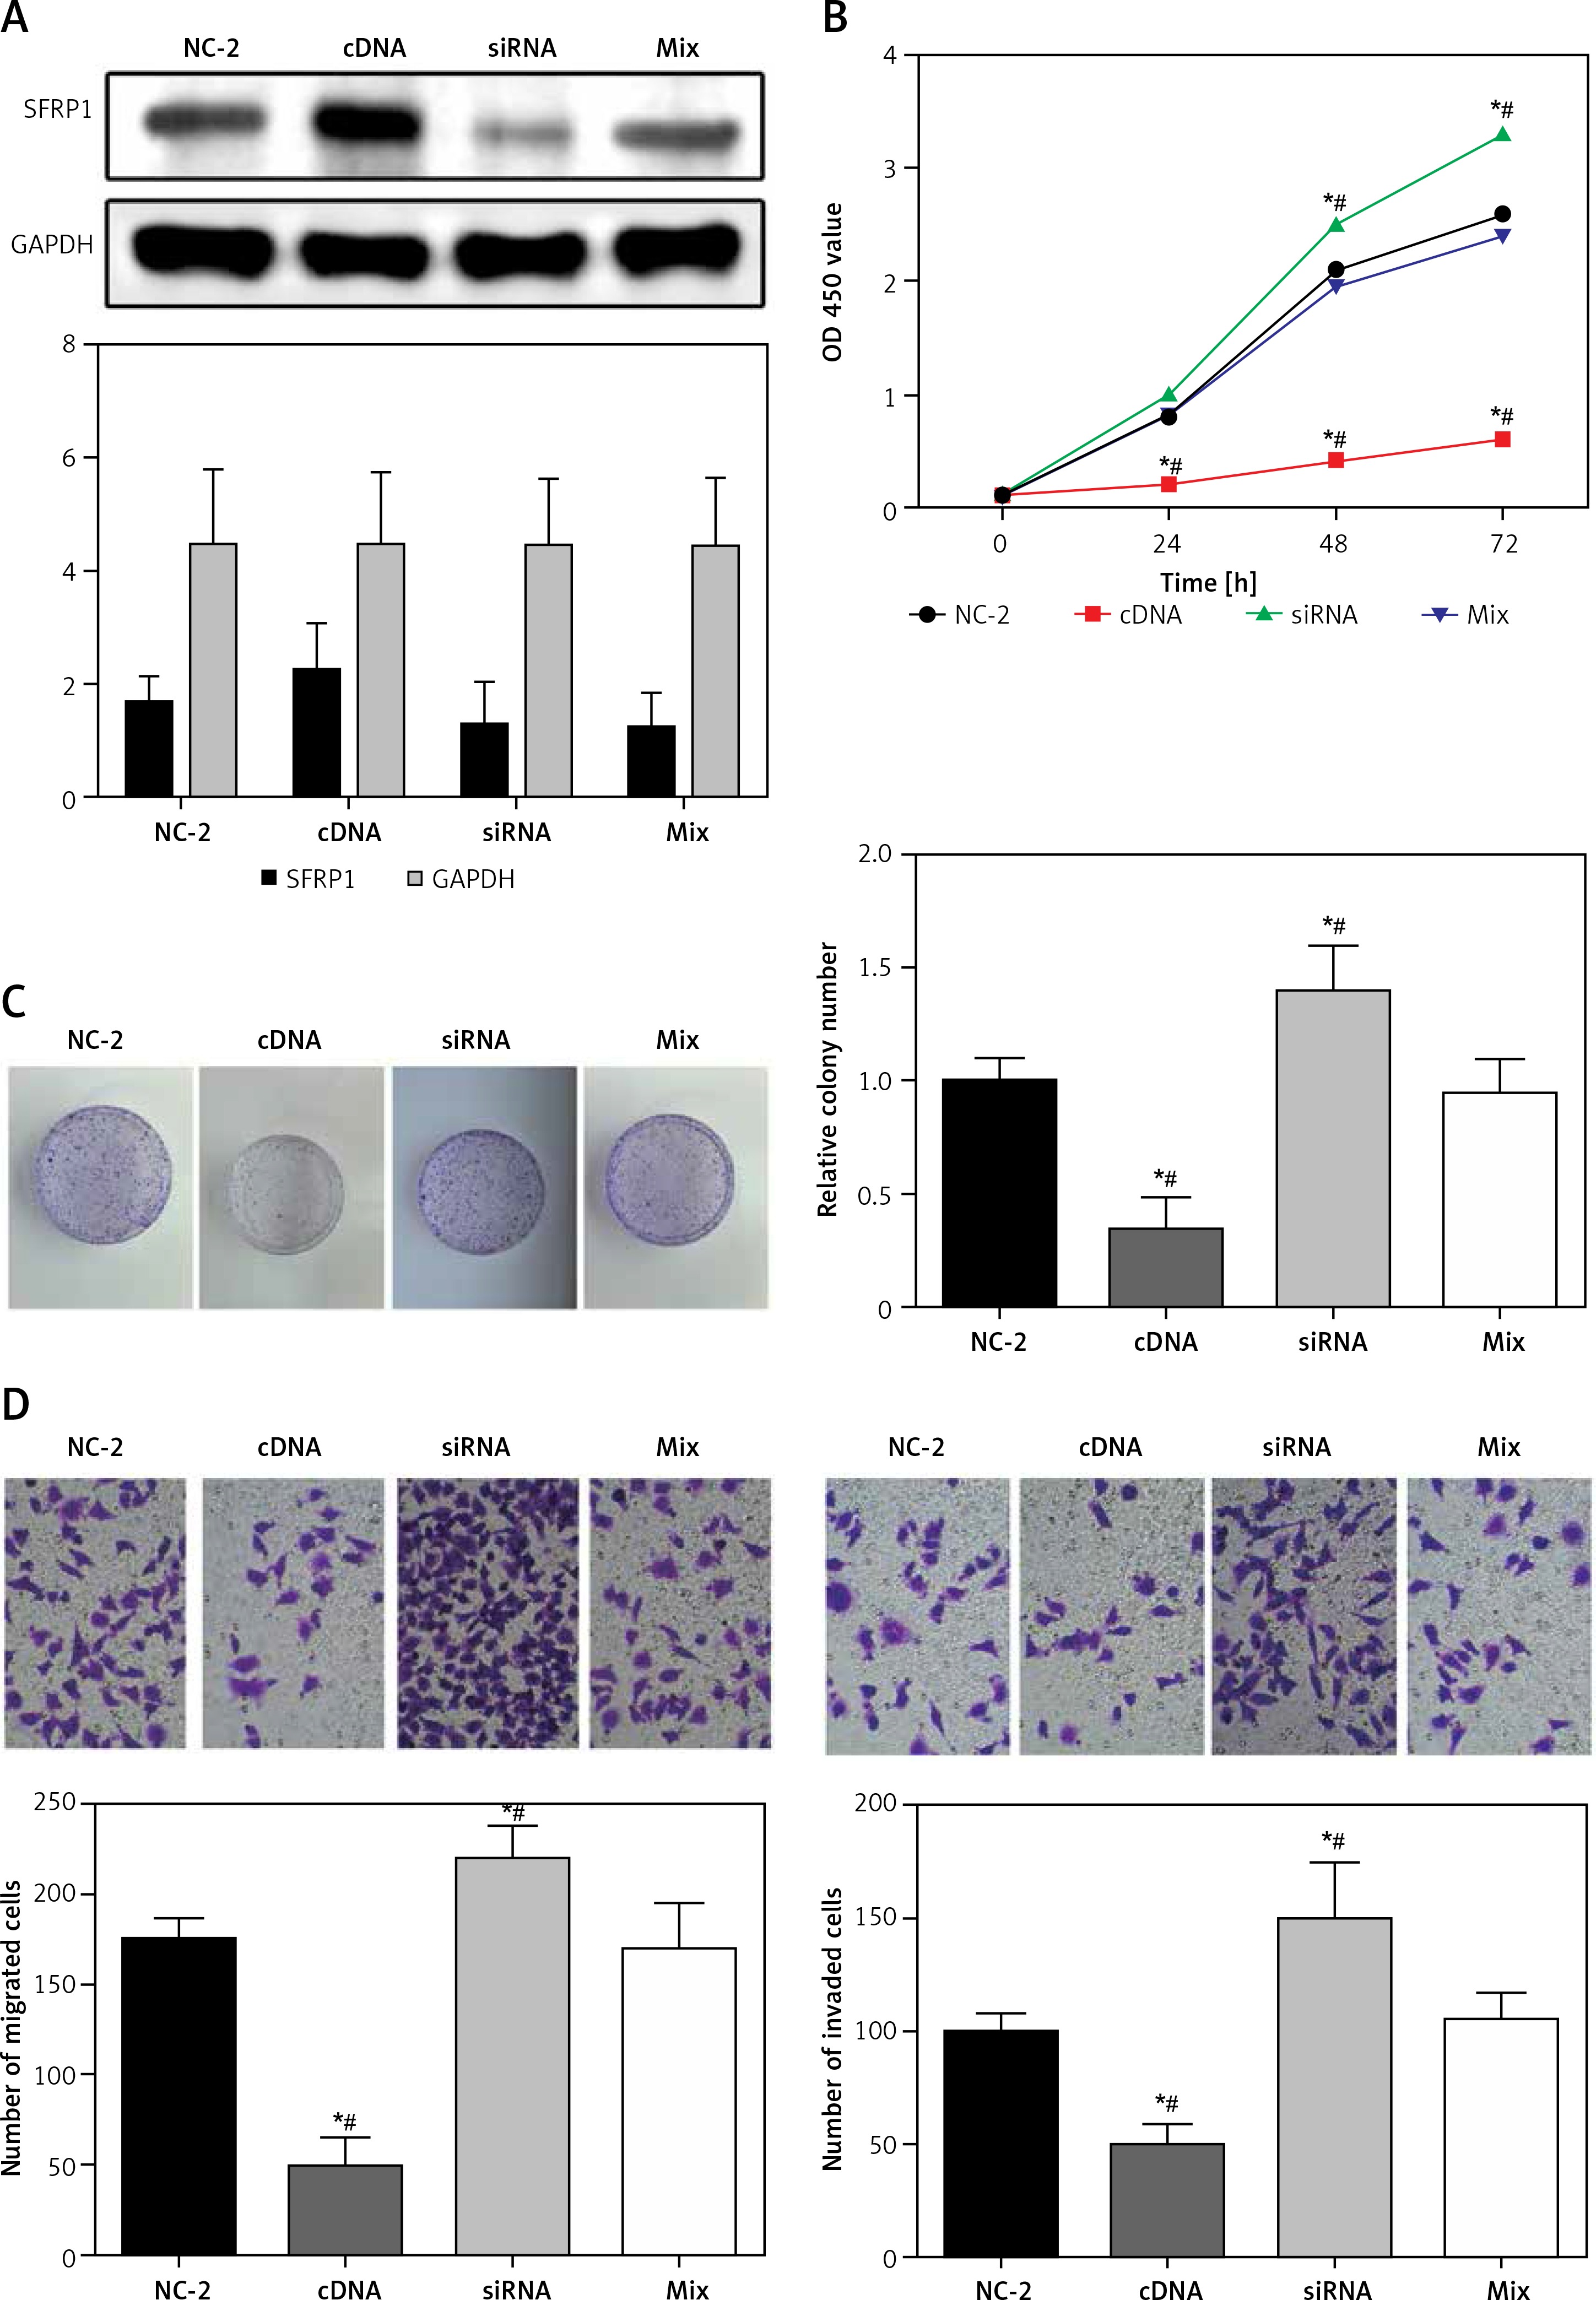
Western blot assays were used to detect the SFRP1 expression in the TPC-1 cell line to verify the transfection effectiveness. As illustrated in Figure 4 A, the SFRP1 expression in the SFRP1 cDNA group was obviously higher than that in the cDNA-NC group. The MTT assay results (Figure 4 B) and clone formation assay results (Figure 4 C), the cell growth rate and clone cells of the TPC-1 cell line in the SFRP1 cDNA group were significantly lower or fewer than those in the cDNA-NC group (all p < 0.05), indicating that over-expression of SFRP1 inhibited TPC cell proliferation and clone formation.
Figure 4
Over-expression of SFRP1 influenced the biological activities of TPC cells. A – Western blot was conducted to detect the SFRP1 expression in TPC-1 cells after transfection. B – MTT assays were conducted to investigate the influence of over-expression of SFRP1 on TPC-1 cell proliferation. C – Clone formation assays were conducted to investigate the influence of over-expression of TPC-1 cell clone formation. D – Transwell migration and invasion assays were conducted to investigate the influence of over-expression of SFRP1 on TPC-1 cell migration and invasion
*P < 0.05, compared with the control group.
Over-expression of SFRP1 inhibited PTC cell migrating and invasive abilities
In both Transwell migration and invasion assays, the number of TPC-1 cells in the cDNA group migrating or invading through the membrane was dramatically lower than that in the cDNA-NC group (both p < 0.05) (Figure 4 D). These results indicated that the over-expression of SFRP1 inhibited TPC-1 cell migration and invasion.
MiR-509-5p regulated Wnt/β-catenin by inhibiting SFRP1 expression
A TCF/LEF luciferase assay was conducted to detect the Wnt/β-catenin pathway activity of TPC-1 cells after transfection. The transfection efficiency of miR-509-5p mimics and inhibitors was confirmed (Figure 5 A). The luciferase activity (presenting Wnt pathway activity) in the SFRP1 cDNA group was significantly lower than that in the cDNA-NC group, whereas that in the siRNA group demonstrated a strong increase of luciferase intensity (Figure 5 B). However, the Wnt pathway activity in the Mix group (co-transfected with SFRP1 cDNA and miR-mimics) showed no dramatic difference in contrast to the Control group. Above all, miR-509-5p regulated Wnt/β-catenin by inhibiting SFRP1 expression.
Figure 5
Wnt/β-catenin pathway activity in different groups detected by TCF/LEF luciferase assay. A – Relative luciferase activity in cells in group NC-2, cDNAs, siRNAs and mix. B – Images of tumors in different groups of mice. C – The relative expression of miR-509-5p in cells transfected with NC, mimics and inhibitors. D – Tumor volume of mice injected with NC, mimics or inhibitors
*P < 0.05, compared with the control group.
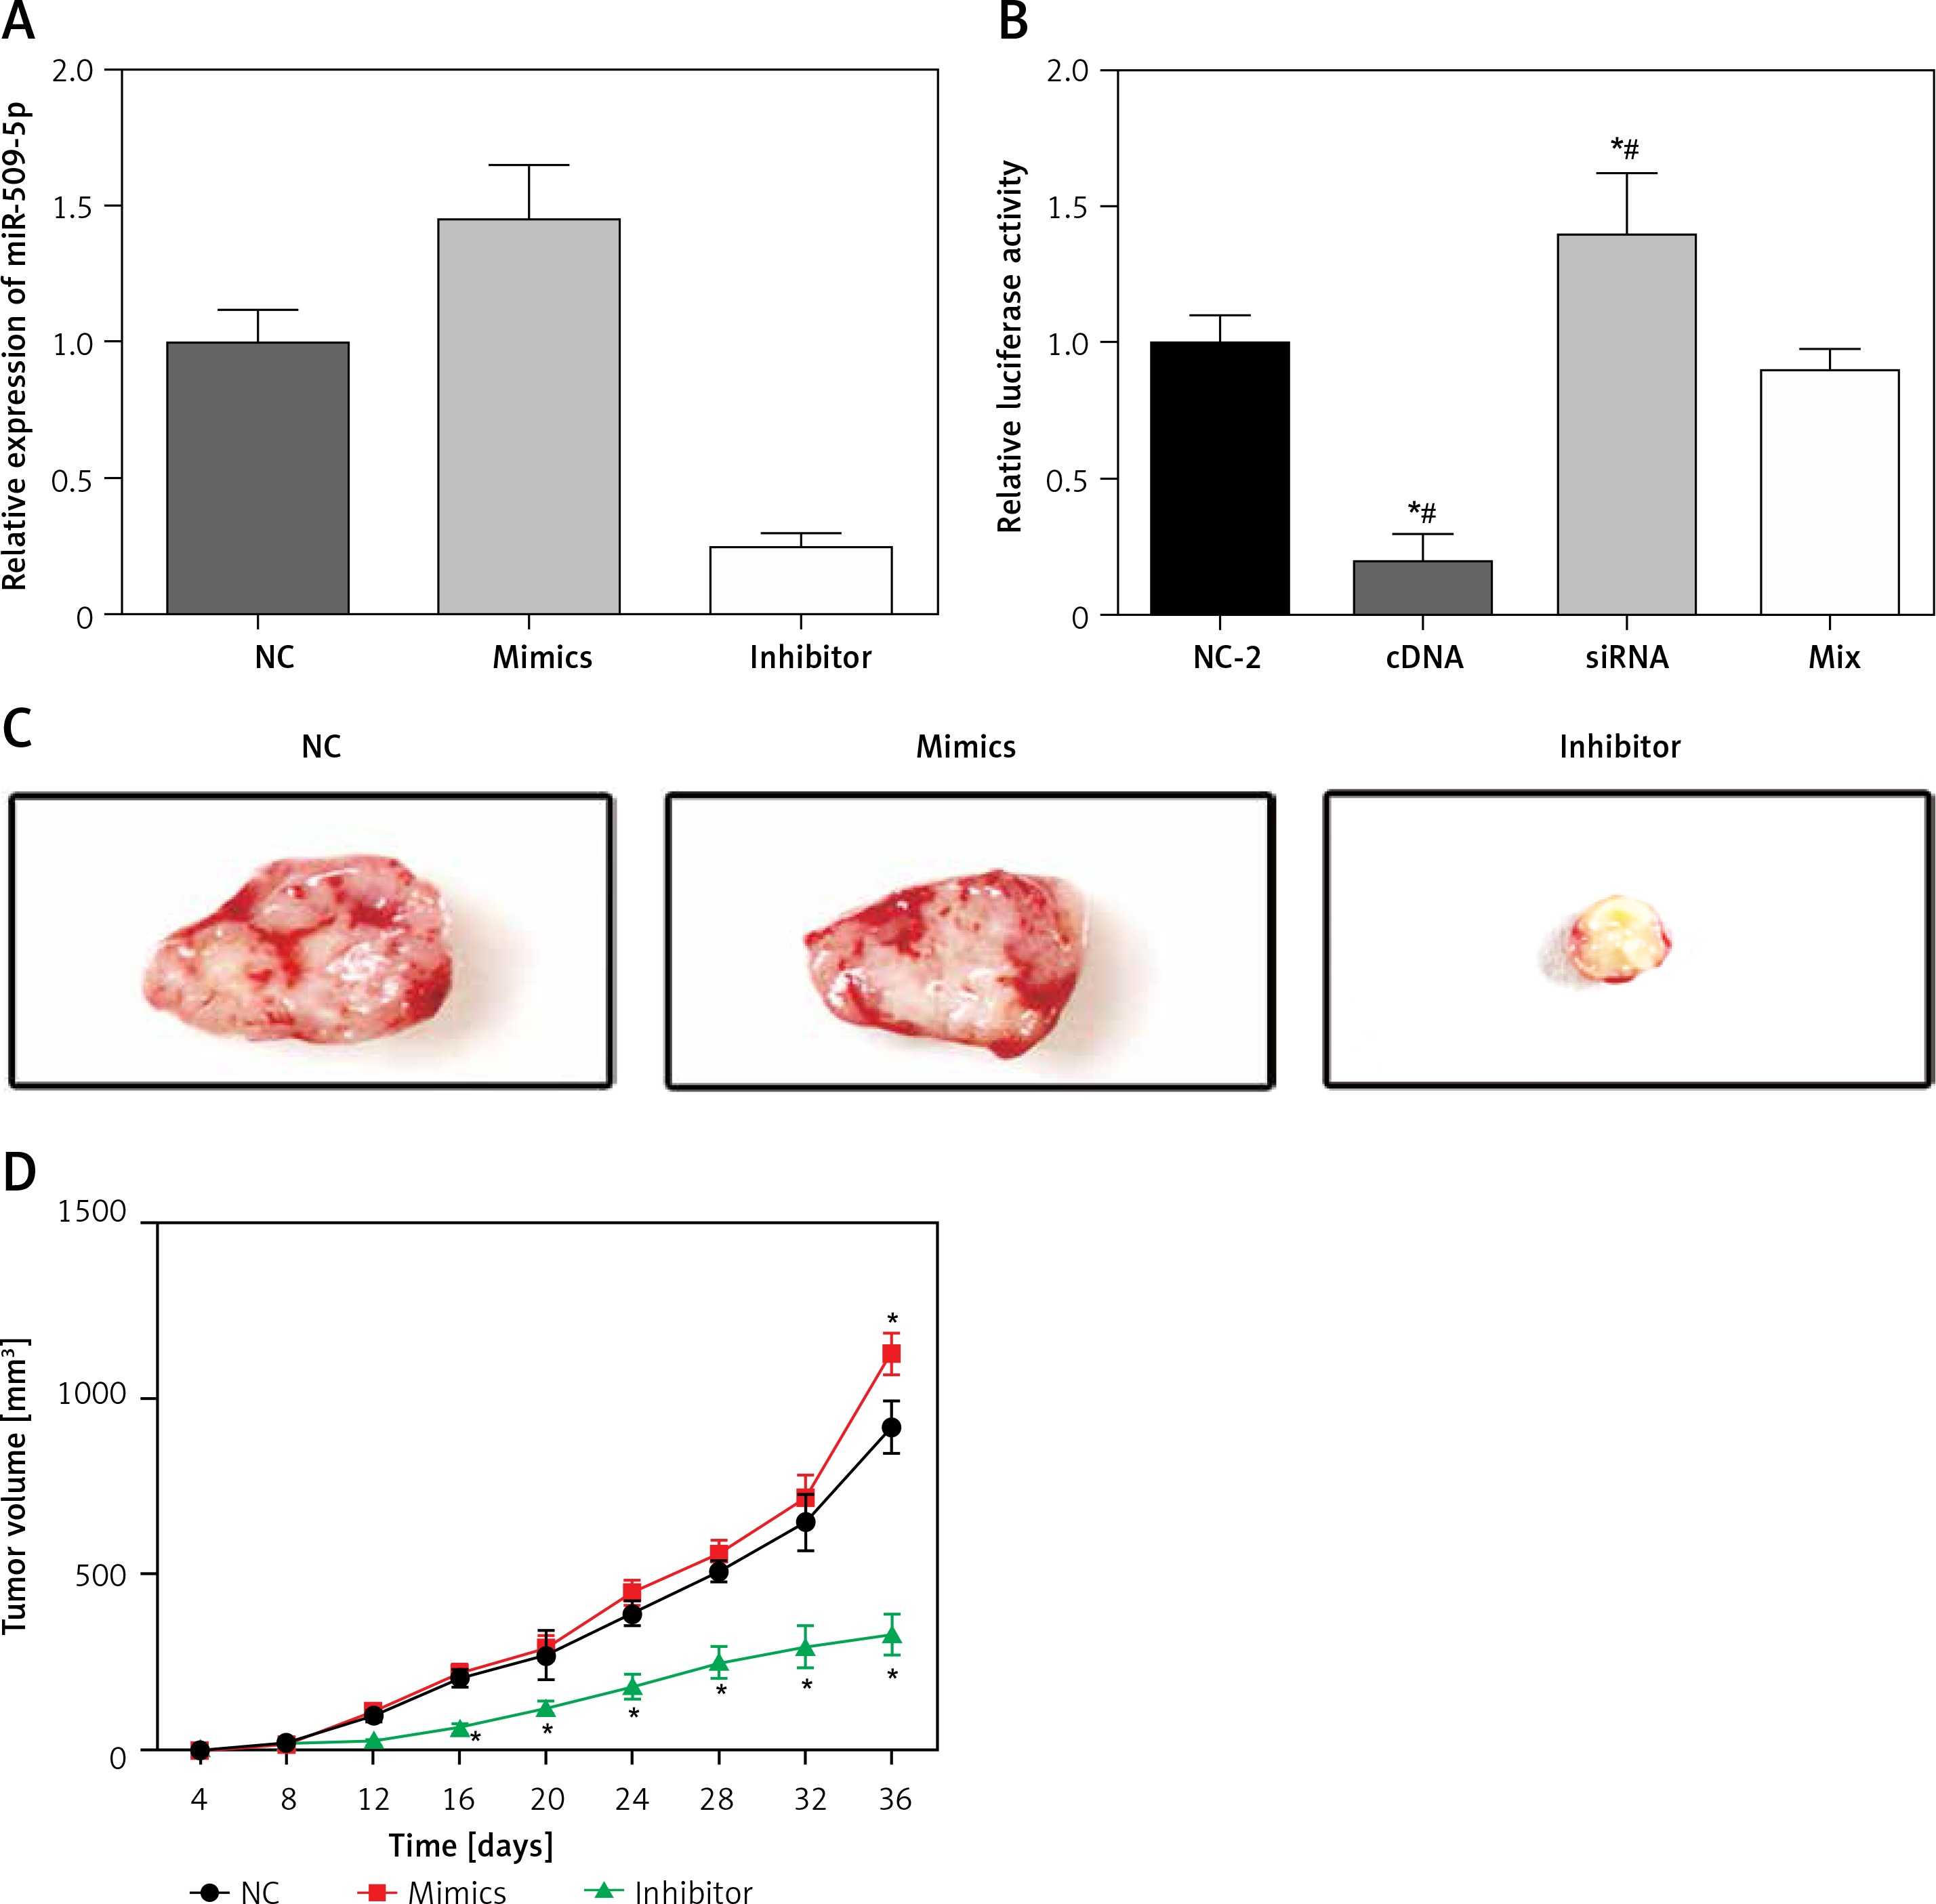
MiR-509-5p promoted tumor growth
Exogenous miR-509-5p significantly increased the tumor volume 36 days after the injection (Figure 5 D). MiR-509-5p inhibitors substantially repressed the tumor growth from 16 days after the injection. The tumors were photographed after the mice were euthanized (Figure 5 C).
Discussion
The PTC is the most common endocrine carcinoma, which often occurs in females [28]. To date, numerous studies have revealed that the high morbidity and mortality of PTC are attributed to cell metastasis [29]. It is urgent for us to investigate the potential molecular mechanism responsible for the metastasis process of PTC.
In the past few decades, the role of miRNAs in human cancers has drawn substantial attention [21, 30]. Accumulated evidence has suggested that the regulation of miRNAs is closely associated with multiple biological processes involving cell proliferation, invasion, migration, cell cycle distributions and apoptosis [31]. The abnormal expression of miR-509-5p has been frequently observed in various tumor tissues using RT-PCR. For instance, miR-509-5p is obviously downregulated in tissues and plasma of renal cell carcinoma in comparison with matched normal tissues [32]. The expression level of miR-509-5p is also lower in non-small cell lung cancer [33]. Moreover, it was found that miR-509-5p can be activated by p53 and then downregulated in cervical cancer and hepatocellular carcinoma [24]. Coincidently, all of the researchers claimed that miR-509-5p exerted its suppressive functions in tumorigenesis and metastasis.
In the present study, we detected that miR-509-5p expression was significantly increased in 40 paired papillary thyroid carcinoma (PTC) sample tissues, in which for the first time miR-509-5p was found to be upregulated in human cancers. To further verify its abnormal high expression, RT-PCR was performed in PTC-derived cell lines (K1, TPC-1, BCPAP) and the normal thyroid gland cell line HT-ori3. Not surprisingly, the results were in line with the detection in sample tissues. Thus, we predicted that miR-509-5p functioned as an oncogenic gene in the progression and metastasis of PTC. To further validate our prediction in PTC, in vitro assays including MTT assay, clone formation and Transwell assay were performed to evaluate PTC cells’ biological functions. In vivo, tumor formation experiments confirmed that miR-509-3p promoted tumor growth. It was indicated that the downregulation of miR-509-5p suppressed PTC cells’ viability, proliferation and mobility, which indirectly suggested its oncogenic role.
To reveal the molecular mechanism responsible for the oncogenic role of miR-509-5p in PTC, we searched TargetScan (a biological database, http://www.targetscan.org/) for a potential target that was partially complementary to miR-509-5p in the 3′-UTR region. SFRP1 drew our attention and the dual luciferase reporter gene assay further verified that SFRP1 was a direct target for miR-509-5p. SFRP1 is abundant with cysteine and acts as an antagonist of the Wnt signaling pathway [34]. SFRP1 executes its functions by binding to Wnt as it is homologous to the putative Wnt-binding site Frizzled. SFRP1 has been considered as a negative regulator of Wnt/β-catenin signaling and functions as a tumor suppressor in a wide range of human cancers involving ovarian cancer, pancreatic cancer, glioblastoma, etc. [35–37]. It was demonstrated that aberrantly expressed miR-582-3p could activate Wnt signaling by regulating SFRP1 simultaneously in non-small cell lung cancer [38]. SFRP1 also played an inhibitory role in renal cancer, which was regulated by onco-miR-1260b and thus suppressed Wnt/β-catenin signaling [39]. Overall, previous findings indicated that SFRP1 took part in tumorigenesis and metastasis through controlling Wnt/β-catenin signaling. In spite of emerging evidence, we still have little clue of how the regulation modulation contributes to carcinogenesis and keeps the Wnt/β-catenin signaling in hyper-activation.
Wnt signaling will play a role in the development of epithelial tumors if it is activated aberrantly [40]. There are several kinds of disheveled proteins in the Wnt signaling pathway, which mainly include β-catenin, axin, PP2A, adenomatous polyposis coli (APC) and glycogen synthase kinase-3β (GSK-3β) [41]. In all of these cases, the most important factor is the activation of gene transcription by β-catenin [40]. As a major type of Wnt signaling, Wnt/β-catenin signaling plays a crucial role in PTC tumorigenesis [42]. Wnt proteins are expressed in normal thyroid cells and involved in embryonic development by regulating cell fate specification, proliferation, polarity and tissue patterning [43]. Furthermore, the overexpression of Wnt1, one of the Wnt proteins, contributes to human thyroid cell viability and proliferation [44]. All considered, the activation of Wnt/β-catenin signaling enhances cell growth in thyroid, which indicates its oncogenic role in tumorigenesis of PTC.
Herein, we detected SFRP1 mRNA expression in both PTC tumorous tissues and cell lines and found that SFRP1 expression level was obviously decreased in tumor samples compared with control samples. Also, the results of various in vitro assays in our study were in line with previous conclusions. An inverse association was demonstrated between Wnt protein expression and SFRP1 expression in the TCL/LEF assay, which illustrated that Wnt signaling was inhibited by SFRP1. Additionally, the Wnt signaling pathway has been proved to be involved in PTC development. We thus conclude that miR-509-5p promoted PTC cell viability, proliferation and mobility via directly inhibiting the SFRP1-dependent Wnt/β-catenin signaling pathway.
In conclusion, in the present study, we detected the molecular mechanism underlying miR-509-5p and its target gene SFRP1 through the regulation of Wnt/β-catenin signaling. MiR-509-5p expression was frequently increased in PTC tissue samples and cells while SFRP1 was obviously decreased compared with normal tissues and thyroid cells. SFRP1 was identified as a direct target for miR-509-5p, which was predicted by a biological database and verified by dual luciferase reporter assay. We also investigated that miR-509-5p promoted PTC cell viability, proliferation and mobility via suppressing SFRP1, leading to activation of Wnt/β-catenin signaling. Our results might provide a novel insight into the treatment of PTC.