Introduction
Thyroid neoplasms represent the most common endocrine malignancy, with an increasing incidence over the past decades. Papillary thyroid carcinoma (PTC) is a well-differentiated thyroid carcinoma, which contributes to approximately 80% of all thyroid malignancies [1]. PTC is frequently multifocal and it usually metastasizes in regional neck lymph nodes while distant metastases are very rare [2]. The clinical course of PTC is benevolent in most patients, as testified by the 90% 5-year survival rate, while the other 10% of patients develop recurrent disease and aggressive clinical progression [3]. Taking into account the frequency of PTC and its clinical importance, it is essential to gain better understanding of its carcinogenesis process. Substantial progress in PTC’s molecular pathogenesis has been achieved, on the basis of biochemical, genetic and omics studies. These studies showed the importance of the mitogen-activated protein kinases (MAPK) and phosphatidylinositol 3-kinases-protein kinase B (PI3K-AKT) signaling pathways, whose activation is considered the primary oncogenic event in PTC carcinogenesis, as well as in other pathological states [4, 5]. Genetic modifications that account for alterations of these pathways include point mutations, major rearrangements, copy-number variants and changes in gene methylation [6]. In a complex cellular signaling network these two pathways contribute to the regulation of proliferation and apoptosis as well as the redox status, which has a crucial influence on cell survival [7]. Oxidative stress takes place when the large number of generated reactive oxygen species (ROS) cannot be scavenged by cellular antioxidative mechanisms. This state leads to the damage of lipids, proteins and DNA, compromising normal cellular functioning and survival [8]. The extent of oxidative stress is estimated by quantification of biomarkers such as malondialdehyde (MDA) as a marker of lipid peroxidation, advanced oxidation protein products (AOPP) as a marker of oxidative protein damage and 8-oxo-2′-deoxyguanosine (8-oxo-dG) as a marker of oxidative DNA damage. Determination of antioxidative enzymes’ activity and quantification of non-enzymatic compounds that include reduced glutathione, total thiols, vitamins C and E and others are used for evaluation of antioxidative defense capacity [9]. Studies that explore the relevance of oxidative stress in PTC carcinogenesis and its significance for cell survival are limited. The aim of this study was to evaluate the redox status profile and its influence on cell survival of PTC, comparing it with colloid goiter (CG) as a control. We used AOPP as a prooxidant marker, total amount of thiols as a marker of antioxidative capacity and activities of deoxyribonuclease I (DNase I) and deoxyribonuclease II (DNase II) as parameters which provide an insight into DNA fragmentation and degradation during the cell death in PTC and CG tissue. The influence of demographic, clinical and pathological factors on thyroid oxidative stress and cell survival were also critical end-points of this research.
Material and methods
Patients
Euthyroid Caucasian patients of any age and gender who underwent thyroid surgery during 2016–2017 were divided into two groups: an experimental cohort of patients with PTC (n = 67) and a control group of patients with CG (n = 47), who were matched by age and gender with PTC patients. The patients involved in the study were diagnosed and operated on at the Center for Endocrine Surgery of the Clinical Center of Serbia in Belgrade. The malignant process in PTC patients was preoperatively confirmed following a cytological analysis by fine needle aspiration biopsy. Colloid goiter patients were subjected to thyroid surgery because of the compressive symptoms, throat discomfort and/or significant increase of goiter size. Postoperative thyroid samples of normal and tumor tissues were collected from each PTC patient and goiter tissue was collected from control patients. The goiter tissue was sampled from the largest colloid nodule positioned in the multinodular goiter. The PTC tissue was excised from the center of the tumor, while the normal thyroid tissue was excised from the rest of the thyroid gland at the greatest possible distance from the primary tumor. The normal thyroid tissue was defined as the self-control for each PTC patient, and the goiter tissues were defined as an independent control group. The following exclusion criteria were defined: presence of other malignant disease, unstable pectoral angina, unregulated arterial hypertension, chronic renal diseases, diabetes mellitus, recent trauma history and chronic infectious diseases. The postoperative tissue samples underwent pathohistological analysis by standard hematoxylin/eosin staining technique. The definitive diagnosis was obtained after examination by two independent pathologists. TNM (tumor-lymph nodes-metastasis) staging was performed according to the recommendations of the AJCC Cancer Staging Manual [10]. Demographic, clinical and laboratory data were collected and they included age, gender, body mass index (BMI), smoking habit, family history of thyroid disease, TNM stage, nodule size, retrosternal localization, capsular invasion, multicentric intrathyroid dissemination, plasma thyroid hormone levels (T3, free T3, T4 and free T4), plasma thyroid-stimulating hormone (TSH) and thyroglobulin (TG) concentrations as well as titer of anti-thyroglobulin (anti-TG) and anti-thyroid peroxidase (anti-TPO) auto antibodies. Written informed consent was obtained from each patient according to the Declaration of Helsinki (1964). The study has been approved by the Ethical Committee of the Clinical Center of Serbia (approval number 1575/7).
Tissue material sampling
Immediately following surgery, from each patient, a sample of tumor tissue and normal surrounding thyroid tissue was sampled. Approximately 1 cm3 of tumor and normal tissue was excised with a sterile scalpel, transferred to sterile tubes (1.5 ml), labeled and stored at –80°C until further manipulation.
Tissue homogenization
After brief rinsing with sterile phosphate-buffered saline (PBS), tissue samples were mechanically homogenized in 500 μl of sterile PBS. During the homogenization in an electric rotational homogenizer, tubes containing tissue samples were immersed in ice in order to avoid excessive heating caused by homogenization. After 60 s of homogenization, buffered homogenates were centrifuged at 6000 rpm for 5 min, and collected supernatants were aliquoted, transferred to sterile tubes (1.5 ml) and stored at –80°C until further biochemical analysis [11].
Determination of protein concentration
Total amount of protein in tissue homogenates was assayed using the spectrophotometric method of Bradford [12]. The protein concentration was calculated by a linear regression model from the standard curve and expressed as milligrams of proteins per milliliter of tissue homogenates (mg/ml).
Determination of advanced oxidation protein products
The amount of AOPP in tissue homogenates was determined by the UV-spectrophotometric method of Witko-Sarsat et al. [13]. The reaction mixture contained 5 μl of tissue homogenate, 195 μl of 20 mmol/l phosphate buffer (pH = 7.4), 20 μl of 0.5 mol/l acetic acid and 10 μl of 1.16 mol/l aqueous solution of potassium iodide. The reaction mixture was incubated for 10 min at 37°C, and absorbance was read at 340 nm. The standard curve was constructed by a linear concentration gradient (0–100 μmol/l) of aqueous solution of chloramine-T. The obtained results were expressed as μmol/l of chloramine-T equivalents per milligram of proteins in tissue homogenates (μmol/l chloramine-T Eq./mg of proteins).
Determination of total amount of thiols
Total amount of thiols in tissue homogenates was determined by the spectrophotometric method of Ellman [14]. The reaction mixture contained 100 μl of tissue homogenate, 20 μl of 0.01 mol/l DTNB (5,5′-dithio-bis-[2-nitrobenzoic acid]) solution in 0.2 mol/l of Na2HPO4 and 900 μl of 0.002 mol/l ethylenediaminetetraacetic acid (EDTA) solution in 0.2 mol/l of Na2HPO4. The standard curve was constructed by a linear concentration gradient (0–100 μmol/l) of aqueous solution of acetyl cysteine. The obtained results were expressed as μmol of total thiols per milligram of proteins in tissue homogenates [μmol/mg of proteins].
Determination of deoxyribonuclease I and deoxyribonuclease II activity
Activities of DNase I and DNase II in tissue homogenates were determined using the spectrophotometric methods of Kunitz and Koszalka et al., respectively [15, 16]. The activities were obtained by measuring the absorbance reductions during the hydrolysis of bovine pancreatic DNA at 240 nm. Activities were expressed in units of enzyme activity per milligram of proteins in tissue homogenates (U/mg protein).
Thyroid panel
Values of thyroid hormones, TSH, TG and anti-thyroid antibodies were obtained preoperatively by routine blood work in a referral institutional laboratory. Levels of T3, FT3 and TG were obtained by the automated chemiluminescent immunoassay test (CLIA), while the levels of T4, FT4, TSH, anti-TG and anti-TPO antibodies were quantified by the automated chemiluminescent microparticle immunoassay test (CMIA).
Statistical analysis
IBM SPSS Statistics for Windows v20 (IBM Corp., Armonk, NY, USA) was used for statistical analysis of data. The obtained data are presented as the mean ± standard error (SE) and median; interquartile range (IQR), depending on the data normality. The data normality distribution was tested with the Kolmogorov-Smirnov test. For evaluation of significant difference between experimental groups, Student’s t, Mann-Whitney, Wilcoxon signed rank and χ2 tests were used. For correlation analyses between biochemical parameters with demographic and clinical characteristics the Pearson and Spearman tests were used. Simple and multiple linear regression tests were used for assessment of the predictive value of single and multiple parameters for different clinical characteristics. The Kruskal-Wallis H test was used to infer the difference of biochemical parameters values between different TNM stages of PTC patients. Two-step cluster analysis with log-likelihood distance measurement was used to determine AOPP, total thiols, DNase I and DNase II activity clustering pattern based on the demographic characteristics, clinical and pathological parameters according to Schwarz’s Bayesian criterion. Differences were considered statistically significant at p < 0.05.
Results
Demographic and clinical data
Basic demographic and clinical characteristics of PTC and goiter patients are shown in Table I. Papillary thyroid carcinoma and goiter patients are matched by age, gender, BMI, smoking status and familiar history of thyroid disease. There are no confounding factors among clinical parameters according to the lack of a statistically significant difference between experimental groups.
Table I
Clinical features and laboratory results of PTC and CG patients. Reference ranges were obtained from the referral institution’s laboratory
| Parameter | PTC patients | CG patients | P-value |
|---|---|---|---|
| Number of patients | 67 | 47 | |
| Age [years] | 54.03 ±1.72a | 66; 13b | 0.15‡ |
| Gender (male/female) | 23/44c | 15/32c | 0.52 |
| BMI [kg/m2] | 23.56 ±4.1a | 22.08 ±5.87a | 0.41† |
| Smoking (yes/no) | 14/53c | 11/34c | 0.64& |
| Heredity (yes/no) | 18/49c | 15/32c | 0.28& |
| Nodule size [cm] | 3.19 ±0.19a | 3.67 ±0.22a | 0.55† |
| Retrosternal (yes/no) | 7/60c | 6/41c | 0.37& |
| Capsular invasion (yes/no) | 20/47c | – | – |
| Multicentricity (yes/no) | 21/46c | – | – |
| T3 [nmol/l] | 1.76; 0.61b | 1.98 ±0.09a | 0.11‡ |
| Free T3 [pg/ml] | 4.79 ±0.16a | 4.76 ±0.27a | 0.92† |
| T4 [nmol/l] | 108.45 ±3.89a | 115.7 ±4.56a | 0.24† |
| Free T4 [pg/ml] | 14.79 ±0.46a | 15.01 ±0.63a | 0.78† |
| TSH [μIU/ml] | 1.74; 2.07b | 1.18 ±0.16a | 0.07‡ |
| TG [ng/ml] | 138.5; 343.36b | 182.94; 45.99b | 0.94‡ |
| anti-TG-ab [IU/ml] | 20.95; 28.16b | 20; 8.66b | 0.51‡ |
| anti-TPO-ab [IU/ml] | 14.84; 218.49b | 12.1; 23.63b | 0.42‡ |
The TNM stage of PTC patients is presented in Table II. Most of the PTC patients had T1 tumors, for most of which there was no evidence of lymph node metastases at the time of surgery (Table II).
Table II
TNM stage of PTC patients
| TNM | Stage | Number of patients (%) |
|---|---|---|
| T | 1 | 31/67 (46.3) |
| 2 | 17/67 (25.4) | |
| 3 | 18/67 (26.9) | |
| 4 | 1/67 (1.5) | |
| N | 0 | 9/67 (13.4) |
| 1 | 14/67 (20.9) | |
| 2 | 0/67 (0) | |
| X | 44/67 (65.7) | |
| M | 0 | 67/67 (100) |
| 1 | 0/67 (0) |
Additionally, none of the PTC patients had evidence of distant metastatic disease. Different TNM stages do not differ significantly in values of examined biochemical parameters.
Biochemical analyses
The results of examined redox parameters and deoxyribonucleolytic activities are presented in Table III. None of the examined tissue has an increased AOPP concentration, while the total thiols concentration is significantly lower in PTC tissue then in healthy and goiter tissue. The tumor tissue has increased DNase I and DNase II activity compared with healthy and goiter tissue.
Table III
Results of AOPP, total thiols, DNase I and DNase II activities in tumor tissue and healthy thyroid tissue of PTC patients and in CG tissue of control patients
| Group | AOPPa | Total thiolsb | DNase Ic | DNase IIc |
|---|---|---|---|---|
| Tumor tissue | 2.93; 2.39 | 2.99; 3.42* | 1.07; 2.26* | 1.19; 1.84* |
| Healthy tissue | 3.04; 1.92 | 4.96; 4.8 | 0.63; 1.22 | 0.71; 1.09 |
| CG tissue | 3.82; 2.53 | 3.37; 1.31** | 0.92; 2.12 | 1.49; 1.59 |
Distribution of biochemical parameters was examined in tumors which have capsular invasive vs. noninvasive as well as in tumors with and without multicentric intrathyroid dissemination. No significant differences were found in values of biochemical parameters when they were examined in terms of presence of absence of capsular invasion and multicentric intrathyroid dissemination. The male patients with PTC patients had significantly (p < 0.05) greater tumor size (3.5; 2 cm) than female PTC patients (2.9; 1.2 cm). There were no significant differences between male and female patients in both experimental groups, regarding the clinical and biochemical parameters. PTC patients who smoke have a significantly (p < 0.005) lower total amount of thiols in normal thyroid tissue (3.11; 2.9 μmol/mg of proteins) than nonsmokers (5.46; 4.66 μmol/mg of proteins). Previous family history of thyroid disease and retrosternal localization do not influence the distribution of any clinical or biochemical parameter in the PTC and control group.
Relations between demographic, clinical and biochemical parameters
The existence of a correlation between all demographic, clinical and biochemical parameters was assessed. Table IV shows statistically significant correlations in the PTC patient group. Multiple correlations demonstrate dependence between thyroid hormone activity and redox status. Also, DNase I activity in tumor tissue positively correlates with circulating T4, as well as with AOPP amount in tumor and healthy thyroid tissue. Smoking habit directly influences the total amount of thiols in healthy tissue, while older patients have higher activities of DNase II in healthy tissue. The negative correlation between total amount of thiols and AOPP in tumor tissue reflects induced antioxidative activity. Higher values of TSH appear to lower the total amount of thiols in healthy tissue. Activities of both DNases rise mutually in tumor tissue.
Table IV
List of statistically significant correlations between demographic, clinical and biochemical parameters in PTC patient group
| Tested parameters | Correlation coefficient | P-value |
|---|---|---|
| Age + DNase II activity in healthy tissue | 0.301a | < 0.05 |
| Smoking + total thiol amount in healthy tissue | 0.414b | < 0.001 |
| T3 + AOPP amount in healthy tissue | 0.377b | < 0.01 |
| T3 + total thiol amount in healthy tissue | 0.311b | < 0.05 |
| T4 + AOPP amount in tumor tissue | 0.397b | < 0.005 |
| T4 + DNase I activity in tumor tissue | 0.339b | < 0.05 |
| TSH + total thiol amount in healthy tissue | –0.281b | < 0.05 |
| AOPP + total thiol amount in tumor tissue | –0.253b | < 0.05 |
| AOPP + DNase I activity in healthy tissue | 0.355b | < 0.005 |
| AOPP + DNase I activity in tumor tissue | 0.254b | < 0.05 |
| DNase I + DNase II activities in tumor tissue | 0.272b | < 0.05 |
Statistically significant correlations in the CG group are presented in Table V. Larger goiters have an increased amount of thiols and lowered DNase I activity. Increased T4 synthesis is followed by a decline in AOPP amount, while higher TSH levels in circulation stimulate production of AOPP.
Table V
List of statistically significant correlations between demographic, clinical and biochemical parameters in CG patient group
| Tested parameters | Correlation coefficient | P-value |
|---|---|---|
| Nodule size + total thiol amount | 0.466a | < 0.001 |
| Nodule size + DNase I activity | –0.295b | < 0.05 |
| T4 + AOPP | –0.405b | < 0.05 |
| TSH + AOPP | 0.363b | < 0.05 |
Single and multiple regression analysis
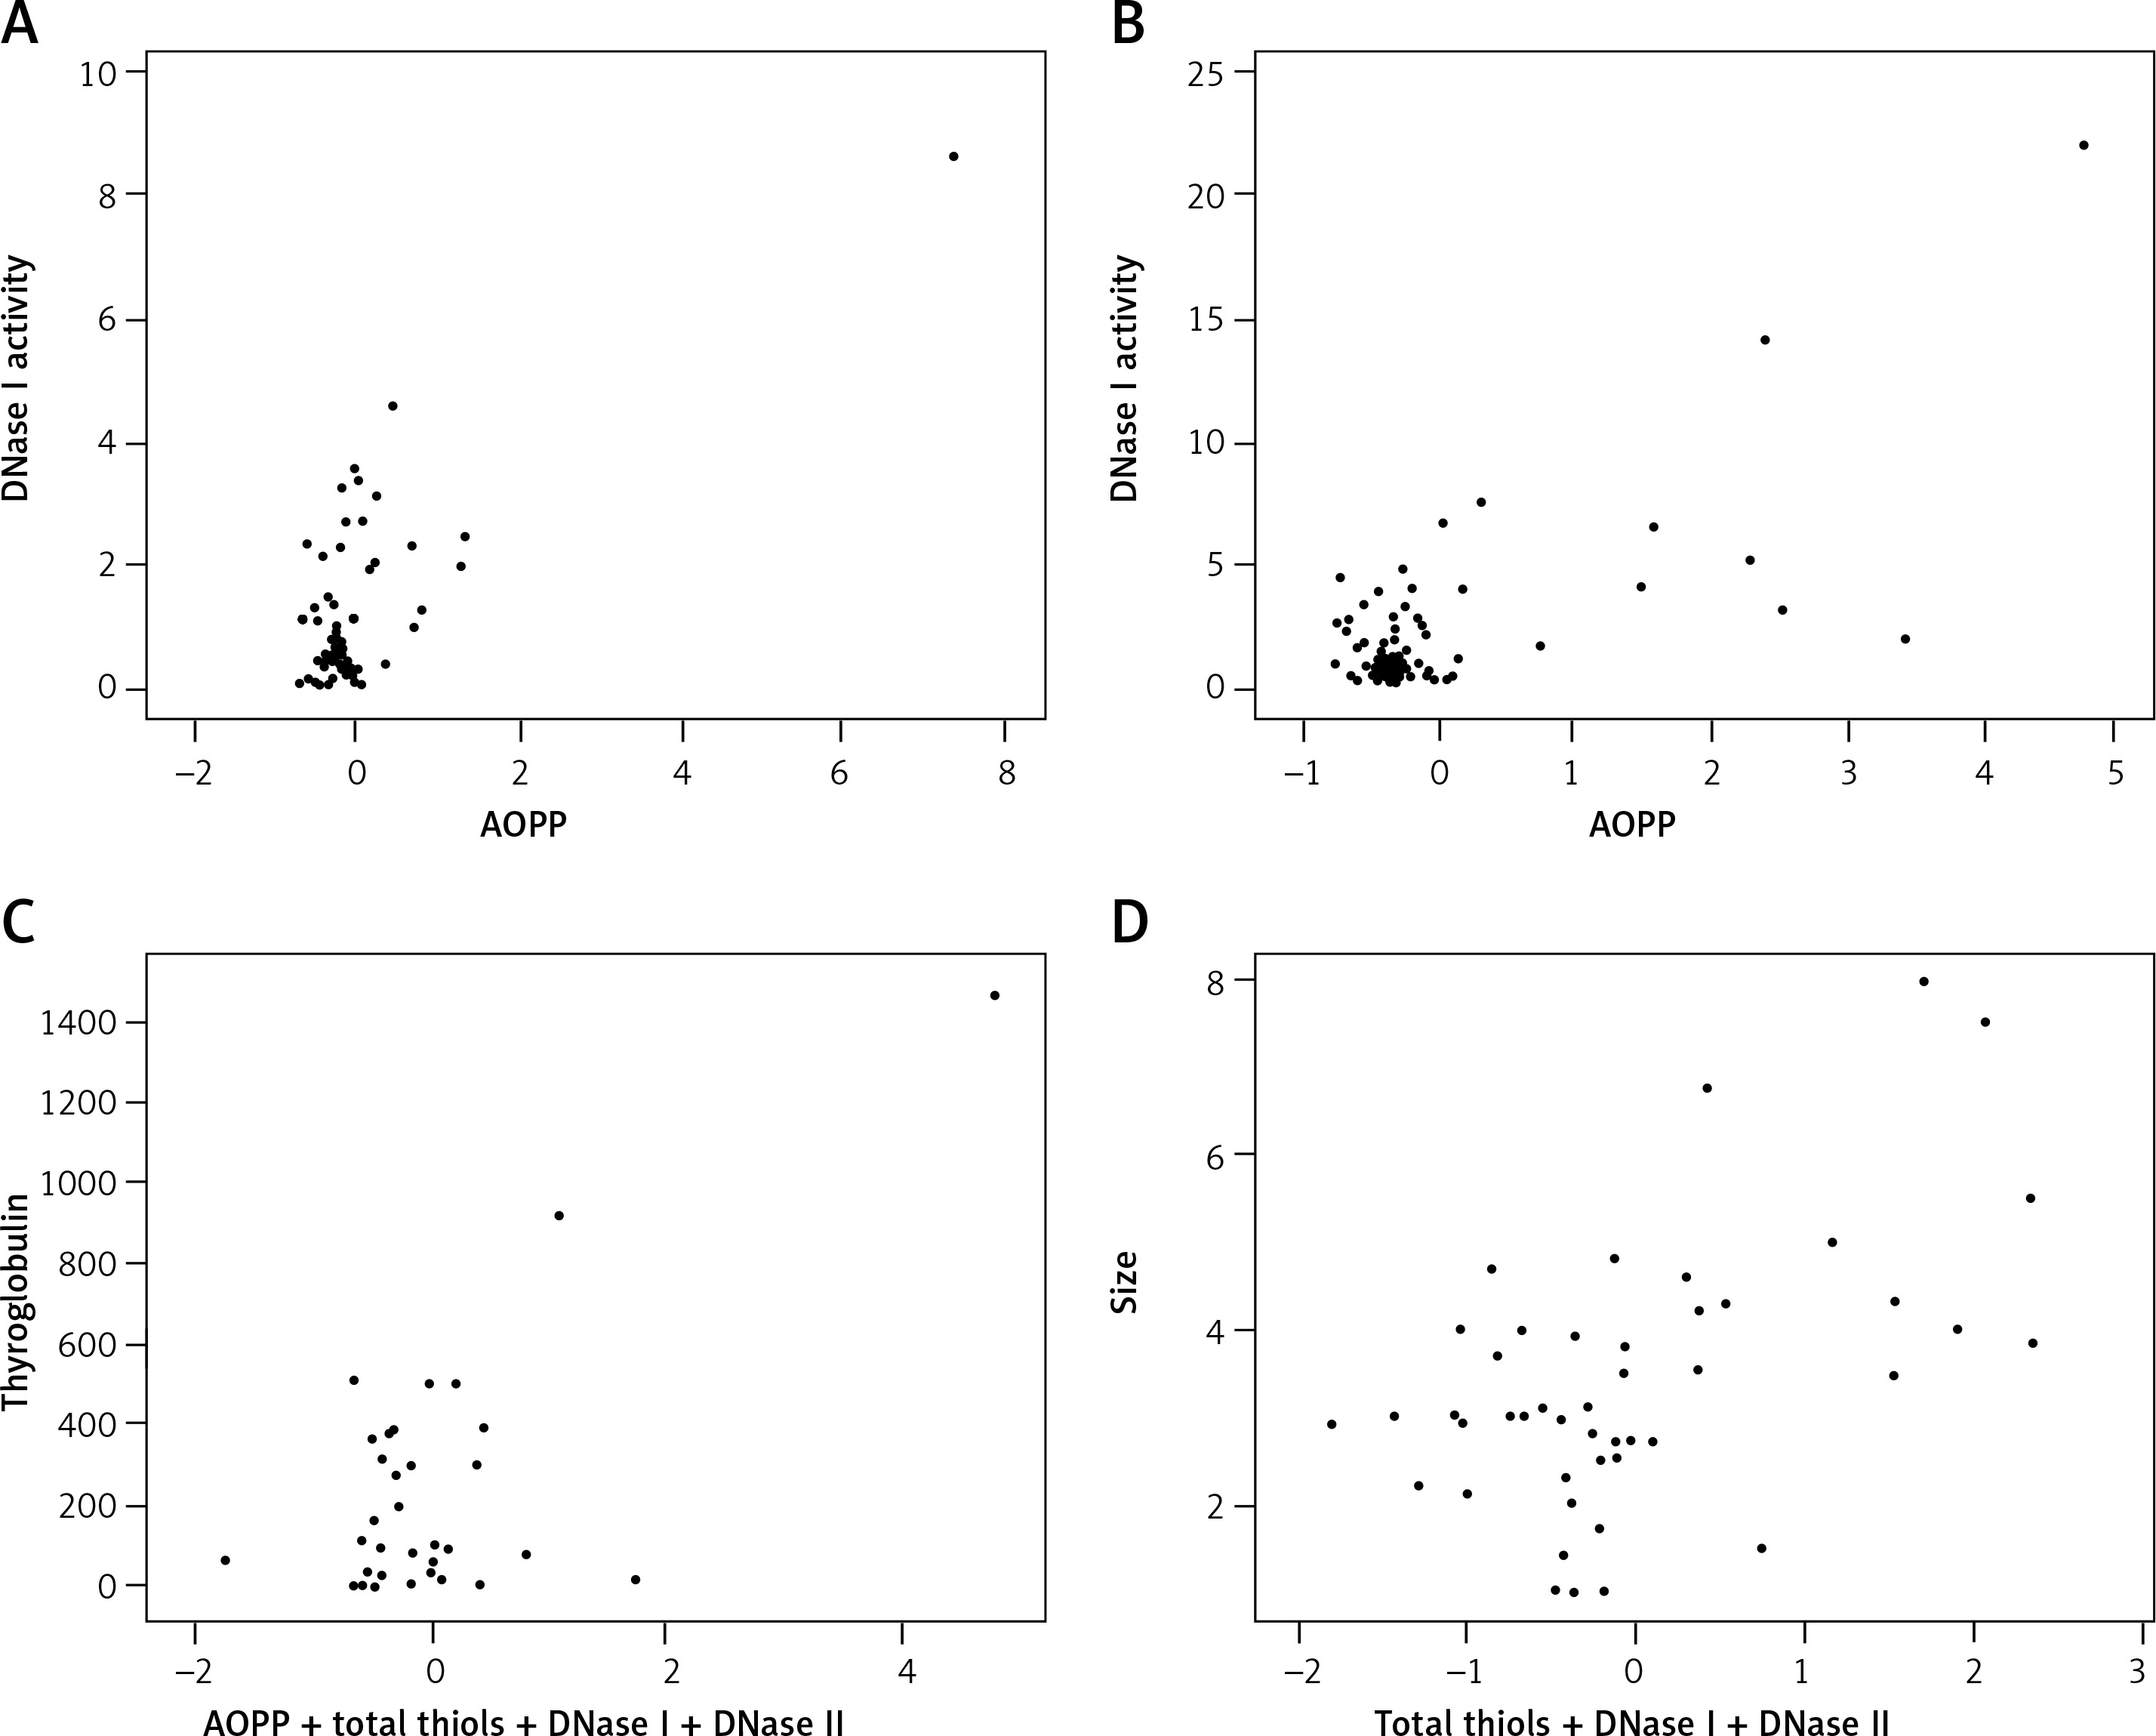
The interrelationship between biochemical parameters as well as their influence on clinical characteristics was examined by single and multiple linear regression models in both groups. The R2 adjusted values were calculated for each model. Figure 1 shows statistically significant single and multiple regression models in PTC and CG patients. Figure 1 A shows the regression relationship (p < 0.001, R2 = 0.533, SE = 0.96) between DNase I activity and AOPP amount in normal thyroid tissue of PTC and it was modeled by the following equation: DNase I = (0.188) AOPP + 0.381. A significant regression model (p < 0.001, R2 = 0.5, SE = 2.37) was also established between DNase I activity and AOPP amount in tumor tissue, as can be seen in Figure 1 B. This relation was modeled by the following equation: DNase I = (0.372) AOPP + 0.348. By using a multiple linear regression model, it was found that the combination of AOPP concentration, total amount of thiols, DNase I and DNase II activity has better predictive value for plasma TG concentration than their individual influence. Figure 1 C shows the significant dependence (p < 0.001, R2 = 0.463, SE = 229.24) of a combination of AOPP, total thiols, DNase I and II activities in tumor tissue on plasma TG levels of PTC patients. This relation was modeled by the following equation: TG = (34.21) AOPP + 27.18 (total thiols) – 56.02 (DNase I) + 43.23 (DNase II) – 29.57. Additionally, the combination of total thiols, DNase I and II activities provided a significant regression model (p < 0.005, R2 = 0.405, SE = 1.34) in predicting the size of CG, as presented in Figure 1 D. This relation was modeled by the following equation: Size = (0.362) total thiols – (0.172) DNase I – (0.025) DNase II + 2.52.
Figure 1
Significant single and multiple regression models between biochemical and clinical parameters in both experimental groups. A – single regression model between DNase I activity and AOPP concentration in normal tissue of PTC patients. B – single regression model between DNase I activity and AOPP concentration in tumor tissue of PTC patients. C – multiple regression model between combination of AOPP, total thiols, DNase I and DNase II activities in tumor tissue and plasma thyroglobulin of PTC patients. D – multiple regression model between combination of total thiols, DNase I and DNase II activities and size of CG
Cluster analysis
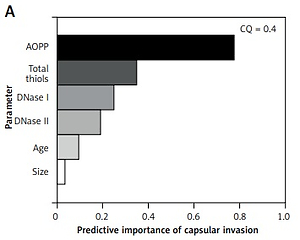
Biochemical parameters were evaluated in light of their influence on different clinical and pathological characteristics of PTC and CG. The two-step cluster analysis provided insight into the existence of data clustering around certain PTC and CG characteristics and evaluated the predictive power of demographic, clinical and biochemical parameters. Good quality of obtained clusters were considered to have a cluster quality score above 0.3, and only those clusters that satisfied this criterion were interpreted. The significant cluster models are shown in Figure 2, and they reveal that AOPP levels have the greatest predictive importance for tumor capsular invasion phenotype, multicentric intrathyroid dissemination, lymph node metastases as well as for the development of retrosternal goiter in the CG group.
Figure 2
Predictive importance values of biochemical and demographic parameters for different clinical and pathological characteristics of PTC and CG. A – predictive importance of biochemical and demographic parameters for existence of capsular invasion phenotype. B – predictive importance of biochemical and demographic parameters for multicentric intrathyroid dissemination of PTC. C – predictive importance of biochemical and demographic parameters for existence of lymph node metastasis among PTC patients. D – predictive importance of biochemical and demographic parameters for retrosternal thyroid localization among CG patients
CQ – Cluster Quality score.
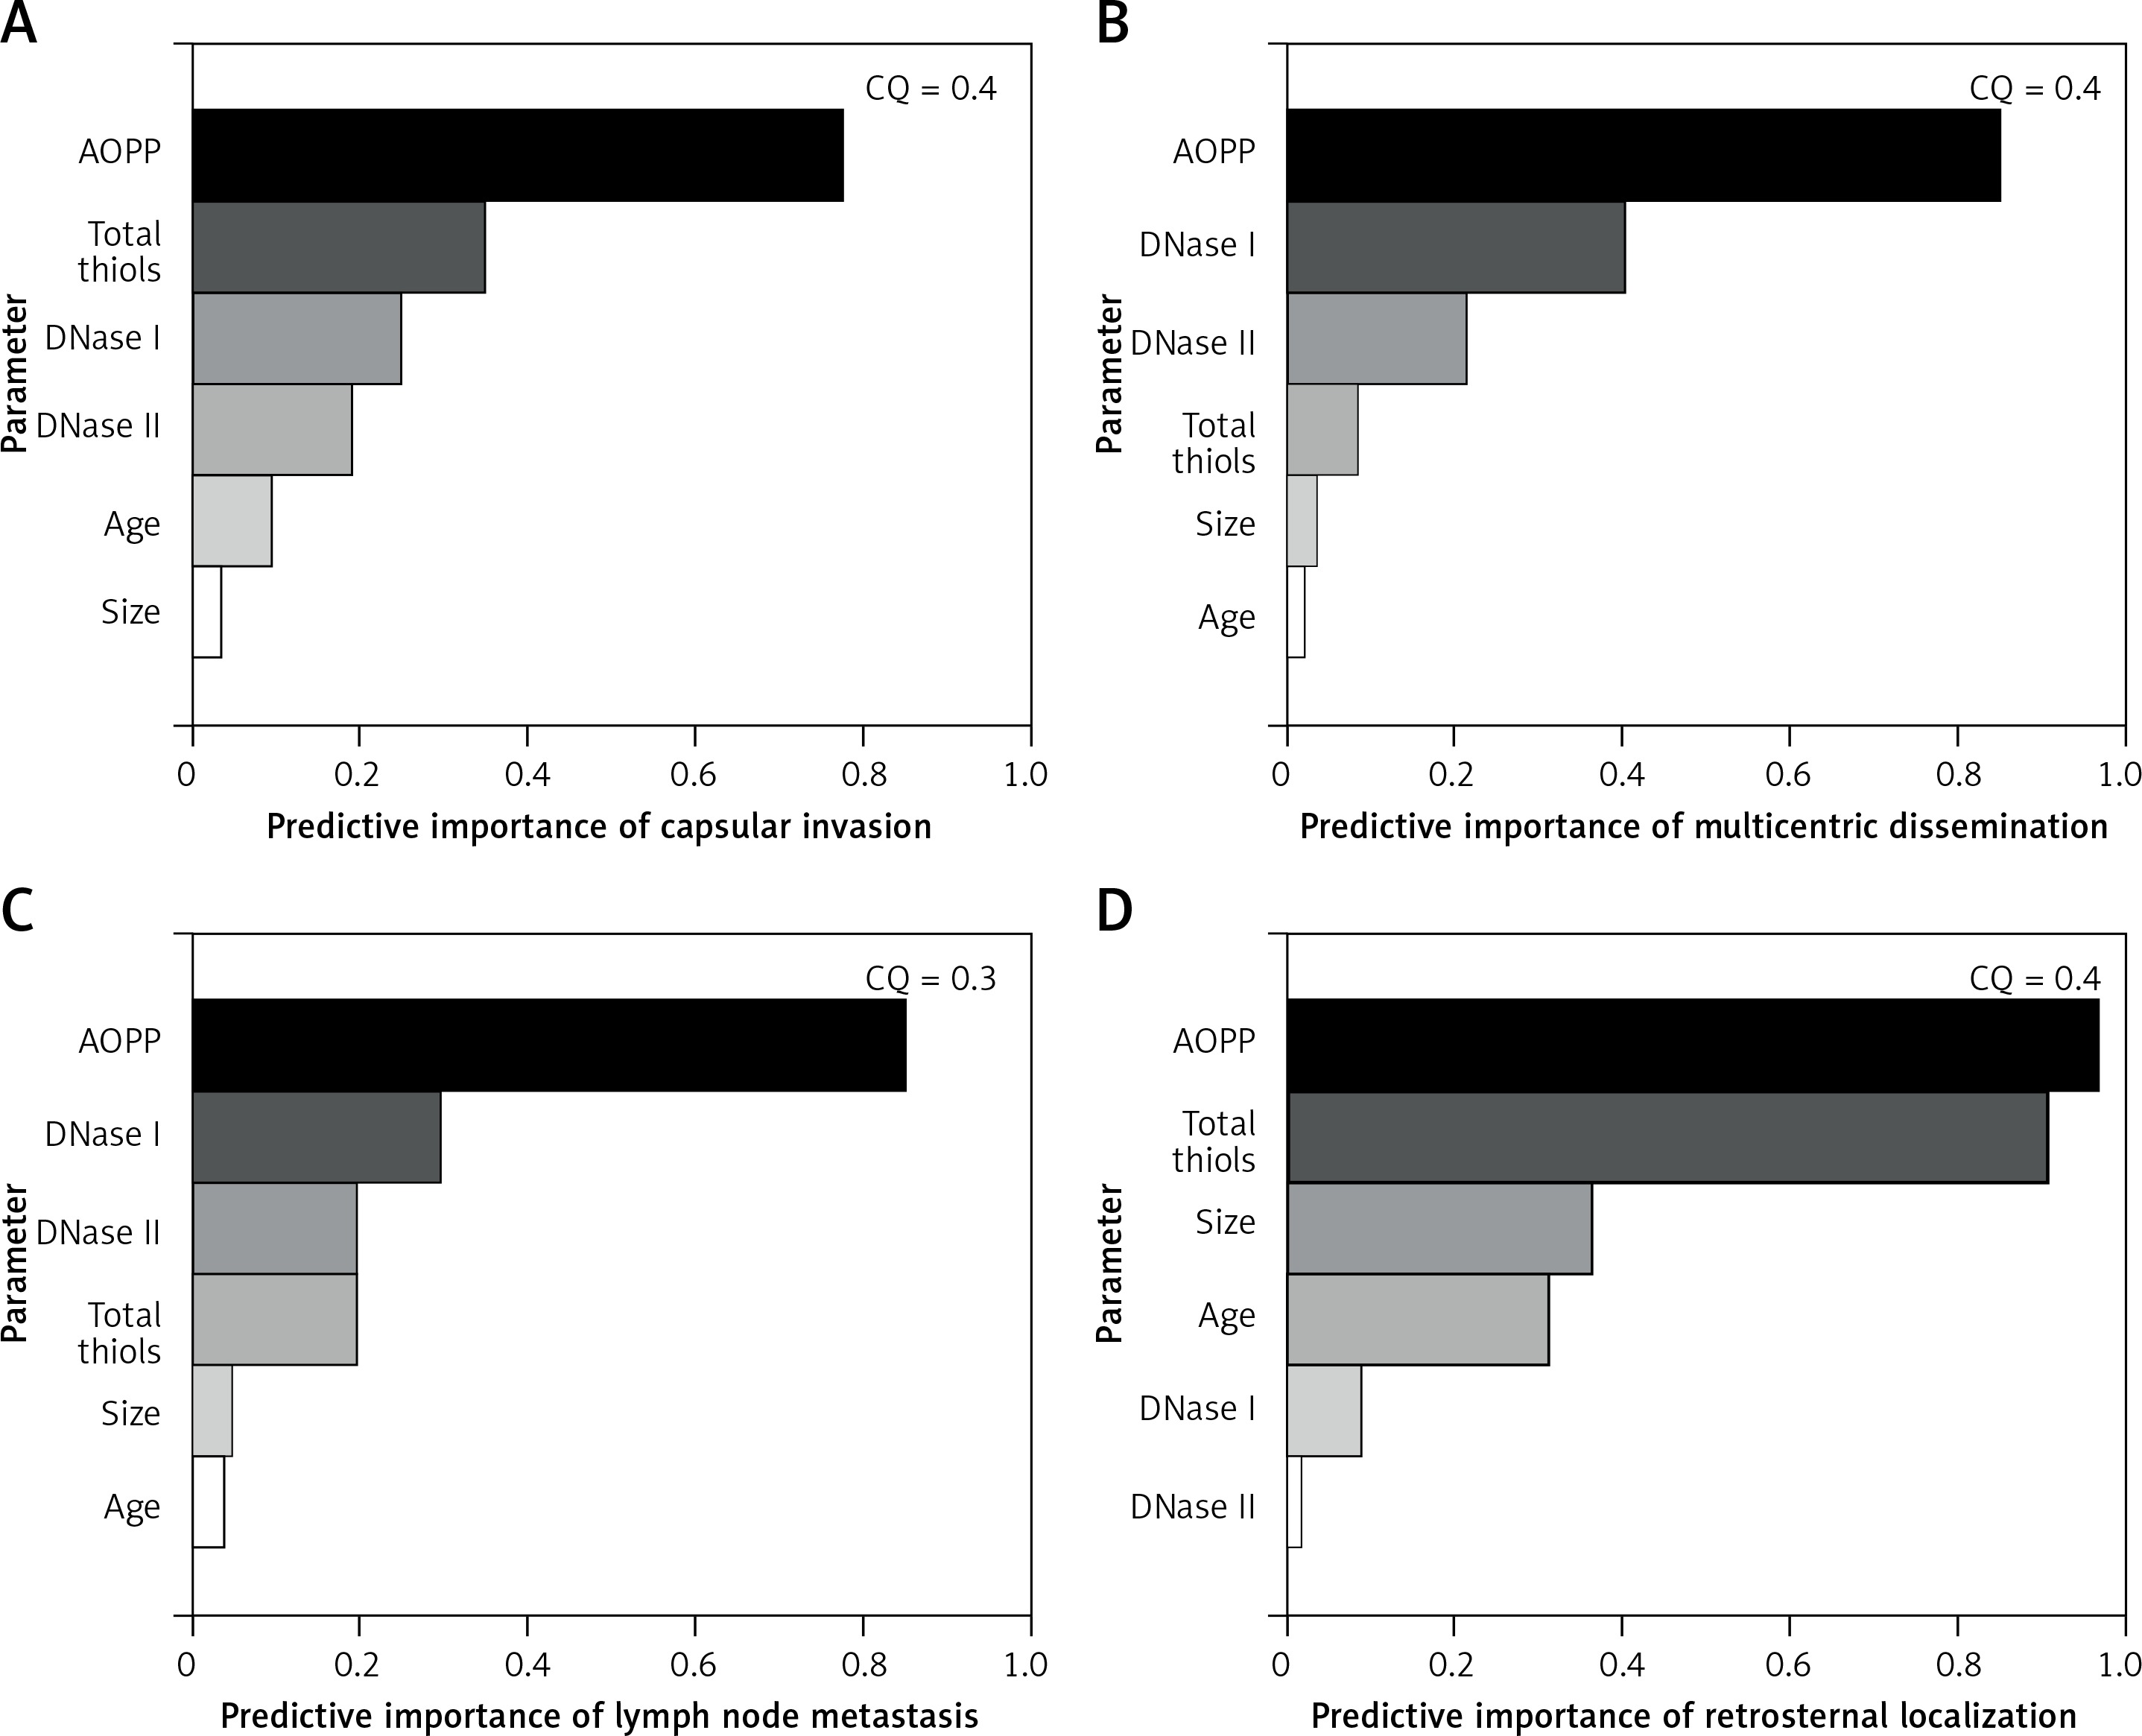
Gender, BMI, smoking status, family history of thyroid disease, circulating levels of thyroid hormones, antithyroid antibody titer, plasma TG concentration and T-stage of PTC did not provide satisfactory cluster quality scores for any examined characteristic of PTC and CG.
Discussion
One of the striking findings in this study is that PTC tissue is characterized by redox homeostasis, since there is no oxidative stress in comparison with normal thyroid and CG tissue, which makes PTC a rare tumor with such a biochemical hallmark. Previous studies have demonstrated the presence of oxidative stress in sera of patients with PTC [17, 18]. The compensatory role of total thiols in PTC tissue can be deduced from their decreased amount due to the utilization in free radical scavenging. The existence of an inverse correlation between AOPP amount and total thiols in tumor tissue supports the stance that augmented protein peroxidation is compensated by competent antioxidative mechanisms. Tumors in different TNM stages cannot be distinguished by means of AOPP and total amount of thiols. In our previous research we examined the overall redox status of PTC and CG by assaying total oxidant status (TOS), total antioxidant status (TAS) and oxidative stress index (OSI) [19]. Oxidative stress is a consequence of disturbed balance between prooxidants and antioxidant mechanisms and it is crucially involved in pathogenesis of different diseases [20]. Thyroid tissue is physiologically susceptible to oxidative stress since ROS represent substrates for thyroperoxidase during the synthesis of thyroid hormones and TG iodination [21]. The use of mentioned redox biomarkers provided general insight into the total cellular prooxidant and antioxidant profile, including enzymatic and non-enzymatic compounds. We demonstrated that PTC has increased antioxidative potential in comparison with the CG tissue, and that there are multiple correlations between redox status and clinical and pathological characteristics of PTC. Taking the results of this study into account, we can conclude that increased total amount of thiols contributes to the augmented TAS in PTC tissue. Thyroid synthetic function of PTC patients is closely related to the extent of redox metabolism, which is supported by several direct correlations between thyroid hormones on one hand and AOPP and total amount of thiols on the other. There are several factors that can explain the discrepancy between the results of our study and other published results. First, we obtained the results from tissue material, and according to our knowledge this is the greatest series of PTC patients who were subjected to tissue redox profiling. Previous studies have not performed comprehensive analyses of redox confounding factors that could influence the serum and tissue values of examined parameters. The inverse correlation between T4 levels and AOPP amount in CG patients leads to the conclusion that increased presence of colloid in CG tissue can act as a non-enzymatic free radical scavenger. This standpoint is additionally backed up by the positive correlation between CG size and total amount of thiols, which are also present in colloid beside the reduced glutathione as their main source. The CG level of protein peroxidation is dependent on the TSH level, which is explained by stimulation of ROS synthesis by TSH, which stimulates hydrogen peroxide production [22]. It was demonstrated that beside the hormone synthetic function the TG amount is greatly dependent on the cumulative effect of redox status and intensity of cellular turnover. Excessive oxidative stress can trigger apoptosis, which finally results in DNA breakdown mediated by DNase I and II [23]. Significantly increased DNase I and DNase II activities in tumor tissue reveal the amplified level of cellular turnover. The absence of deoxyribonucleolytic activity in normal thyroid tissue of PTC patients and CG tissue implies the state of cell division/death equilibrium, which is typical for normal and benign tissues. Cellular turnover in tumor tissue appears to be noticeably sensitive to a low amount of prooxidants, according to the direct correlation between AOPP and DNase I activity. This relation between DNase I activity and AOPP fits into the linear regression model in both tumor and normal thyroid tissue of PTC patients, showing that the tumor’s pathobiochemistry does not differ at this point from normal thyroid tissue. The synergistic activation of DNase I and DNase II present only in tumor tissue points to the existence of a fully activated effector cascade of apoptotic DNA degradation. The study of Young et al. revealed increased lipid peroxidation and DNA damage in tumor tissue of PTC [24]. Different TNM stages do not have a specific DNase I and DNase II profile, suggesting the preservation of apoptosis intensity and tumor differentiation. The size of CG is directly dependent on the goiter’s antioxidative environment and its proliferative turnover intensity reflected in DNase I and DNase II activity. Parameters which we examined in this study, redox biomarkers and deoxyribonucleases were proven to reflect the profile of different clinical features in the PTC and CG group. Although there is no significant difference in AOPP levels in any experimental group, it was proven that AOPP levels have the greatest predictive value for PTC features which include capsular invasion, multicentric dissemination and ability to cause lymph node metastases. Also, AOPP and total thiols are the most powerful predictors of retrosternal goiter localization, beside age, size and DNase activity. It is apparent that such tumor characteristics are finely tuned and determined even in the environment with low prooxidant quantity. It has been demonstrated that AOPP amount is the most important parameter for prediction of different malignant and benign characteristics of examined thyroid tissues. In the PTC group AOPP, together with total amount of thiols and deoxyribonucleolytic activity, has predictive importance for development of capsular invasion, multicentric dissemination and lymph node metastasis phenotype. Additionally, AOPP amount and total thiols almost equally show the marked potential to predict the retrosternal localization of CG out of all other analyzed parameters. It is interesting that significant data clustering around different tumor characteristics was achieved only for redox markers, DNase I, DNase II, age and size, while all other clinical and pathological parameters were poor predictors of PTC and CG phenotype. These findings are in agreement with the findings of Wang et al., who proposed that oxidative stress is related to papillary thyroid carcinogenesis and likely a risk factor for PTC progression [25].
The oncogenic potential of oxidative stress has been previously linked with PTC carcinogenesis [7]. Since the redox status is dependent upon numerous demographic, individual and clinical factors, the experimental and control group were matched in all relevant parameters and did not differ significantly. By these matching criteria we excluded the most significant confounding factors that could influence the oxidative/antioxidative status profile and the overall results obtained in this study.
In conclusion, in this study we evaluated for the first time the tissue levels of AOPP, total thiols, DNase I and DNase II in tissue of PTC and CG. Oxidative stress is absent in PTC patients, while the total thiols have the greatest utilization level in PTC tumor tissue, which results in its antioxidative potential. Elevated activity of DNase I and DNase II in PTC tissue indicates the increased cellular turnover in tumor tissue. Parameters of redox status and deoxyribonucleolytic activities correlate with numerous clinical and demographic characteristics of PTC and CG. AOPP is the most powerful predictive factor of PTC’s pathological characteristics and CG retrosternal localization. Redox status and cellular turnover are important pathophysiological entities in PTC and CG initiation and progression which can be used for assessment of the pathological and clinical course of both diseases.