

Migraine continues to be the dominant neurovascular disorder, impacting more than one billion individuals globally [1, 2], ranking as the second leading cause of disability based on the 2019 Global Burden of Disease, Injury, and Risk Factors Studies [2]. Recent findings suggest that migraine is influenced by oxidative stress, neuroinflammation, and mitochondrial impairment, which are crucial factors in their development [1, 3–5]. Previous research has consistently associated oxidative stress indicators with the development of migraine, such as 8-hydroxy-2-deoxyguanosine [6], superoxide dismutase, catalase, malondialdehyde [7], advanced oxidation protein products, ferric reducing antioxidant power, and thiol groups [4].
Lutein and zeaxanthin are both carotenoids that possess significant antioxidant properties, which can protect cells from damage caused by free radicals. These free radicals can trigger oxidative stress, potentially contributing to the development of various diseases [8]. Although considerable investigation has explored the positive effects of lutein/zeaxanthin on health [9–11], the specific relationship between serum lutein/zeaxanthin levels and migraine is not well understood. We hypothesise that higher serum lutein/zeaxanthin levels may be inversely associated with the prevalence of migraine. To test this hypothesis, we conducted a study aimed at investigating the potential correlation between serum lutein/zeaxanthin levels and migraine occurrence among adults in the United States.
Methods
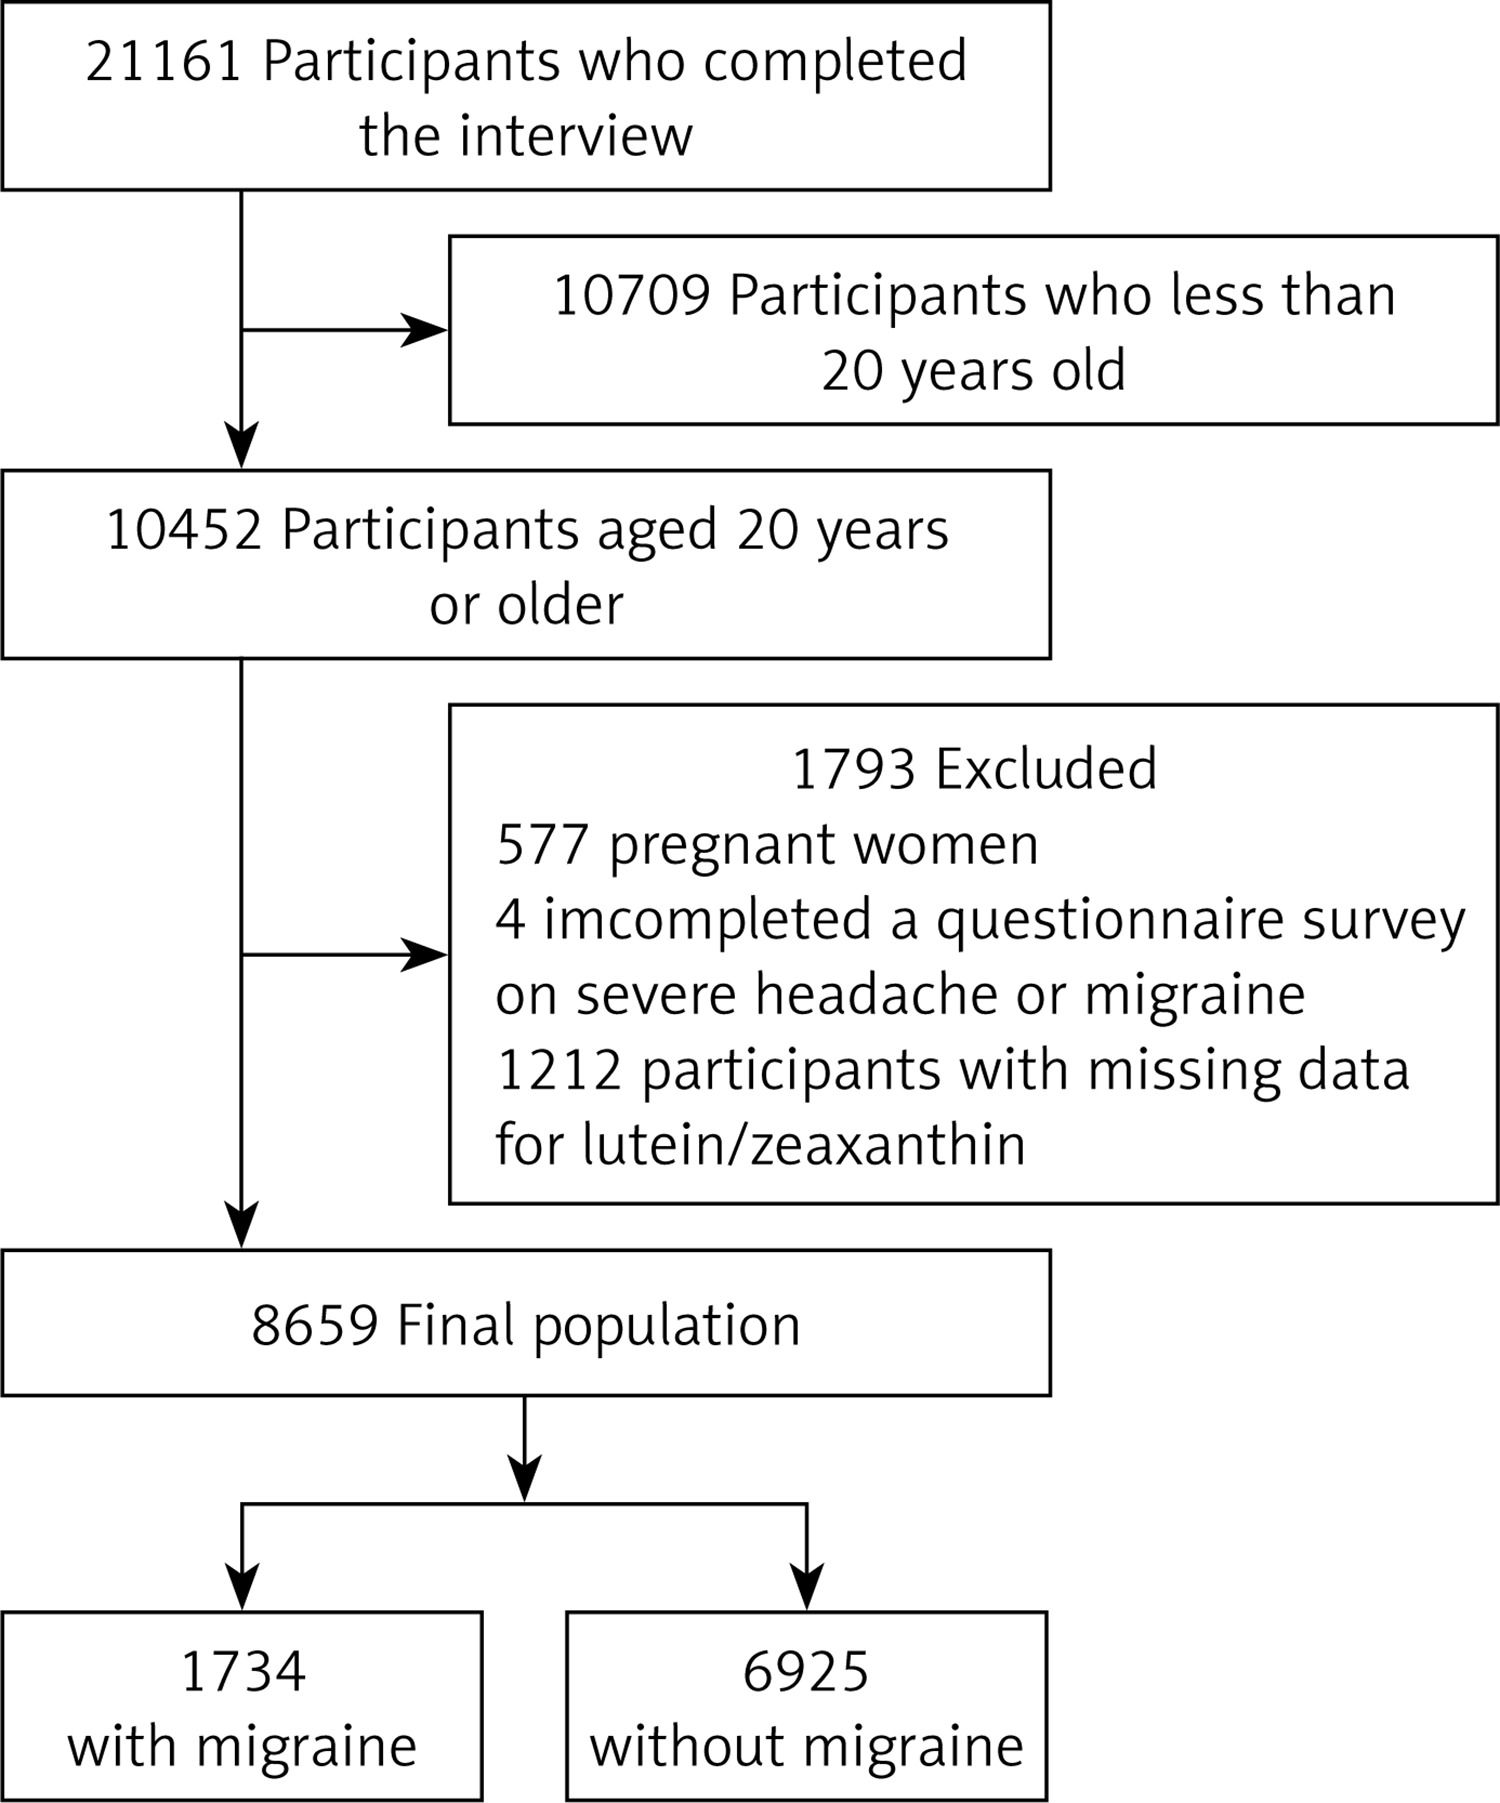
This cross-sectional analysis made use of data that was publicly accessible from the National Health and Nutrition Examination Survey (NHANES) from the website (https://wwwn.cdc.gov/nchs/nhanes/default.aspx). We enrolled participants aged 20 years or older (n = 10,452) who had participated in an interview between 2001 and 2004. Ultimately, 8659 participants were included for further analysis (1734 with migraine vs. 6925 without migraine). Figure 1 illustrates the comprehensive procedure of participant inclusion and exclusion. Descriptions of laboratory protocols and quality assurance techniques for measuring serum lutein/zeaxanthin are available on the websites (https://wwwn.cdc.gov/Nchs/Data/Nhanes/Public/2001/DataFiles/L06VIT_B.xpt and https://wwwn.cdc.gov/Nchs/Data/Nhanes/Public/2003/DataFiles/L45VIT_C.xpt). Identification of the presence of migraine in participants was made according to their answers to the questions in the miscellaneous pain survey [11, 12]. The covariates included sociodemographics (age, gender, body mass index, marital status, race, level of education, family poverty income ratio), lifestyle factors and comorbidities (physical activity, smoking habits, alcohol intake, presence of hypertension, diabetes), serum C-reactive protein, total cholesterol, vitamin D, vitamin E, energy intake, protein intake, carbohydrate intake, and dietary fibre intake, as stated in the available literature [12, 13].
Statistical analysis
Continuous variables were expressed as means with standard deviations (SD) or median (IQR), and categorical variables were expressed as percentages. Serum lutein/zeaxanthin was divided into quartiles. Group differences were tested using one-way ANOVA, Kruskal-Wallis, or χ2 test. Logistic regression was applied to estimate ORs and 95% CIs for the association between serum lutein/zeaxanthin and migraine. In the multivariate regression, we adjusted for sociodemographics in Model 1, for lifestyle factors and comorbidities in Model 2, and for all covariate factors in Model 3. We employed restricted cubic spline (RCS) regression evaluate the dose-response relationship between serum lutein/zeaxanthin and migraine in Model 3. Multiple imputation was conducted to reduce the impact of missing covariates on sample size reduction. Interaction effects by age (20–49 vs. ≥ 50 years) and sex were examined using multivariate logistic regression and likelihood ratio tests. To evaluate the robustness of the results, several sensitivity analyses were conducted. R 3.3.2 (http://www.R-project.org, The R Foundation, Shanghai, China) and Free Statistics software (version 1.7) were used for all statistical analyses [14]. We utilised a two-tailed test, and deemed a p-value less than 0.05 as having statistical significance.
Results
Characteristics of the study participants
Among the 8659 enrolled participants (mean age: 51 years; 50.7% male), the median (interquartile range) serum concentration was 25.5 (18.5, 35.0) nmol/dl for lutein/zeaxanthin. There were 1734 (20.0%) participants with migraine. Table I provides a summary of baseline characteristics of the participants based on quartiles of serum lutein/zeaxanthin levels.
Table I
Characteristics of the study population
Associations between serum lutein/zeaxanthin and migraine
Univariate analysis revealed significant associations between migraine and various factors, such as age, sex, body mass index (BMI), race/ethnicity, educational level, family income, hypertension, diabetes, smoking status, alcohol consumption, dietary carbohydrate consumption, and dietary fibre consumption (Table II).
Table II
Association of covariates and migraine risk
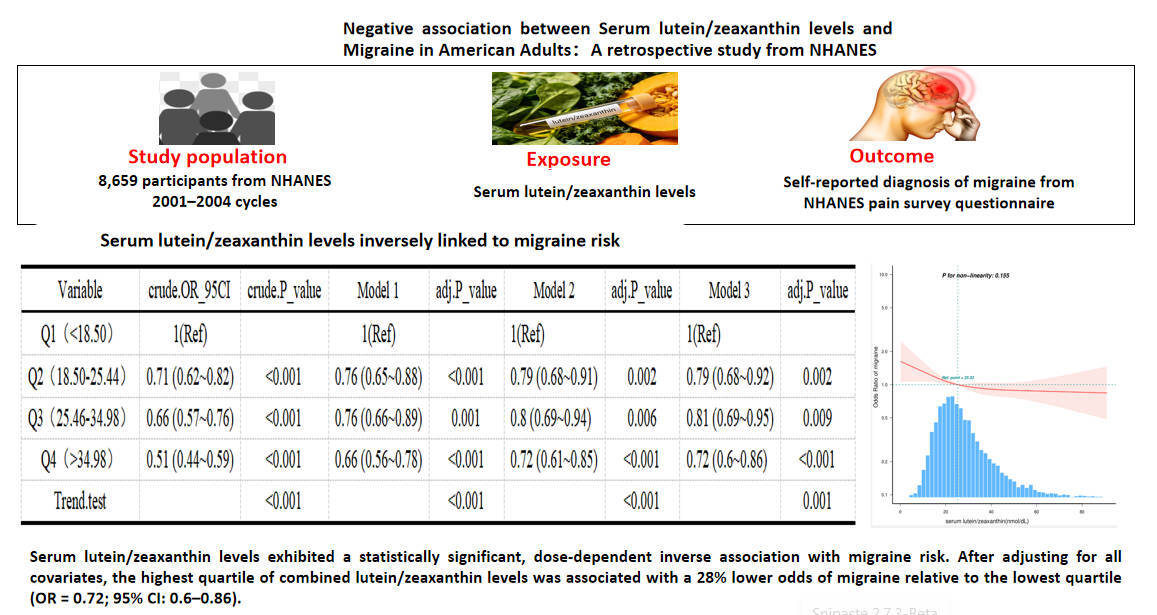
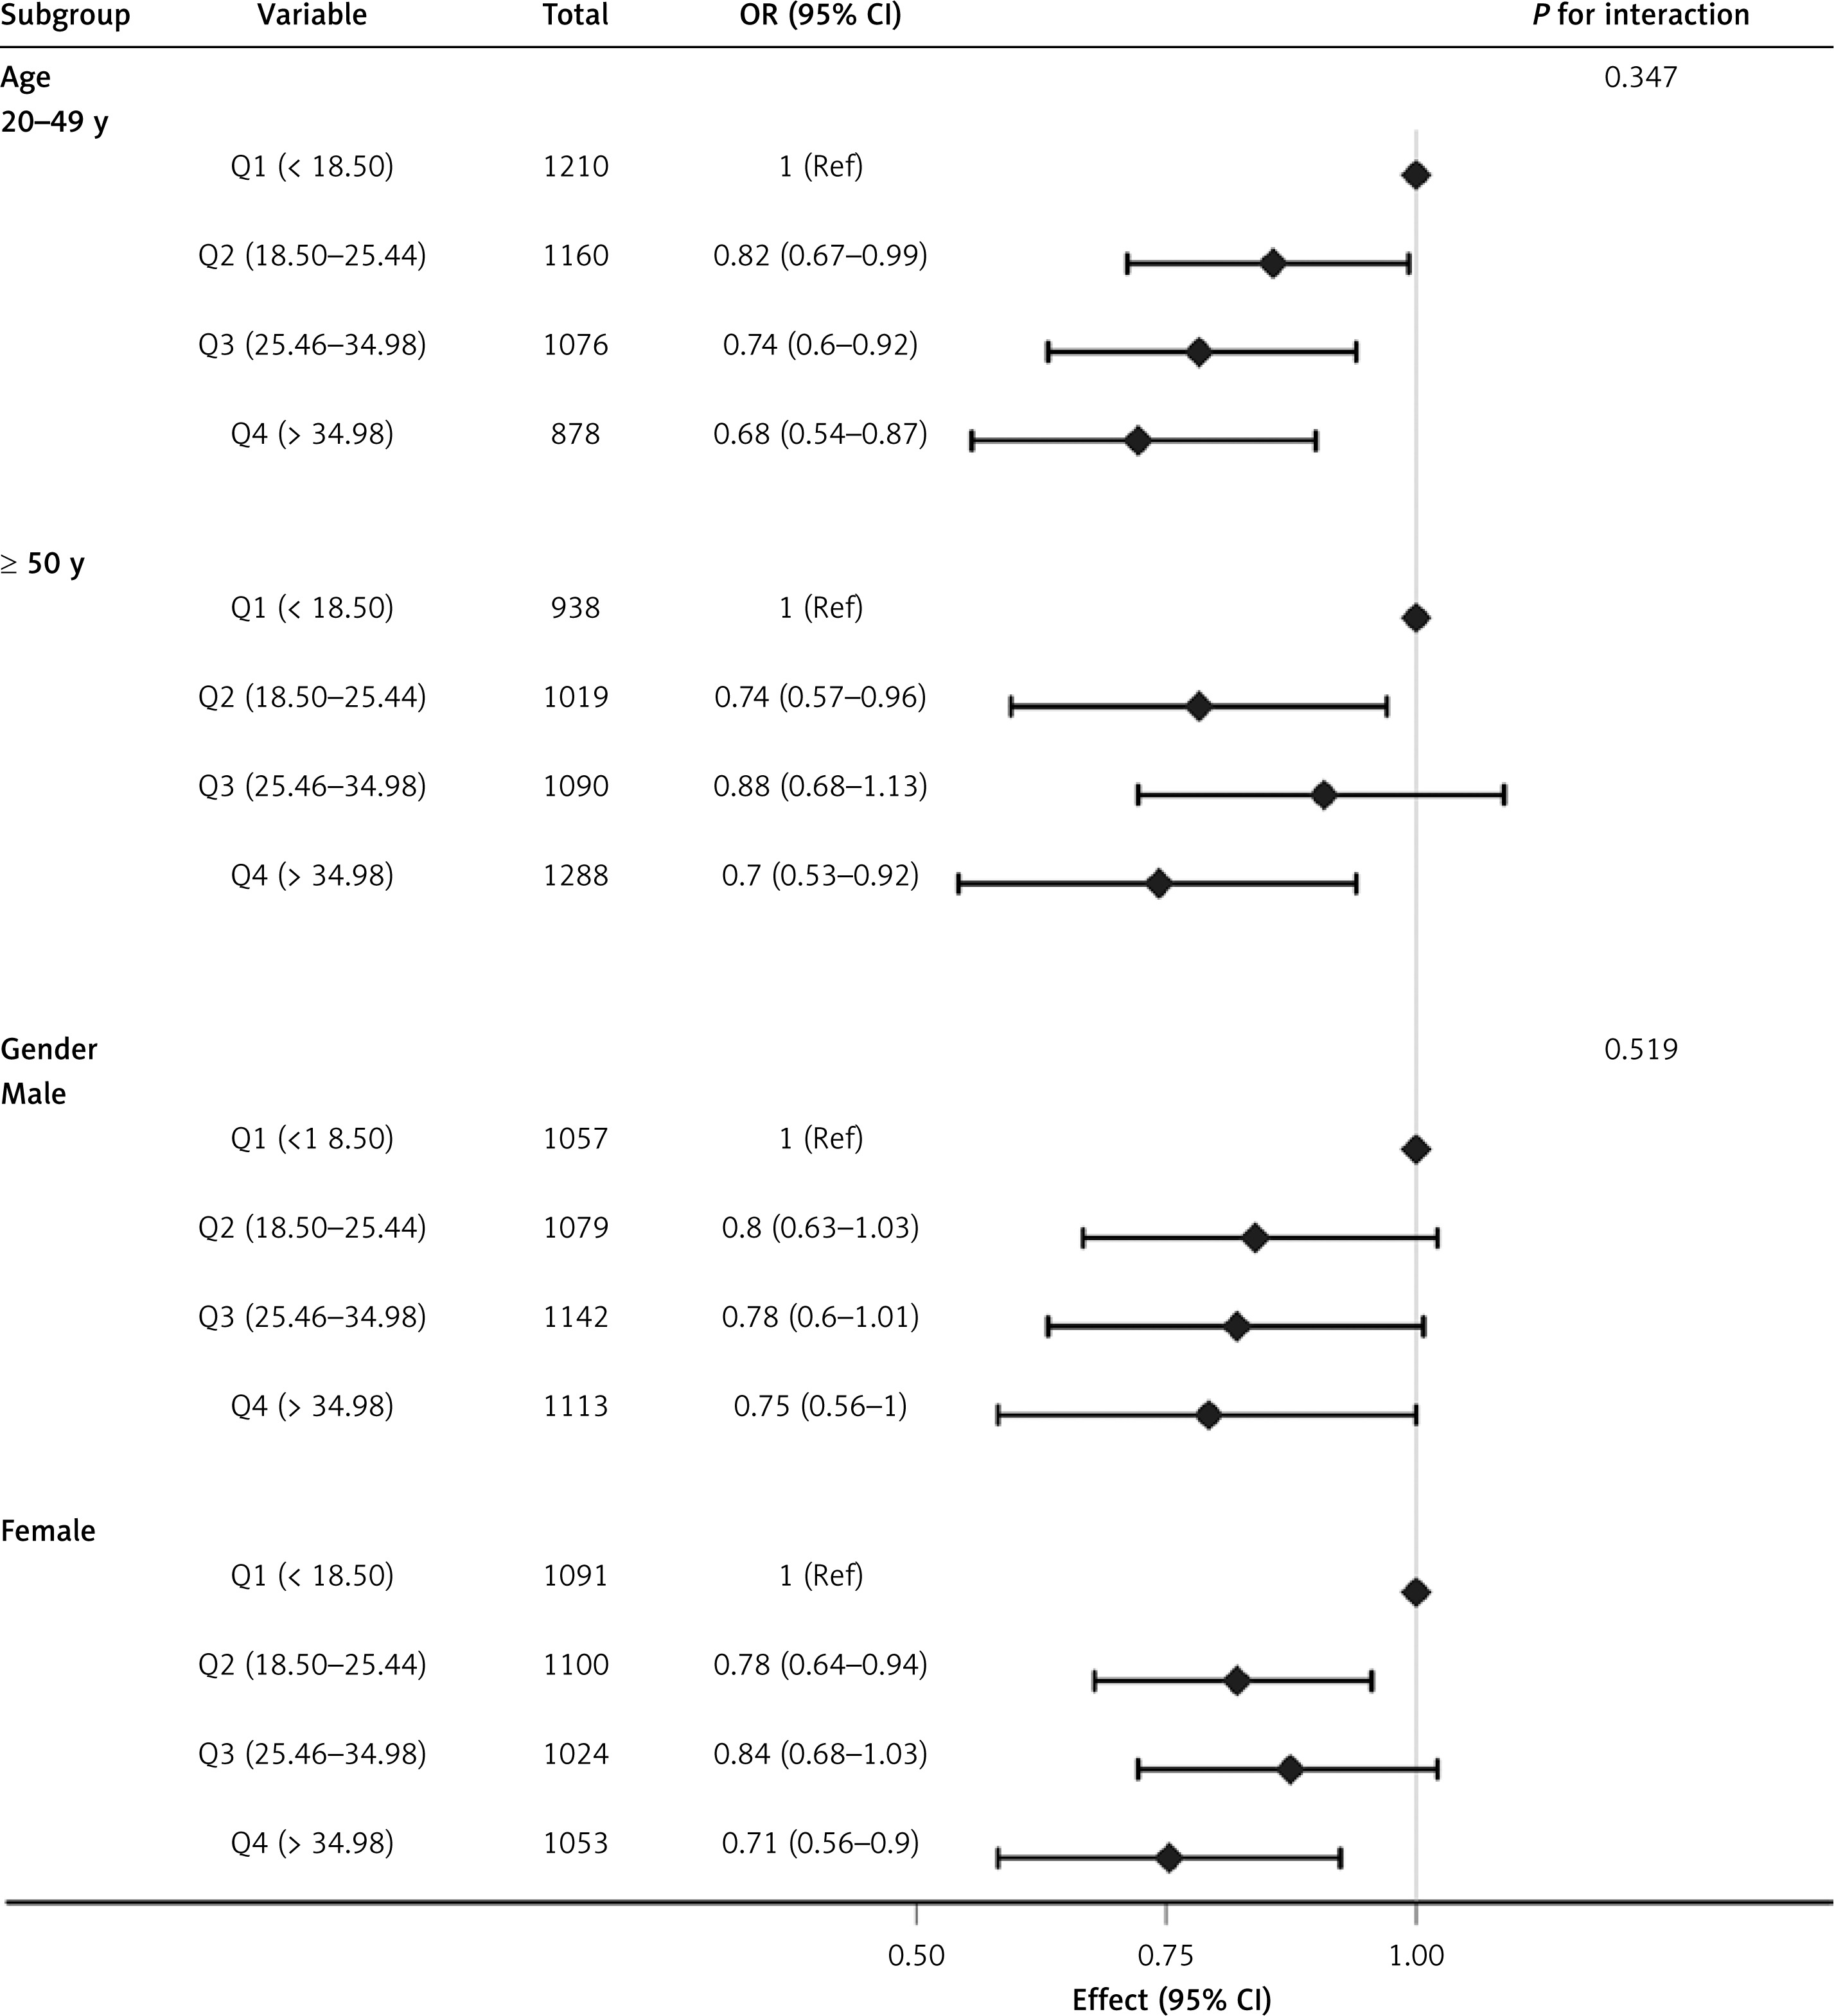
After fully adjusting for possible confounding factors, significant negative associations were found between migraine and serum lutein/zeaxanthin levels when analysing by quartiles. Compared to individuals with the lowest serum lutein/zeaxanthin levels in the first quartile (< 18.50 nmol/dl), those in the second quartile (18.50–25.44 nmol/dl), third quartile (25.46-34.98 nmol/dl), and fourth quartile (≥ 34.98 nmol/dl) exhibited adjusted odds ratios (ORs) for the association of serum lutein/zeaxanthin with migraine of 0.79 (95% confidence interval [CI]: 0.68–0.92, p = 0.002), 0.81 (95% CI: 0.69–0.95, p = 0.009), and 0.72 (95% CI: 0.60–0.86, p = 0.001), respectively. The detailed results are presented in Table III. In RCS, a negative linear dose-response association was observed between the levels of lutein/zeaxanthin in the blood and the risk of migraine (Figure 2). In the stratified analysis, there was a consistent negative correlation between serum lutein/cryptoxanthin levels and the risk of migraine. There were no significant interactions in any subgroups after stratification according to age, sex (Figure 3). In sensitivity analyses, the inverse association between serum lutein/zeaxanthin levels and migraine persisted consistently, even after excluding participants with missing data (Supplementary Table SI). Similarly, upon excluding individuals who were frequent analgesic users, our findings remained consistent (Supplementary Table SII). Furthermore, adjustments for dietary lutein/zeaxanthin did not alter the results (Supplementary Table SIII). Additionally, after further adjusting for other biomarkers such as dietary niacin, calcium, magnesium, iron, and zinc, the results remained stable (Supplementary Table SIV).
Table III
Association between serum lutein/zeaxanthin levels (nmol/dl)and migraine
[i] Q – quartiles, OR – odds ratio, CI – confidence intervals, Ref – reference. Model 1 was adjusted for sociodemographic variables (age, sex, body mass index, race/ethnicity, education level, family income, marital status). Model 2 was adjusted for Model 1, activity level, alcohol, smoking status, hypertension, diabetes. Model 3 was adjusted for Model 2, serum C-reactive protein, total cholesterol, vitamin D, vitamin E, dietary energy intake, dietary protein intake, dietary carbohydrate intake, and dietary fibre intake.
Figure 2
Association between serum lutein/zeaxanthin levels and migraine in RCS. Solid lines represent the predicted value; dashed lines, 95% CI. A serum lutein/zeaxanthin level of 25.33 nmol/dl was used as the reference to estimate all ORs. The model was adjusted for age, sex, body mass index, race/ethnicity, education level, family income, marital status, activity level, alcohol, smoking status, hypertension, diabetes, serum C-reactive protein, total cholesterol, vitamin D, vitamin E, energy intake, dietary protein intake, dietary carbohydrate intake, and dietary fibre intake. Only 99.5% of the data are displayed
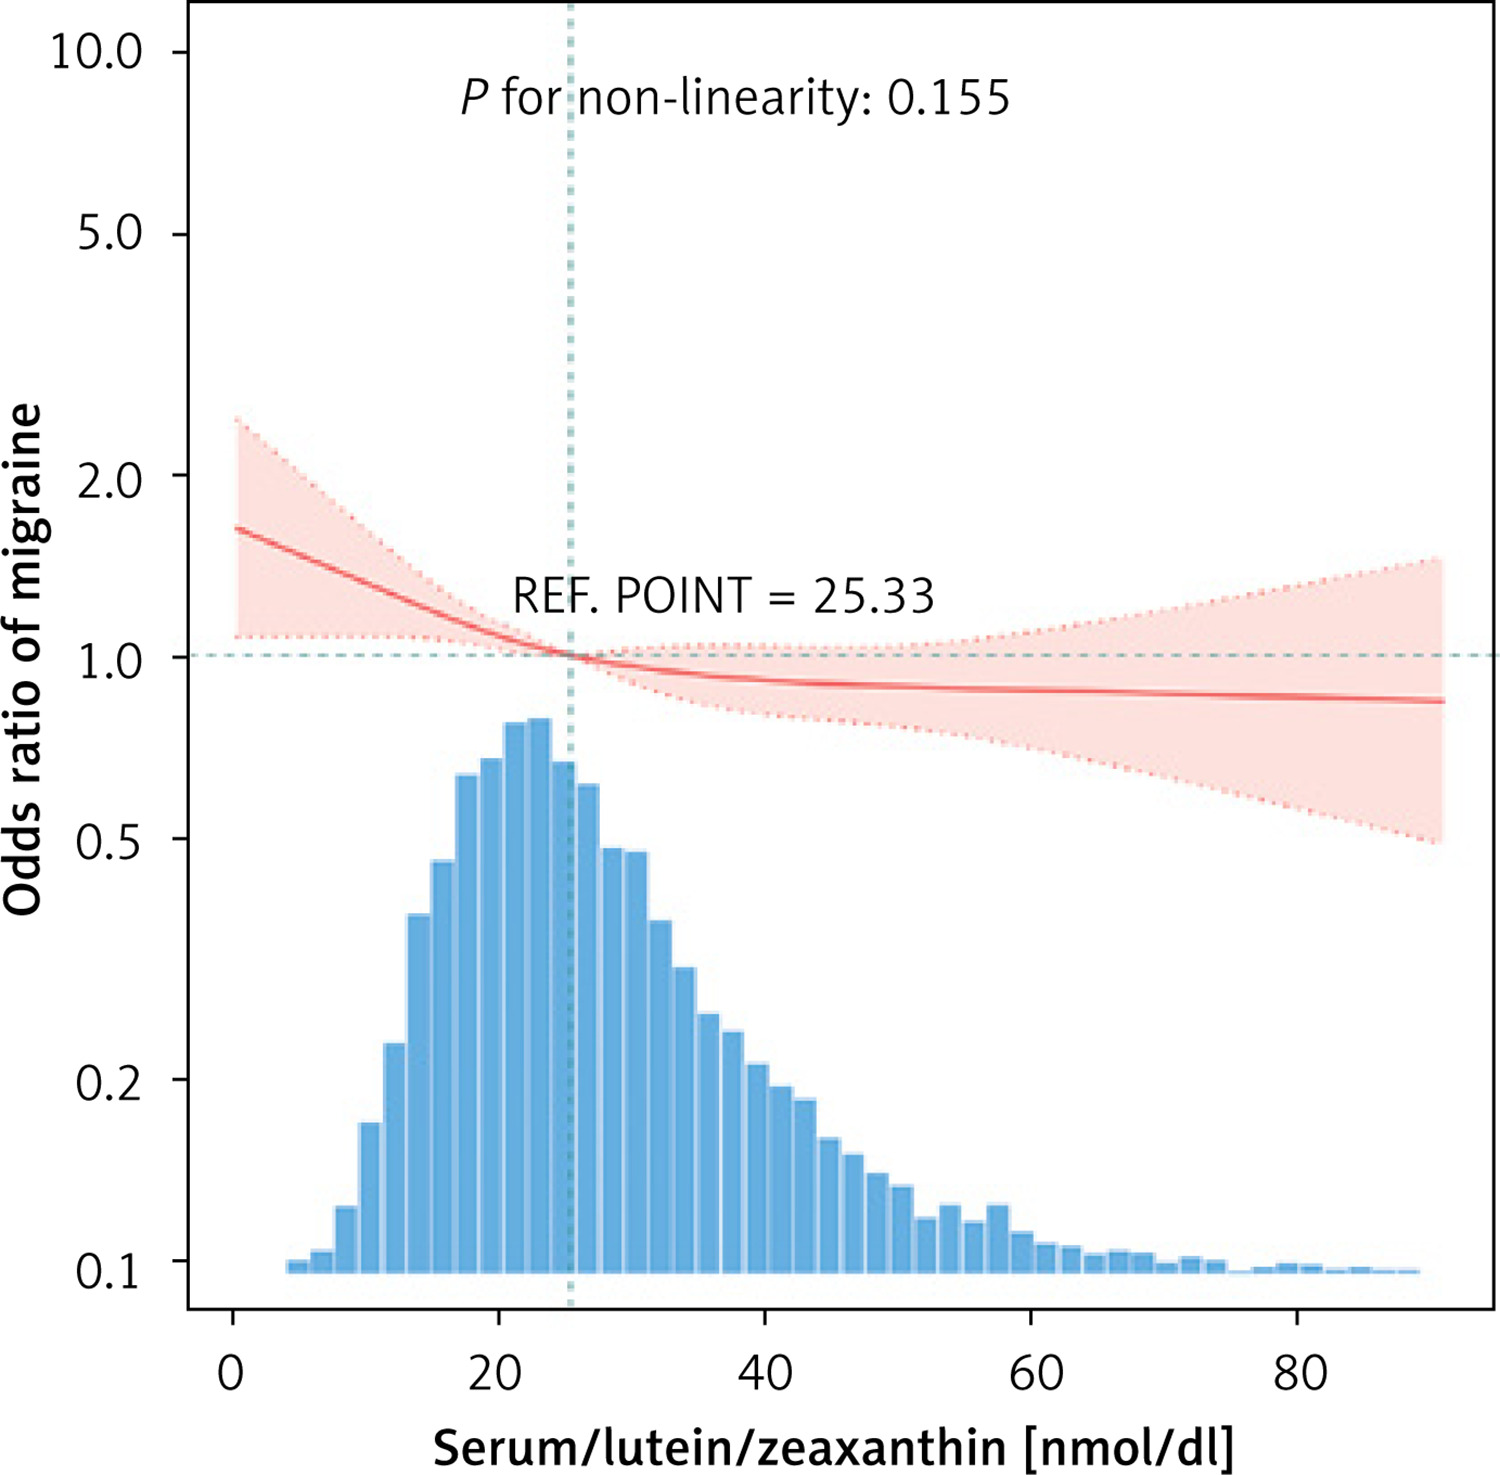
Figure 3
Association between serum lutein/zeaxanthin levels and migraine according to age and gender. Each stratification was adjusted for age, sex, body mass index, race/ethnicity, education level, family income, marital status, activity level, alcohol, smoking status, hypertension, diabetes, serum C-reactive protein, total cholesterol, vitamin D, vitamin E, energy intake, dietary protein intake, dietary carbohydrate intake, and dietary fibre intake
Discussion
Our findings indicate that higher levels of serum lutein/zeaxanthin are associated with a reduced risk of migraine, even after accounting for conventional risk factors. The consistency of this association is further supported by various stratified and sensitivity analyses, which confirm the robustness of our results.
Previous research found that increased levels of lutein/zeaxanthin in the blood are associated with a reduced likelihood of various illnesses, such as age-related macular degeneration, metabolic syndrome, and improved cognitive function [8–11]. Some studies have also shown that serum lutein and zeaxanthin levels are negatively correlated with the incidence of cardiovascular diseases, as well as with cardiovascular deaths and all-cause deaths among patients with hypertension [15, 16]. Zhang’s research indicates that the level of lutein/cryptoxanthin in the serum is negatively correlated with the risk of migraine, and this non-linear relationship follows a U-shaped pattern [17]. Hu’s research also shows that the ratio of lutein to cryptoxanthin in the serum is negatively correlated with the risk of migraine, but there is a linear relationship between these two variables [18]. The slight differences in the results of the two studies might be related to the inclusion and exclusion of covariates. Our research results are consistent with Hu’s. In this large-sample study, we found that increased serum lutein/zeaxanthin levels have a negative association with the likelihood of experiencing migraine, which is consistent with our hypothesis. In restricted cubic spline regression, a negative dose-response relationship between serum lutein/zeaxanthin levels and the prevalence of migraine was observed. The results of our study imply that more attention should be paid to serum lutein levels in migraine patients, and American adults should avoid lutein/zeaxanthin deficiency. However, further longitudinal studies with larger sample sizes are needed to delve deeper into the correlation between lutein/zeaxanthin levels and migraine in the future.
It is important to acknowledge the limitations of this study. First, outcomes such as severe headache and migraine were based on self-reported data, and we were unable to distinguish between different types of severe headaches. Additionally, due to the nature of the observational study design, we could not establish causality. Longitudinal studies are necessary for further confirmation. Furthermore, the collection of migraine data was limited to the period from 2000 to 2004 because data on both migraines and lutein/zeaxanthin were available simultaneously only during these 4 years. This limits our ability to verify our findings using NHANES data from other periods. Moreover, our results are based on adults in the United States, which may limit their generalisability to other populations.
In conclusion, our study reveals that increased levels of serum lutein/zeaxanthin are associated with decreased risk of migraine in American adults. However, further studies are needed to confirm our findings.

