Introduction
Gliomas are the most common primary intracranial tumours and can be classified into grades I–IV according to the World Health Organisation classification system of central nervous system tumours; gliomas of grades I and II are considered low-grade gliomas, whilst gliomas of grades III and IV are considered high-grade gliomas [1]. Amongst primary malignant central nervous system tumours, glioblastoma have the highest incidence (46.1% or approximately 3.2/100,000 population) [2]. At present, the therapeutic effect of glioma is poor. The 1- and 5-year survival rates of adult high-grade glioma are approximately 30% and 13%, respectively. The median survival times of anaplastic glioma and glioblastoma are approximate 2–3 years and 1 year, respectively. Glioma is prominently characterised by invasive growth commonly resulting in tumour migration and recurrence; indeed, this characteristic is an important cause of death among patients with glioma. Therefore, the emphasis of basic research on glioma is related to finding effective approaches to regulate the invasion and migration of glioma cells. Screening of new targets to effectively control the invasive growth of glioma cells is key to improving the survival of patients.
Nur77 belongs to the three-member orphan receptor superfamily, which includes Nurr1 and Nor-1. Preliminary studies have revealed that Nur77 can simultaneously promote the proliferation and apoptosis of tumour cells. Nur77 plays different roles in determining cell death or growth according to its localisation in mitochondria or nuclei. It is widely expressed in various tissues and commonly over-expressed in lung cancer, gastric cancer, colon cancer, and rhabdomyosarcoma [3–5]. Studies on the relationship between Nur77 expression and cancer are generally carried out from two points of view; namely, the function of Nur77 as a transcription factor and its role as a non-transcription factor. Activation of the transcriptional function of Nur77 can affect cell proliferation, migration, DNA damage repair, angiogenesis, and other cellular biological behaviours [6–9]. However, Nur77 in cytoplasm can bind to apoptosis-related proteins and initiate classical pathways to induce apoptosis [10, 11].
In this study, the expression of Nur77 in glioma tissue was detected by immunohistochemistry (IHC) and real-time quantitative PCR (qRT-PCR). We then analysed the correlation of Nur77 expression with the clinical pathological characteristics and prognosis of patients with glioma. The mechanism of Nur77 in glioma development was finally studied by cell experiments in vitro.
Material and methods
Clinical data
This study included 33 patients with primary glioma, who were admitted to the Department of Neurosurgery, Nanjing Drum Tower Hospital, the Affiliated Hospital of Nanjing University Medical School, from March 2013 to February 2014. Of the enrolled 33 patients, 17 were male and 16 were female. The patients were aged from 9 to 74 years with an average age of 45.6 years. All collected specimens were identified as glioma by haematoxylin and eosin staining. Pathological diagnosis and classification were determined according to the WHO classification criteria for neurological tumours in 2007. In total, 5 cases had grade I glioma, nine cases had grade II glioma, 10 cases had grade III glioma, and nine cases had grade IV glioma. All patients received no radiotherapy or chemotherapy prior to operation and were provided regular treatment after operation. Monthly follow-up was completed in January 2019 by telephone. For controls, normal brain tissue samples were obtained from 7 patients who underwent intracranial decompression due to craniocerebral injury, fixed with formalin and embedded in paraffin wax. This study was supported by the Ethics Committee of Drum Tower Hospital, and all subjects signed informed consent forms.
H&E staining
Brain tissues from patients with glioma and the controls were embedded in paraffin wax, sliced into cut 4 µm sections and stained with H&E.
Immunohistochemistry (IHC)
IHC detection was conducted as follows. Dewaxing was conducted by baking slices in a constant-temperature incubator at 60°C for 20 min. Hydration was then performed by applying 100% ethanol solution I for 5 min, 100% ethanol solution II for 5 min, 95% ethanol solution for 3 min, 80% ethanol solution for 3 min, and 70% ethanol solution for 3 min. The reaction was blocked by dripping 3% H2O2 deionised water onto the tissue chip and incubating at room temperature for 10 min. Next, antigen repair was conducted by placing the slices in 0.01 mol/l sodium citrate buffer for microwave heating. For sealing, the slices were dripped with 1% bovine serum albumin and incubated in a wet box at room temperature for 1 h. Hybridisation was carried out by adding 100 µl of the primary antibody, mouse anti-human Nur77 monoclonal antibody (volume dilution ratio, 1 : 50), to the slices and then incubating them at a constant temperature of 37°C for 2 h. The slices were then supplemented with 100 µl of the secondary antibody, horseradish peroxidase-labelled sheep anti-mouse IgG antibody (volume dilution ratio, 1 : 200), and then incubated at room temperature for 1 h. The slices were subsequently subjected to another cycle of incubation at room temperature for 1 h and then added with SP. Finally, DAB was used to develop the slices for 5–10 min, and the degree of development was observed and controlled under an optical microscope. The reaction was terminated by PBS washing for 10–15 min. Haematoxylin re-staining was carried out for 2 min, differentiation was carried out with ethanol hydrochloride solution, and observation of re-staining results was conducted under an optical microscope. The reaction in this step was stopped by PBS washing for 10–15 min. Routine dehydration, vitrification, and neutral gum sealing were then performed. Images of the slices were analysed using Image J software.
Total RNA extraction and RT-qPCR
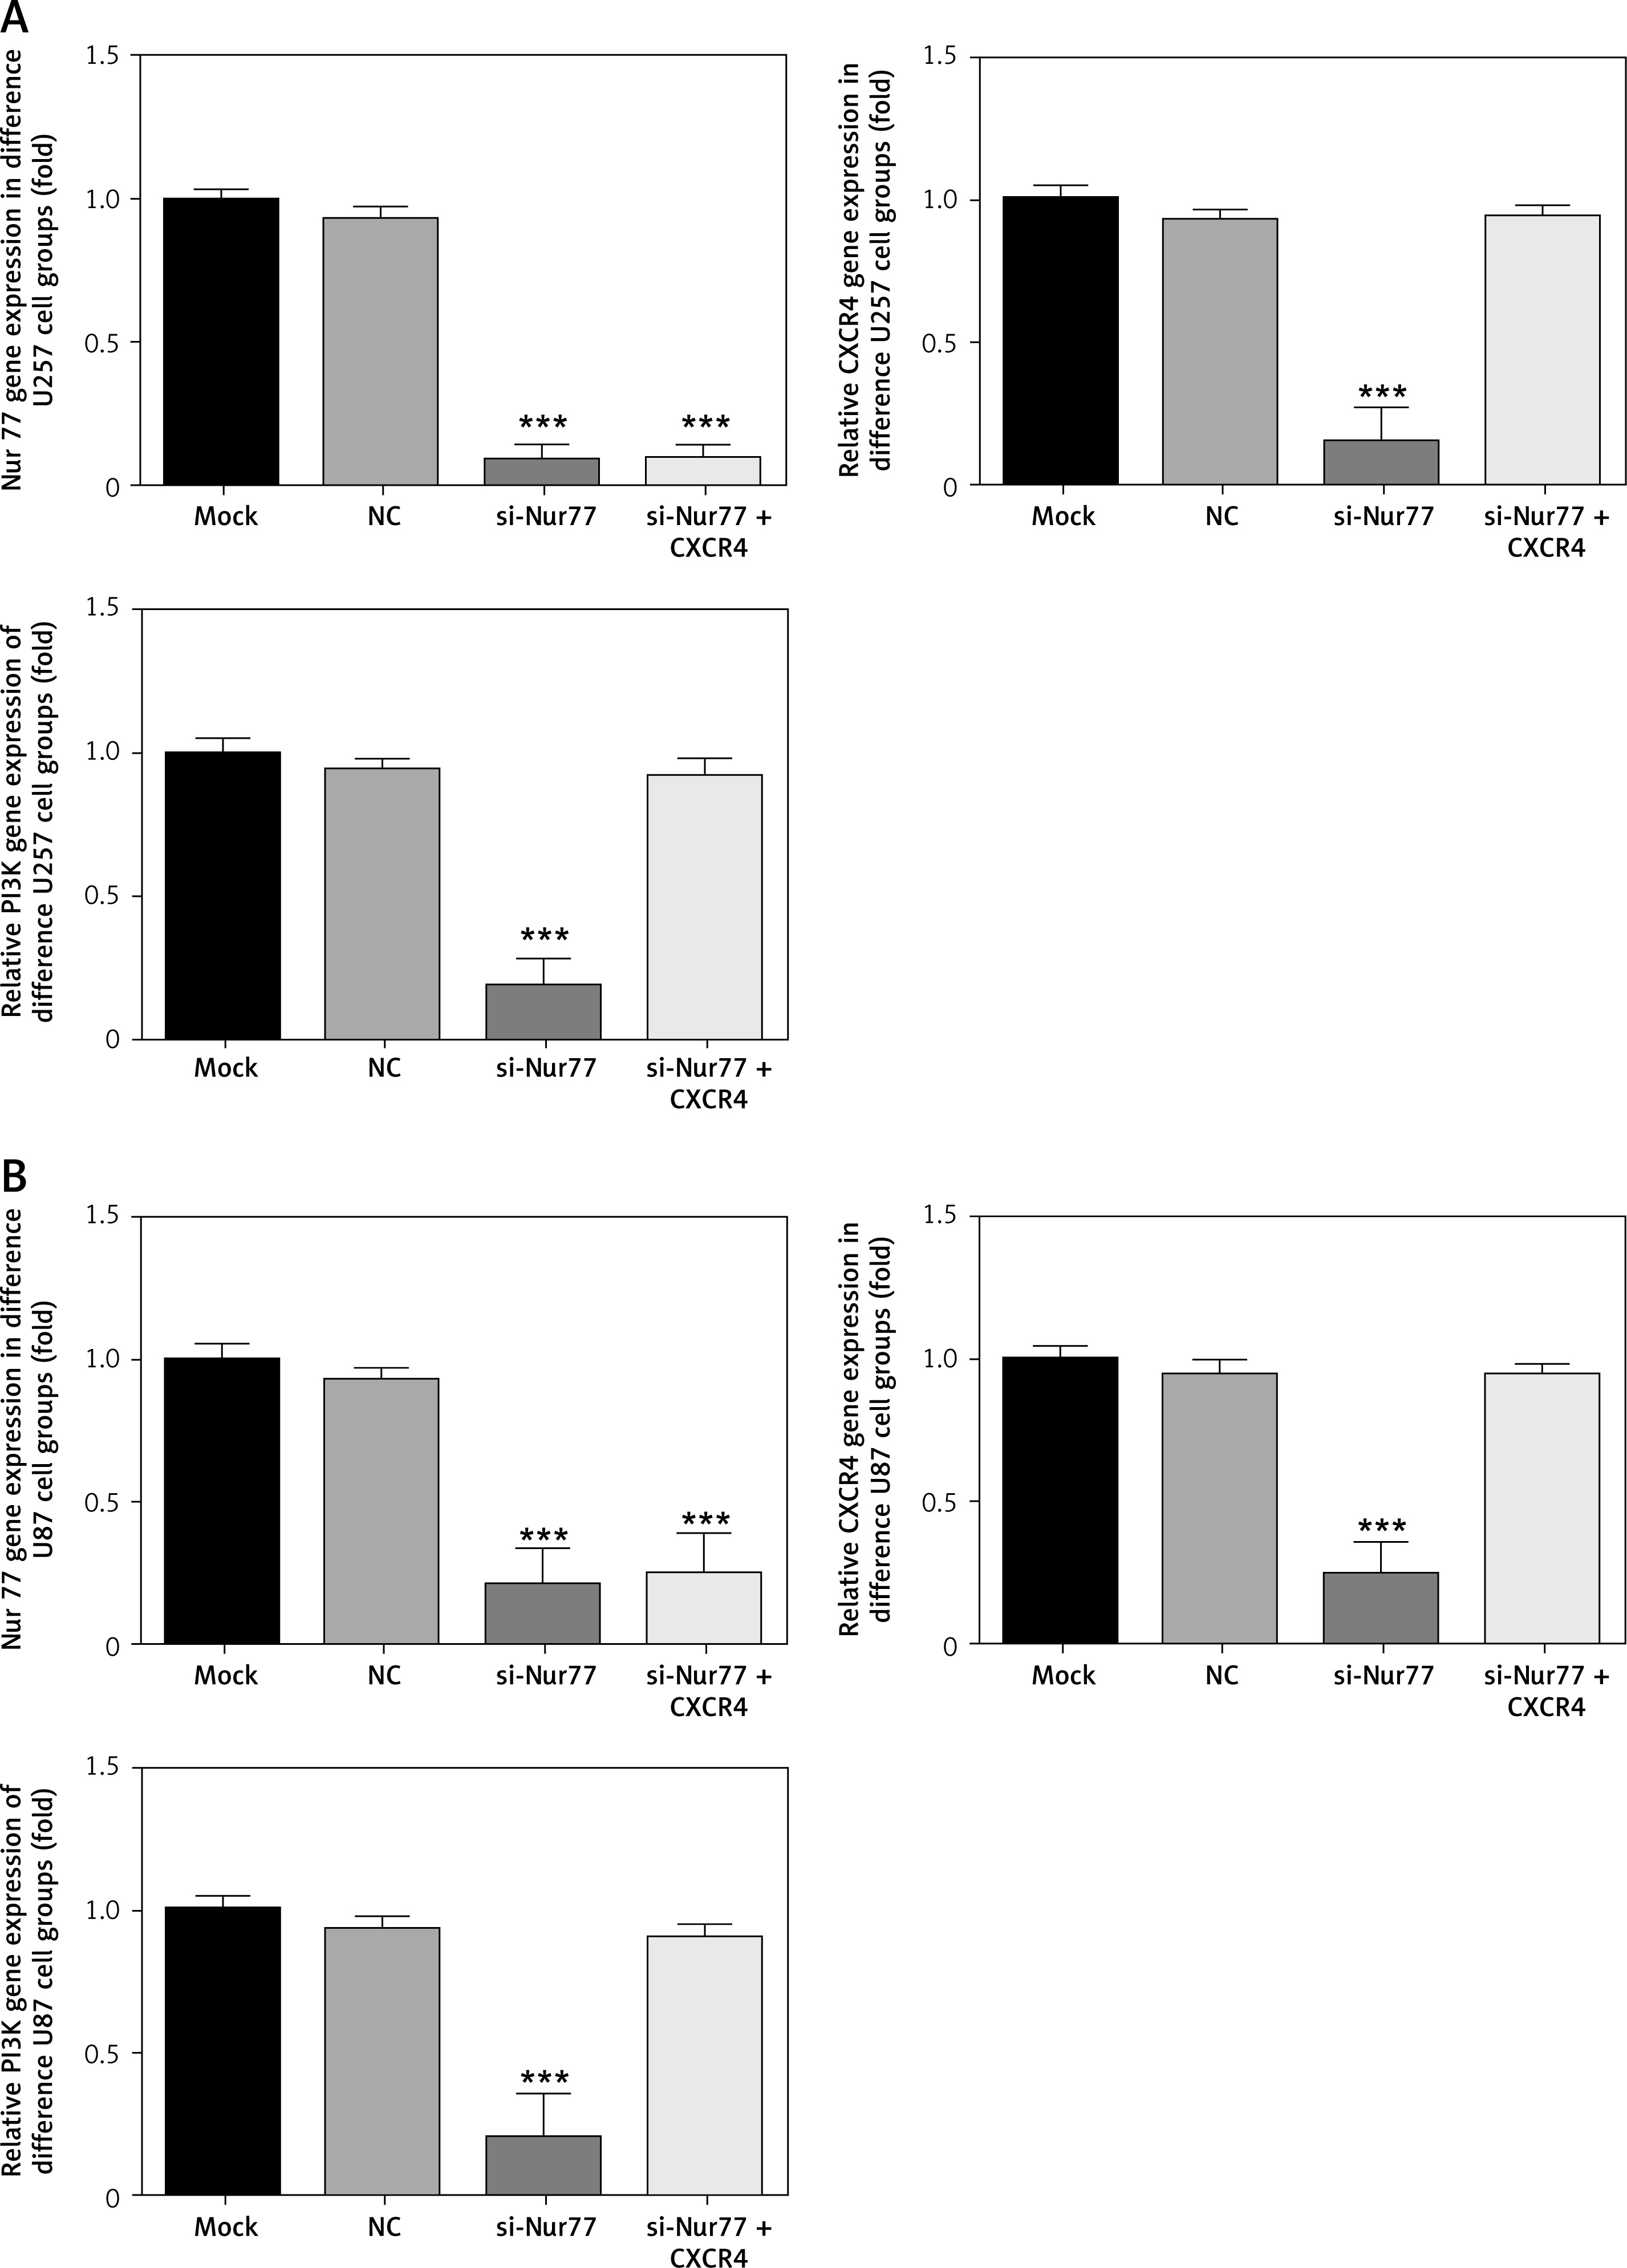
Total RNA was extracted from tissues and cells by using the Trizol method. Determination of RNA concentration was realised by a nucleic acid protein quantitative analyser. Purified total RNA (2 µg) was collected for reverse transcription, and RT-PCR was performed on a 7500 FAST instrument. The conditions of the PCR reaction were as follows: pre-denaturation at 95°C for 30 s, denaturation at 95°C for 5 s, and annealing at 60°C for 30 s in a total of 40 cycles. The primer sequences were as follows: β-actin F: 5′-GGCATCGTCACCAACTGGGAC-3′, R: 5′-CGATTTCCCGCTCGGCCGT-GG-3′; Nur77 F: 5′-GCTCATCTTCTGCTCAGGCCT-3′, R:5′-CAGACGTGACAGGCAGCTGGC-3′; CXCR4 F: 5′-TC-AGTGGCTGACCTCCTCTT-3′, R:5′-TTTCAGCCAGCAG-TTTCCTT-3′; PI3K F: 5′-GCCAGGCTTACTACAGAC-3′, R: 5′-AAGTAGGGAGGCATCTCG-3′. The relative expression of Nur77 was calculated using the 2–ΔΔCT method.
Cell culture
The glioma cell lines C6, A172, U373, U87, and U251 were purchased from ATCC and cultured in DMEM high-glucose culture medium + 10% foetal bovine serum at 37°C, 5% CO2, and 100% relative humidity with a passage ratio of 1 : 3. The procedure was operated in a super-clean worktable strictly in accordance with aseptic principles to prevent cell contamination.
Cell transfection
U251 and U87 cells were divided into four groups: the normal control group (Mock), the blank control group (NC), the Nur77 knock-down group (siNur77, primer sequence: 5′-CAGTCCAGCCATGCTCCTC-3′), and the Nur77 knock-down + CXCR4 over-expression group (simultaneous transfection of si-Nur77 and CXCR4). Cells were inoculated into six-well culture plates at a cell density of 2 × 10⁵ cells/well 1 day before transfection. Cell transfection was conducted when the cell density in the culture plate reached 80%. Firstly, the cell culture medium was replaced with serum-free culture medium, and then 250 µl of Opti-MEM and 5 µg of plasmids were added to an EP centrifuge tube for mixing. Then, another EP centrifuge tube was taken and added with 250 µl of Opti-MEM and 5 µg of plasmids. After mixing, the centrifuge tube was placed at room temperature for 5 min. The contents of the two tubes were mixed and allowed to stand at room temperature for 20 min. Subsequently, 500 µl of the mixture of plasmids and liposome was added to each well of the six-well plate. The cells were cultured in an incubator for 4 h and then replaced with complete culture medium.
MTT assay for cell proliferation in vitro
Cells from each group were collected and inoculated into 96-well plates. After 48 h of incubation, 50 µl of MTT solution (Sigma, 5 mg/ml) was added to each well. Following incubation for 3 h and subsequent absorption of the supernatant, 150 µl of DMSO was added to each well. The plates were evenly shaken on a platform bed. The absorbance of each well was measured by a microplate reader at a wavelength of 490 nm. Six replicates were set up for each group, and the mean absorbance was reported.
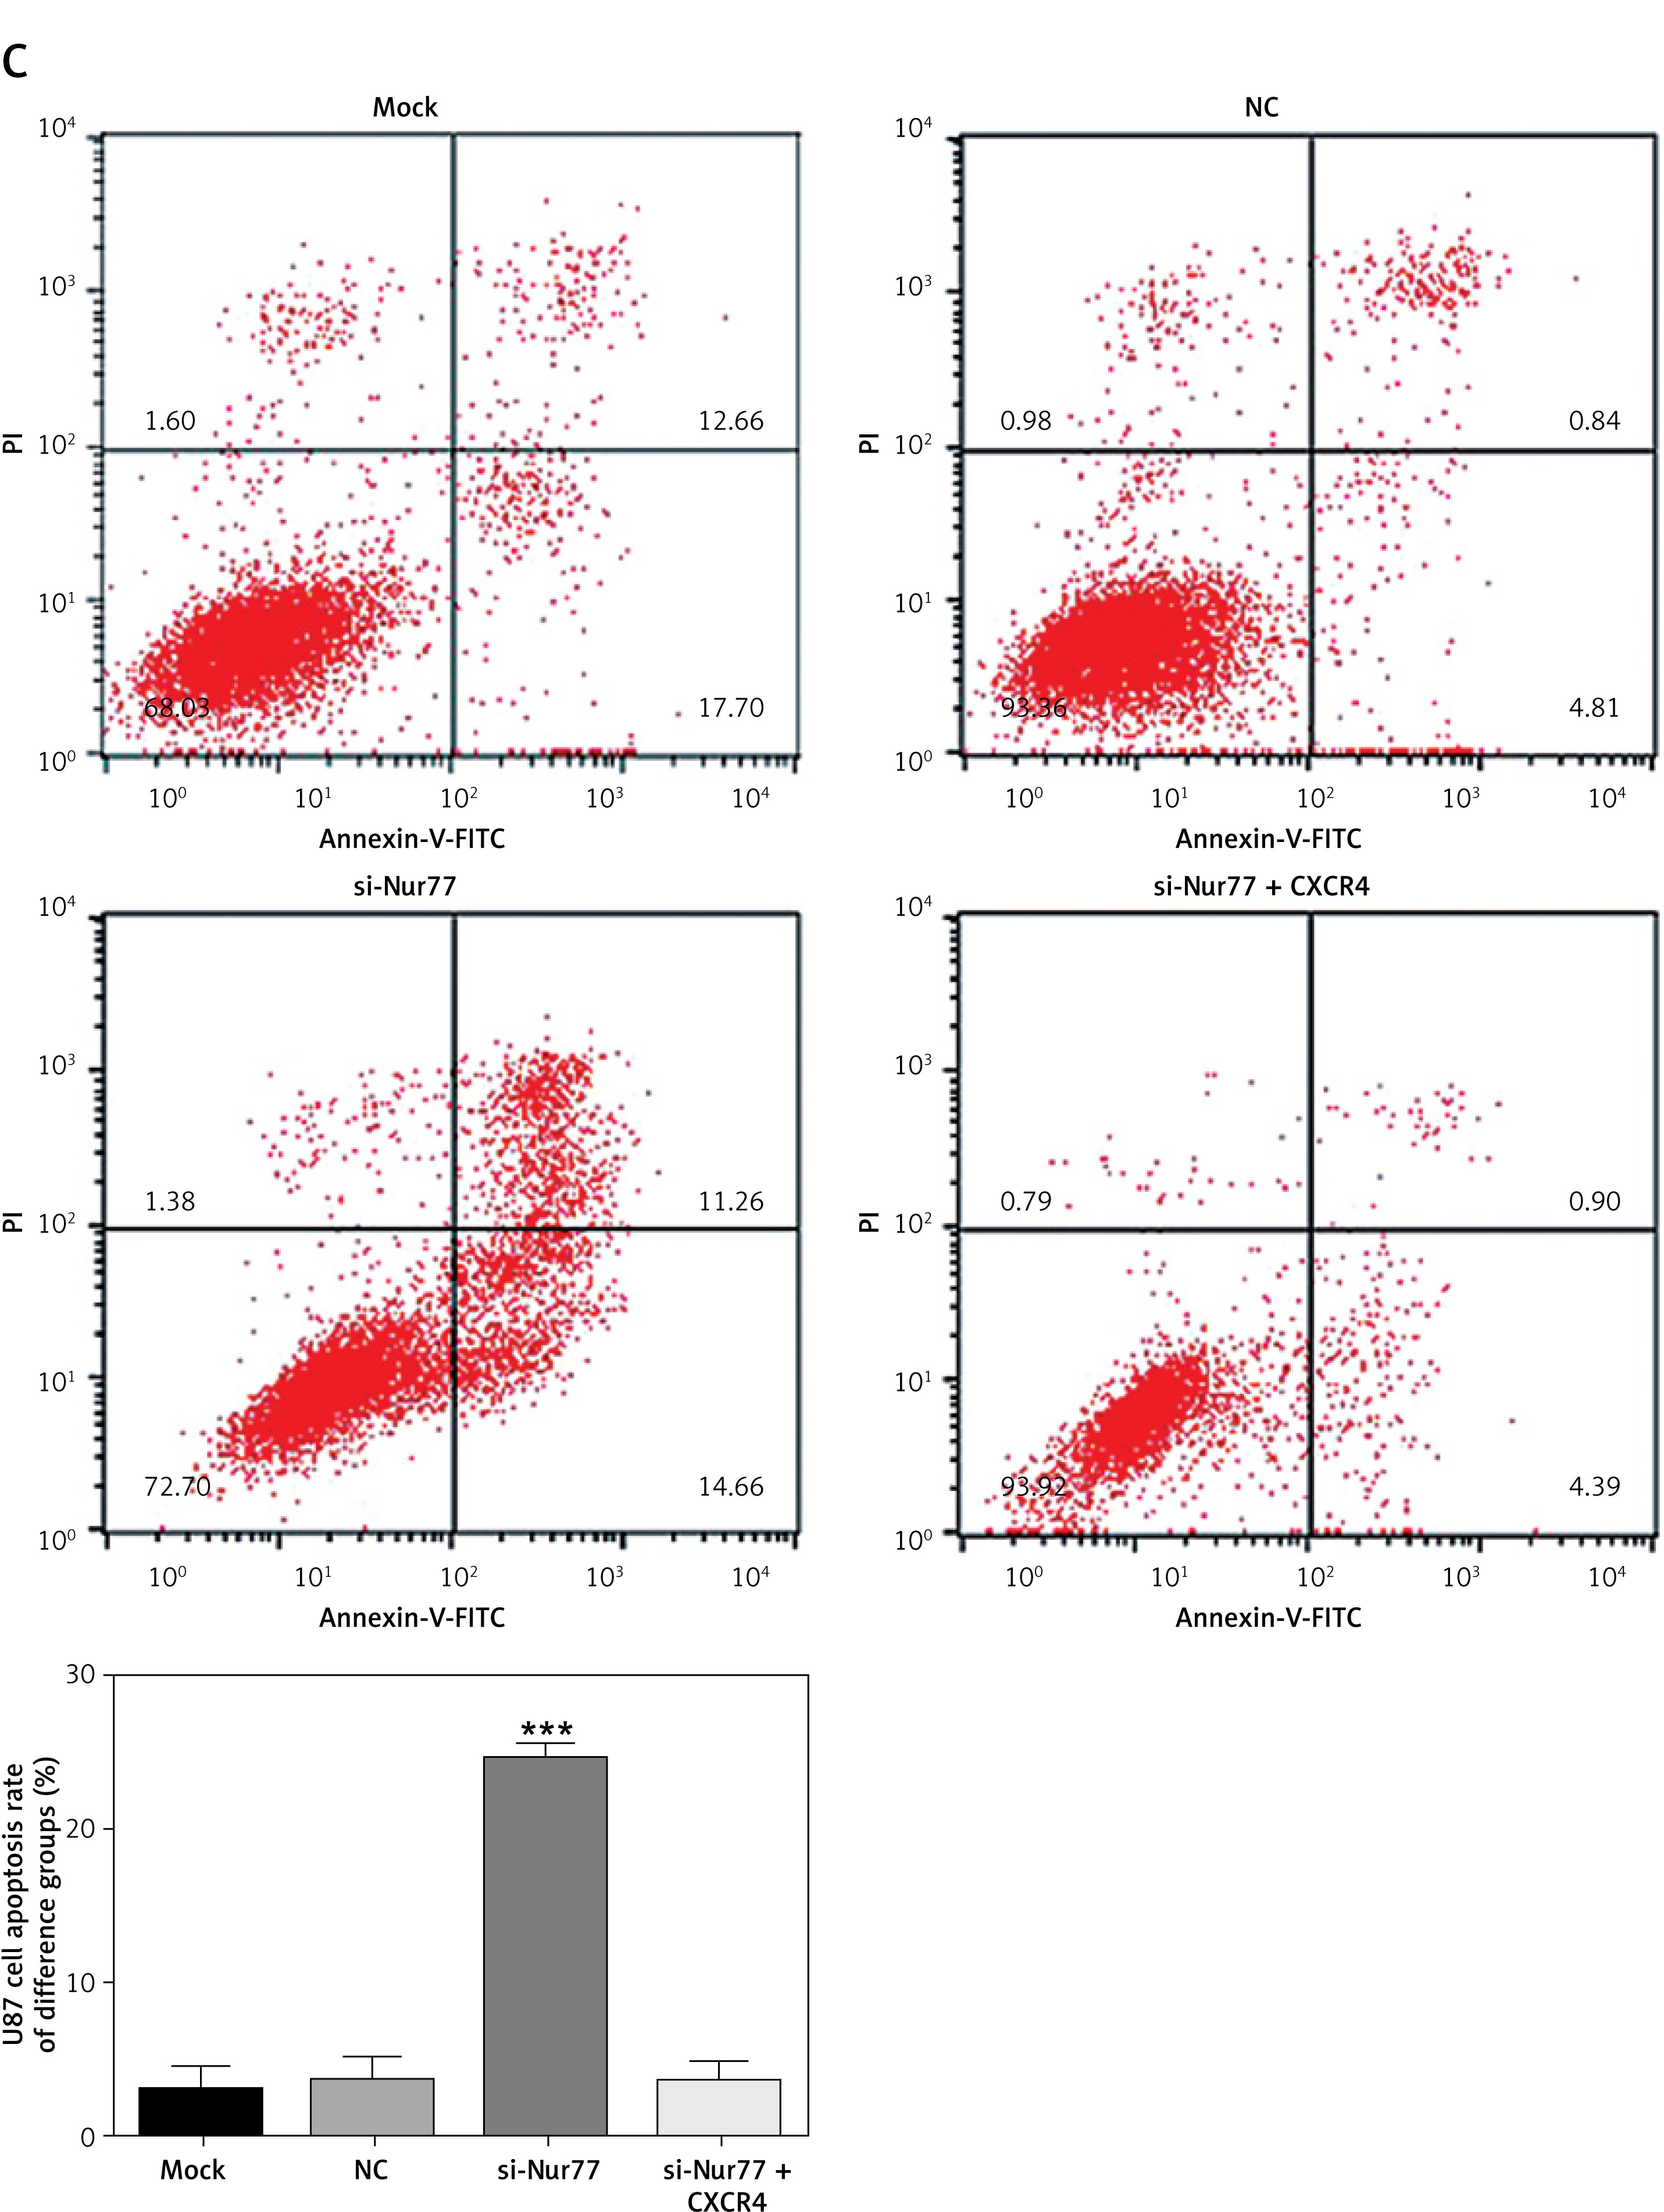
Flow cytometry for the detection of apoptosis
After transfection in six-well plates, cells in each group were collected from the medium, washed once with PBS, and then digested with trypsin. A single cell suspension was collected and washed twice with PBS. The reagent provided in an annexin V-FITC/PI cell apoptosis detection kit (Beyotime) was added once to the suspension according to the manufacturer’s instructions. Flow cytometry was used to detect the early and late apoptosis of cells in each group.
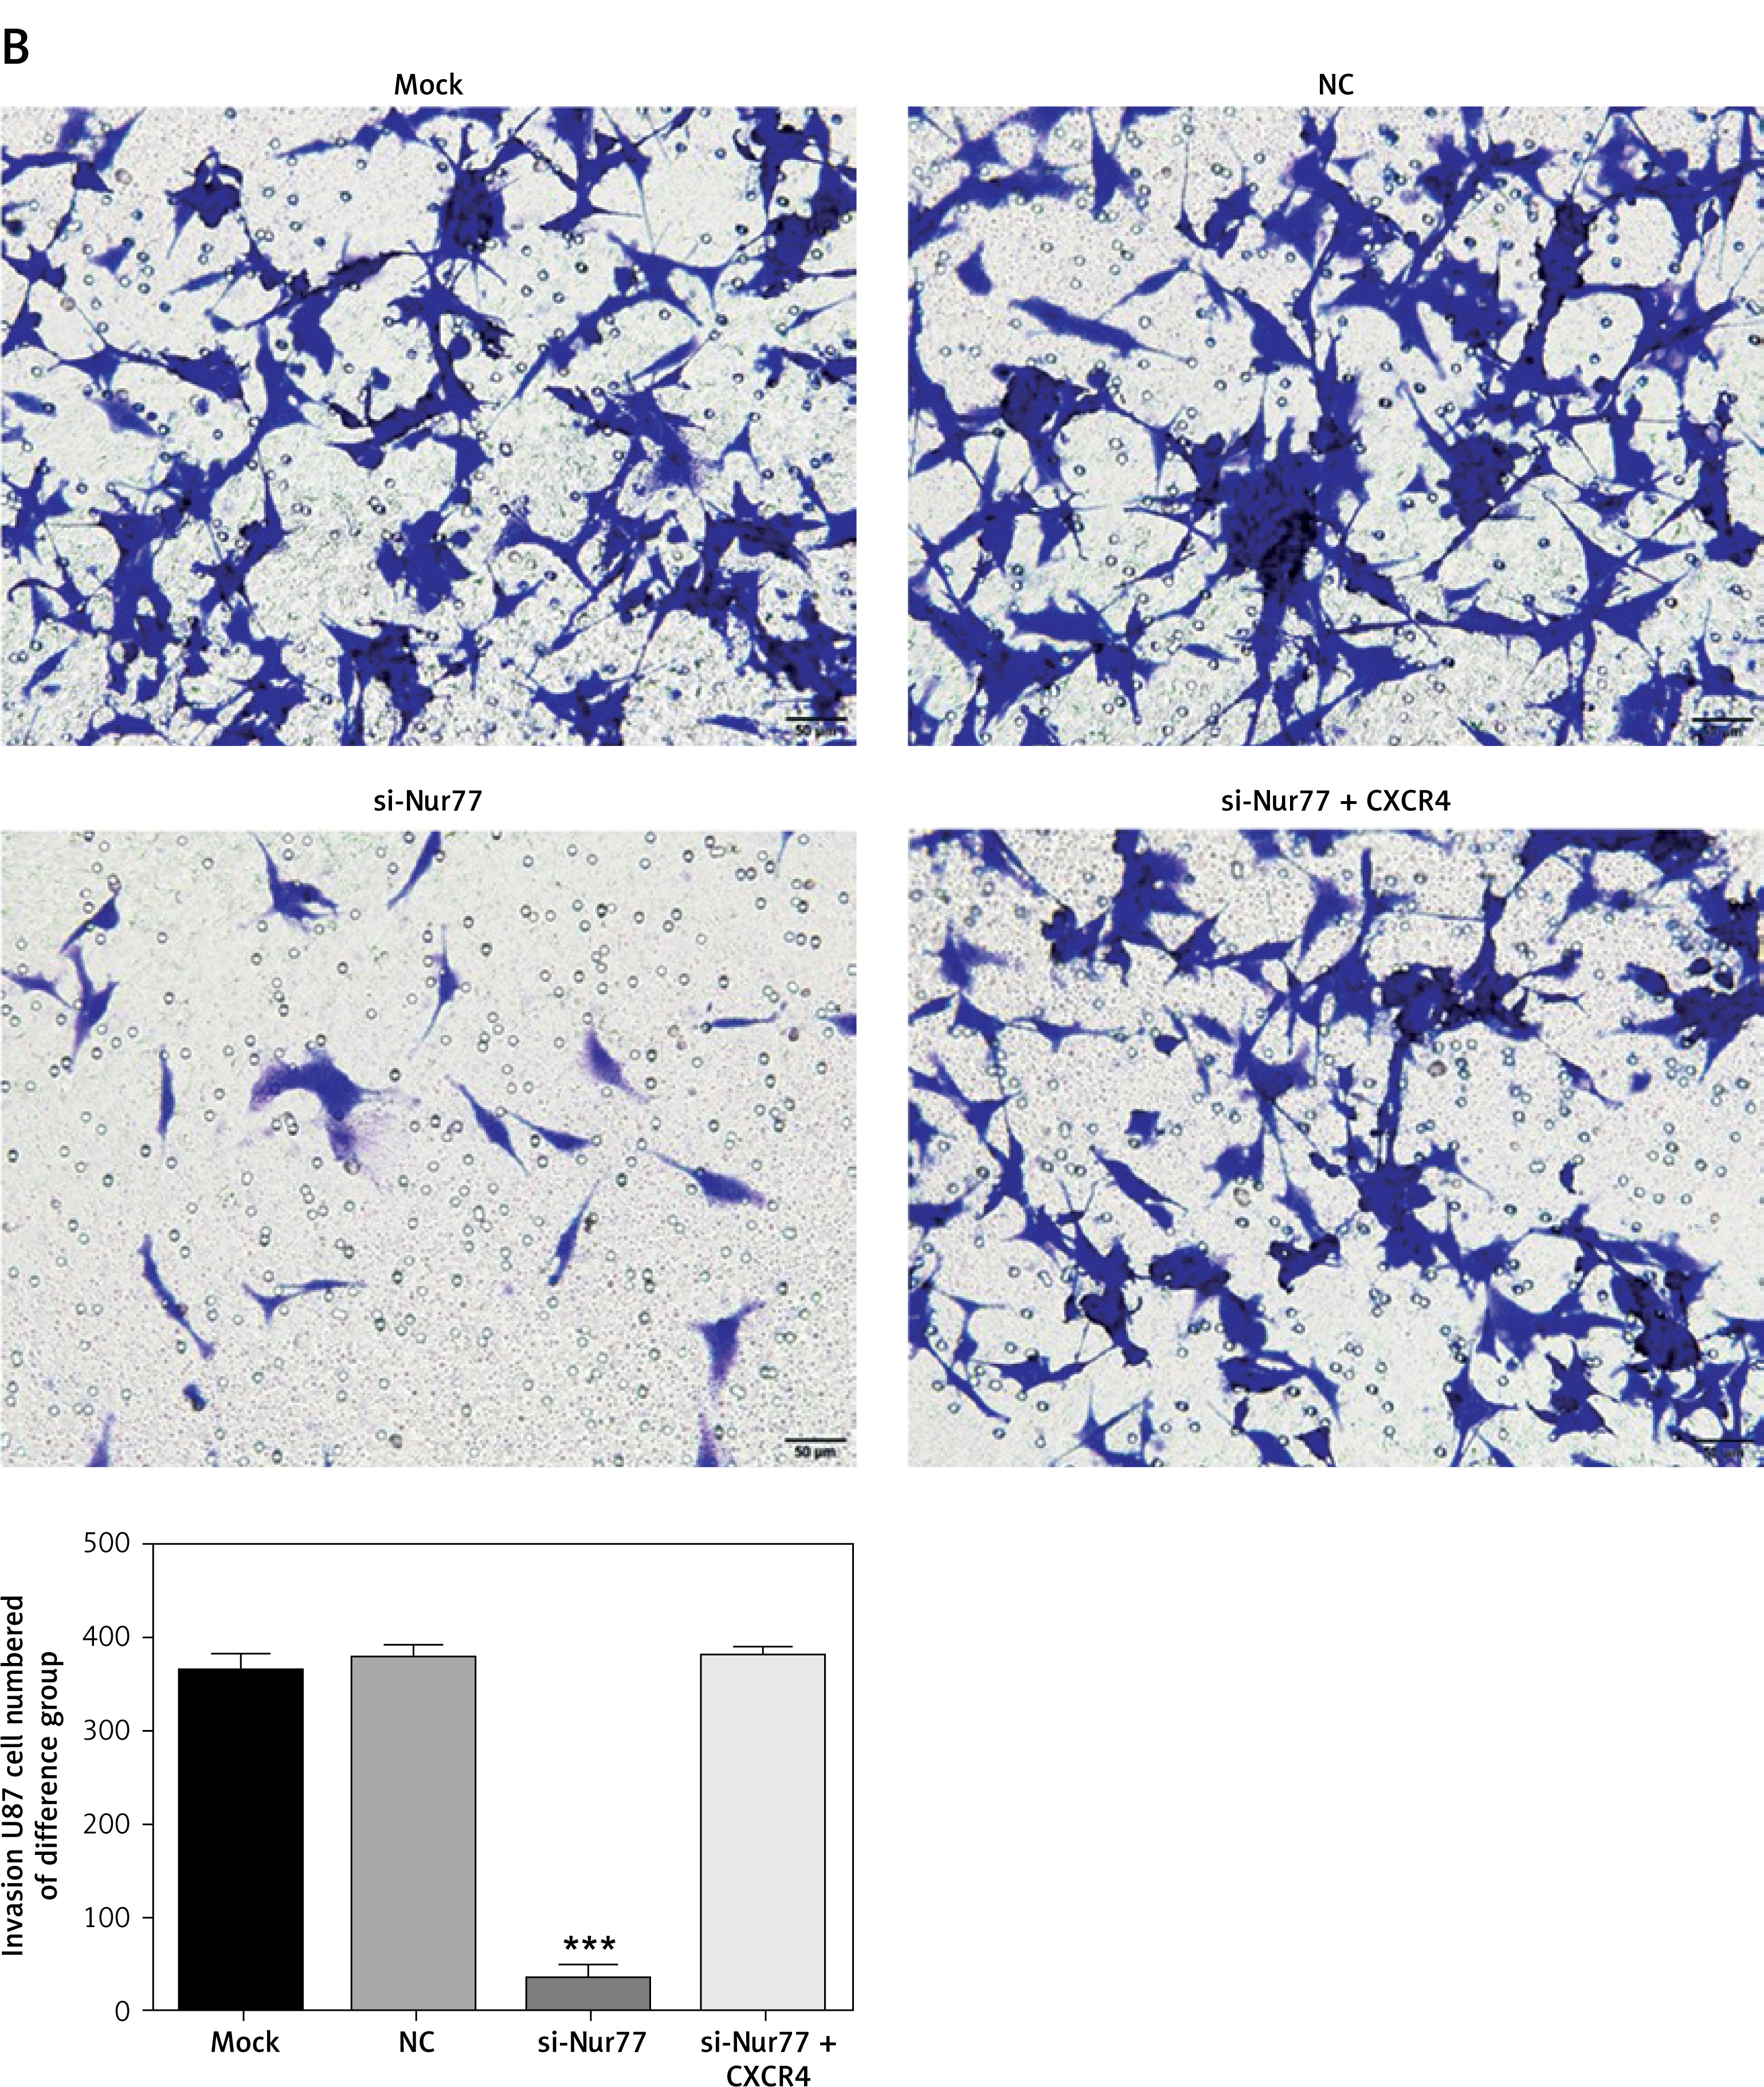
Transwell assay
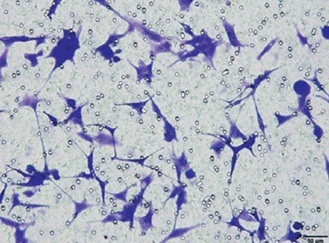
After 48 h of the corresponding treatment, cells in each group were inoculated into the upper chamber of a transwell chamber at a density of 4 × 10⁴ cells/well (100 µl of culture medium containing 5% foetal bovine serum). Then, 500 µl of culture medium containing 10% foetal bovine serum was added to the 24-well culture plate of the lower chamber. After 24 h of routine culture, the chamber was removed and cells from the upper layer of microporous membranes were wiped with cotton swabs. The cells were then immobilised in 4% paraformaldehyde solution for 10 min at room temperature and stained with 0.5% crystal violet solution for 15 min. Finally, five visual fields were randomly selected and observed under an optical microscope to count the number of cells invading the sub-layer of the microporous membranes of the chamber.
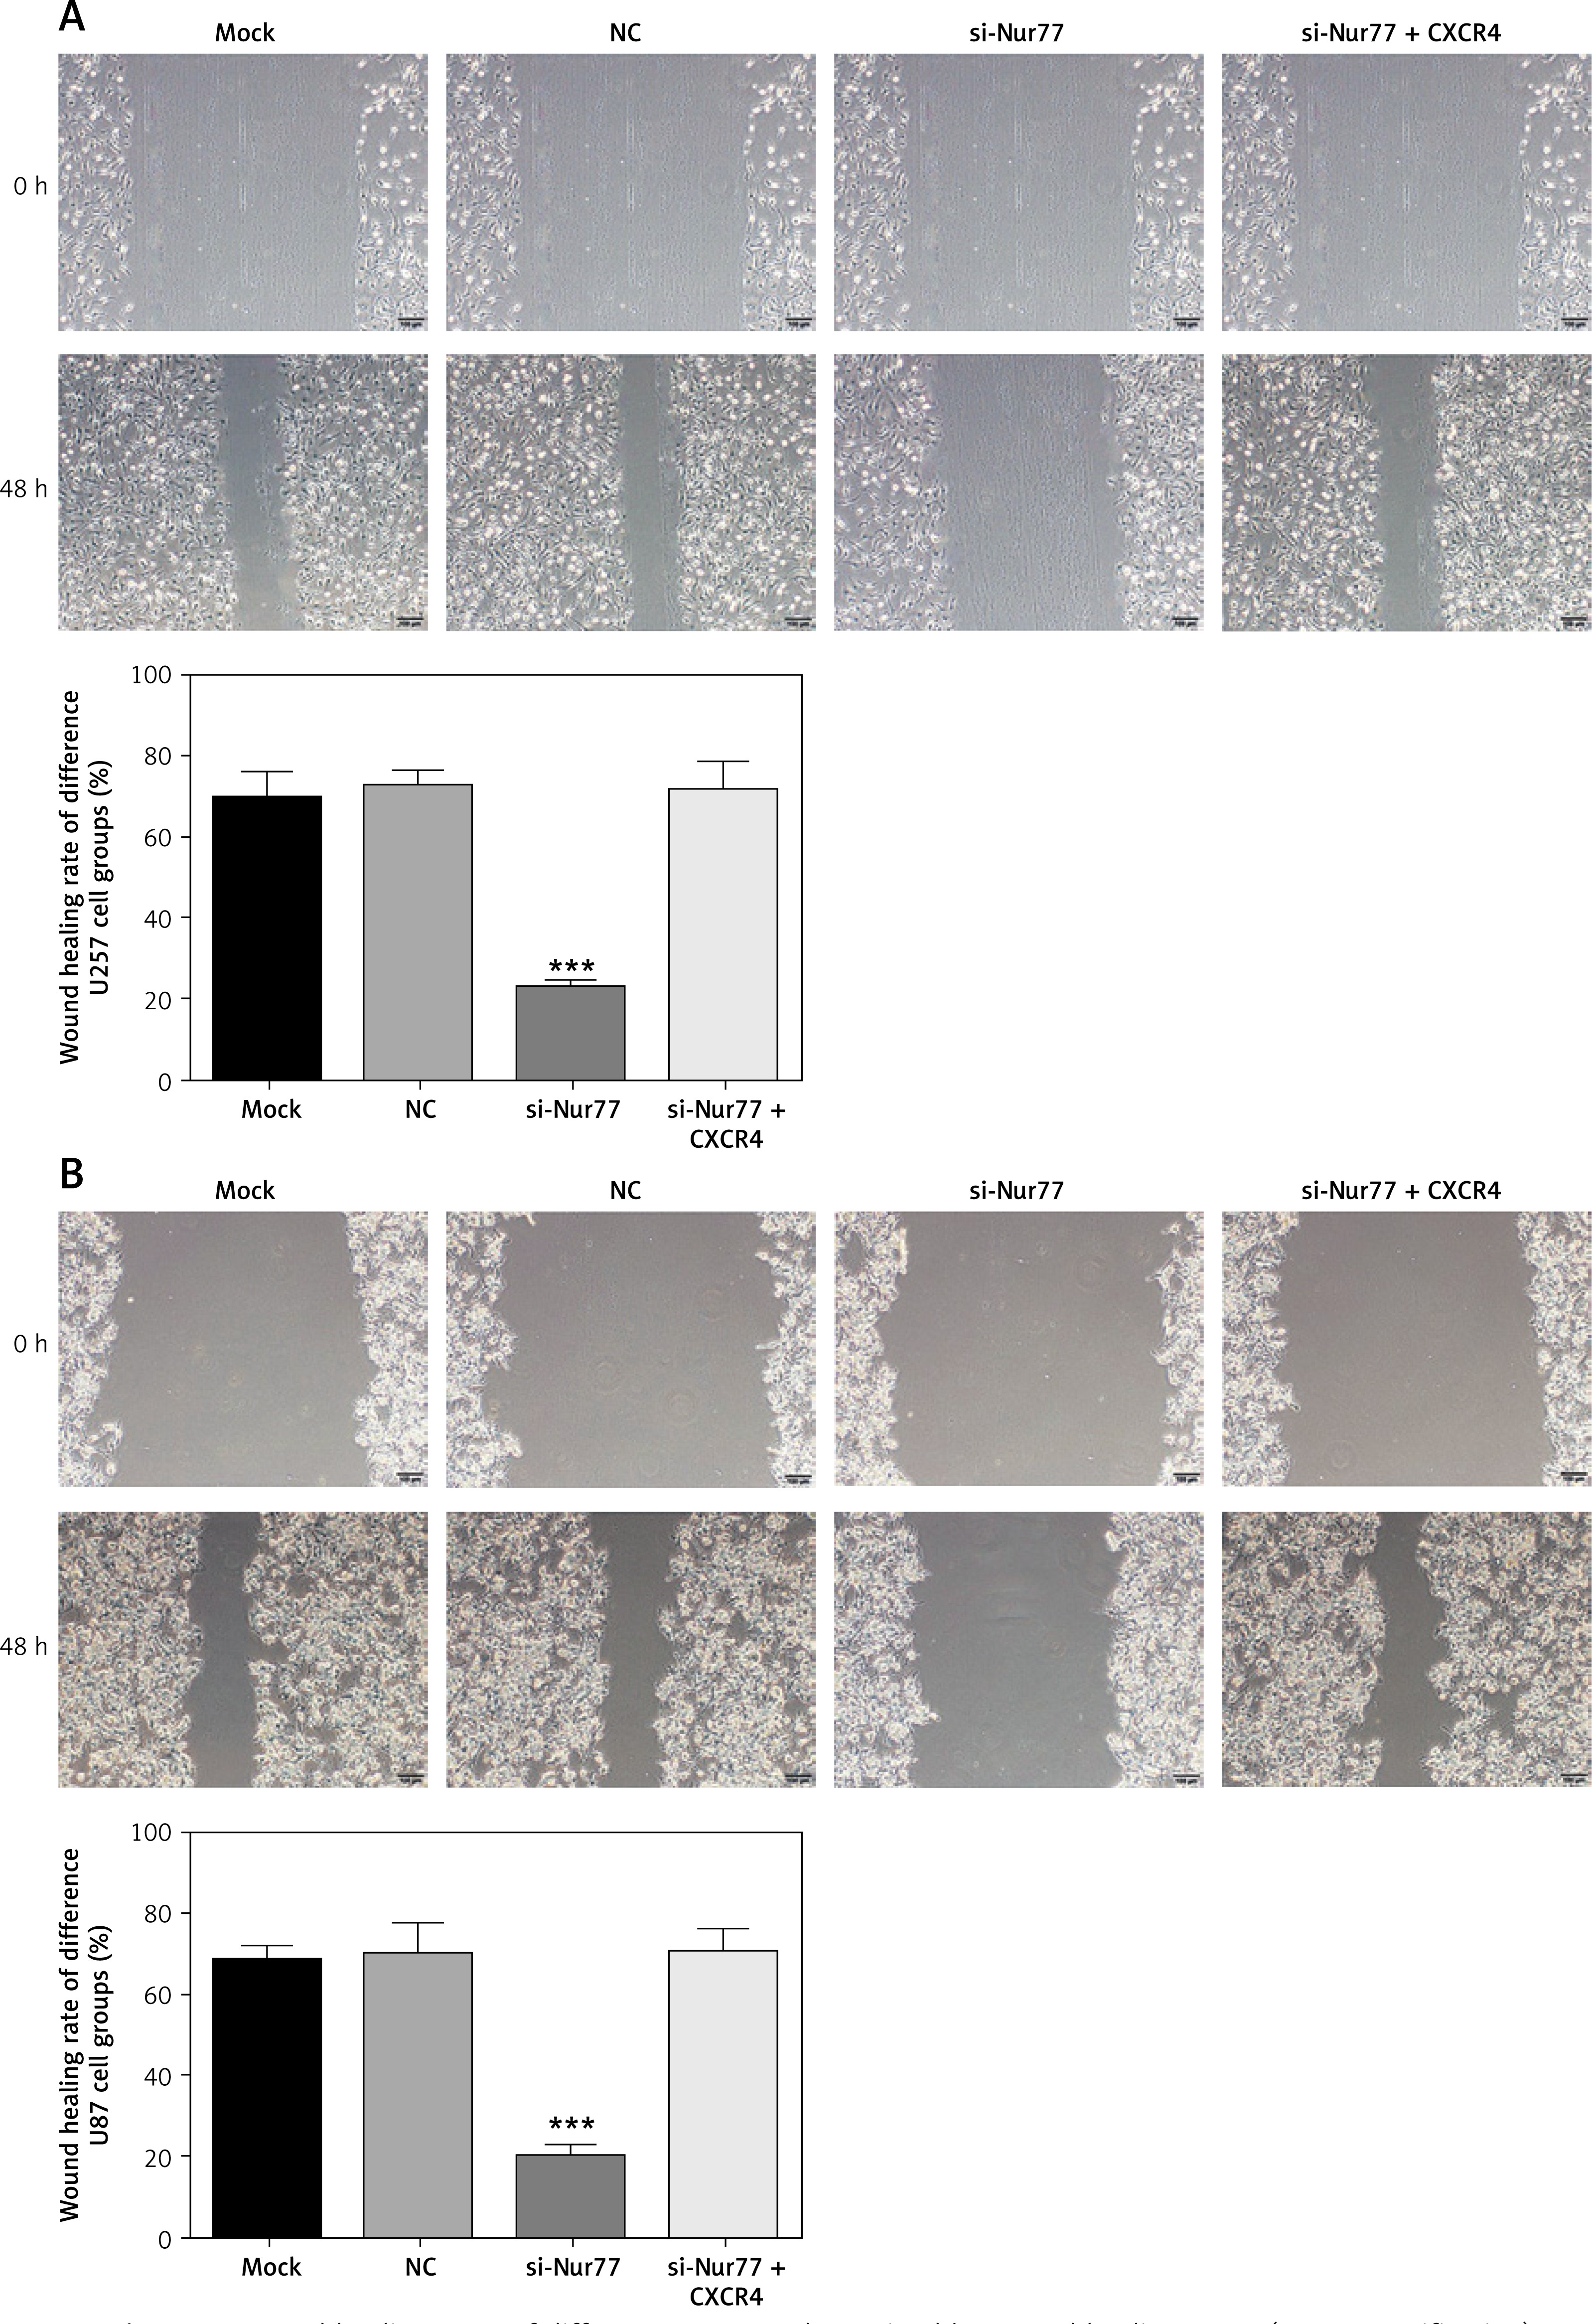
Wound healing assay
After 48 h of treatment, cells in each group were cultivated in six-well plates and cultured overnight until basic confluence was achieved. On the next day, the films that formed in the wells were scratched vertically with a 10 µl micro-pipette tip, washed thrice with PBS, and then added with serum-free medium for 24 h. Five visual fields were randomly selected at 0 and 48 h and inspected using an inverted microscope to calculate cell mobility.
Western blot for the detection of related protein expression
Following the digestion and collection of cells in each group, RIPA lysis solution with protease inhibitor cocktail was used to lyse cells. The total protein concentration was determined by BCA after extraction of total proteins. SDS polyacrylamide gel electrophoresis (SDS-PAGE) was then conducted for 2 h by collecting 60 µg of protein, followed by transmembrane. The primary antibodies of Nur77 (1 : 1000), CXCR4 (1 : 1000), GAPDH (1 : 2000), and PI3K (1 : 500) were added, and the cells were incubated overnight at 4°C. The cells were then added with the corresponding secondary antibodies and incubated for another 2 h. A gel electrophoresis imaging analyser was used to measure grey levels.
Cellular immunofluorescence staining
After 48 h of treatment, cells in each group were routinely processed with round coverslips, washed thrice with PBS for 5 min each time and fixed with 4% polyformaldehyde. Then, transparent treatment with 0.5% Triton X-100 was performed at room temperature for 20 min, followed by three cycles of slice washing with PBS for 3 min each time. After drying, the slides were dripped with goat serum and sealed at room temperature for 30 min. Then, each slide was dripped with rabbit-derived PI3K primary antibody (dilution ratio, 1 : 1000) and incubated overnight at 37°C in a wet box. The slides were subsequently washed thrice with PBST for 3 min each time. The secondary antibody (dilution ratio, 1 : 1000) was added to the slides after drying, and the slides were incubated for 1 h at 37°C in the wet box. After incubation, the secondary antibody was removed and the slides were washed thrice with PBST for 5 min each time. DAPI was added, and the slides were incubated in the dark for 5 min. Finally, the slides were washed four times with PBST for 5 min each time. Observation and photography were performed under a fluorescence microscope, and Image-Pro Plus 6.0 software was used for fluorescence quantitative analysis.
Statistical analysis
SPSS 21.0 software was used for statistical analysis. Each experiment was repeated three times independently. The measurement data of normal distribution are expressed as mean ± SD. If the data showed normal distribution and equal variance, comparison of mean values between groups was realised by one-way ANOVA, and pairwise comparison of mean values between groups was achieved by the LSD t-test. In the case of data of non-normal distribution or unequal variance, the Kruskal-Wallis H rank sum test was used to compare multiple samples and the Mann-Whitney U rank sum test was used for pairwise comparison. Spearman’s rank correlation analysis was used for correlation analysis. Survival analysis was performed by the Kaplan-Meier method, followed by the log-rank test. The Cox proportional risk model was used for prognostic analysis. P < 0.05 was considered to indicate statistically significant differences.
Results
Pathology as well as Nur77 protein and gene expression in glioma
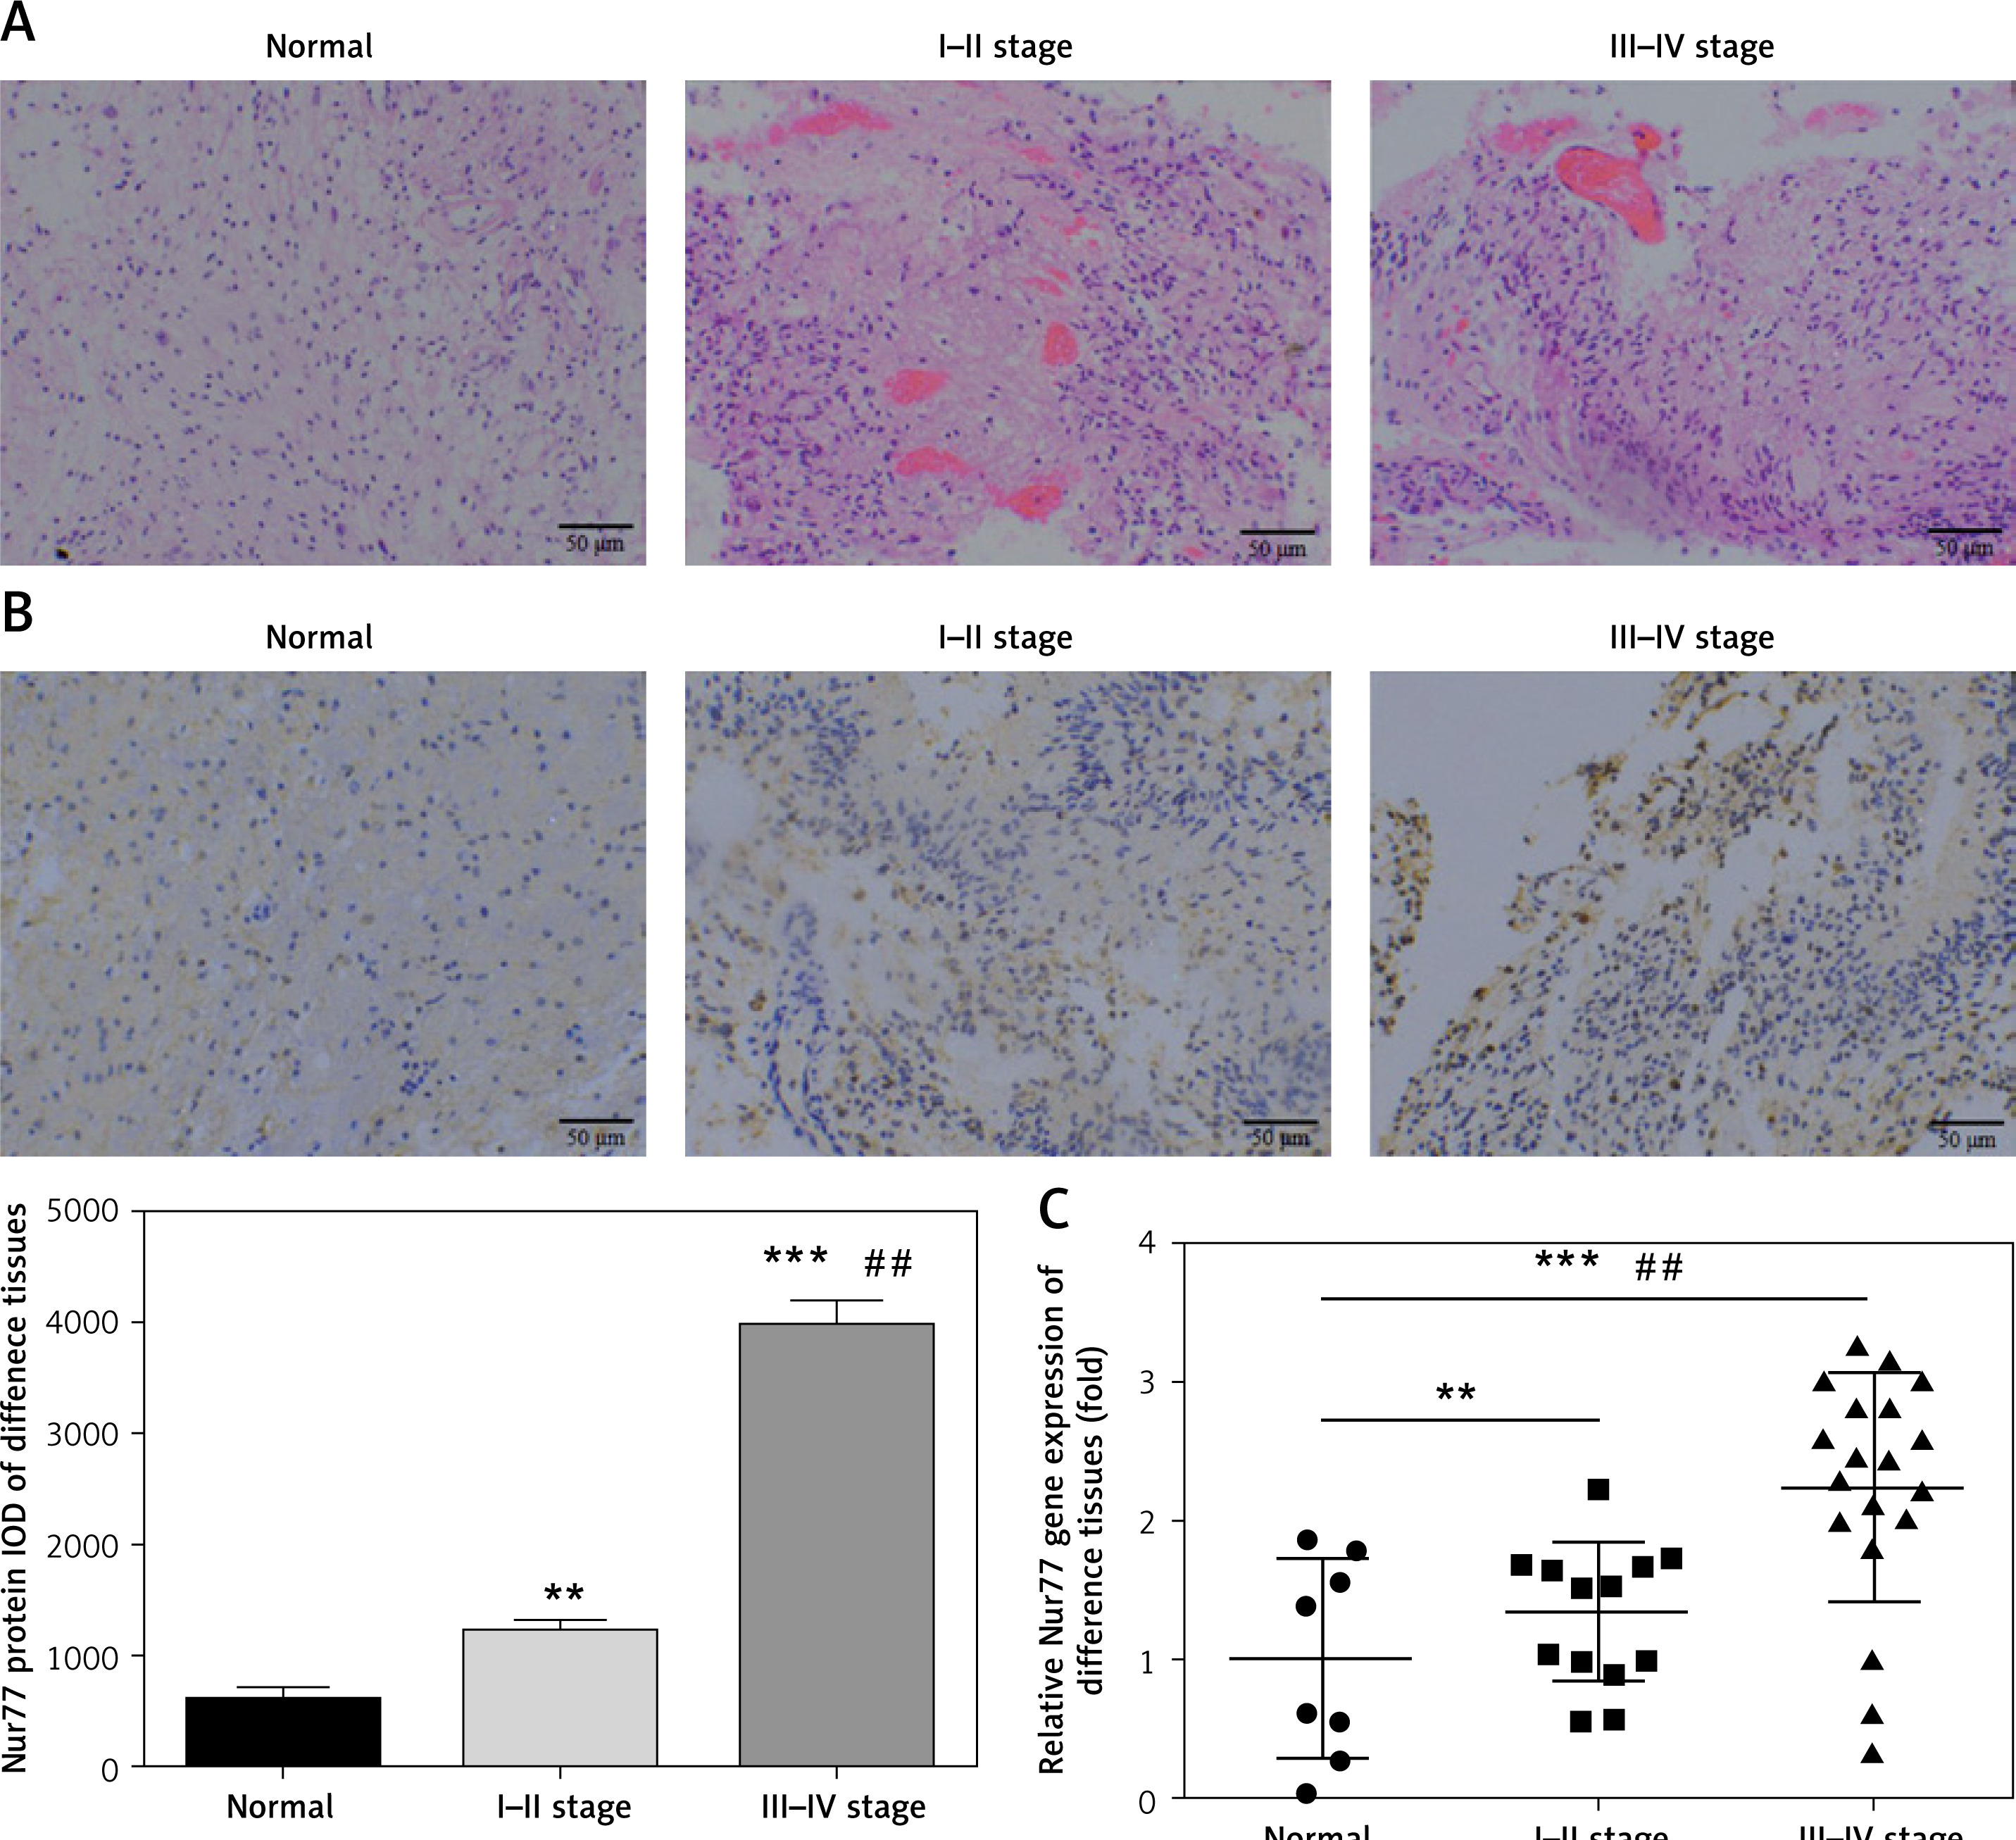
As shown in Figure 1 A, whereas no obvious infiltration and invasion were observed in brain tissues of the normal group, significant infiltration and invasion were noted in glioma tissues (stages I–II and III–IV); moreover, these pathological changes became more extensive with increasing stage. IHC assay revealed that the expression level of Nur77 protein in glioma tissues is significantly higher than that in the normal group (p < 0.01, p < 0.001, Figure 1 B) and significantly different between stages I–II and III–IV (p< 0.01). RT-qPCR indicated that the expression of the Nur77 gene in glioma tissues is remarkably higher than that in the normal group (p < 0.01, p < 0.001, Figure 1 C) and significantly different between stages I–II and III–IV (p < 0.01).
Figure 1
Pathology, protein expression, and mRNA expression of Nur77 in normal and glioma tissues. A – Pathology of normal, grade I–II, and grade III–IV glioma tissues as determined by H&E staining (200× magnification). B – Nur77 protein expression as determined by IHC assay (200× magnification). C – Nur77 gene expression as determined by RT-qPCR assay
**P < 0.01, ***p < 0.001, compared with normal tissues; ##p < 0.01, compared with grade I–II glioma tissues.
Correlation between Nur77 expression and clinicopathological features of glioma
Nur77 expression was not obviously correlated with gender or age (p > 0.05) but intimately correlated with tumour size, TNM stage, invasion, and differentiation (p < 0.05, Table I).
Table I
The correlation between Nur77 expression and glioma patients’ clinicopathological features (n, mean ± SD)
Relationship between Nur77 expression and prognosis of patients
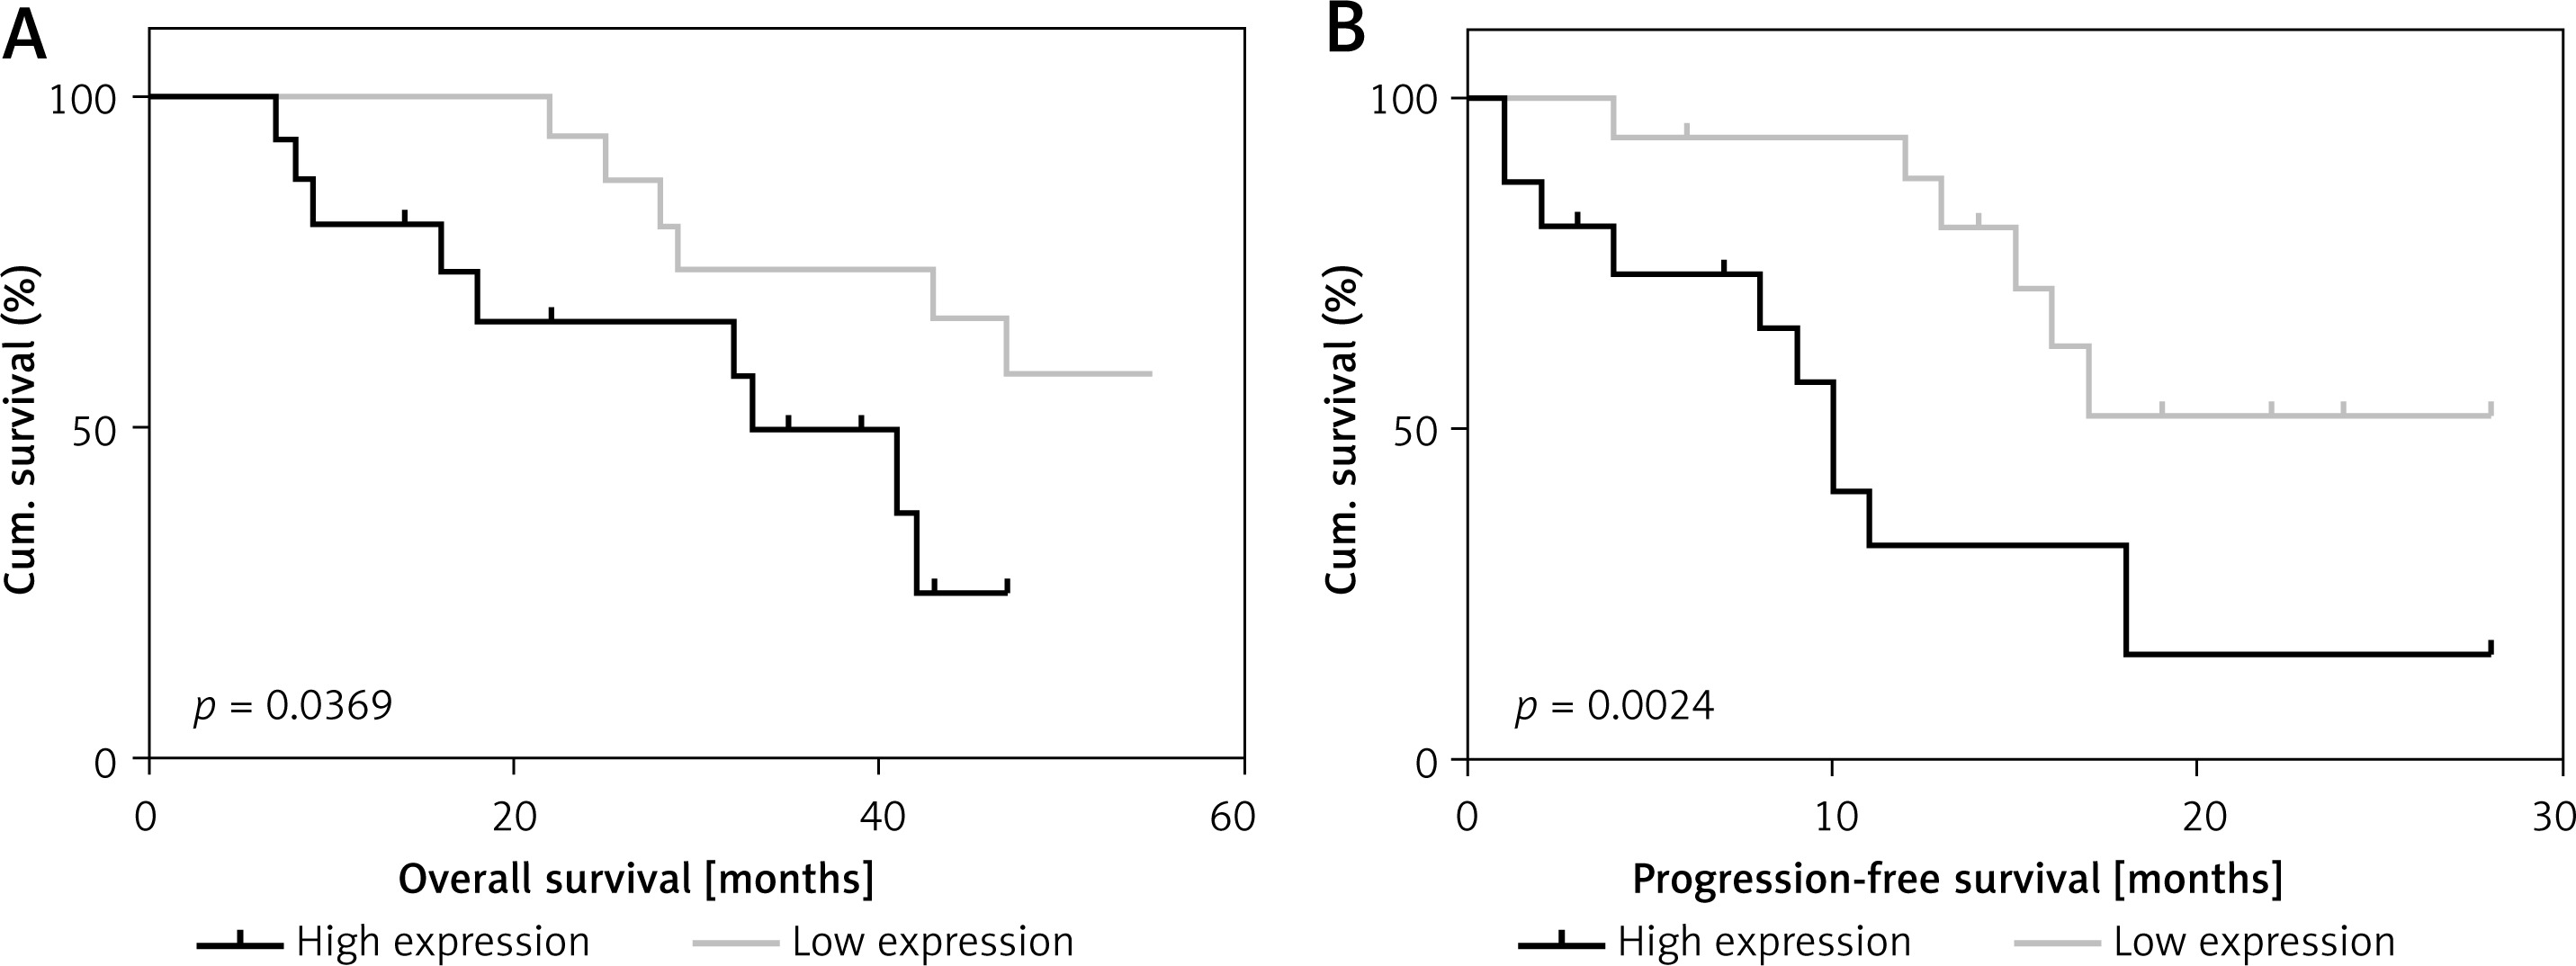
Enrolled patients who were involved in the follow-up were divided into low- and high-expression groups on the basis of the median expression of the Nur77 gene detected by RT-qPCR. As shown in Figure 2, survival analysis showed a significant difference in survival rate between the low- and high-expression groups (p < 0.01). Progressive survival analysis also revealed statistical differences in survival rates between the two groups.
Expression of Nur77 mRNA in various cell lines and cells in various groups
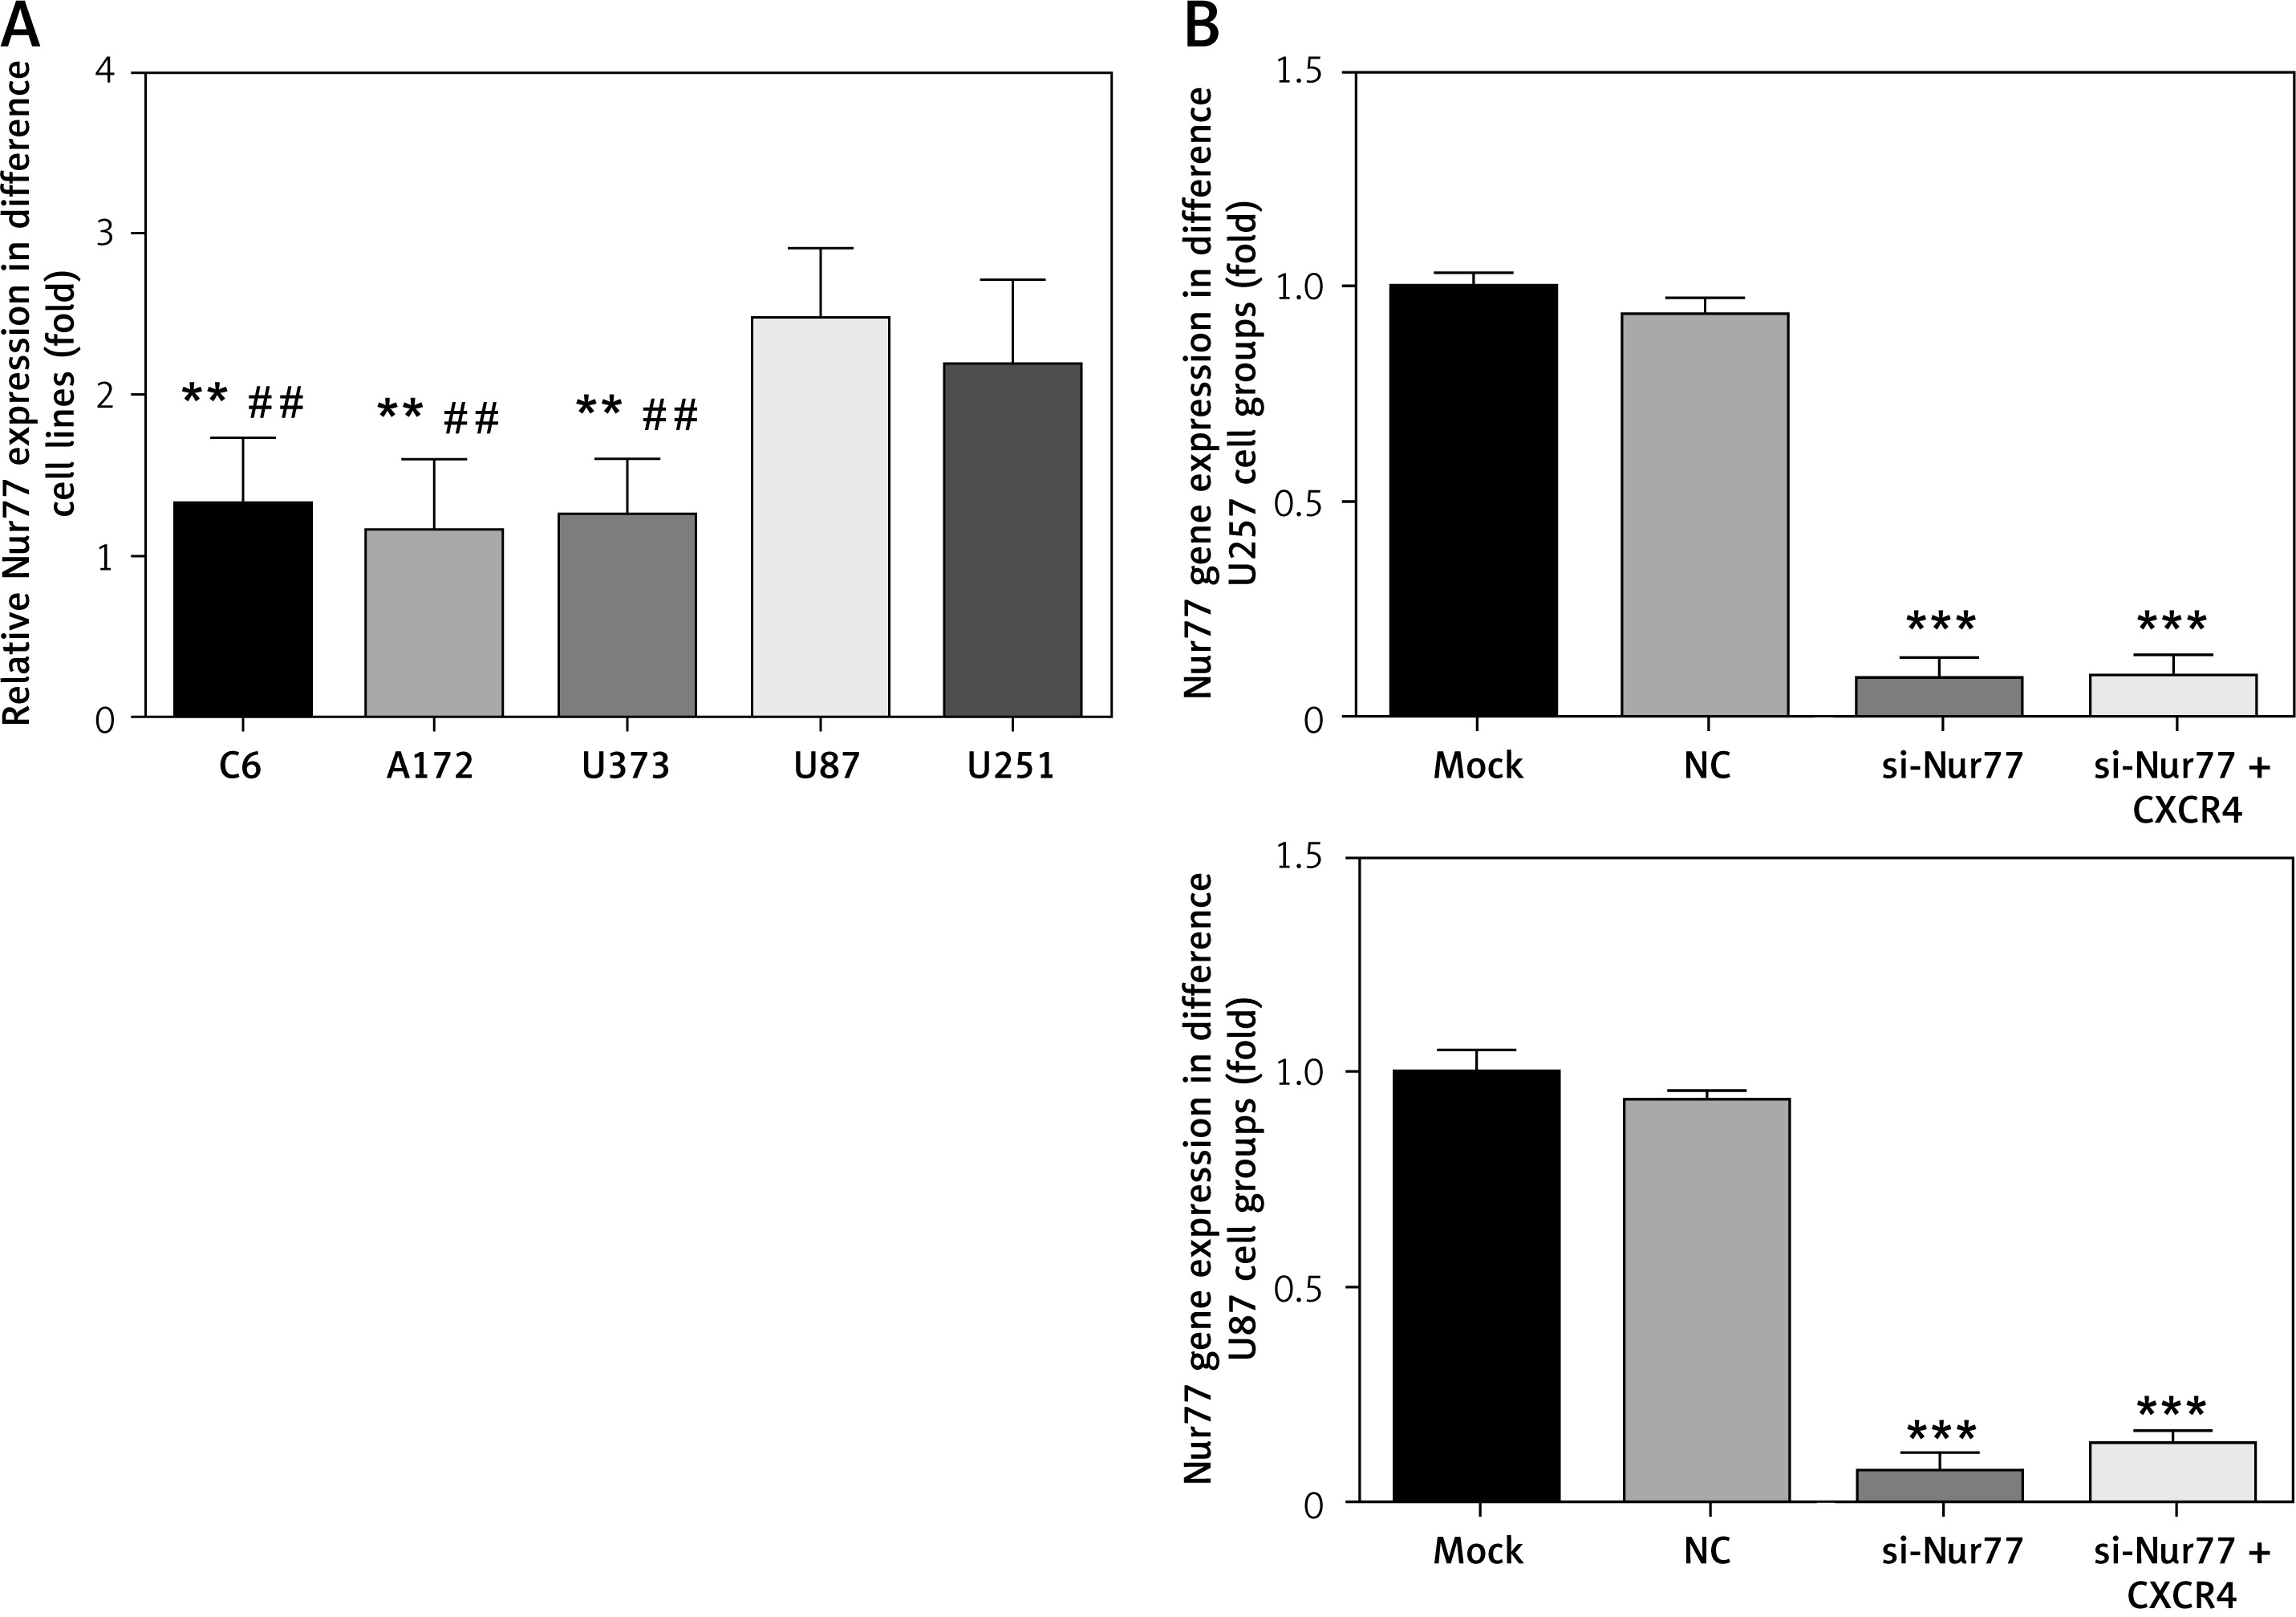
Compared with that in U87 and U251 cells, the expression of Nur77 mRNA in C6, A172, and U373 cells decreased significantly (p < 0.01). The U87 and U257 cell lines were thus selected as research objects in the present study. Compared with the NC group, the si-Nur77 and si-Nur + CXCR4 groups showed obvious decreases in Nur77 expression (p < 0.001). This result suggests that transfection of si-Nur77 into U257 and U87 cells could effectively reduce the expression of Nur77 in these cells (Figure 3).
Figure 3
Nur77 gene expression in different cell lines and groups as determined by RT-qPCR assay. A – Nur77 gene expression of different cell lines. B – Nur77 gene expression of different groups in the U257 and U87 cell lines
**P < 0.01, compared with the U87 cell line; ***p < 0.001, ##p < 0.01, compared with the U87 cell line.
Effects of Nur77 knockout on proliferation and apoptosis of U257 and U87 cells
MTT assay results showed that the viability of U87 and U257 cells was obviously inhibited in the si-Nur77 group compared with that in the NC group (p < 0.001, Figure 4 A). However, when CXCR4 was transfected into U87 and U257 cells, the viability of U87 and U257 cells was restored, and no evident difference was observed compared to the NC group (p > 0.05, Figure 4 A). Flow cytometry revealed that the apoptotic rates of U257 and U87 cells were significantly increased after transfection with si-Nur77 compared with those in the NC group (p < 0.001, Figures 4 B, C). However, simultaneous transfection of CXCR4 into the U87 and U257 cells decreased the apoptotic rates of these cells, and no remarkable difference was observed compared with the NC group (p > 0.05, Figures 4 B, C).
Figure 4
Cell viability and apoptosis in different groups. A – Cell viability of different groups in the U257 and U87 cell lines as determined by MTT assay. B – Cell apoptosis rates of different groups in the U257 cell line as determined by flow cytometry. Cell apoptosis rates of different groups in the U87 cell line as determined by flow cytometry
***P < 0.001, compared with the NC group.
Effect of Nur77 knockout on invasion of U257 and U87 cells
Transwell assay results (Figures 5 A, B) indicated that the number of invasive U87 and U257 cells was significantly inhibited in the si-Nur77 group compared with that in the NC group (p < 0.001). When CXCR4 was transfected into U87 and U257 cells, the invasive ability of the cells was restored, and no obvious difference was observed compared with the NC group (p > 0.05).
Effect of Nur77 knockout on migration of U257 and U87 cells
The wound healing rate of U87 and U257 cells (Figures 6 A, B) was significantly inhibited in the si-Nur77 group compared with that in the NC group (p < 0.001). Transfection of CXCR4 into U87 and U257 cells restored the migration ability of U87 and U257 cells, and no significant difference was observed compared with the NC group (p > 0.05).
Effects of Nur77 knockout on related gene expression in U257 and U87 cells
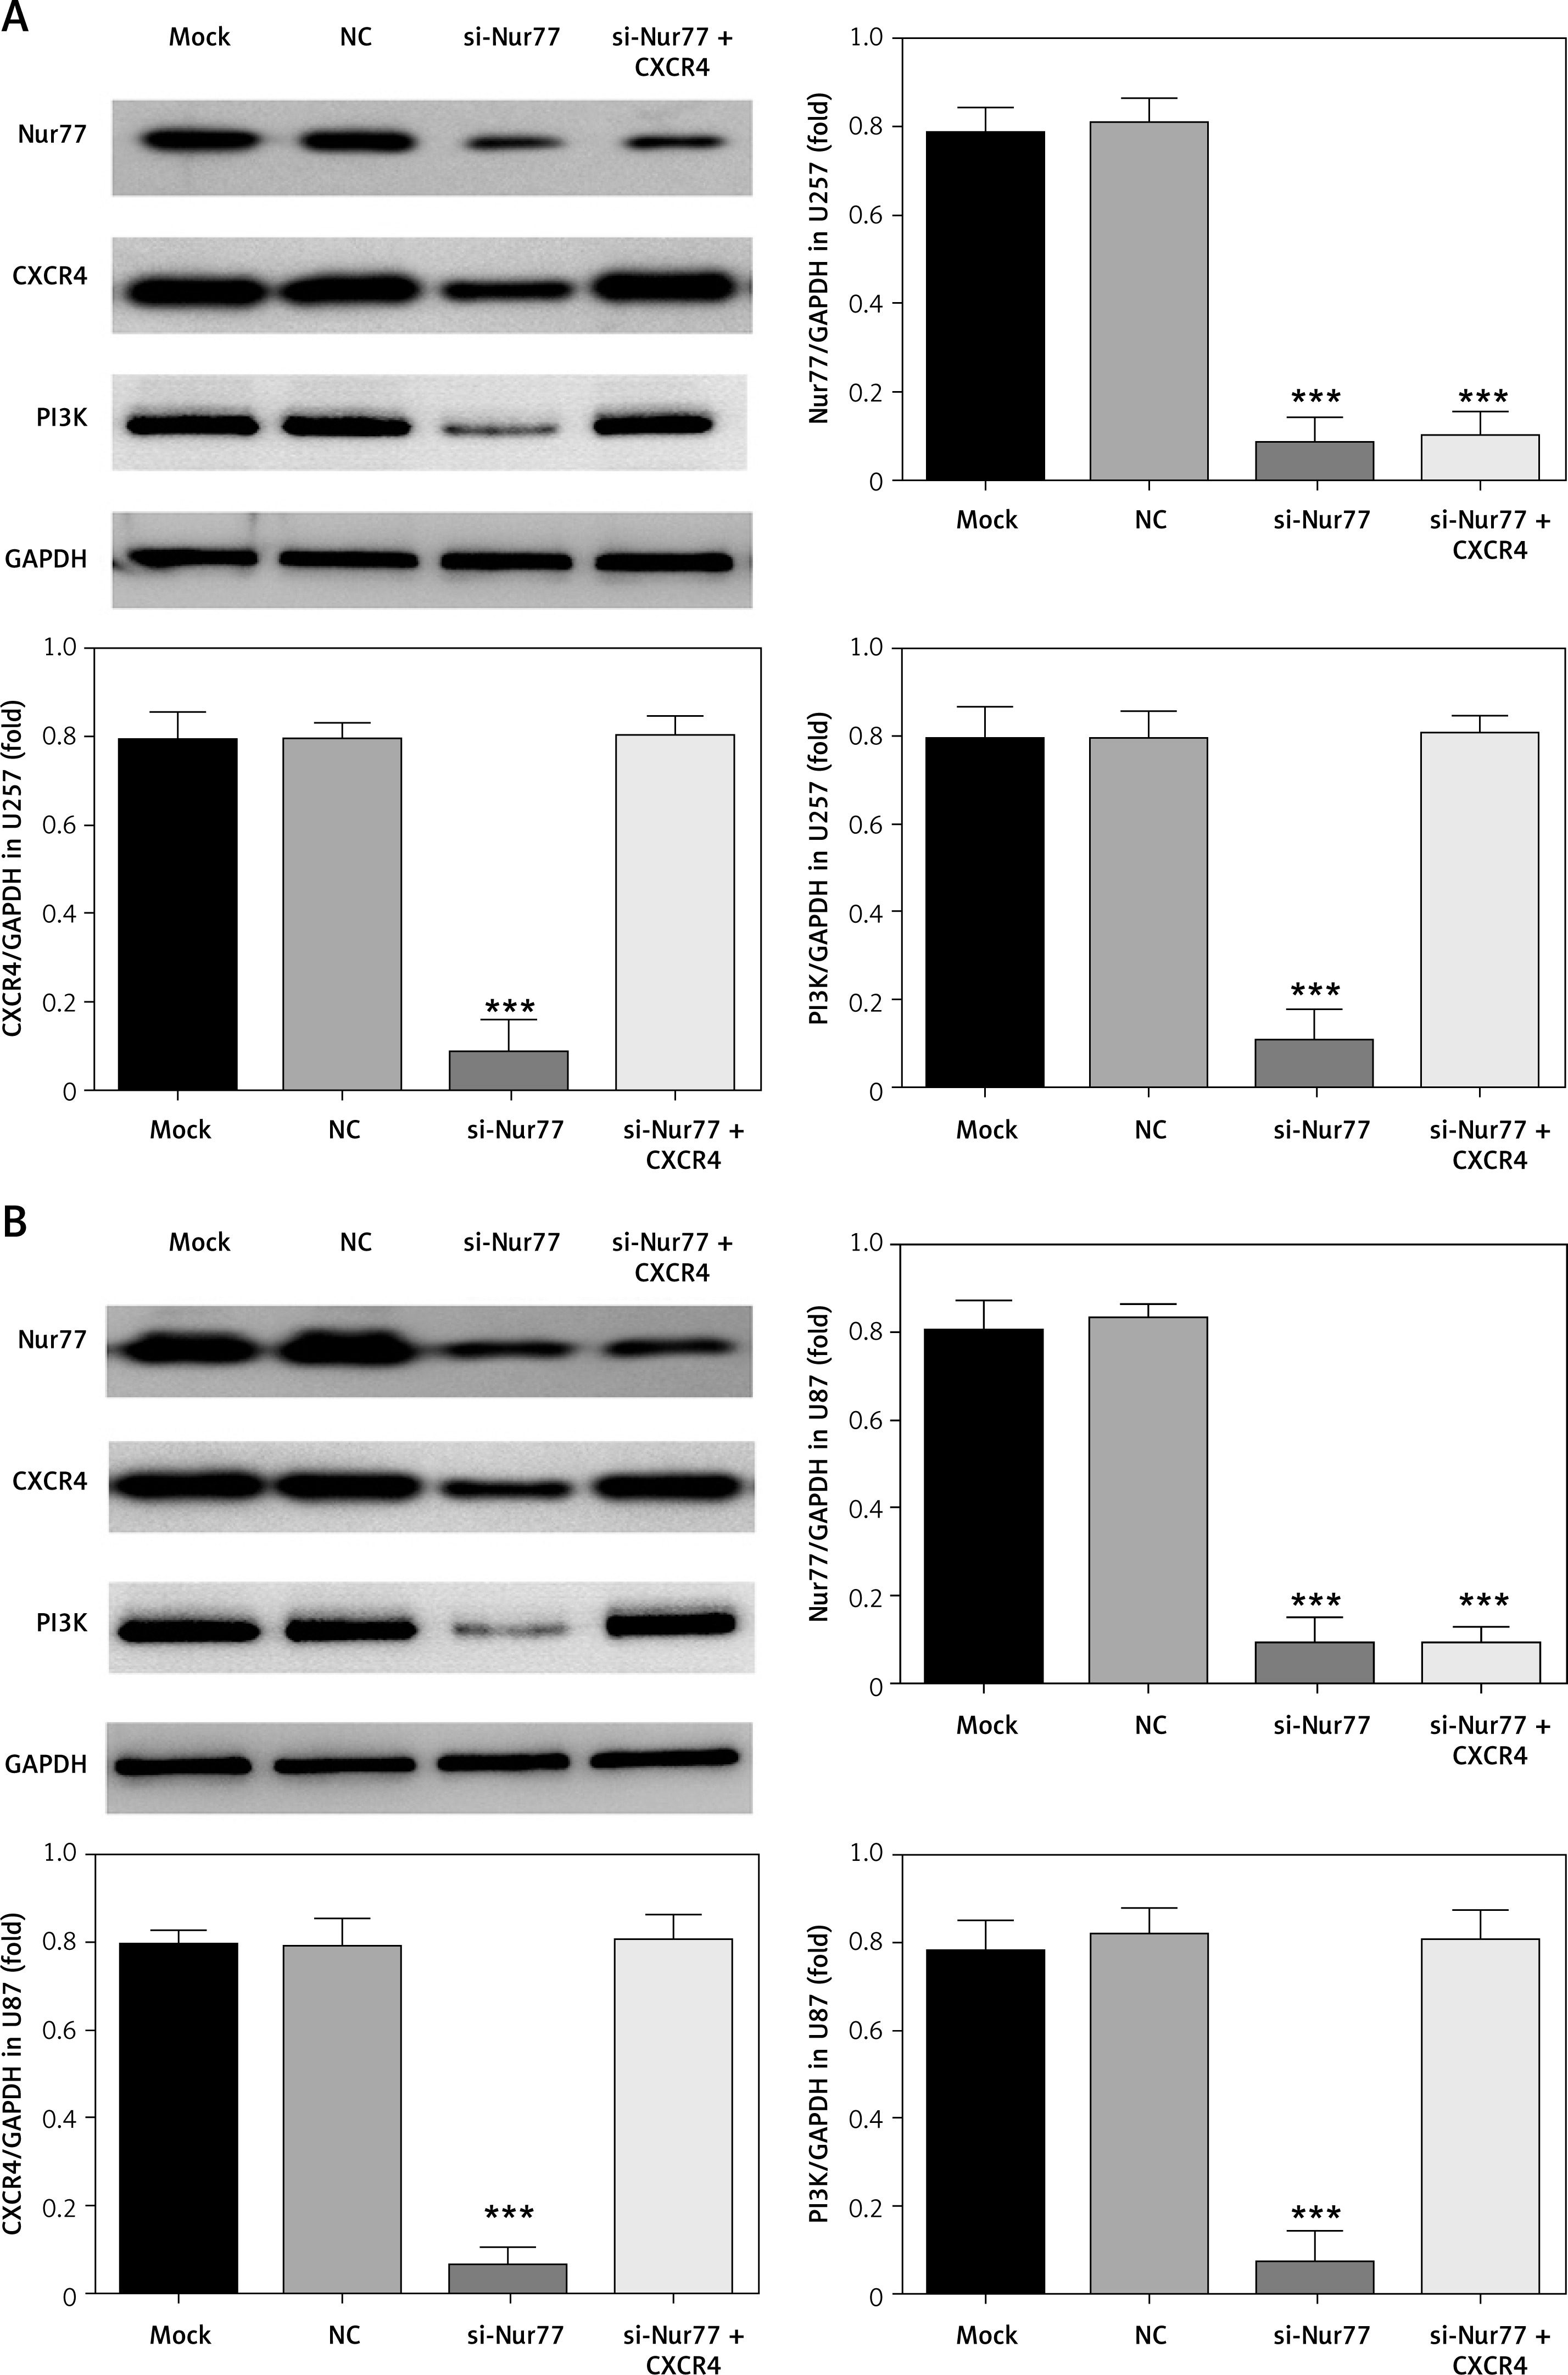
RT-qPCR detection results (Figures 7 A, B) showed that the expression levels of Nur77, CXCR4, and PI3K were evidently inhibited in the U87 and U257 cell lines in the si-Nur77 group compared with those in the NC group (p < 0.001). The expression of Nur77 in the si-Nur77+CXCR4 group was also notably inhibited (p < 0.001). These results suggest that transfection of CXCR4 has no effect on Nur77. After transfection of CXCR4 into U87 and U257 cells, the expression levels of CXCR4 and PI3K in U87 and U257 cells were restored, and no significant difference was observed compared with that in the NC group (p > 0.05).
Effect of Nur77 knockout on related protein expressions in U257 and U87 cells
Western blot assay (Figures 8 A, B) indicated that the expression levels of Nur77, CXCR4, and PI3K were notably inhibited in the si-Nur77 group compared with those in the NC group (p < 0.001). Similar results of Nur77 protein expression were observed in the si-Nur77 + CXCR4 group (p < 0.001), thus suggesting no significant effect of transfection of CXCR4 on Nur77. Transfection of CXCR4 into U87 and U257 cells restored the protein expression levels of CXCR4 and PI3K in these cells, and no obvious difference was observed compared with that in the NC group (p > 0.05).
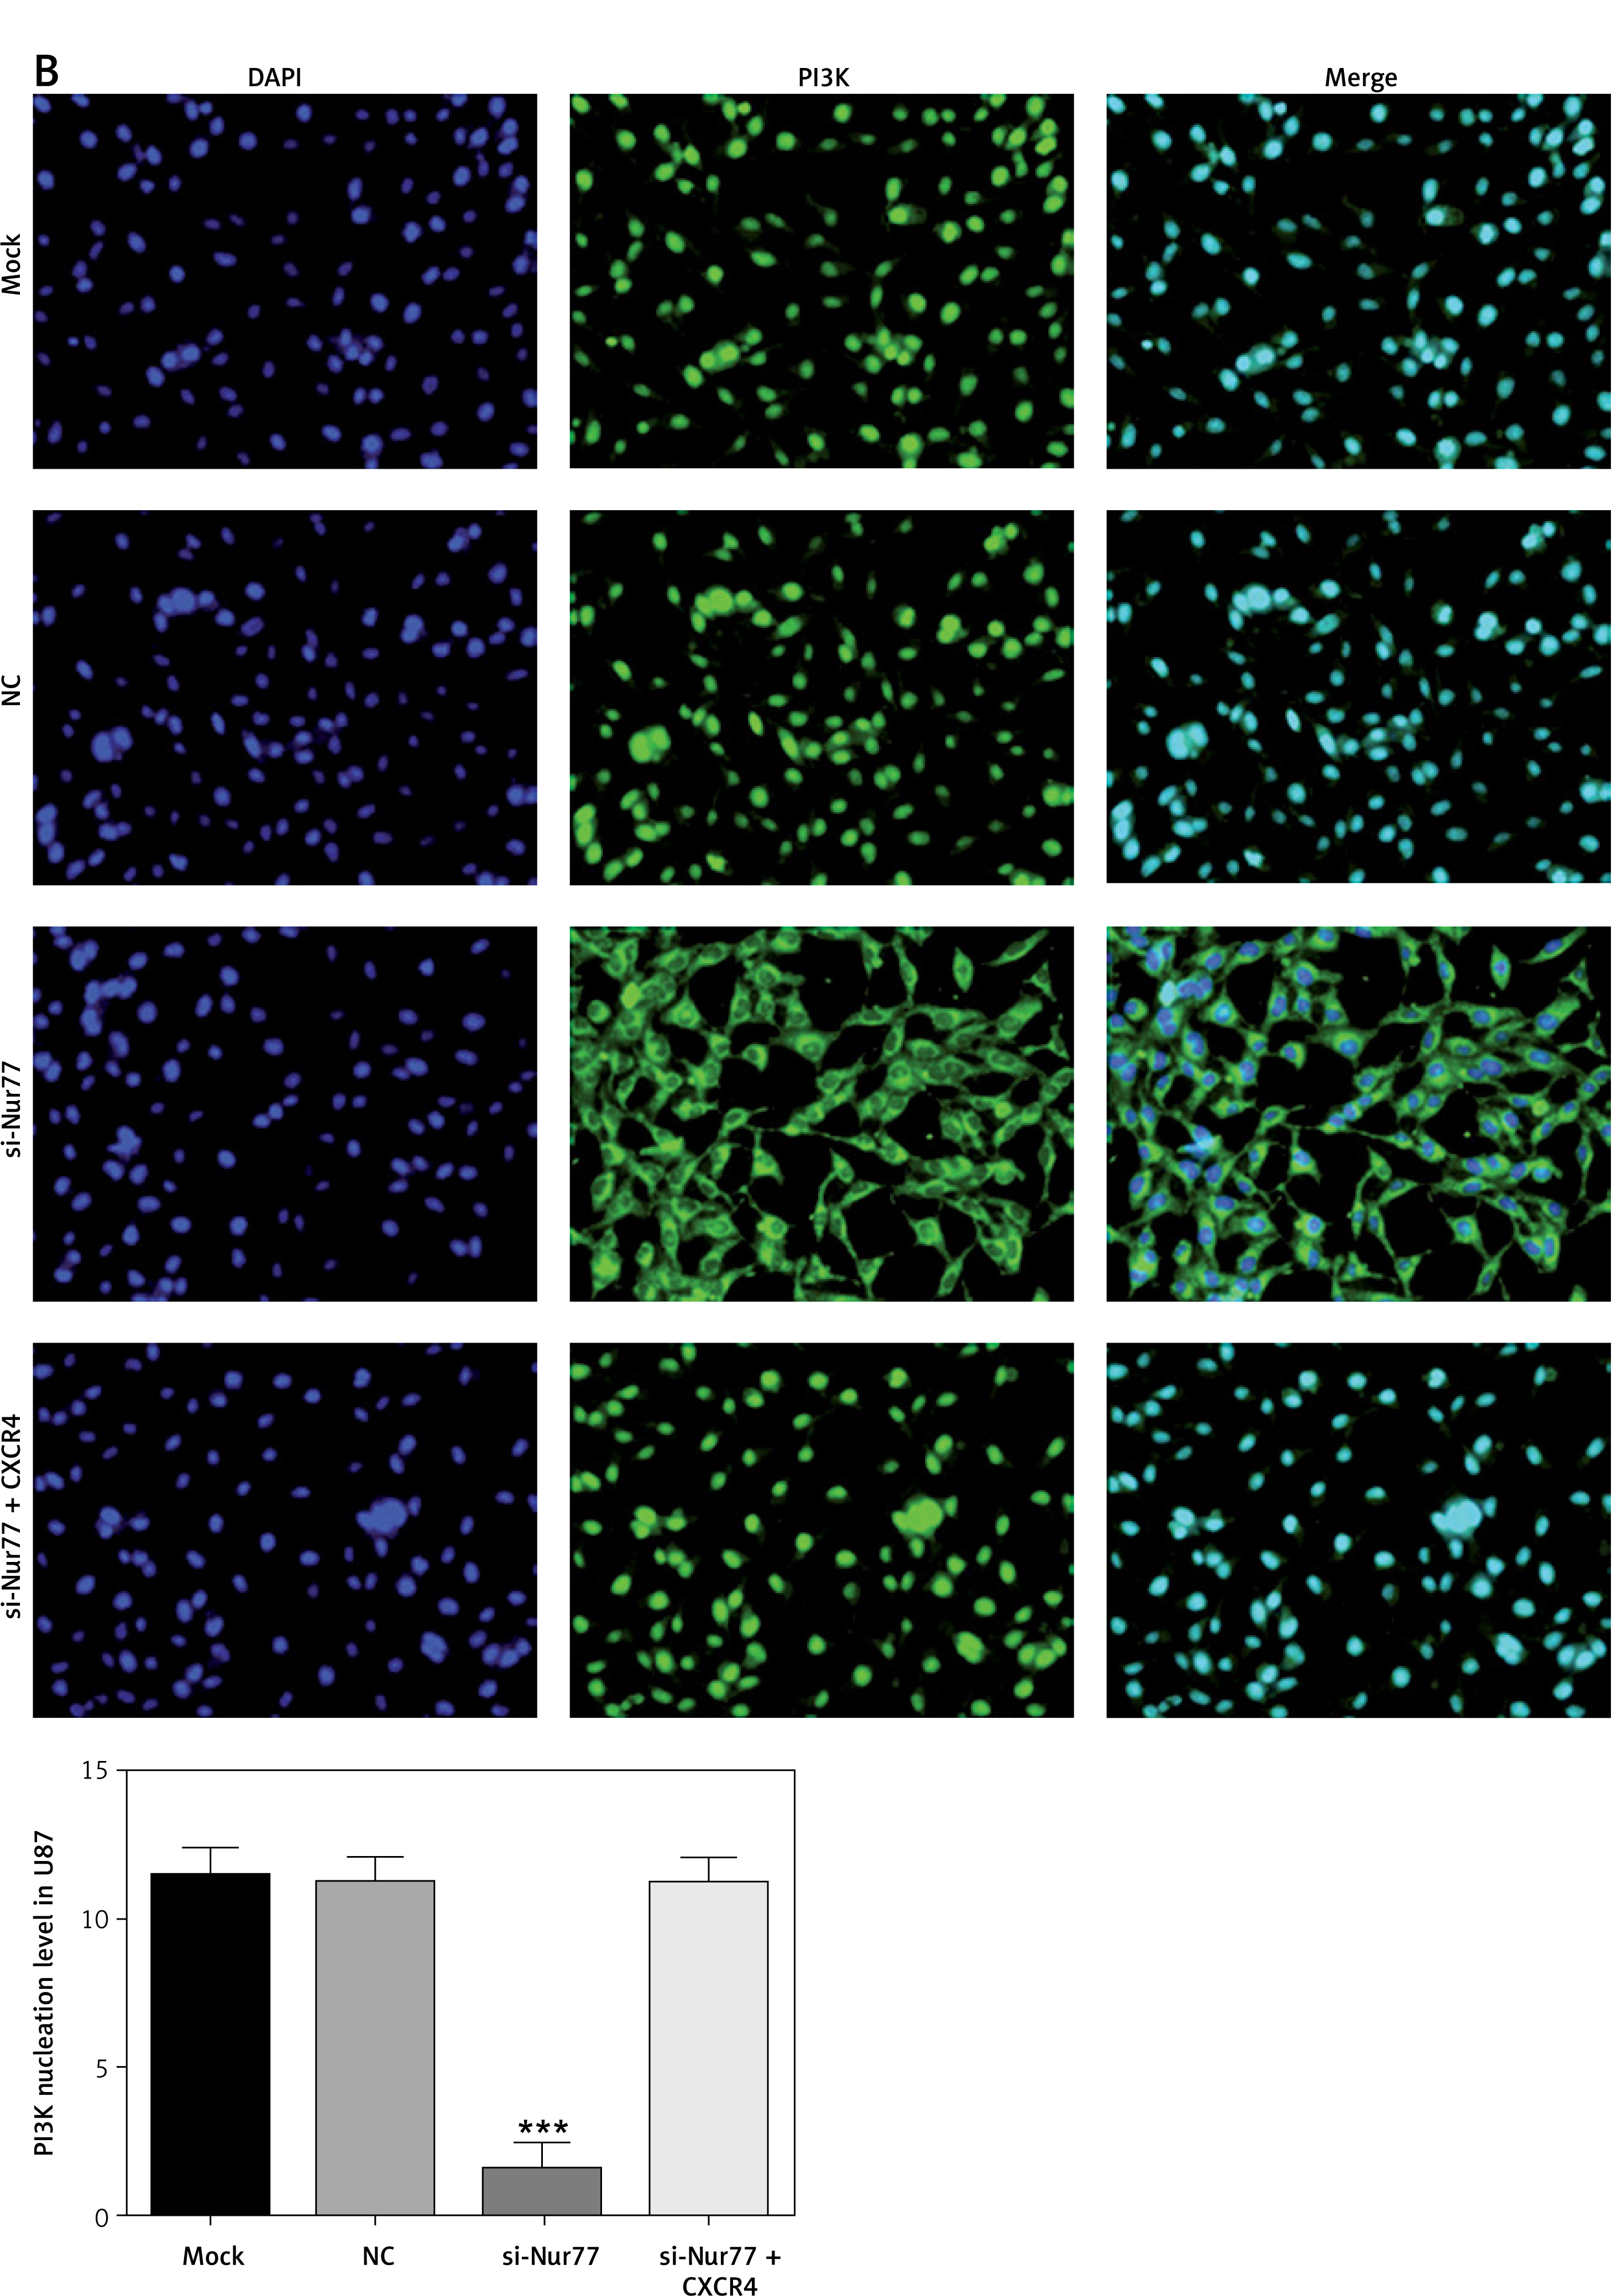
Effect of Nur77 knockout on nuclear entry of PI3K in U257 and U87 cells
Immunofluorescence assay (Figures 9 A, B) revealed that nuclear entry of PI3K into U87 and U257 cells was significantly decreased in the si-Nur77 group compared with that in the NC group (p < 0.001). However, nuclear entry of PI3K into U87 and U257 cells was recovered when CXCR4 was transfected into these cells, and no significant difference was observed compared with the NC group (p > 0.05).
Discussion
As shown by an increasing number of studies, the orphan nuclear receptor Nur77 plays an important role in promoting cell growth, proliferation, apoptosis, and metabolism in many physiological and pathological processes [12–14]. High expression of Nur77 has been reported to be a prerequisite for the survival, proliferation, and malignant transformation of multiple tumours [15]. Lee et al. [16] confirmed that Nur77 is over-expressed in approximately 80% of pancreatic cancer tissues but expressed in only 20% of normal pancreatic tissues. Knock-down of endogenous Nur77 results in inhibited growth of pancreatic cancer cells and regulated expression in intracellular survival factors. Kolluri et al. [17] confirmed that Nur77 could be strongly expressed in the lung cancer cell line H460 and Calu-6 under the action of epidermal growth factor, serum, and other mitogenic stimuli and promotes cell proliferation and growth. Besides, exogenous Nur77 plasmid transfection accelerated the cell cycle process and increased the number of cells in the S/G2 phase. Inhibiting the expression of endogenous Nur77 significantly inhibited the growth of H460 cells. Nur77 also has the ability to promote the metastasis of cancer cells. For example, Wang et al. [18] found that Nur77 is highly expressed in invasive and metastatic colon cancer cells. In the colon cancer cell line HCT116, the Nur77-bound matrix metalloproteinase-9 (MMP-9) promoter activated the transcription of MMP-9, resulting in the accelerated invasion and metastasis of cancer cells. Kingsmore et al. [19] discovered that the migration, invasion, and surface epithelial–mesenchymal transition of colon cancer cells increases simultaneously when Nur77 is induced to express in a hypoxic environment. Therefore, we speculate that Nur77 may be related to the occurrence and development of glioma.
The clinical experiments we conducted in this study revealed that the expression of Nur77 is obviously higher in glioma tissues than in normal brain injury tissues. In addition, the expression level of Nur77 protein is intimately correlated with the tumour size, TNM stage, infiltration, and differentiation of glioma. The expression of the Nur77 gene was detected by RT-qPCR in sample tissues included in this study, and enrolled patients were further divided into groups with low and high Nur77 expression. Further follow-up results showed that the progression-free survival (PFS) and total survival times of the low-expression group were remarkably higher than those of the high-expression group. A related in vitro cell experiment was established in the present study to clarify the specific mechanism of Nur77 in the development of glioma.
Recent basic studies on glioma have demonstrated that CXCL12, also known as stromal cell-derived factor-1, can specifically bind to chemokine receptor-4 (CXCR4) and induce the tendency of invasion of glioma cells, leading to the invasive growth of glioma [19–21]. CXCL12 is a type of CXCR chemokine receptor that is secreted primarily by bone marrow stromal cells. Three forms of CXCL12 exist in the human body – namely, α, β, and γ; of these, α is the main form and is expressed in nearly all organs. The major role of CXCL12 is to participate in the formation of blood vessels, bone marrow, and lymphocytes. CXCR4, a specific receptor of CXCL12, is a highly conserved G protein-coupled receptor consisting of 352 amino acids. Intracellular regions of CXCR4 are coupled to G protein when extracellular N-terminal sites bind to the ligand, and C-terminal phosphorylated serine/threonine is involved in multiple signal transduction in organisms [22]. When CXCL12 specifically binds to the N-terminal of CXCR4, coupling molecular pairs that play a role in the invasion and metastasis of malignant tumours by activating downstream signalling pathways can be formed [23–25]. In the second part of our basic experiment, Nur77 was knocked out in U257 and U87 cells. The proliferation ability of U257 and U87 cells was evidently inhibited with increasing apoptotic rate and was accompanied by suppressed invasion and migration ability. RT-qPCR and western blot showed that Nur77 knock-out could effectively reduce the expression of CXCR4 and PI3K in U257 and U87 cells. CXCR4 is a key factor mediating PI3K activation [26], which is critical for the activation of the biological activity of tumour cells [27–30]. In this study, cellular immunofluorescence assay showed that Nur77 knock-out significantly reduces the nuclear entry of PI3K protein, which may be the main factor leading to the decrease in biological activity of U257 and U87 cells.
In conclusion, Nur77 knock-out can effectively inhibit the biological activity of U257 and U87 glial cells. Our clinical study supports the previous finding that patients with low Nur77 expression have significantly better pathological characteristics, survival rates, and PFS than those with high Nur77 expression. Furthermore, in vitro cell experiments suggest that Nur77 knock-out can effectively inhibit the biological activity of U257 and U87 glial cells. The major mechanism of this effect may be related to the inhibition of CXCR4 expression and PI3K activity in downstream pathways. Thus, Nur77 may be a potential target protein in future clinical drug research for glioma treatment.