Introduction
Gliomas are common tumors that arise in the brain, and common subtypes include astrocytomas, oligodendrogliomas, and ependymoma [1]. Glial tumors encompass a broader spectrum, including mixed gliomas, all derived from glial cells [2]. These tumors can occur in different brain and spinal cord regions and exhibit different histological and molecular characteristics [3]. The World Health Organization (WHO) system states that gliomas are classified histologically and graded for malignancy [4]. Gliomas of grades I and II are regarded as low-grade, but those of grades III and IV are high-grade and significantly aggressive. High-grade gliomas develop swiftly and invade surrounding tissue, posing significant treatment challenges. The etiology of glioma is multifactorial and involves genetic predisposition, ionizing radiation, and environmental factors [5]. Clinically, gliomas can cause headaches, seizures, cognitive deficits, and focal neurological deficits, depending on their location and size [6]. Standard treatments include surgical resection, chemotherapy, and radiation therapy [7]. Even with advancements in treatment, glioma patients still have a dismal prognosis, particularly those with malignancies of a high grade, because of their aggressive and recurrent nature [8]. Research continues to investigate the underlying molecular processes of glioma formation and create novel therapeutic approaches to enhance patient outcomes.
Ferroptosis is a type of controlled cell death characterized by iron-dependent lipid peroxidation [9]. Unlike apoptosis or necrosis, ferroptosis involves the collection of lipid reactive oxygen species (ROS), leading to membrane damage and cell death. It is crucial for several physiological functions, including the immune response and tissue homeostasis. Dysregulation of ferroptosis is associated with several tumors, including glioma [10]. Zhu et al. utilized a biomimetic nanosonosensitizer for synergistic therapy against gliomas, combining sonodynamic therapy (SDT) and ferroptosis [11]. This approach, facilitated by circulated microbubbles (MBs) and focusing ultrasound (US) to open the blood-brain barrier (BBB), resulted in a significant reduction in orthotopic gliomas. Additionally, Zhou et al. identified the impact of ferroptosis on glioma prognosis, potentially regulated by autophagy [12]. Their novel gene signature, incorporating autophagy-ferroptosis genes, predicts glioma survival and offers insights for future treatment strategies. Zheng et al. explored the importance of ferroptosis-related genes in prognosis in lower-grade gliomas (LGG), identifying 12 genes associated with overall survival in LGG patients [13]. This implies a potential link between ferroptosis and LGG prognosis. Moreover, ferroptosis has been linked to epithelial-mesenchymal transition (EMT), a procedure that enhances tumor invasiveness and metastasis, suggesting a broader impact on cancer progression. For example, balsalazide induces ferroptosis via a Slug-dependent EMT signaling pathway, inhibiting the growth of glioblastoma (GBM) [14]. The interplay between ferroptosis and EMT further underscores the complex molecular landscape of gliomas, offering new avenues for therapeutic intervention. Understanding the molecular mechanisms of ferroptosis provides a promising approach to the treatment of gliomas, highlighting its relevance in developing innovative therapeutic strategies.
STXBP1, also designated syntaxin binding protein 1, is a gene situated on chromosome 9q34.11 that encodes a protein of paramount importance for synaptic vesicle exocytosis [15]. This protein is vital in regulating neurotransmitter release at synapses, particularly in the central nervous system. Mutations in the STXBP1 gene have been linked to several neurological disorders, including intellectual disability and early infantile epileptic encephalopathy (EIEE) [9]. These mutations result in the disruption of normal synaptic function, which in turn leads to the development of abnormal neuronal excitability and synaptic transmission. Research indicates that STXBP1 mutations are associated with a spectrum of clinical phenotypes, ranging from severe epileptic encephalopathies to milder forms of developmental delay and intellectual disability. For example, Zhang et al. demonstrated significant pleiotropy between STXBP1 and SCN2A across four neurodevelopmental disorders, suggesting the potential for shared genetic foundations [16]. Zhou et al. demonstrated a strong association between STXBP1 mutations and West syndrome in epileptic encephalopathies, underscoring the utility of targeted next-generation sequencing (NGS) for diagnosing genetic etiologies and assessing variant pathogenicity [17]. Furthermore, Stamberger et al. identified STXBP1 mutations as a primary contributor to epilepsy and encephalopathy, often accompanied by severe to profound intellectual disability and various seizure types [18]. A comprehensive understanding of the molecular processes underlying STXBP1-related diseases is essential for advancing targeted therapies and improving patient outcomes. This research continues to indicate the function of STXBP1 in synaptic physiology and its impact on the pathogenesis of neurological diseases.
This study aimed to investigate the function of STXBP1 in glioma, particularly its involvement in regulating ferroptosis and EMT. Given its significant impact on neurological function and potential link to mechanisms of cancer progression, we aimed to elucidate the impact of STXBP1 on the pathogenesis of glioma cells. Functional experiments targeting STXBP1 clarified its roles in glioma cell migration, proliferation, invasion, apoptosis, cell cycle distribution, and regulation of ferroptosis. Furthermore, the study demonstrated the influence of STXBP1 on the EMT of ferroptosis-dependent tumor cells, indicating its multifaceted involvement in tumor progression. Collectively, these results offer important new understandings of the molecular pathways underlying the growth of gliomas and possible targets for therapeutic intervention.
Material and methods
Download of glioma-related data sets and screening of differentially expressed genes (DEGs)
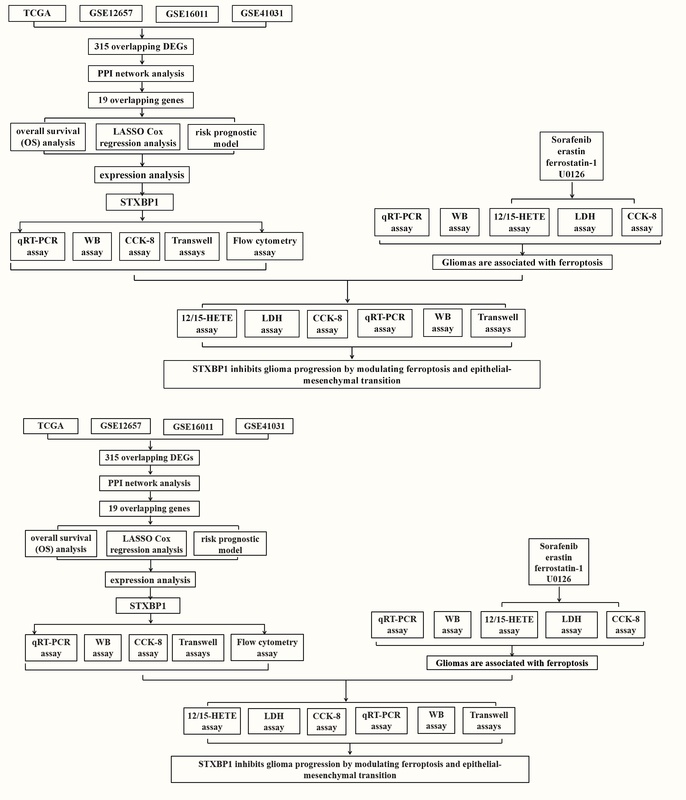
Glioma microarray data sets, including GSE12657, GSE16011, and GSE41031, were retrieved from the Gene Expression Omnibus (GEO) database (https://www.ncbi.nlm.nih.gov/gds/). Among them, the GSE12657 dataset contains 14 glioma samples and 5 control samples, the GSE16011 dataset contains 276 glioma samples and 8 control samples, and the GSE41031 dataset contains 3 glioma samples and 3 control samples. Additionally, the Cancer Genome Atlas (TCGA) glioma dataset was obtained via the ASSISTANT for Clinical Bioinformatics website (https://www.aclbi.com/static/index.html#/), comprising 666 glioma samples and 5 normal control samples. The probe ID was translated into gene symbols, and differential analysis was employed by the “limma” package in the R programming language (http://www.r-project.org). Genes with fold change (FC) > 2 were regarded as DEGs that were upregulated, genes with FC < 0.5 were considered as down-regulated DEGs, and the statistical significance level was set at a P-value < 0.05.
Cross-analysis and prognostic assessment of overlapping DEGs in glioma datasets
The upregulated and downregulated DEGs from TCGA-glioma, GSE12657, GSE16011, and GSE41031 datasets were subjected to cross-analysis using the bioinformatics platform (https://bioinformatics.psb.ugent.be/webtools/Venn/). Overlapping upregulated and downregulated DEGs were obtained. Subsequently, protein-protein interaction (PPI) network analysis was used on overlapping DEGs utilizing the Search Tool for the Retrieval of Interacting Genes (STRING) database (https://string-db.org/). The generated PPI network included parameters such as degree, edge percolated component (EPC), and maximum neighborhood component (MNC), and was displayed using Cytoscape, an open-source network visualization program (version 3.7.1). The statistical significance of the obtained results was evaluated, with a significance threshold set at p < 0.05. Cross-analysis of the top 25 genes based on degree, MNC, and EPC yielded key overlapping genes. To assess the prognostic significance of the identified genes, we used an overall survival (OS) analysis utilizing the Cox proportional hazards model. The 95% confidence intervals (CIs) and hazard ratios (HRs) for each gene were calculated, and genes with significant P-values (p < 0.05) were considered prognostically relevant.
Identification of characteristic prognostic genes and construction of the risk prognostic model
The analysis of significant genes for OS prognosis was completed utilizing the “glmnet” package in R software. The tuning parameters for the least absolute shrinkage and selection operator (LASSO) model in the glmnet program (https://CRAN.R-project.org/package=glmnet) were determined through ten-fold cross-validation. The optimal λ, representing the minimum criterion for adjusted parameters, was identified to select the most predictive genes. These selected genes, representing the most statistically significant predictors in our dataset, formed the foundation of the risk prognostic model. Subsequently, the glioma cohort from the TCGA database was stratified into two risk groups (high-risk and low-risk) according to the expression patterns of the relevant genes. A risk assessment was then conducted for both groups. Kaplan-Meier (KM) analysis was employed to ascertain the OS probability for the two risk groups. Additionally, median survival time was calculated, and the statistical significance of survival differences between the two groups was assessed using the log-rank test to derive P-values. Hazard ratios (HR) for the high-risk group were also computed to further elucidate relative risk. Finally, receiver operating characteristic (ROC) curves were generated using the “timeROC” package, and the area under curve (AUC) values were computed to assess the predictive ability of the prognostic models for patient survival at 1, 3, and 5 years. Higher AUC values indicate stronger prognostic prediction capabilities.
Identification of hub genes in glioma
Prognostic feature genes of significance were subjected to correlation analysis utilizing the R package. Multivariate and univariate Cox regression examinations were conducted on signature genes and specific clinical predictive variables (age, grade stage) using the forestplot program (https://CRAN.R-project.org/package=forestplot). The 95% CIs, HRs, and P-values were calculated for each variable, identifying key prognostic factors with a P-value < 0.05. Subsequently, nomograms predicting 1-, 3-, and 5-year survival were built with the “rms” package (https://CRAN.R-project.org/package=rms), and the concordance index (C-index) was determined. Calibration curves were generated to assess the nomogram’s predictive performance, with closer alignment between the survival curves and the calibration curve indicating better model performance. To evaluate the expression of the three signature genes, processing and displaying data were executed with R (version 4.1.2), examining their expression in tumor and normal groups across the TCGA-glioma, GSE12657, GSE16011, and GSE41031 datasets.
Cell sources and processing
Human embryonic brain cells (HEB) and glioma cells, including U251, SW1783, and U87, were purchased from the Chinese Academy of Sciences (Shanghai, China), kept in Dulbecco’s Modified Eagle Medium (DMEM) with 1% penicillin-streptomycin and 10% fetal bovine serum (FBS) added. Cell cultures were maintained in a humidified atmosphere at 37°C with 5% CO2. For the ferroptosis experiments, glioma cells were planted at a density of 1 × 10⁶ cells per well in 6-well plates. The cells were treated with the following compounds for 3 days: sorafenib (5 μM) and erastin (10 μM) were used as ferroptosis inducers, while ferrostatin-1 (1 μM) and U0126 (5 μM) were used as ferroptosis inhibitors. Dimethyl sulfoxide (DMSO) at a concentration of 5 μM was used as a control. Sorafenib and erastin promoted lipid peroxidation, leading to cell death, whereas ferrostatin-1 and U0126 prevented lipid peroxidation, thereby protecting the cells. This experimental setup allowed for the evaluation of the impacts of ferroptosis modulation on glioma cell viability and the associated molecular pathways.
Cell transfection
For transient transfection, glioma cells were seeded at a density of 2 × 10⁵ cells per well in 24-well plates. Specific small interfering RNAs (siRNAs) targeting STXBP1 (si-STXBP1 -1, si-STXBP1 -2, and si-STXBP1 -3) were used to knock down STXBP1 expression in the glioma cells. As a control, cells were transfected with a non-targeting siRNA (si-NC). Cells were transfected utilizing Lipofectamine 3000 (Invitrogen, China) in compliance with the manufacturer’s guidelines. Following transfection, the cells were incubated for a specific duration to ensure efficient knockdown of STXBP1 expression.
Quantitative real-time polymerase chain reaction (qRT-PCR)
The total RNA of glioma cells was extracted by the TRIzol reagent (Tiangen, Beijing, China) as directed by the manufacturer. For cDNA synthesis, we utilized a PrimeScript RT kit from Dalian, China. To carry out qRT-PCR with the StepOne-Plus Real-Time PCR System (Applied Biosystems, Shanghai, China), SYBR Green PCR Master Mix (Takara, China) was utilized. The expression levels of STXBP1, GPX4, N-cadherin, E-cadherin, and vimentin genes were quantified and normalized to GAPDH. All target expression levels were computed with the 2–ΔΔCT technique. The set of primer sequences is presented in Table I.
Table I
Primer sequences for qRT-PCR
Western blot (WB) assay
Phosphatase inhibitors (CoWin Biosciences, Nanjing, China) were included in RIPA lysis buffer (Solarbio, Beijing, China), which was used to generate protein lysates from glioma cells. The BCA Protein Assay Kit (Beyotime, China) was employed to measure the protein concentration. Proteins in equal quantities were separated using 10% SDS-PAGE and then transferred to PVDF membranes (Beyotime, Beijing, China). Primary antibodies were incubated on membranes that had been blocked with 5% skim milk, including anti-STXBP1, anti-CDK-1, anti-cyclin B1, anti-cyclin A2, anti-GPX4, anti-N-cadherin, anti-E-cadherin, and anti-vimentin (Wuhan Sanying Biology Technology Co., Ltd.), at a dilution of 1 : 2000. GAPDH (Kangcheng, Shanghai, China, 1 : 5000) was used as an internal reference. After washing, the corresponding secondary antibodies (1 : 5000 dilution) coupled with horseradish peroxidase (HRP) were incubated on the membranes for 1 h at room temperature. An enhanced chemiluminescence (ECL) kit (Tiangen, Beijing, China) was used to visualize the protein bands, and ChemiDoc imaging equipment (Bio-Rad, Shanghai, China) was used to take the images.
Cell counting Kit-8 (CCK-8) assay
The CCK-8 assay (KeyGEN, Nanjing, China) was used to evaluate the vitality of the glioma cells. In 96-well plates, glioma cells were planted at a density of 5 × 10³ cells per well. After adding CCK-8 reagent to each well after treatment, a microplate reader (Kehua Technologies, Inc., Shanghai, China) was employed to detect the absorbance at 450 nm after 24 h, 48 h, 72 h, 96 h, and 120 h.
Cell invasion and migration assays
Transwell assays (Corning Inc., Corning, NY, USA) were employed to measure cell invasion and migration. Transfected glioma cells were suspended in the upper chamber in serum-free media of the Transwell. Then, 10% FBS was added to the medium in the lower chamber of the Transwell. After an incubation period, cells with moving cell membranes were stained with DAPI and fixed with 4% paraformaldehyde. Lastly, the quantity of migrating cells in the field of view was counted using inverted microscopy. The upper chamber was coated with Matrigel (BD Biosciences) for the cell invasion experiments, which were conducted as previously reported [19].
Flow cytometry
Glioma cells were separated using trypsin-EDTA (Life Technologies Inc., Beijing, China) and then cleaned with phosphate-buffered saline (PBS) for flow cytometry analysis. As directed by the manufacturer, cells were stained with Annexin V and propidium iodide (PI) to distinguish between live, apoptotic, and necrotic cells. A flow cytometer (Jiyuan, Guangzhou, China) was used to conduct the flow cytometry. To calculate the apoptosis rate, data were examined using Flow-Jo software (FlowJo, Hangzhou, China). To evaluate cell cycle distribution, cells were fixed in 70% ethanol for an entire night at –20°C. They were then cleaned with PBS and stained with PI/RNase staining solution. Then, flow cytometry was employed to ascertain the cell distribution in the G1, S, and G2 phases. The results were plotted, and the proportion of cells in each cell cycle stage was assessed and compared under different experimental conditions to evaluate the effect of treatments on cell cycle progression.
12/15-HETE assay
Enzyme-linked immunosorbent assay (ELISA) kits specific for each chemical (12-HETE ELISA kits, ab133034, Abcam; 15-HETE ELISA kits, ab133035, Abcam) were used to measure the levels of 12-HETE and 15-HETE, in accordance with the procedures specified by the manufacturer. There were control, blank, standard, and sample wells on each 96-well plate, and each sample was analyzed twice. Initially, 50 µl of assay buffer and 100 µl of the suitable diluent were applied to the B0 (0 pg/ml standard) and non-specific binding (NSB) wells, respectively. All the wells were then filled with 50 µl of the 12/15-HETE alkaline phosphatase conjugate, and then the corresponding wells were filled with 50 µl of the 12/15-HETE antibody. The plates were incubated on a shaker at room temperature for 2 h. The wells were cleaned three times using the supplied wash buffer following incubation. 200 µl of pNpp substrate solution and 5 µl of 12/15-HETE alkaline phosphatase conjugate were then added to each well. After that, the plates were incubated for 3 h at 3°C without being shaken. A microplate reader (Molecular Devices, LLC) was used to measure the absorbance at 405 nm after the processes were stopped by adding 50 µl of stop solution to each well. To find the expression of 12/15-HETE, the mean net absorbance for each well was computed using the given formula.
Lactate dehydrogenase (LDH) assay
In accordance with the manufacturer’s instructions, the LDH release was measured using a colorimetric CytoTox 96 Cytotoxicity kit (Promega Corporation). By subjecting the cultures to a 10× lysis solution, the maximum levels of LDH release were ascertained by measuring the entire lysis. A 96-well plate reader (Molecular Devices, LLC) was used to detect absorbance at 490 nm. LDH expression was calculated as a percentage by dividing experimental LDH release by maximal LDH release.
Statistical analysis
The statistical study was completed with the R program. Every experiment was conducted in triplicate, and the results were reported as mean ± standard deviation (SD). Tukey’s test was utilized for post-hoc analysis after one-way analysis of variance (ANOVA) was utilized to determine the significance of differences between groups. A P-value < 0.05 was considered statistically significant.
Results
Identification of DEGs in glioma samples
Using the R package, 1867 downregulated and 1255 upregulated DEGs were found from glioma samples and normal controls in the TCGA dataset. Additionally, 467 upregulated and 810 downregulated DEGs were screened from the GSE12657 dataset, while 1264 upregulated and 1346 downregulated DEGs were identified from the GSE16011 dataset. Furthermore, 10794 upregulated and 1814 downregulated DEGs were extracted from the GSE41031 dataset (Supplementary Figures S1 A–D). Subsequent intersection analysis revealed 137 overlapping upregulated DEGs and 178 overlapping downregulated DEGs across the four datasets (Supplementary Figures S1 E, F).
PPI network and batch survival analysis of overlapping DEGs
PPI network analysis was performed on 315 overlapping DEGs using the Cytoscape software and STRING database. Three different gene module networks were generated according to the degree, MNC, and EPC algorithms (Supplementary Figures S2 A–C). Subsequent intersection analysis of DEGs within the three network modules identified 19 overlapping genes (Supplementary Figure S2 D). Prognostic evaluation of OS for these 19 genes revealed significant prognostic value for 17 genes, as shown in the forest plot (Supplementary Figure S2 E).
Identification and prognostic assessment of 13 characteristic genes of glioma
Through LASSO Cox regression analysis, 13 prognostic genes were identified with the optimal lambda value (lambda.min = 0.005) (Supplementary Figures S3 A, B). The risk scores for these genes were determined as follows: Riskscore = (0.0041) × NPY + (0.2462) × CALM3 + (0.2346) × CDK4 + (–0.551) × VAMP2 + (0.0687) × SYT1 + (0.0426) × EGFR + (0.072) × ANK3 + (0.0661) × CCK + (–0.2637) × SCN2A + (0.1766) × CALM1 + (–0.3069) × STXBP1 + (0.1075) × SNAP25 + (0.3827) × FN1. In risk model analysis, in comparison to the low-risk group, the high-risk group showed lower survival rates and higher death rates (Supplementary Figure S3 C). KM survival analysis results depicted a median survival time of 2 years for the high-risk group and 9.5 years for the low-risk group, with an HR of 4.666 (> 1) (Supplementary Figure S3 D). Additionally, the high-risk group had a reduced OS probability. ROC curve results further emphasized the predictive accuracy of the risk model, particularly at 3 years (AUC = 0.856) (Supplementary Figure S3 E). In summary, our study underscores the significant prognostic potential of these 13 genes.
Identification of hub genes in glioma risk model analysis
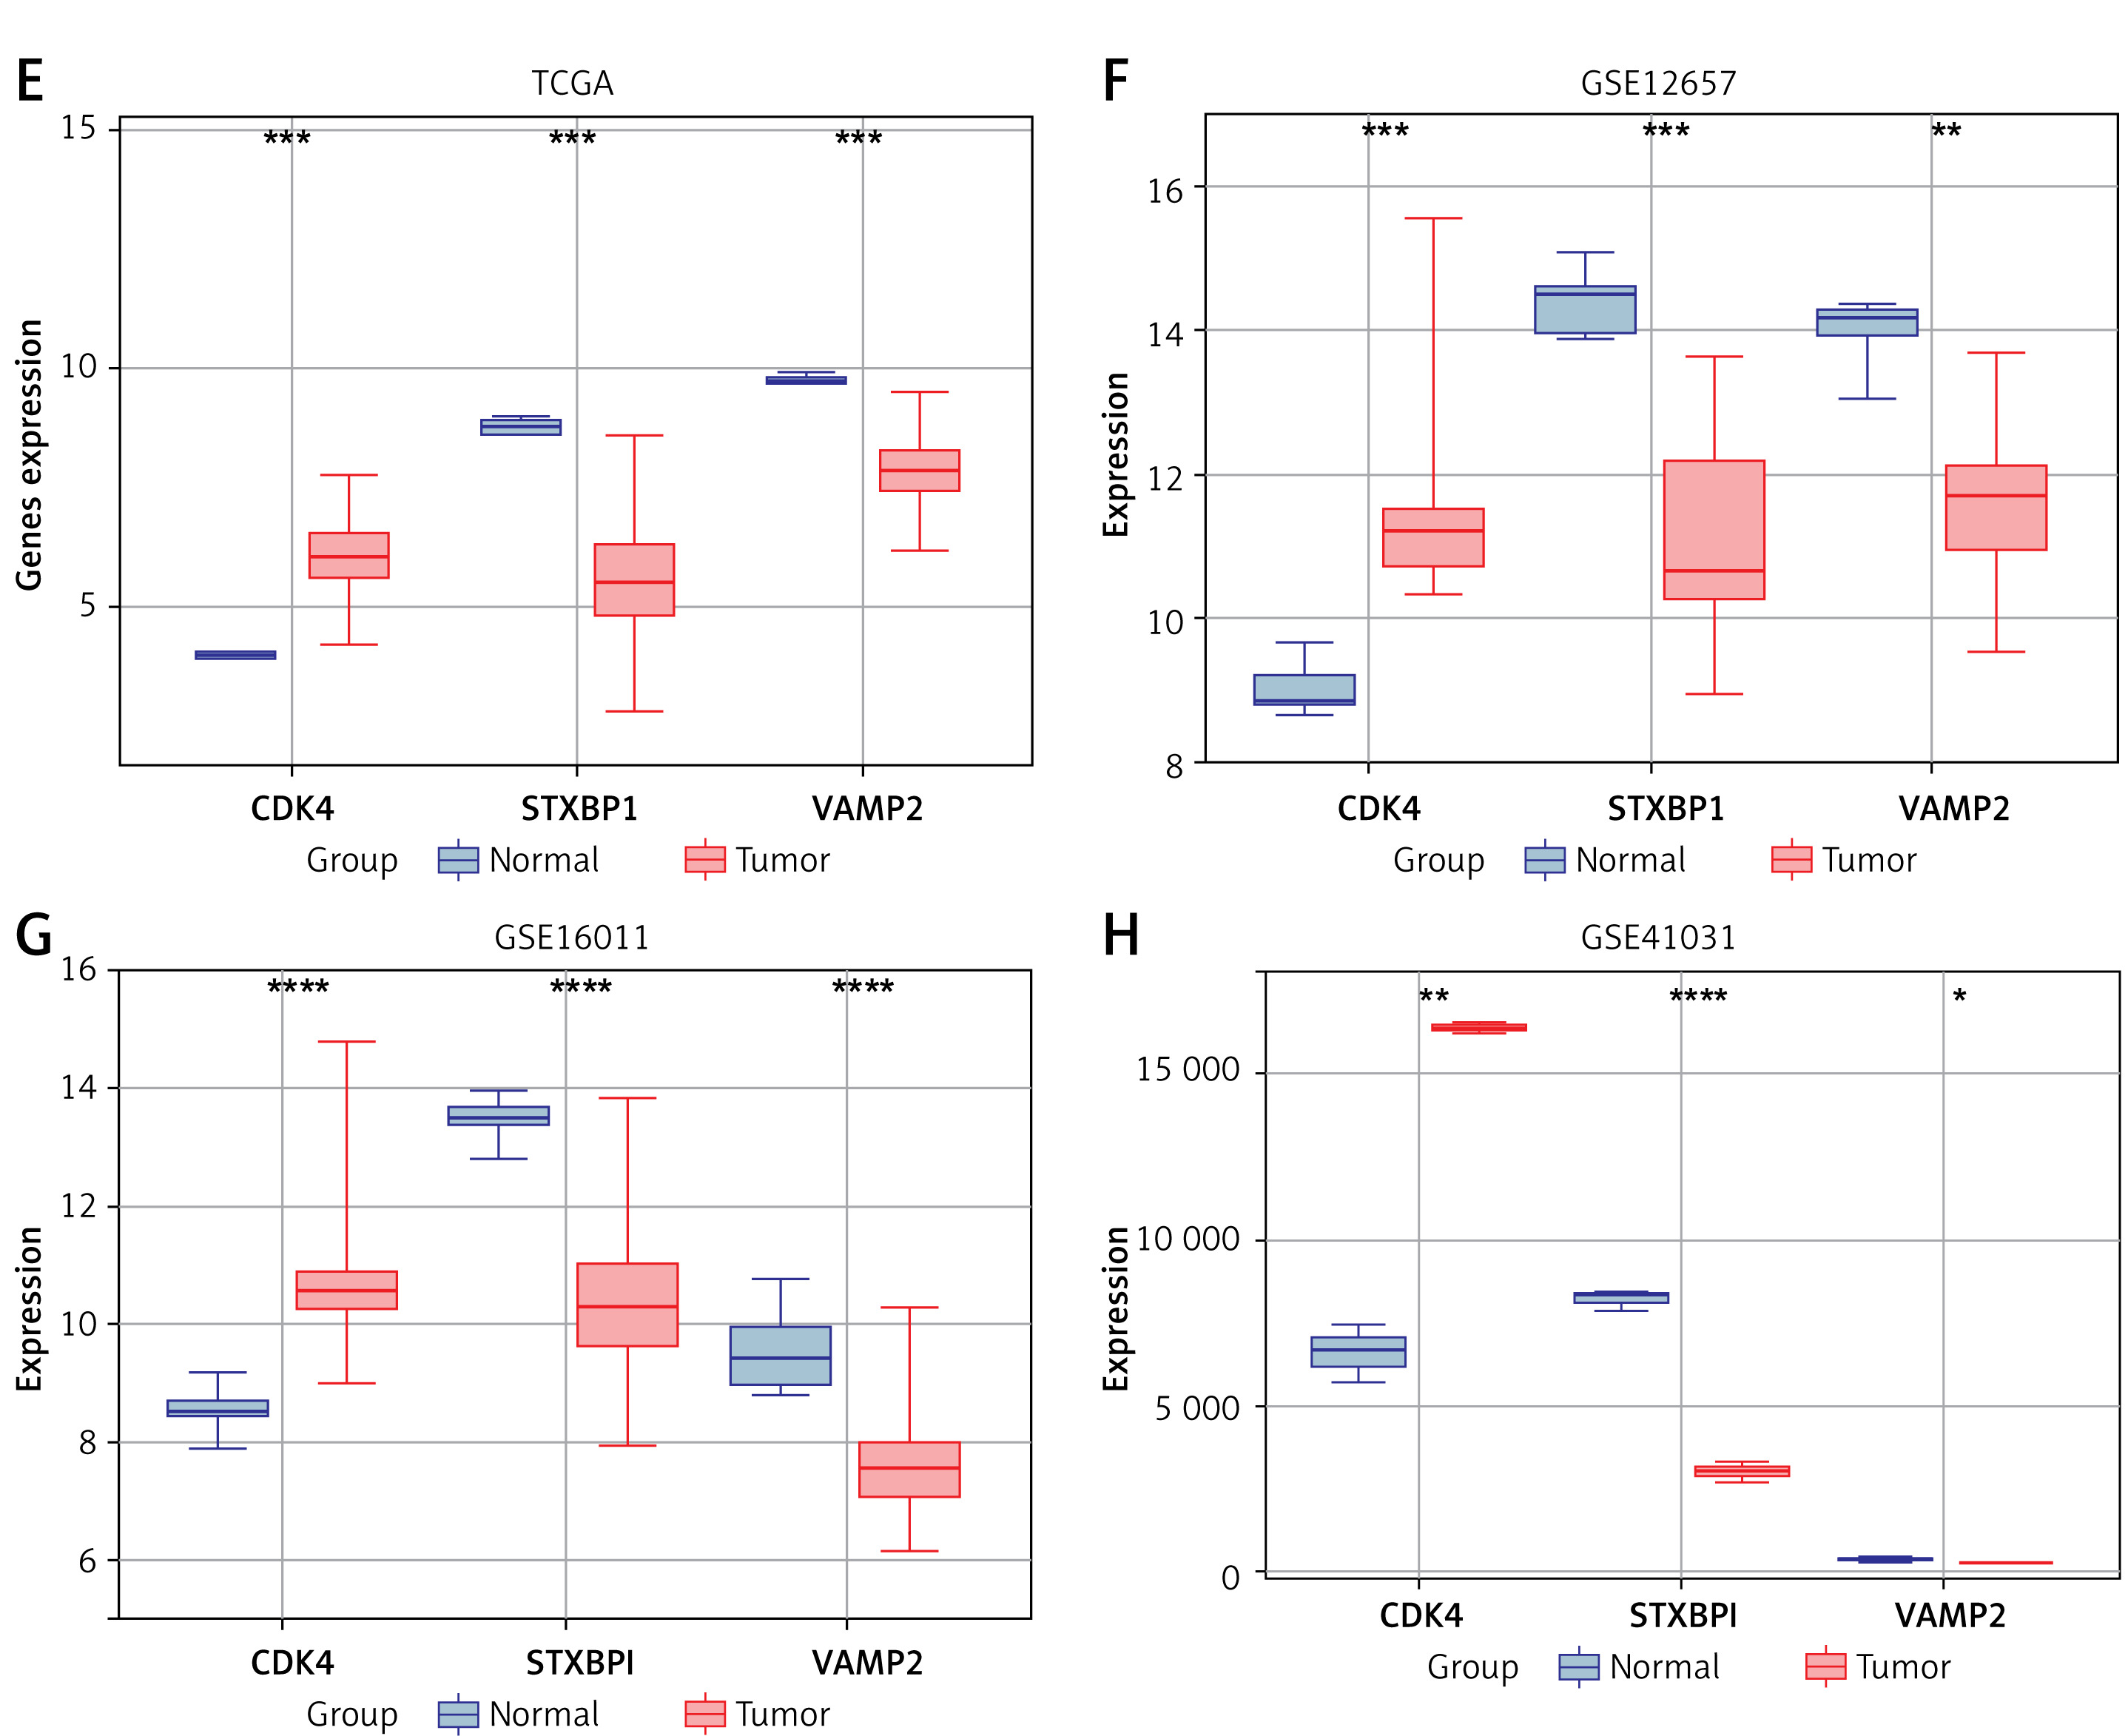
Key genes and clinical factors (age, grade stage) in gliomas were assessed for their predictive value using univariate and multivariate Cox regression models. Four significant prognostic factors were identified: CDK4, STXBP1, VAMP2, and age (Figures 1 A, B). Nomogram analysis revealed their significant capacity for prediction for patients’ 1-year, 3-year, and 5-year survival rates, corroborated by calibration curve results (Figures 1 C, D). Expression analysis indicated significant upregulation of CDK4 and downregulation of STXBP1 and VAMP2 in tumor samples across TCGA-glioma, GSE12657, GSE16011, and GSE41031 datasets (Figures 1 E–H). A study has demonstrated that STXBP1 is associated with the prognosis of GBM. Therefore, STXBP1 was chosen as a hub gene for further investigation in this research due to its prognostic significance and differential expression.
Figure 1
Identification of hub genes in glioma risk model analysis. A, B – Univariate/multifactorial Cox regression analysis on signature genes and clinical prognostic variables C – Nomograms of key prognostic variables and C-index were used to evaluate the predictive power of the model. D – The dashed line indicates the ideal calibration curve of the nomogram with the red dash, purple dash, and yellow dash for the 1-year, 3-year, and 5-year predictions, respectively E–H – Expression of prognostic significant genes CDK4, STXBP1, and VAMP2 in tumor samples and normal of The Cancer Genome Atlas (TCGA)-glioma, GSE12657, GSE16011, and GSE41031 datasets, respectively. Among them, purple represents normal samples and red represents tumor samples
*p < 0.05, **p < 0.01, ***p < 0.001, ****p < 0.0001.
Knockdown of STXBP1 enhances the proliferation, migration, and invasion abilities of U251 and U87 cells
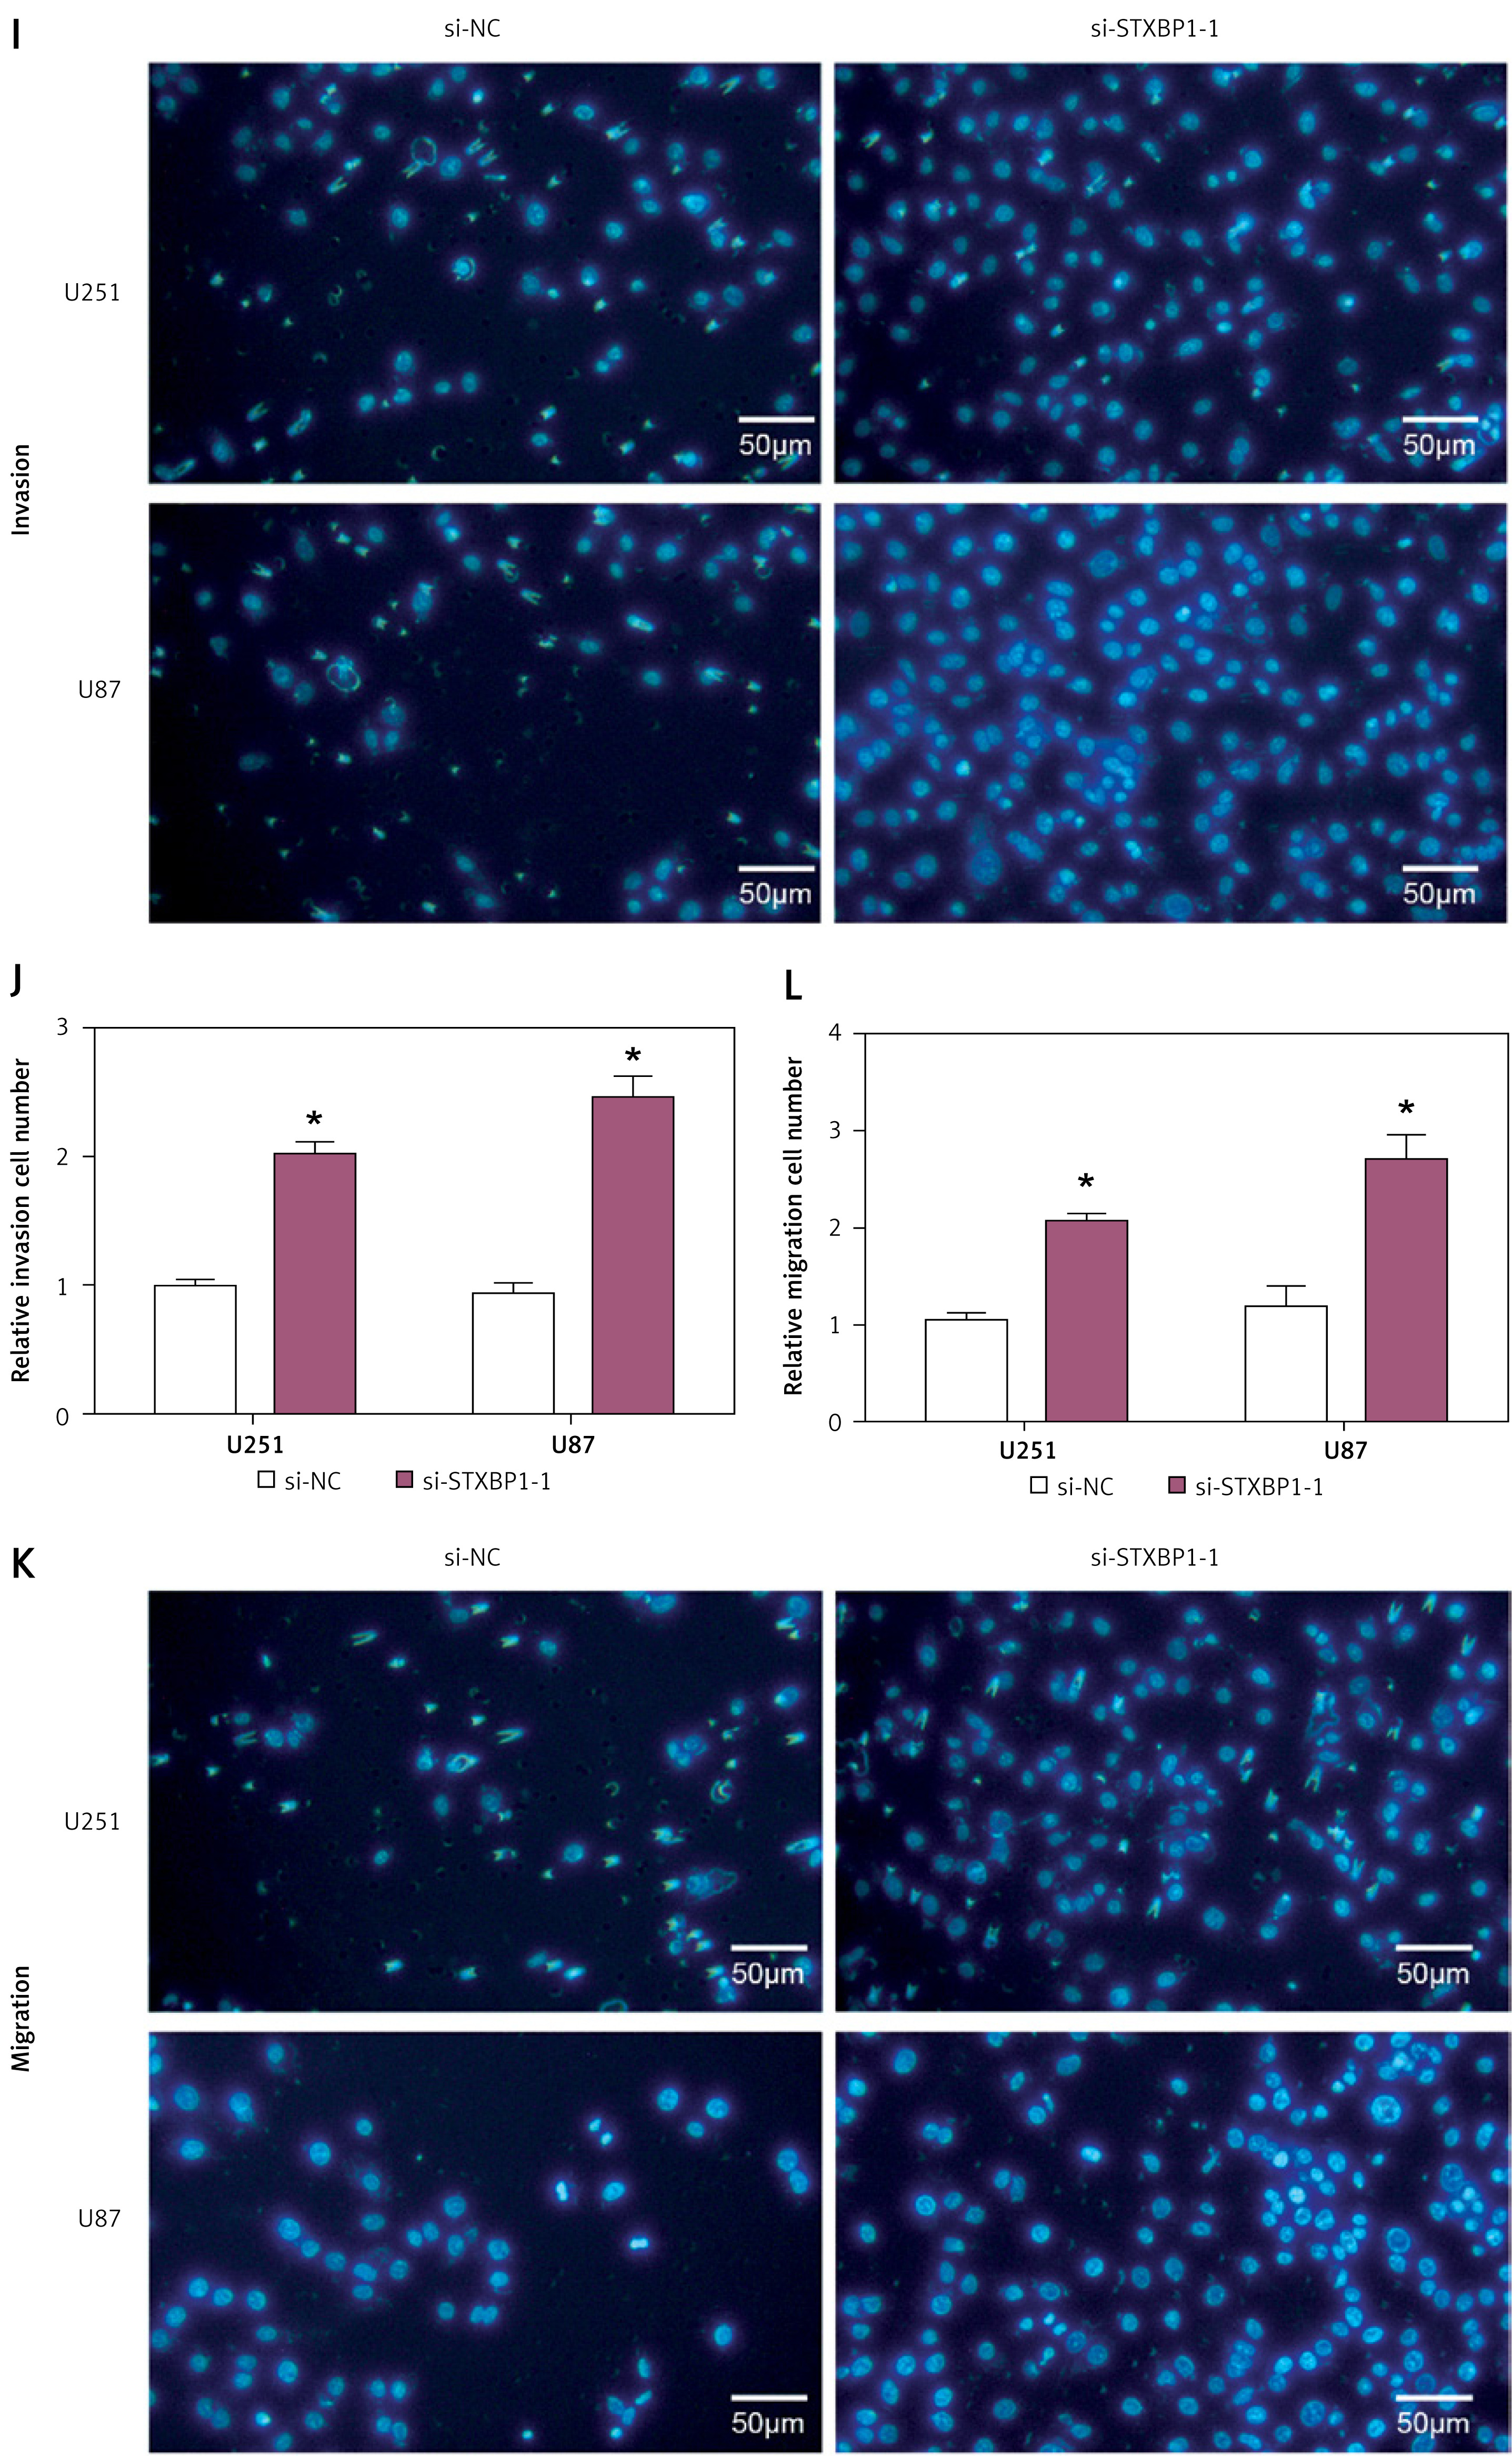
To assess the role of STXBP1 in glioma, we assessed its level in glioma cell lines and HEB cells. qRT-PCR analysis revealed significantly lower STXBP1 mRNA levels in glioma cell lines (U251, SW1783, and U87) in contrast to HEB cells (Figure 2 A). WB analysis confirmed reduced STXBP1 protein levels in these glioma cell lines (Figures 2 B, C). We then performed knockdown experiments using three different siRNAs targeting STXBP1 (si-STXBP1 -1, si-STXBP1 -2, and si-STXBP1 -3) in U87 and U251 cells. It was subsequently proven that si-STXBP1 -1 and si-STXBP1 -2 had significant knockout efficiency, among which si-STXBP1 -1 showed the highest knockout efficiency and was selected for further experiments (Figures 2 D–F). Functional assays including CCK-8 and transwell assays indicated that si-STXBP1 -1 induced increased invasion, migration, and proliferation capabilities in U251 and U87 cells (Figures 2 G–L).
Figure 2
Knockdown of STXBP1 enhances the proliferation, migration, and invasion abilities of U251 and U87 cells. A–C – quantitative real-time polymerase chain reaction (qRT-PCR) and Western blot (WB) detected the expression of STXBP1 in normal brain glial cells (HEB) and brain glioma cells (U251, SW1783, and U87). D–F – STXBP1 was knocked down, and the knockdown efficiency of si-STXBP1-1, si-STXBP1-2, and si-STXBP1-3 was detected by qRT-PCR and WB. G, H – Cell Counting Kit-8 (CCK-8) detects the effect of si-STXBP1-1 on U251 and U87 cell viability I–L – Transwell was used to detect the effect of si-STXBP1-1 on the migration and invasion abilities of U251, SW1783, and U87 cells
*p < 0.05. Scale bar: 50 μm.
Knockdown of STXBP1 disrupts cell cycle distribution and inhibits apoptosis in glioma cells
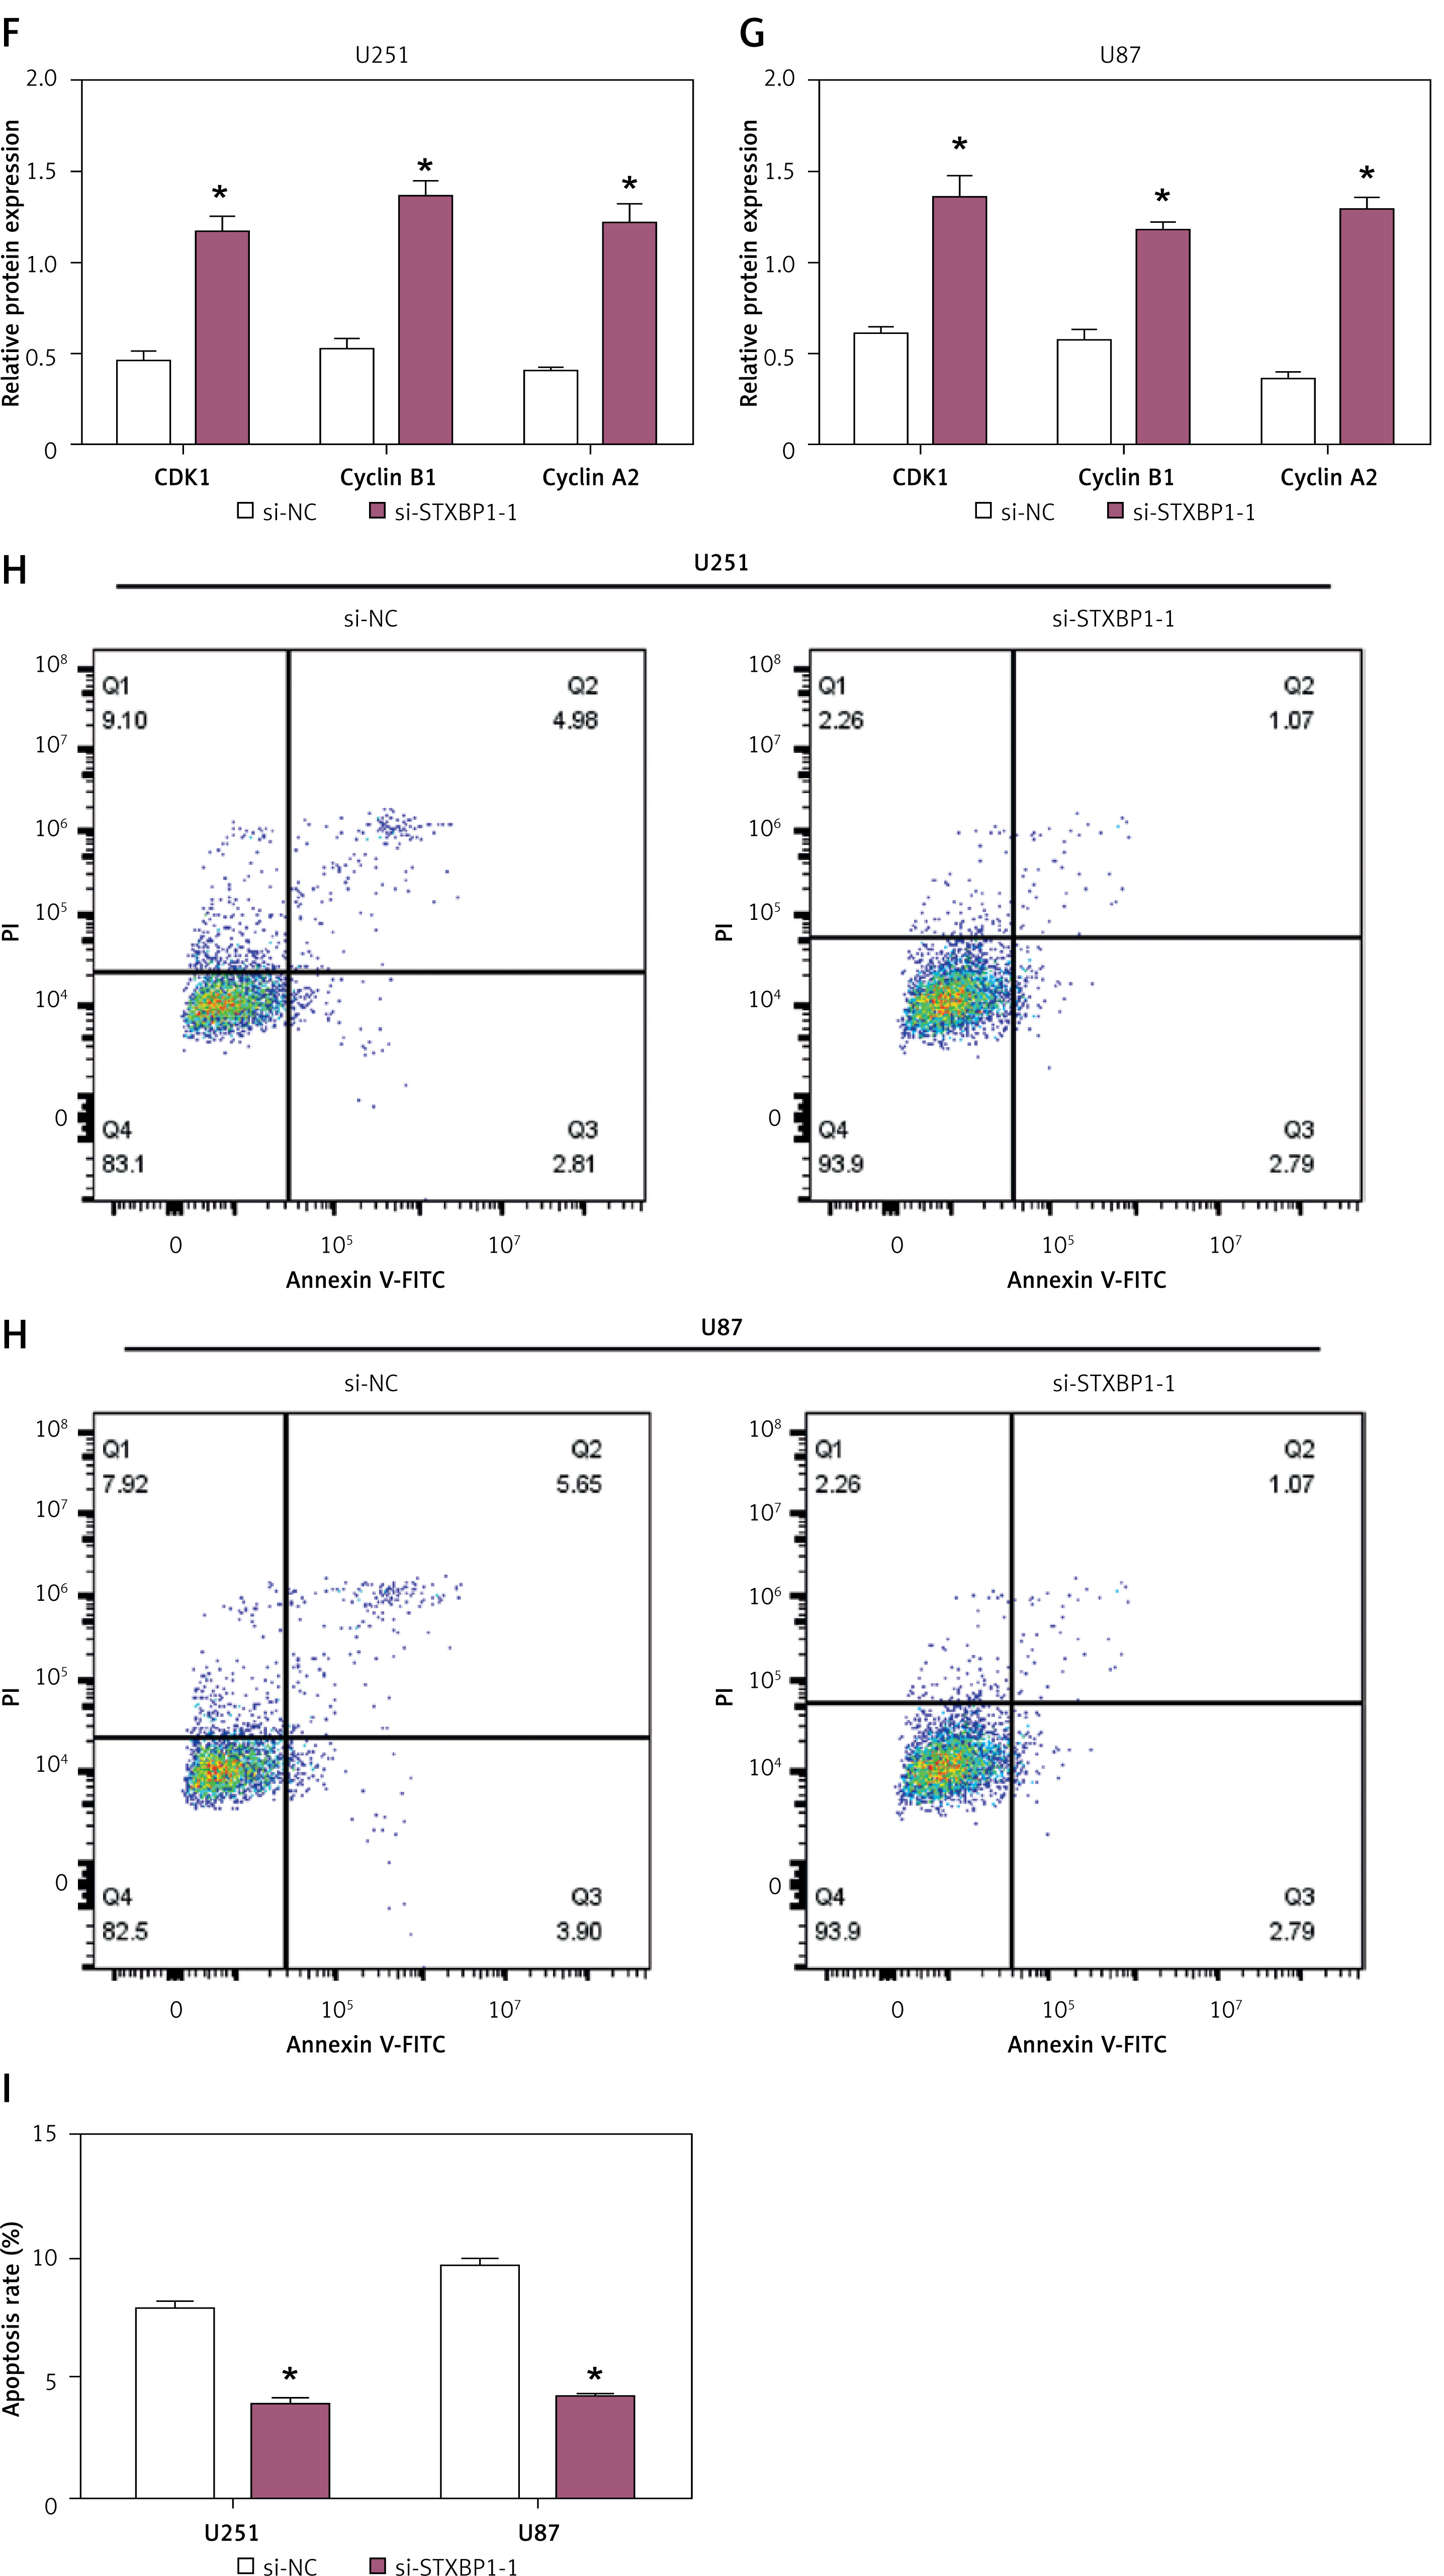
Flow cytometry analysis was performed to assess the effect of STXBP1 knockdown on cell cycle distribution in U251 and U87 glioma cells. Knockdown of STXBP1 led to a significant rise in the percentage of G1 phase cells and a comparable decline in the S phase compared to control cells (si-NC) in both U251 and U87 cells (Figures 3 A–D). WB analysis assessed the expression of cell cycle-related proteins cyclin B1, CDK1, and cyclin A2. The findings demonstrated that STXBP1 knockdown notably upregulated the levels of these proteins in both U87 and U251 cells (Figures 3 E–G). Additionally, flow cytometry was employed to measure apoptosis rates in U87 and U251 cells following STXBP1 knockdown. The results indicated a significant decrease in apoptosis rates in STXBP1 knockdown cells in contrast to control cells (Figures 3 H, I).
Figure 3
Effects of STXBP1 knockdown on cell cycle progression and apoptosis in glioma cells. A–D – Flow cytometry was used to detect the effect of si-STXBP1 -1 on the cell cycle of U251, SW1783, and U87. E – Western blot (WB) detected the effect of si-STXBP1-1 on cell cycle proteins in U251 and U87 cells. Cyclins include CDK-1, cyclin B1, and cyclin A2 F–G – Western blot (WB) detected the effect of si-STXBP1-1 on cell cycle proteins in U251 and U87 cells. Cyclins include CDK-1, cyclin B1, and cyclin A2. H, I – Flow cytometry was used to detect the effect of knocking down STXBP1 on the apoptosis of U251 and U87 cells
*p < 0.05.
Ferroptosis markers were significantly expressed in U251 and U87 cells
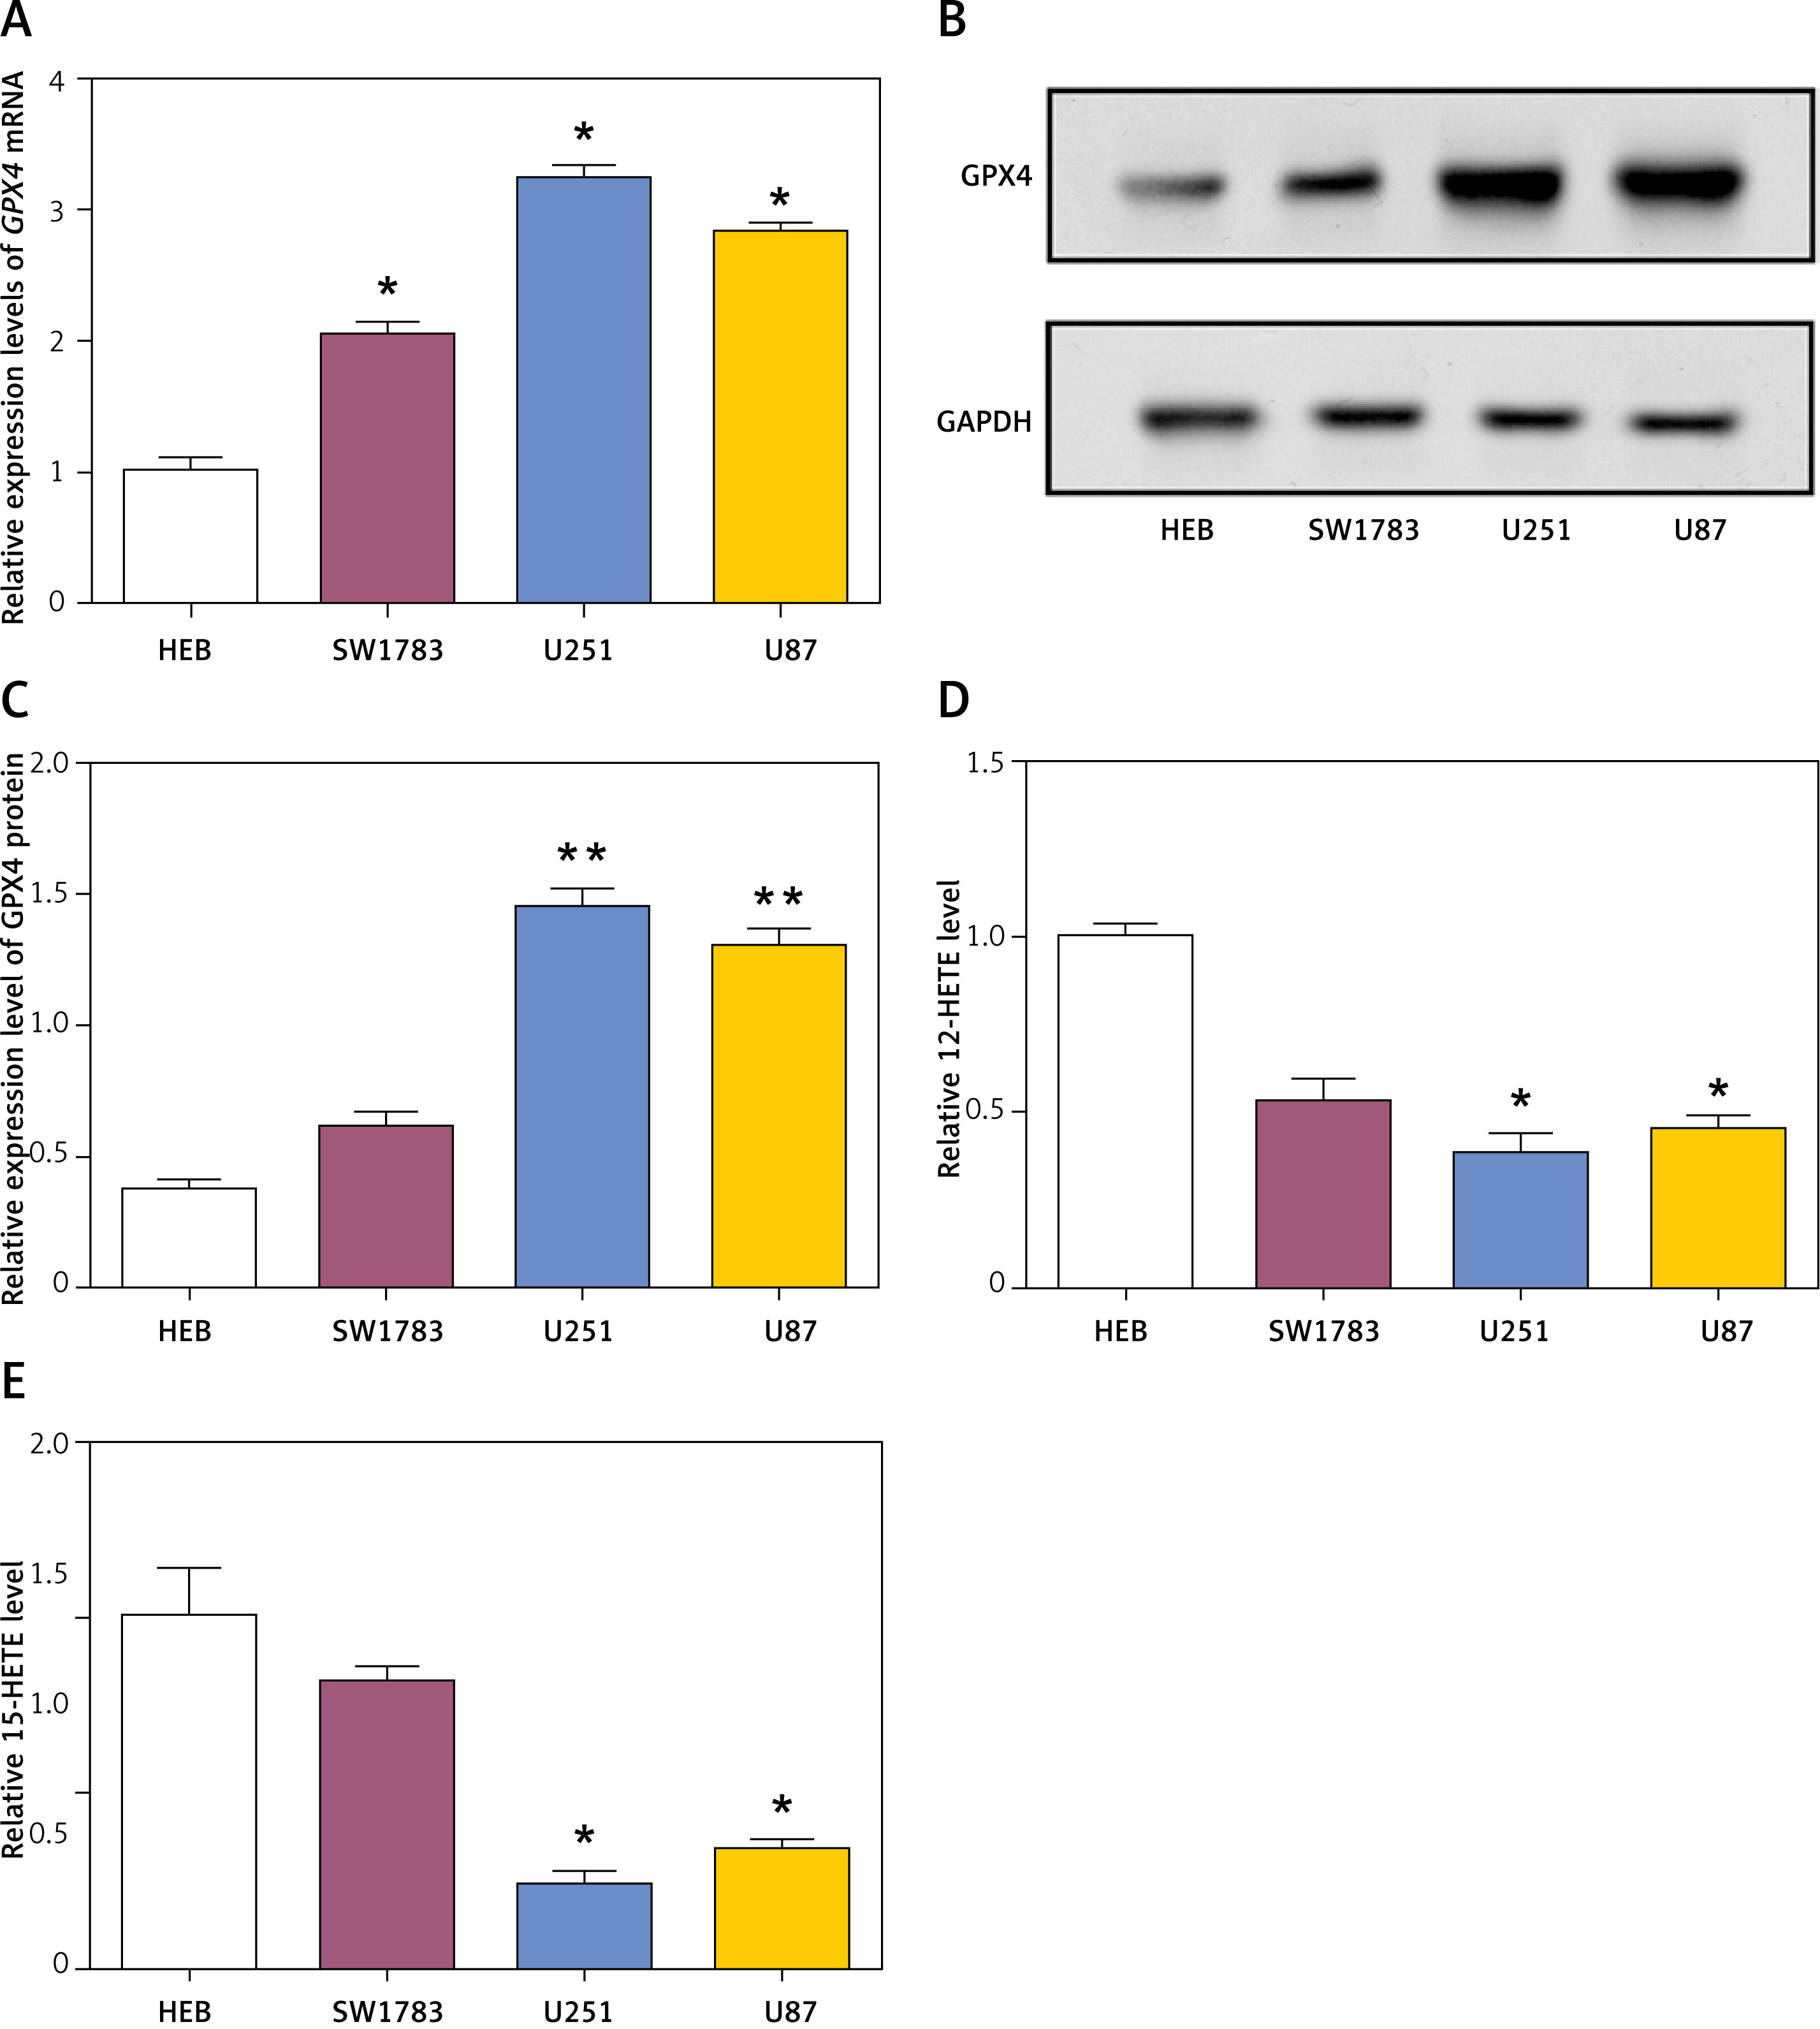
The levels of GPX4, a key regulator of ferroptosis, were assessed in glioma cell lines (SW1783, U251, and U87) and human embryonic brain (HEB) cells. qRT-PCR analysis revealed significantly higher GPX4 mRNA levels in glioma cell lines compared to HEB cells (Figure 4 A). WB analysis confirmed the upregulation of GPX4 protein in glioma cell lines (Figures 4 B, C). Additionally, the levels of 12-HETE and 15-HETE, markers of lipid peroxidation, were measured in glioma cell lines and HEB cells utilizing 12/15 HETE ELISA kits (ab133034/ab133035, Abcam). The results indicated significantly lower levels of 15-HETE and 12-HETE in glioma cell lines compared to HEB cells (Figures 4 D, E).
Figure 4
Expression of GPX4 and levels of 12-HETE and 15-HETE in glioma cells. A – Relative expression levels of GPX4 mRNA in human embryonic brain (HEB) cells and glioma cell lines (SW1783, U251, U87) as determined by quantitative real-time polymerase chain reaction (qRT-PCR). B, C – Western blot (WB) analysis of GPX4 protein levels in HEB cells and glioma cell lines (SW1783, U251, U87). D – The 12-HETE kit detects 12-HETE levels in HEB cells and glioma cells (U251, SW1783 and U87). E – The 15-HETE kit detects 15-HETE levels in HEB cells and glioma cells (U251, SW1783 and U87)
*p < 0.05, **p < 0.01.
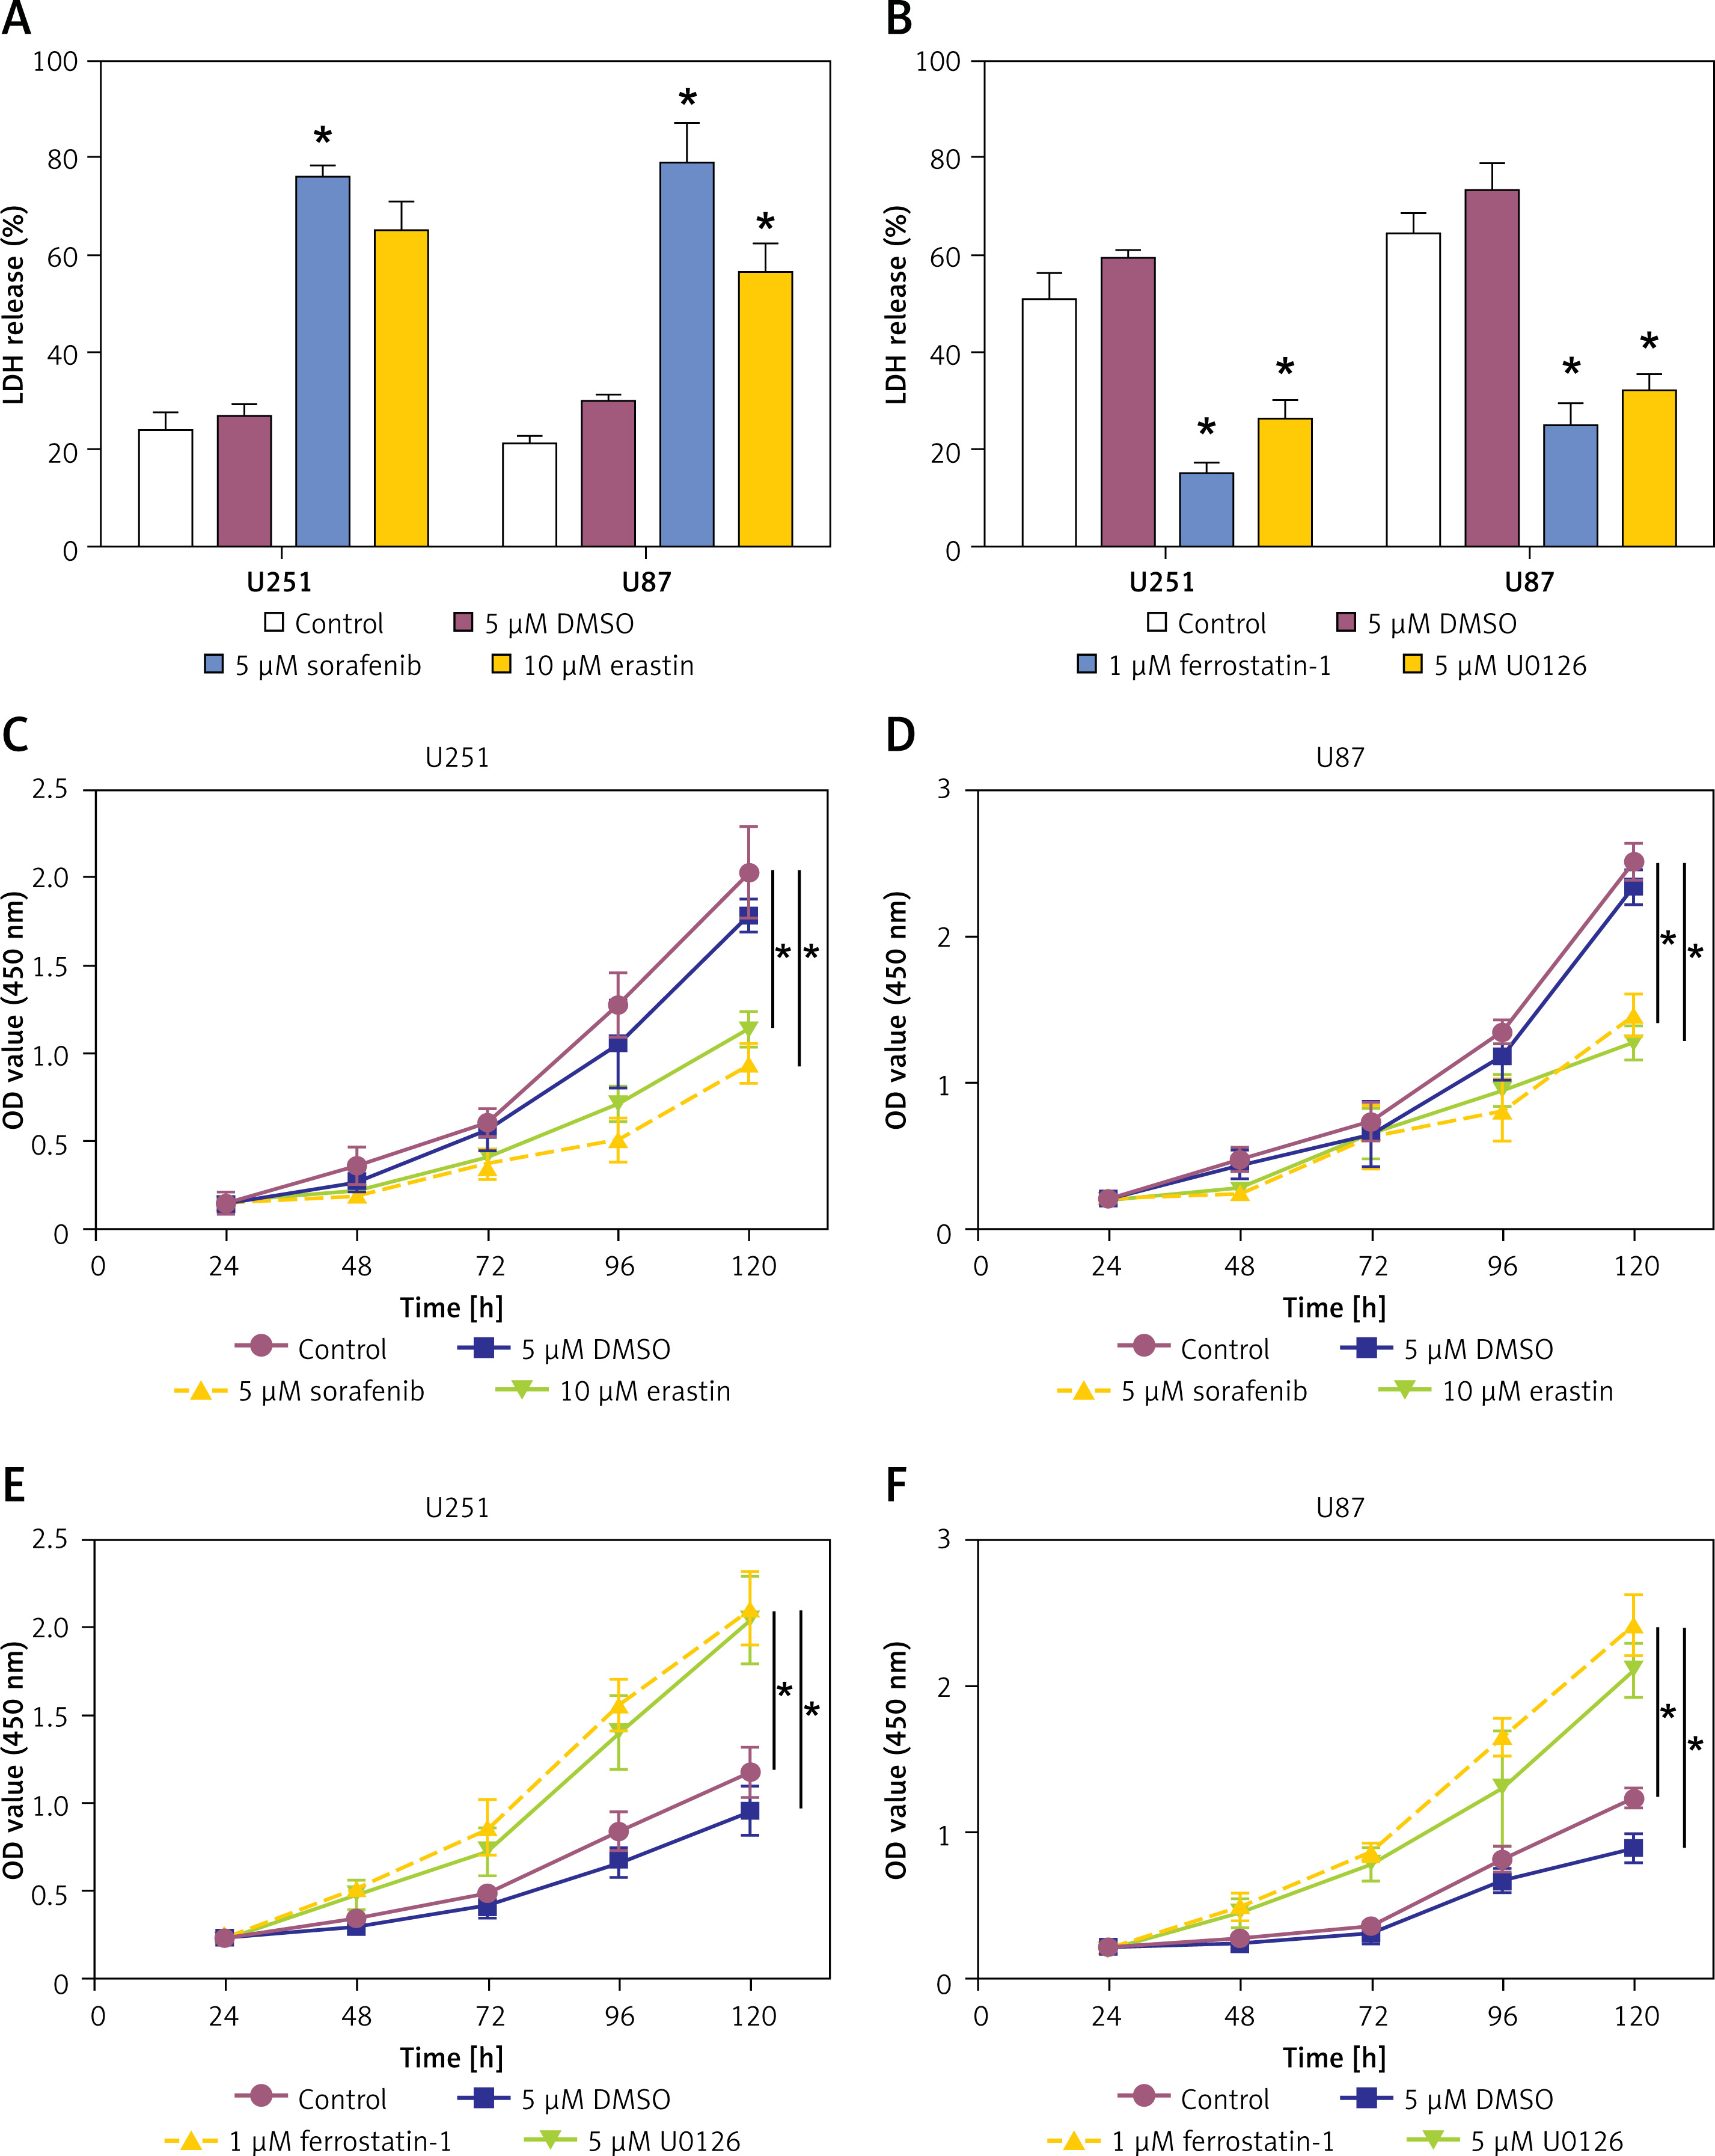
Effects of ferroptosis inducers and inhibitors on LDH release and cell viability in glioma cells
To investigate the results of inhibitors and inducers of ferroptosis on glioma cells, we assessed LDH release and cell viability in U251 and U87 cell lines. Therapy with ferroptosis inducers (5 μM sorafenib and 10 μM erastin) significantly increased LDH release in both U251 and U87 cells compared to the control (Figure 5 A). Conversely, application of ferroptosis inhibitors (1 μM ferrostatin-1 and 5 μM U0126) led to a reduction of LDH release compared to the DMSO control (Figure 5 B). Using the CCK-8 assay to assess cell viability, the administration of ferroptosis inducers (5 μM sorafenib and 10 μM erastin) significantly decreased cell viability in both U251 and U87 cells compared to the control (Figures 5 C, D). In contrast, use of ferroptosis inhibitors (1 μM ferrostatin-1 and 5 μM U0126) significantly increased cell viability over the same period (Figures 5 E, F). These findings suggest that inducers of ferroptosis promote cytotoxicity and reduce cell viability in glioma cells, while ferroptosis inhibitors have the opposite effect, highlighting the potential medicinal uses of ferroptosis in glioma treatment.
Figure 5
Effects of ferroptosis inducers and inhibitors on lactate dehydrogenase (LDH) release and cell viability in glioma cells. A – The LDH detection kit detects the LDH release level of glioma cells after treatment with the ferroptosis inducer sorafenib (5 μM) or erastin (10 μM). B – The LDH detection kit detects the LDH release level of glioma cells after treatment with ferroptosis inhibitor ferrostatin-1 (1 μM) or U0126 (5 μM). C, D – Cell viability of glioma cells treated with control, 5 μM DMSO, 5 μM sorafenib, or 10 μM erastin. E, F – Cell viability of glioma cells treated with control, 5 μM DMSO, 1 μM ferrostatin-1, or 5 μM U0126
*p < 0.05.
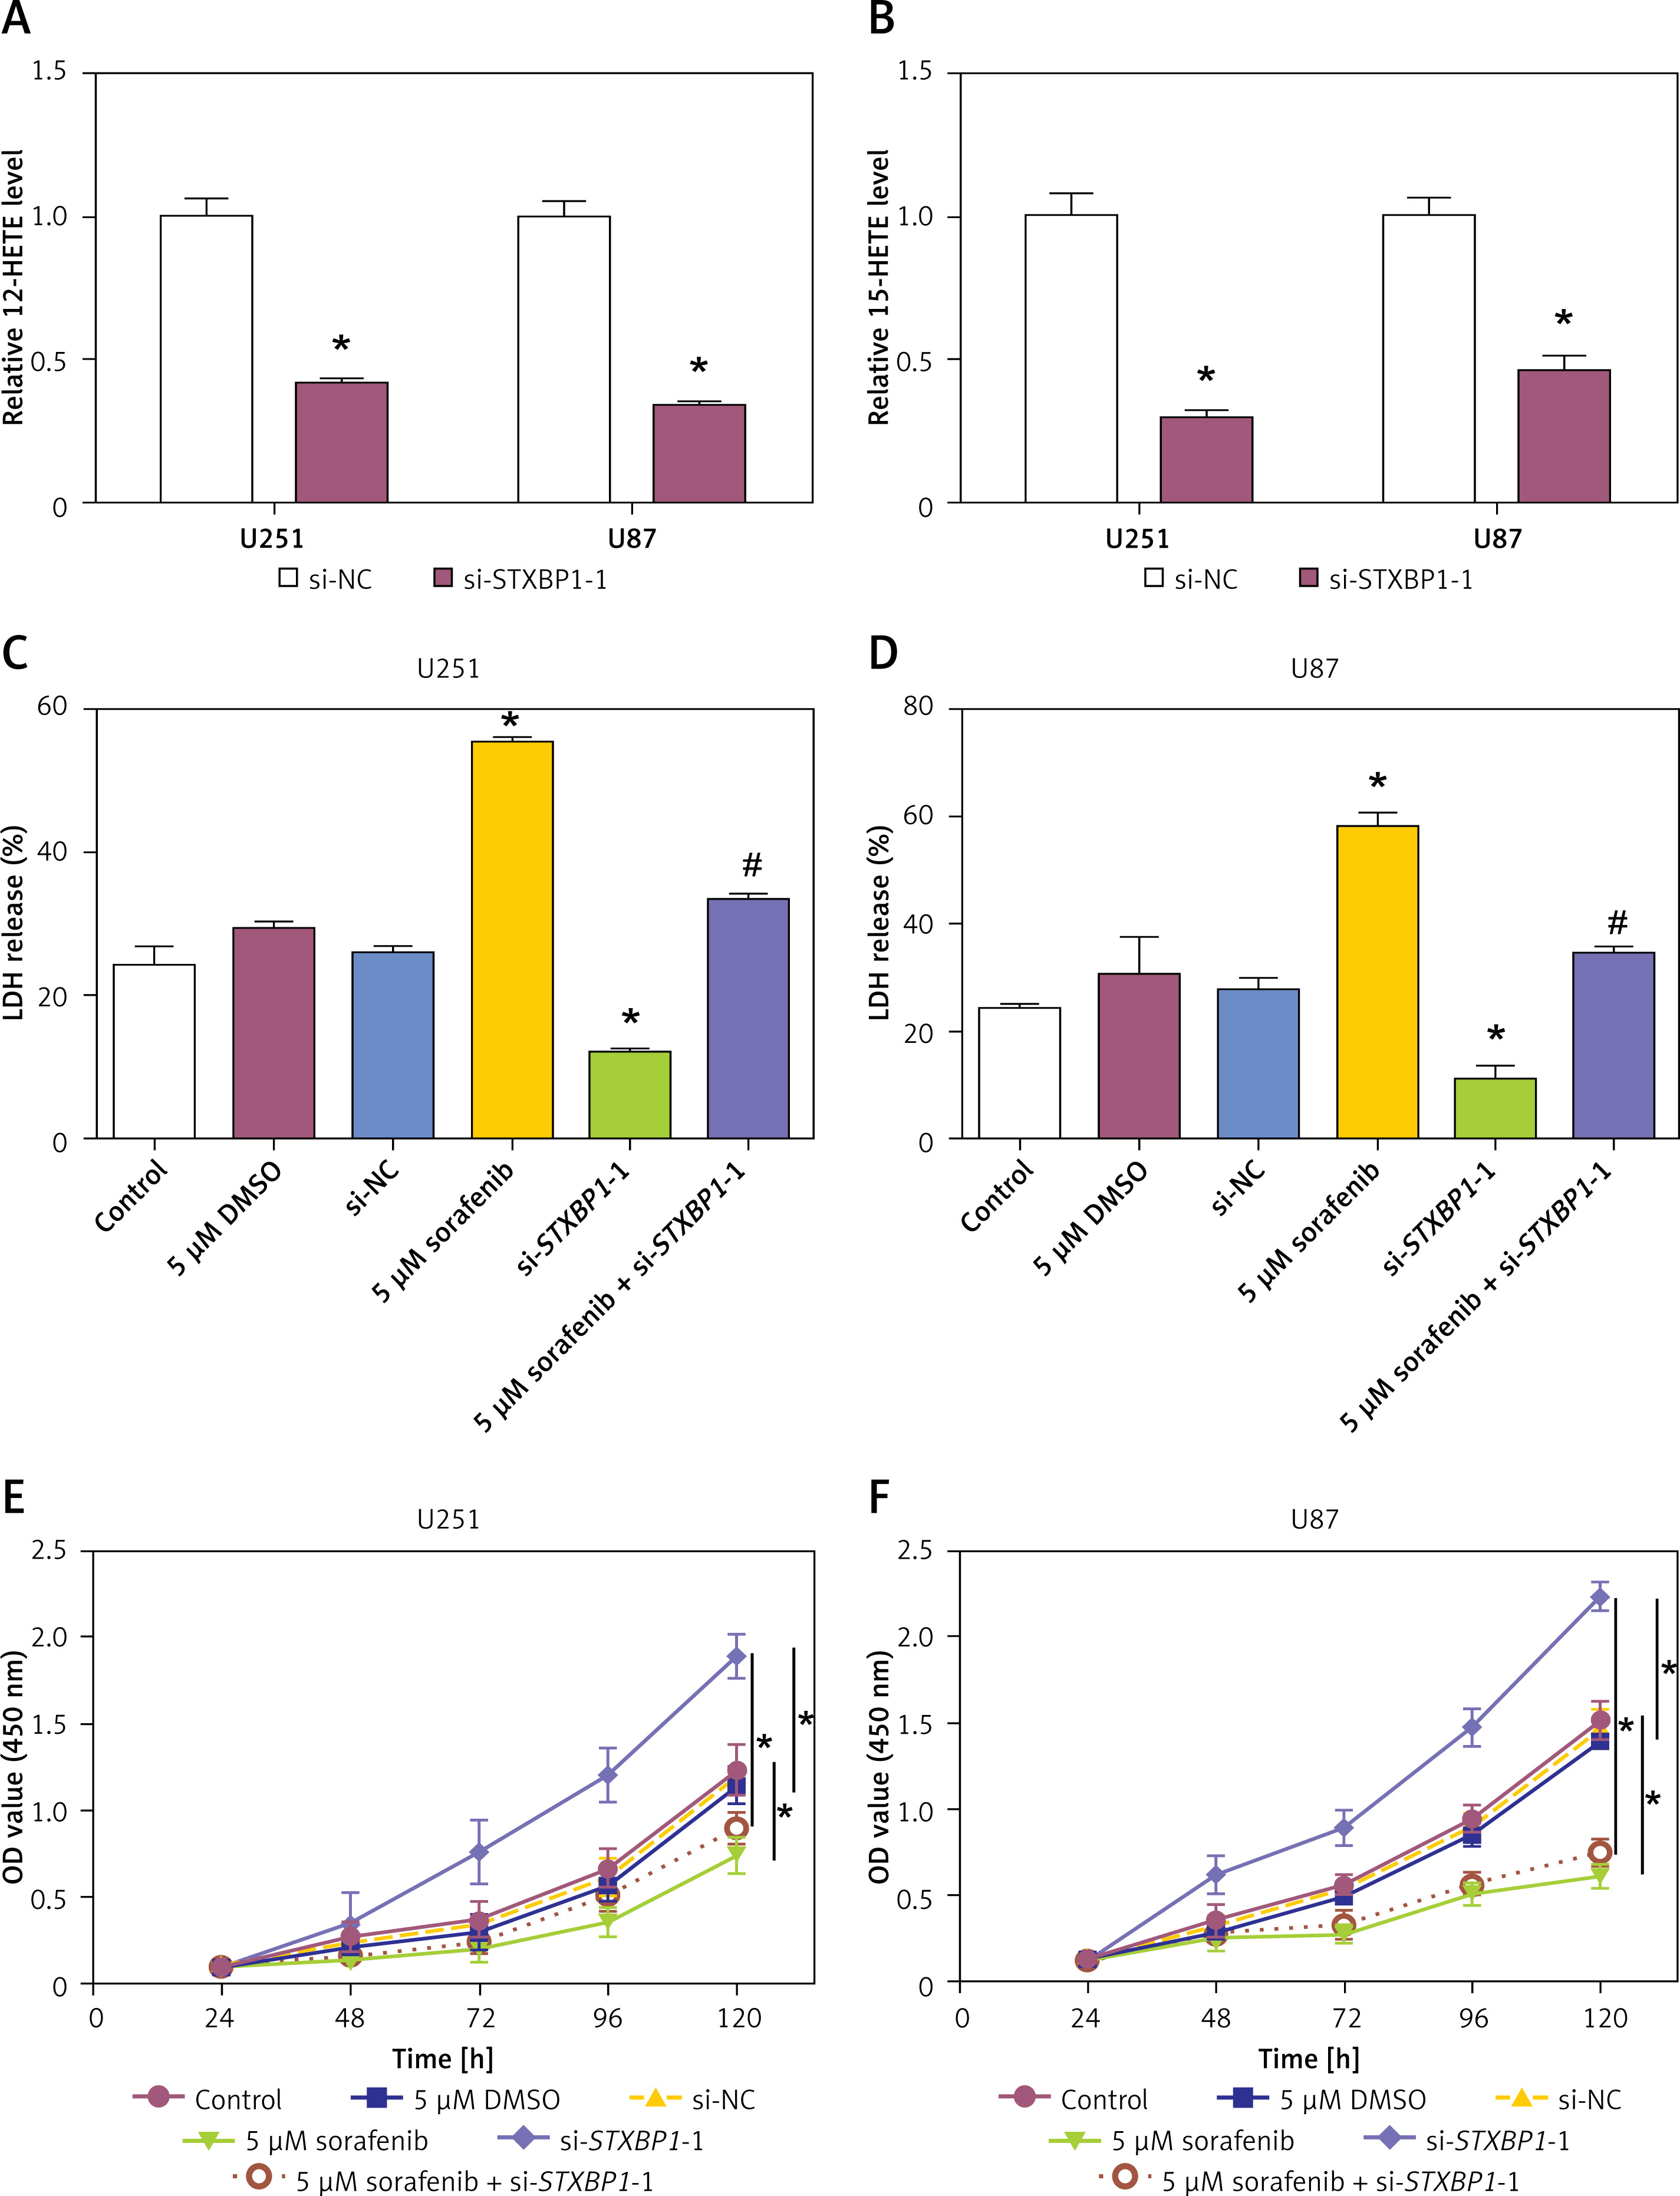
Knockdown of STXBP1 inhibits ferroptosis in glioma cells to reduce proliferation
To explore the impact of STXBP1 knockdown on lipid peroxidation and cell viability, we measured the expression of 12-HETE and 15-HETE, LDH release, and cell viability in glioma cell lines. Knockdown of STXBP1 significantly reduced the expression of both 15-HETE and 12-HETE compared to the control group (Figures 6 A, B). LDH release assays revealed that STXBP1 knockdown significantly reduced LDH release in both U251 and U87 cells, indicating enhanced cell damage. However, when combined with sorafenib treatment, STXBP1 knockdown partially rescued the LDH release induced by sorafenib in both U251 and U87 cells (Figures 6 C, D). CCK-8 assay showed that knockdown of STXBP1 increased cell viability compared with the control group. Furthermore, STXBP1 knockdown notably attenuated the sorafenib-induced reduction in cell viability in U251 and U87 cells when combined with sorafenib (Figures 6 E, F). These results indicate that STXBP1 knockdown reduced 12-HETE and 15-HETE levels, suppressed lipid peroxidation, and inhibited ferroptosis, thereby enhancing glioma cell viability, highlighting its potential role in regulating ferroptosis and cell survival.
Figure 6
Effects of STXBP1 knockdown and ferroptosis induction on lipid peroxidation, lactate dehydrogenase (LDH) release, and cell viability in glioma cells. A, B – 12-HETE kit and 15-HETE kit detect expression in U251 and U87 cells after knockdown of STXBP1. C, D – The LDH kit detects changes in LDH release in U251 and U87 cells. The groups are as follows: control; 5 μM dimethyl sulfoxide (DMSO); small interfering-negative control (si-NC); 5 μM sorafenib; si-STXBP1 -1; 5 μM sorafenib + si-STXBP1 -1. E, F – Cell Counting Kit-8 (CCK-8) detects changes in glioma cell viability. The groups are as follows: control; 5 μM DMSO; si-NC; 5 μM sorafenib; si-STXBP1 -1; 5 μM sorafenib + si-STXBP1 -1
*p < 0.05 vs. control or 5 μM DMSO or si-NC, #p < 0.05 vs. 5 μM sorafenib or si-STXBP1-1.
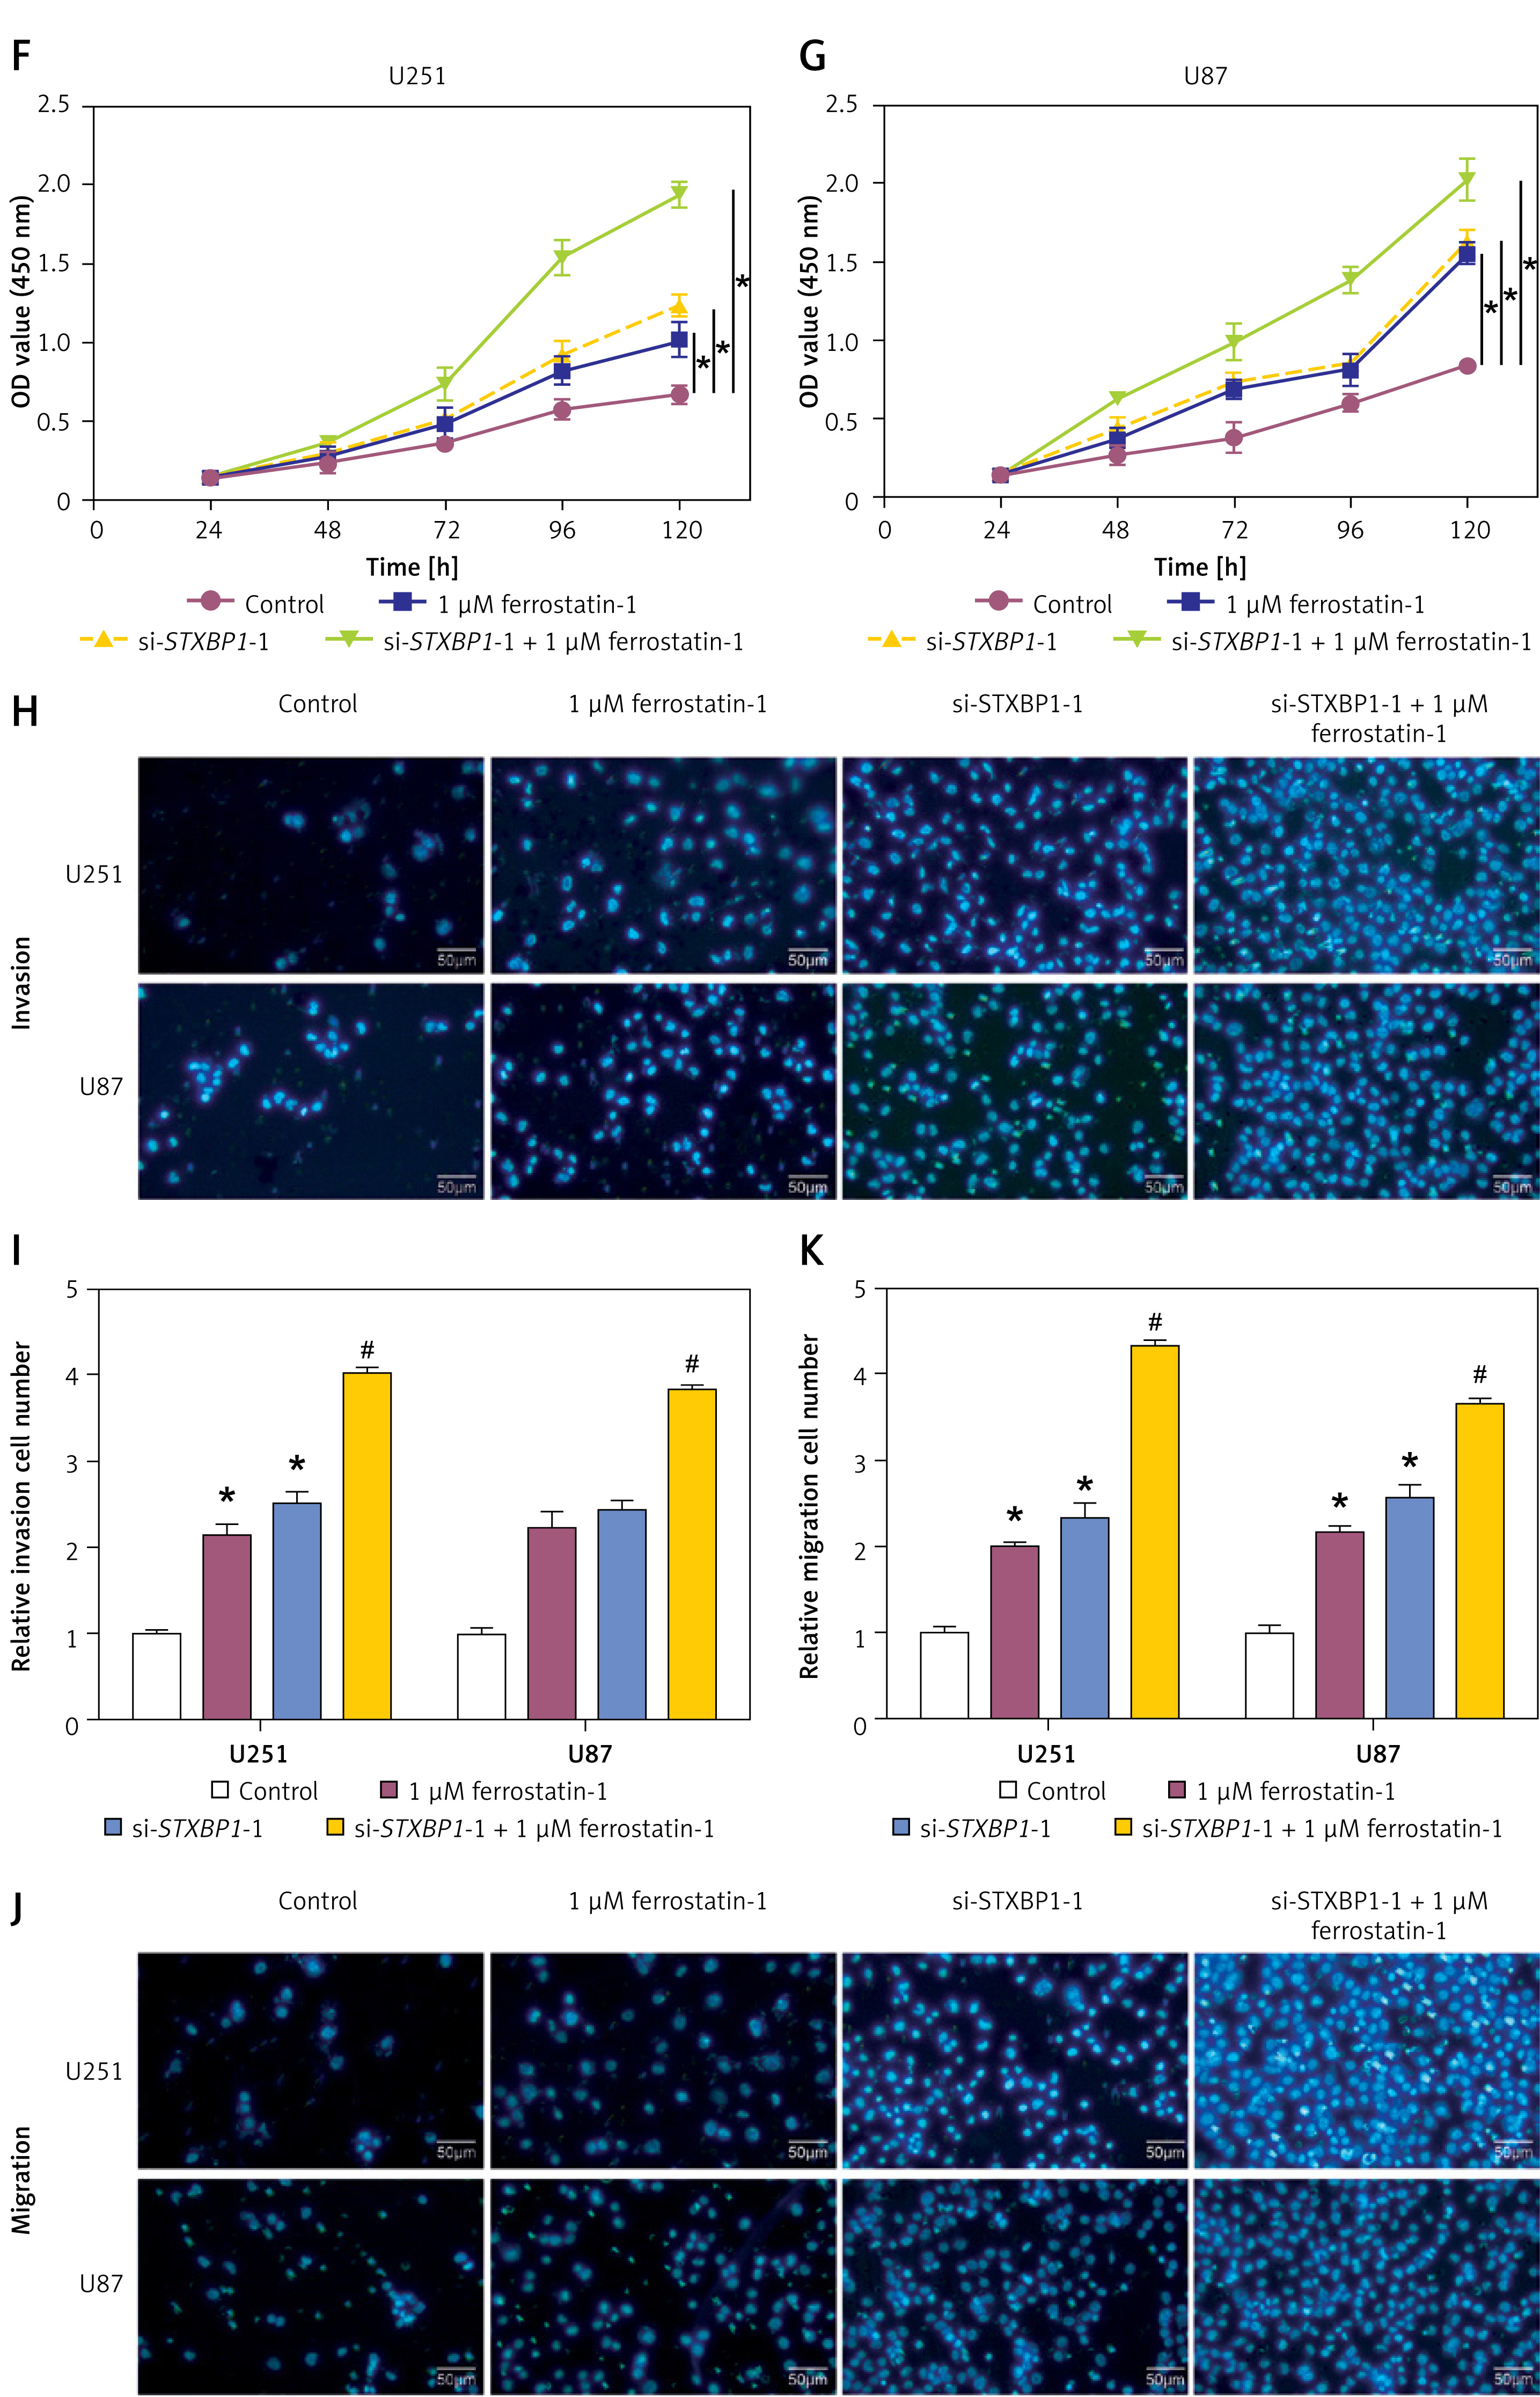
STXBP1 regulates the EMT of ferroptosis-dependent tumor cells
N-cadherin, vimentin, and E-cadherin are proteins associated with EMT. qRT-PCR and WB analyses revealed that treatment with 1 μM ferrostatin-1 induced a decrease in N-cadherin and vimentin levels and a significant increase in E-cadherin levels in glioma cells. Conversely, the addition of si-STXBP1 -1 reversed these changes (Figures 7 A–E). Furthermore, CCK-8 and transwell assays demonstrated that treatment with 1 μM ferrostatin-1 improved the viability, invasion, and migration capabilities of glioma cells, while the addition of si-STXBP1 -1 further augmented these cellular functions (Figures 7 F–K). These results indicate that STXBP1 knockdown promotes EMT and enhances the aggressive behavior of glioma cells in a ferroptosis-dependent manner, suggesting its pivotal role in the development of gliomas and as a target for treatment.
Figure 7
Effects of STXBP1 knockdown and ferrostatin-1 treatment on EMT markers, cell viability, invasion, and migration of glioma cells. A, B – quantitative real-time polymerase chain reaction (qRT-PCR) detected the expression of EMT-related markers (E-cadherin, N-cadherin, and vimentin) after knocking down STXBP1 and combining ferroptosis inhibitor ferrostatin-1 (1 μM) in glioma cells. C–E – Western blot (WB) detected the expression of EMT-related markers (E-cadherin, N-cadherin, and vimentin) after knocking down STXBP1 and combining ferroptosis inhibitor ferrostatin-1 (1 μM) in glioma cells F, G – Cell viability of glioma cells treated with control, 1 μM ferrostatin-1, si-STXBP1 -1, or a combination of si-STXBP1 -1 and 1 μM ferrostatin-1. H–K – Transwell detects changes in the migration and invasion ability of glioma cells. The groups are as follows: control; 1 μM ferrostatin-1; si-STXBP1 -1; 1 μM ferrostatin-1 + si-STXBP1 -1
*p < 0.05 vs. control, #p < 0.05 vs. si-STXBP1-1 or 1 μM ferrostatin-1.
Discussion
Gliomas are extremely aggressive brain tumors that have a dismal prognosis and few available treatments [20]. These tumors, derived from glial cells, exhibit distinct histological and molecular characteristics. Despite advances in standard treatments such as chemotherapy, radiation therapy, and surgical resection, the survival rates for individuals with glioma, particularly those with high-grade tumors, remain dismal [21]. Therefore, developing novel treatment approaches requires a knowledge of the molecular processes underlying the growth of gliomas. For example, a study found that isoliquiritigenin can inhibit the tumorigenesis of glioma by suppressing circ0030018 via the miR-1236/HER2 signaling pathway, and circ0030018 can serve as a potential biomarker or therapeutic target for glioma [22]. Yan et al. discovered that METTL3 promotes HNRNPH1-mediated selective splicing of LINC00475, thereby facilitating glioma progression through mitochondrial fission. Targeting the selective splicing of LINC00475 and m6A modification can be considered a therapeutic strategy against glioma [23]. From the TCGA-glioma, GSE12657, GSE16011, and GSE41031 datasets, we identified upregulated and downregulated DEGs. Cross-analysis revealed overlapping DEGs, followed by PPI network analysis, OS prognosis assessment, advanced prognostic analysis, and expression analysis. Notably, STXBP1 emerged as a hub gene. Previous studies by Zhen et al. and Kajana et al. corroborate our findings. Zhen et al. highlighted the prognostic relevance of m7G-related genes in low-grade glioma (LGG), with particular emphasis on the association of STXBP1 with macrophage M2 in LGG patients [24]. Similarly, Kajana et al. observed enriched STXBP1 levels in extracellular vesicles (EVs) from the cerebrospinal fluid (CSF) of pediatric glioma patients, suggesting its potential as a malignancy marker and implicating its role in glioma pathogenesis and prognosis [25]. These studies collectively support the pivotal role of STXBP1 in glioma progression. In conclusion, our findings contribute to a deeper understanding of glioma biology and emphasize the significance of STXBP1 as a potential therapeutic objective and prognostic indicator in glioma management.
Cell apoptosis, also known as programmed cell death, is a crucial mechanism for maintaining tissue homeostasis and eliminating damaged or aberrant cells [26]. It includes a series of biochemical processes leading to DNA fragmentation, chromatin condensation, cell shrinkage, and cell death [27]. Proteins such as CDK-1, cyclin B1, and cyclin A2 are crucial regulators of the cell cycle and apoptosis. Aberrant expression or activity of these proteins can influence apoptotic pathways, either promoting or inhibiting cell death depending on the cellular context and signaling pathways involved. For instance, Yang et al. found that Rab3a enhances neuronal cell-derived EV secretion by interacting with STXBP1, inhibiting M1 macrophage polarization, and reducing neuronal apoptosis, thus aiding spinal cord injury repair [28]. Lv et al. observed increased DNA methylation in neurons during hypoxia, activating apoptotic signaling pathways [29]. Hypermethylated STXBP1 suggests its involvement in regulating neuronal death, suggesting that it might be employed as a therapeutic target for ischemia-reperfusion injury-induced neuronal damage. Bhawe et al. demonstrated that high NRF1 activity in astrocytoma correlates with cancer aggressiveness and poor prognosis in GBM [30]. Decreased STXBP1 expression predicts GBM malignancy in high NRF1 expression, underscoring the role of STXBP1 in GBM progression and suggesting NRF1 as a therapeutic target. Our findings align with these studies, revealing that knocking down STXBP1 enhances the migration, proliferation, and invasion capabilities of glioma cells. Additionally, STXBP1 knockdown disrupts glioma cell cycle distribution and inhibits apoptosis, highlighting its significant impact on glioma progression. Overall, these findings emphasize the multifaceted role of STXBP1 in glioma biology, influencing cell cycle regulation, apoptosis, and cellular behaviors critical to tumor progression.
Ferroptosis is a controlled type of cellular demise typified by lipid peroxidation that is dependent on iron, leading to the aggregation of lipid hydroperoxides and subsequent cell membrane damage [31]. Zuo et al. demonstrated the prognostic significance of genes linked to ferroptosis signatures in glioma, employing a deep learning network trained with multiparametric MRI data [32]. This study highlighted the potential for novel therapeutic strategies and prognosis assessment. Zhuo et al. identified distinct expression profiles of ferroptosis-related genes in glioma, categorizing them into subgroups and developing a 25-gene risk signature correlated with clinical characteristics, serving as a prognostic signal [33]. GPX4, a key enzyme in this process, detoxifies lipid hydroperoxides, defending against oxidative damage and stopping ferroptosis in cells [34]. Additionally, the peroxidation of lipid products such as 12-HETE and 15-HETE is associated with ferroptosis, which contributes to oxidative stress and promotes cell membrane damage [35]. LDH release is another critical marker, indicating cell membrane integrity and damage, which is often associated with cytotoxicity and cell death. Our findings indicate that ferroptosis inducers (erastin and sorafenib) increase cytotoxicity in glioma cells, whereas inhibitors of ferroptosis (U0126 and ferrostatin-1) provide a protective effect. Additionally, knocking down STXBP1 in glioma cells inhibits ferroptosis, enhancing cell viability and mitigating cytotoxic effects. To sum up, our research demonstrates the critical function of ferroptosis regulation in glioma cell survival, with STXBP1 playing a significant modulatory role. Targeting ferroptosis pathways and modulating STXBP1 expression may offer novel therapeutic strategies for glioma treatment.
However, the use of ferroptosis activators can induce the release of LDH, which indicates cell necrosis and can lead to inflammatory reactions, thereby affecting the survival of normal cells. To avoid necrosis and inflammation in normal cells when using ferroptosis activators, recent studies have explored various strategies: (1) Targeted delivery: using antibody or nanoparticle conjugates to selectively deliver activators to cancer cells, thereby reducing systemic toxicity [36, 37]. (2) Dual inhibitors: As identified by the research team at Tongji University, compounds such as KW-2449 can act as dual inhibitors of both ferroptosis and necroptosis. KW-2449 targets the autophagy pathway, specifically inhibiting ULK1 kinase activity, which in turn prevents ferroptosis. This suggests that by modulating autophagy, it may be possible to control ferroptosis in a way that minimizes damage to normal cells [38]. (3) Temporal control: controlled release to induce ferroptosis without overwhelming normal cells [39, 40]. (4) Cell-type specific modulators: Identifying and exploiting cell-type specific differences in the ferroptosis pathway could also be beneficial. For example, if certain enzymes or proteins involved in ferroptosis are differentially expressed in cancer cells compared to normal cells, then inhibitors or activators that target these specific components could be used to selectively induce ferroptosis in the cancer cells [40]. In conclusion, while the use of ferroptosis activators holds great promise for cancer therapy, it is crucial to develop strategies that minimize their impact on normal cells. The approaches outlined above, based on current research findings, offer potential solutions to this challenge. Further research is needed to optimize these strategies and to better understand the complex interplay between ferroptosis, necrosis, and inflammation.
The biological process known as the epithelial-mesenchymal transition (EMT) occurs when epithelial cells shift molecularly to take on the characteristics of mesenchymal cells [41]. This transition enables cells to acquire migratory and invasive properties. E-cadherin, a cell adhesion molecule, is downregulated during EMT, leading to loss of cell-cell adhesion [42]. Conversely, N-cadherin, another adhesion molecule, is upregulated, promoting cell migration and invasion [43]. Vimentin, an intermediate filament protein, increases during EMT, enhancing cell motility and cytoskeletal remodeling [44]. Together, these changes facilitate the transformation of epithelial cells into a mesenchymal state, promoting tumor metastasis and progression. Zou discovered that JMJD3 stimulates glioma cell migration by inducing EMT through the CXCL12/CXCR4 axis, highlighting its potential as a therapeutic target [45]. Additionally, Zou found that DYT-40 inhibits AEG-1 and NF-κB pathways, suppressing EMT and invasion in glioblastoma while inducing apoptosis via the mitochondrial pathway [46]. Furthermore, another study by Zou revealed that AEG-1-induced autophagy enhances glioma cell susceptibility to TGF-β1-induced EMT, promoting tumor progression [47]. Inhibition of autophagy suppresses EMT, suggesting a complex interplay between AEG-1, autophagy, and EMT in glioblastoma progression. Our study found that 1 μM ferrostatin-1 treatment induced a significant decrease in N-cadherin and vimentin expression and an increase in E-cadherin expression in glioma cells. In contrast, the addition of si-STXBP1 -1 reversed these changes. CCK-8 and transwell test results were the same. Treatment with 1 μM ferrostatin-1 improved glioma cells’ viability, invasion, and migration capabilities, while adding si-STXBP1 -1 further enhanced these cell functions. This highlights the potential therapeutic value of targeting EMT-related pathways and the ferroptosis regulator (STXBP1) in glioma treatment.
While our study provides valuable insights into the role of STXBP1 in glioma progression through in vitro experiments and bioinformatics analysis, there are several limitations that need to be addressed. One significant limitation is the absence of in vivo tumor graft experiments. These experiments are crucial for validating the findings from in vitro studies and assessing the potential therapeutic effects of targeting STXBP1 in a more physiologically relevant context. The lack of such experiments limits the extent to which we can extrapolate our findings to clinical settings. In future work, we plan to conduct in vivo tumor graft experiments using glioma cell lines with STXBP1 knockdown to investigate the impact on tumor growth, invasion, and overall survival in animal models. These experiments will provide a more comprehensive understanding of the role of STXBP1 in glioma progression and help validate its potential as a therapeutic target.
In conclusion, our study identified distinct DEGs associated with glioma progression and prognosis, highlighting their potential as prognostic indicators and therapeutic targets. Additionally, the identification and assessment of characteristic genes, including the hub gene STXBP1, provided valuable insights into glioma biology and progression. Knockdown of STXBP1 significantly enhanced glioma cell invasion, migration, and proliferation, affecting apoptosis and cell cycle distribution. Furthermore, our findings elucidated the role of ferroptosis in glioma cell viability, with sorafenib and erastin inducing ferroptosis and reducing cell viability, while ferrostatin-1 and U0126 inhibited ferroptosis and increased cell viability. Notably, the knockdown of STXBP1 inhibited ferroptosis and regulated EMT-related proteins, further emphasizing its pivotal role in glioma progression. Overall, our study sheds light on the complex interplay between STXBP1, ferroptosis, and EMT in glioma pathogenesis, suggesting potential therapeutic strategies targeting these pathways for improved glioma treatment outcomes.